1. Introduction
The systematic increase in energy demand observable at the global level [
1,
2,
3], combined with more and more widespread discussion and initiatives to counteract the negative effects of climate change, has created favourable conditions for a transformation towards sustainable, low-emission energy systems.
Over the last few years, several studies have been developed to deal with changes in the energy industry. One of the most interesting that increases the awareness of the inevitability of these changes is the works of Falcon et al. [
4] describing the most effective mix for energy transition in the biofuel industry. Another important work is the one by Owen et al. [
5], taking up the subject of the finance gap for the energy sector transition. In turn, Tombs [
6] in his work presents a discussion concerning the vision of the energy sector in the future.
This challenge is particularly important in countries like Poland, whose economy—and, in particular, the fuel-energy sector—is based on solid, fossil primary energy carriers such as coal and lignite. The European context seems particularly important due to the European Commission’s consequent and active decarbonisation policy. One of the solutions that can help in the transformation of the electricity and heat generation sectors in particular countries is the cogeneration systems based on gas turbines [
7,
8]. They are an alternative to both conventional power plants and coal-fired CHP plants. In Poland, the development of and increase in the use of cogeneration has been mentioned as one of the strategic directions of the energy policy [
9]. The support of combined electricity and heat generation is also a priority of the European Union [
10,
11], which, in addition to actions aimed at eliminating the generation units that do not meet certain emission standards (Directive on industrial emissions and BAT conclusions), works indirectly through directives supporting the increase in electric efficiency (Directive 2012/27/EU [
12]) and promotion of high-efficiency cogeneration (Directive 2004/8/EC [
13]).
The development of highly efficient cogeneration by replacing the currently operating systems using relatively cheap coal fuels requires appropriate support from individual member-state governments, who are obliged to implement both the European Union’s policies and directives. However, for the aforementioned changes to take place, the proposed solutions must take a tangible, financial form [
14].
The support might take various forms, one of them being the so-called feed-in tariffs, often used for renewable technologies and described in more detail by Couture et al. [
15,
16] and Kemausuor et al. [
17]. The capacity market has the ability to support both new and already existing units [
18,
19,
20]. Tax exemptions in both the investment period and operating period are described by Galinato and Yoder [
21]—the authors focus on the impact of such actions on the reduction of the volume of greenhouse gases. Tax incentives have also been described by Pablo-Romero [
22] in a work researching the influence of support on the development of the solar energy market in Spain. By analysing both literature and legislation of individual countries, one is able to encounter numerous mechanisms of direct support paid to producers on both national and local levels. Such solutions are based on, i.e., the trade in property rights (certificates) attesting to the production of energy by means of a supported technology—in units using renewable energy sources, in cogeneration units—or attesting to the achieved energy savings. On the one hand, this allows the owners of these units to generate additional income; on the other hand, if the existing regulations require the energy companies to present a certain volume of energy produced by means of supported technologies, additional costs may be generated, resulting from the need to purchase certain property rights in the event of non-compliance with the imposed limits. These and previously mentioned solutions have been described extensively in the works of Abolhosseini and Heshmati [
23], Sousa and Martins [
24] and Yang et al. [
25].
The influence of various support mechanisms on the planned development of modern power-generation technologies has been analysed in the works of Jung and Feng [
26]. The subject has also been taken up by Erdogdu [
27], who analysed the relationship between governmental support and energy market reforms in 27 countries.
The abovementioned works show how much potential there is in improving the implemented policy and applying certain support instruments. This potential, when it comes to promoting modern energy generation technologies, was well presented in the works of Huijben et al. [
28]. They described the governmental mechanisms of supporting photovoltaic energy. Thanks to their implementation, Belgium has become one of the European leaders in terms of the use of this type of energy source. This example shows that, thanks to the appropriately selected support mechanisms, it is possible to achieve the country’s strategic goals. However, none of the encountered works dealt with the subject of comparison and choice between different support systems.
The main goal and, at the same time, an important contribution of this article to the discourse and its novelty is the analysis and comparison of the two governmental support mechanisms that can potentially be used by the owners of large cogeneration gas units in Poland: (
i) the capacity market (a market mechanism enabling payment reception for new and existing generating units, including RES (Renewable Energy Sources), as well as DSR (Demand Side Response), in exchange for the readiness to provide power services) [
29] and (
ii) promoting high-efficiency cogeneration electricity in the form of an individual cogeneration premium. These mechanisms, allowing to gain additional income—outside the electricity, heat and system services market–have been analysed in terms of both implementing the goal of maximising possible profits as well as the risk factors related to the implementation of obligations resulting from each of the mechanisms. The support system analysis was carried out on the example of a company considering the construction of a cogeneration gas-fired unit. The planned investment actions include constructing a new generation unit that would include a gas turbine with the power of 90 MWe and a heat recovery steam boiler with the total capacity of 200 MWt. The described cogeneration, natural-gas-powered unit will produce useful heat supplied to the public heating network, while the unit CO
2 emission performance standard will be below the threshold of 450 kg/MWh.
The contribution of this publication to the ongoing discussions about the support mechanisms is not only to choose the best solutions for current conditions but also to compare the functioning and mutual interaction of the mechanisms in question. Such analyses allow us to identify the disadvantages of particular solutions, which, at the end of the day, helps to create a better and more coherent support policy. In this context, our work also contributes to the ongoing discussion on green financing [
30]. Supporting investments in low- or zero-emission high-efficiency cogeneration technologies (natural gas can be considered as a transition fuel) can help transform the energy sector and decarbonise the whole economy, contributing to the achievement of the EU environmental policy objectives, including climate neutrality. However, the existing regulatory barriers (as shown in our work) may reduce the effectiveness of the support system and cause the advantages of one solution over others. In addition, the conclusions of such an analysis can be applied in other countries and regions that are currently considering the choice of a support system for CHP units.
The article is structured as follows. The first part describes both support systems and their legal conditions (
Section 1) as well as the methodology adopted for their evaluation (
Section 2). The assessment results are then presented for the basic assumptions and for different market scenarios. Then, the borderline levels of economic factors determining the advantage of a given support system are analyzed and discussed (
Section 4). The work is completed with a short summary and conclusions (
Section 5).
2. Materials and Methods
This section presents the characteristics of the analysed support mechanisms, as well as technical and economic assumptions for the cogeneration system under consideration, together with the description of the methodology and comparative analysis of the abovementioned mechanisms.
2.1. Capacity Market
As a result of many years of debate on the selection of the optimal solution to counteract the long-term threats related to the adequacy of generation capacity in the National Power System, in 2017, Poland introduced a centralised capacity market, being one of a number of Capacity Remuneration Mechanisms. The mechanism to secure the required level of available capacity, while providing support for the existing and planned units, is the so-called Dutch auction with a uniform clearing price [
31].
The detailed rules of mechanism participation have been specified in the following regulations:
the Act of 8 December 2017 on the capacity market (hereinafter “CMA”) [
32];
four resolutions on the performance of capacity obligation, security and parameters of particular auctions [
33,
34,
35,
36];
capacity market regulations approved by the decision of the President of the Energy Regulatory Office [
37].
In addition to national regulations, the manner in which units based on fossil fuels function within the capacity mechanisms is regulated by the resolution of the European Parliament and EU Council (EU) 2019/943 dated 5 June 2019 on the internal electricity market (hereinafter “resolution 2019/943”) [
38].
In an auction of this kind, the starting price is gradually reduced to the level wherein the demand and supply lines intersect. The participants may (
i) remain in the auction until it is closed or (
ii) submit one of the declarations concerning their further participation, one of them being the submission of the so-called exit bid—a participant determines the price level, below which they will not wish to become a party to the capacity agreement. There are two types of offeror in every auction [
39]:
price-makers—entities allowed to quit an auction at any moment (new and modernised units and the DSR demand-reduction units);
price-takers—entities allowed to quit an auction upon submission of an exit bid, and only with the price below the price set for the price-takers (existing units).
Functioning of generation units on the two-commodity market (electricity and capacity) through granting the producers extra support imposes new obligations on producers, the implementation of which guarantees the achievement of specific revenues and additional costs (financial penalties). According to CMA, the Capacity Provider, being the owner of a physical unit or authorized to dispose of it in the capacity market, and in the case of being certified for a capacity market unit (further “CMU”) auction, which is then subject to capacity obligation, shall be obliged:
for the capacity market unit to be ready to provide to the system the capacity referred to in the capacity agreement;
to provide electrical capacity to the system during stress events and in the amount of an adjusted capacity obligation.
Performance of the capacity obligation, understood as ensuring the security of supplies to the system, is carried out in the so-called stress events, specified in the current regulations as working days between 7:00 a.m. and 10:00 p.m. Thus, in the extreme case of power shortages in the system, it is possible that a situation will emerge, wherein the Capacity Provider shall be obliged to provide continuous capacity supplies for 15 h for several consecutive days. During the stress event, the Operator may call upon the Capacity Provider to carry out its capacity obligation at the maximum level specified in the capacity agreement.
High-efficiency cogeneration units may participate in the capacity market mechanism on the same terms as power plants, subject to additional rights arising from the nature of the work and environmental benefits of such units. The legislator has foreseen the possibility of concluding a long-term capacity agreement by a new unit (a planned capacity market unit) for 15 yearly supply periods, if the Capacity Supplier incurs a minimum level of net unit investment expenditure related to the available net capacity (hereinafter “CAPEX level”).
Moreover, the Capacity Provider possessing the CMU, being a unit of high-efficiency cogeneration, may prolong the duration of a capacity agreement concluded during an auction by 2 additional years (so-called green bonus), in case the generation unit: (i) keeps the specific carbon dioxide emission factor at the level below or equal 450 kg CO2/MWh of generated electricity, and (ii) at least half of the heat generated in such a unit is transferred to the heat distribution system, with its carrier being hot water.
Since the introduction of CMA up until today (March 2020), four capacity auctions have been carried out for the supply years of 2021–2024. The most important results of these auctions have been presented in
Table 1.
2.2. Individual Cogeneration Premium
In order to create a stable regulatory and economic environment for cogeneration in Poland, on 14 December 2018, by force of the Act on promoting electricity from high-efficiency cogeneration [
40] (hereinafter “uCHP”), a package of support mechanisms diversified depending on the type and unit size which was adopted—replacing the hitherto system of energy certificates. One of the forms of support provided for in the Act is the individual cogeneration premium (hereinafter “ICP”), which may be applied for by the entities planning to invest in new high-efficiency cogeneration units with installed net electric capacity of no less than 50 MWe.
The basic requirements concerning conditions to be fulfilled by a new unit to apply for the above support include:
the need to obtain a promise of concession (or a promise of a concession change) to generate electricity, along with positive verification of a financial gap (the so-called “incentive effect”)—such an analysis is carried out using the assumptions made by Energy Regulatory Office (ERO), which will be presented in the course of this article;
the need to introduce the generated useful heat to the public heating network—the volume of energy covered by support in a given accounting period shall depend on the percentage share of the produced heat introduced to the network;
CO2 emission at the level not higher than 450 kg CO2/MWh of generated energy (electricity and heat);
installation, in the unit, of devices manufactured within 60 months before the onset of electricity generation;
construction of the unit within 48 months from the enrolment decision;
compliance with technical requirements enabling the electricity generated by the unit to be qualified as high-efficiency cogeneration;
inability to make an investment decision (understood as commencing construction works or making binding commitments, causing the investment to become irreversible) on the construction of a unit before the enrolment decision.
In order to obtain support in the form of ICP, it is necessary to submit a given unit to participate in the selection process, wherein the President of the Energy Regulatory Office (hereinafter “PERO”) determines the level of acceptable support individually for each unit. Due to the fact that an auction is not the form of determining the level of support for the construction of a new unit with an electric capacity over 50 MWe (as on the capacity market), PERO is, each time, required to examine the so-called “incentive effect” in the course of the previous procedure to grant the concession promise. This examination is performed by means of filling in the ERO-made form of technical and economic description of a planned investment and allows us to resolve the fundamental—taking into consideration granting public support—issue of the dependence of an investment implementation on the potentially granted support mechanism. In practice, what is assessed is the existence of the so-called “financial gap” of the planned investment—if the net present value (NPV) of the enterprise calculated in the form is higher than zero, it means that the investment does not require support to be carried out. Only obtaining a negative NPV in the course of the assessment procedure for the incentive effect carried out by PERO allows participation in the subsequent stages of the ICP selection process.
After submitting a filled-out form, PERO determines the level of support for each new unit in the amount required for their proper operation and reimbursement of investment costs. According to the resolution issued by uCHP, the individual cogeneration premium expressed in Polish Zlotys per 1 MWh of electricity is “(…) calculated for a 15-year period of support and corresponds to the average discounted cost of electricity and heat generation in the entire life cycle of a given unit, decreased by the projected discounted revenue of this unit” [
41].
where
k—support period of 15 years;
n—cost averaging period (economic lifetime of the project);
NIt—investment outlays in year t;
KOt—operating costs (excl. fuel) in year t;
KPt—fuel costs in year t;
Pt—revenue in year t;
Et—electricity production in year t;
r—discount rate assumed by ERO;
t—year.
The obtained ICP (1) is available to cogeneration units (for electricity produced and sold) in the subsequent 15 years after the selection process decision, with its maximum level being approximately 34.88 €/MWh (which results from the resolution of the Minister competent for energy). Thus, in order to get support in the scope projected at the investment stage, it is required to actually produce and sell the assumed volume of electricity. The constant ICP value obtained in the selection process is annually indexed by means of the consumer price index (CPI).
2.3. Assumptions of Comparative Analysis
In this section, we present in detail the methodology used to assess the economic efficiency with the use of the analysis of discounted cash flows. Moreover, we will also present the key data and assumptions made for the calculations.
In the following analyses, the key methods of assessing economic effectiveness were used [
42]. The net present value approach, although very popular, has also disadvantages. We can mention, among others [
43]:
difficulty with choosing a discount rate;
problems with estimating cash flow;
NPV mostly ignores future tax breaks;
problems with the inflation forecast.
Moreover, the net present value method is a static method, which is inflexible, so it is difficult to adapt to changes in the environment [
44].
The authors are aware of these shortcomings, but the aim of the analysis is not to evaluate this methodology but to use it comprehensively to analyse the mentioned support systems. The basic rule for the analysis of discounted cash flow (DCF) is to correlate the amount of expected future profits with the amount of initial cash investment required to purchase the tangible assets or to start commercial production. Its aim is to simulate all cash flows anticipated for the full period of project implementation [
45].
In the subject analysis, a method was used based on the construction of a model of discounted cash flows FCFF (free cash-flow to firm)—cash flows attributable to equity capital owners and creditors:
where
FCFt—free cash flow in year t;
CFt—cash flow in year t (excl. capital expenditure and residual values);
It—investment outlays in year t;
AT—residual value in year T;
r—weighted average cost of capital (discount rate);
T—total number of years, required for the implementation of project.
In this model (3), the cash flows attributable to all parties financing the enterprise are discounted with a discount rate which is the weighted average cost of capital (WACC).
For the sake of analysis, two types of weighted average cost of capital were adopted (
Table 2). The first one represents the market value and was delivered by the investor, while the other one was established by the Energy Regulatory Office (ERO) and is used to assess the “incentive effect” at the stage of application for a concession promise. It is worth mentioning that the individual cogeneration premium (ICP) is calculated for the abovementioned minimum return level, i.e., in accordance with ERO’s assumptions—4.96%. So, in the assessed case, the difference between these capital costs works to the investors’ disadvantage.
The basic indicator, with regard to the presented analysis, has been the levelized cost of electricity (LCOE):
where
LCOE—levelized unit cost of electricity;
n—period of cost averaging (economic lifetime of the project);
NIt—investment outlays (capex) in year t;
KOt—cost of operation (excluding fuel cost) in year t;
KPt—cost of fuel in year t;
E—Energy production in year t;
r—discount rate;
t—year.
Currently, LCOE is the standard when it comes to the assessment and comparability of power technologies, expressing the cost of produced electricity as the value of electricity, which, throughout the entire operating period of a given technology (investment and operating phases), guarantees covering the costs of operating activities, investment outlays, costs of debt management and the required return for the investors [
46,
47,
48,
49].
The price assumptions for which the comparative analysis of the support systems was carried out were adopted in accordance with the current ERO form, which had been drawn up for the sake of the “incentive effect” assessment at the stage of submitting the application for a concession promise. The prices are presented in
Table 3 and, according to ERO’s assumptions, are fixed throughout the entire analysis period.
Regarding the aim of the analysis—the comparison of two support mechanisms—such an assumption seems the best solution, because ICP is calculated with the aforementioned assumptions; on the other hand, however, their use for the sake of the capacity market analyses creates a mutual point of reference.
For the sake of comparison of the two analyzed support mechanisms, a number of assumptions have been adopted concerning reconstruction of a coal CHP plant with the use of a gas turbine with a power of 90 MWe together with a heat recovery steam boiler with a total power of 200 MWt. Detailed data for the planned installation, as well as the values of investment costs and their distribution in time, are presented in
Table 4.
The revenue side of the investment projects in question includes two main revenue positions, the revenue from the sale of electricity and the revenue from the sale of heat.
The cost side includes positions comprising yearly costs of functioning of the analysed enterprises, including costs of operation and maintenance—basic elements of these costs being the costs of fuel and energy, costs of emission, maintenance and repairs. The assumptions adopted to determine the above items are presented in
Table 5.
Moreover,
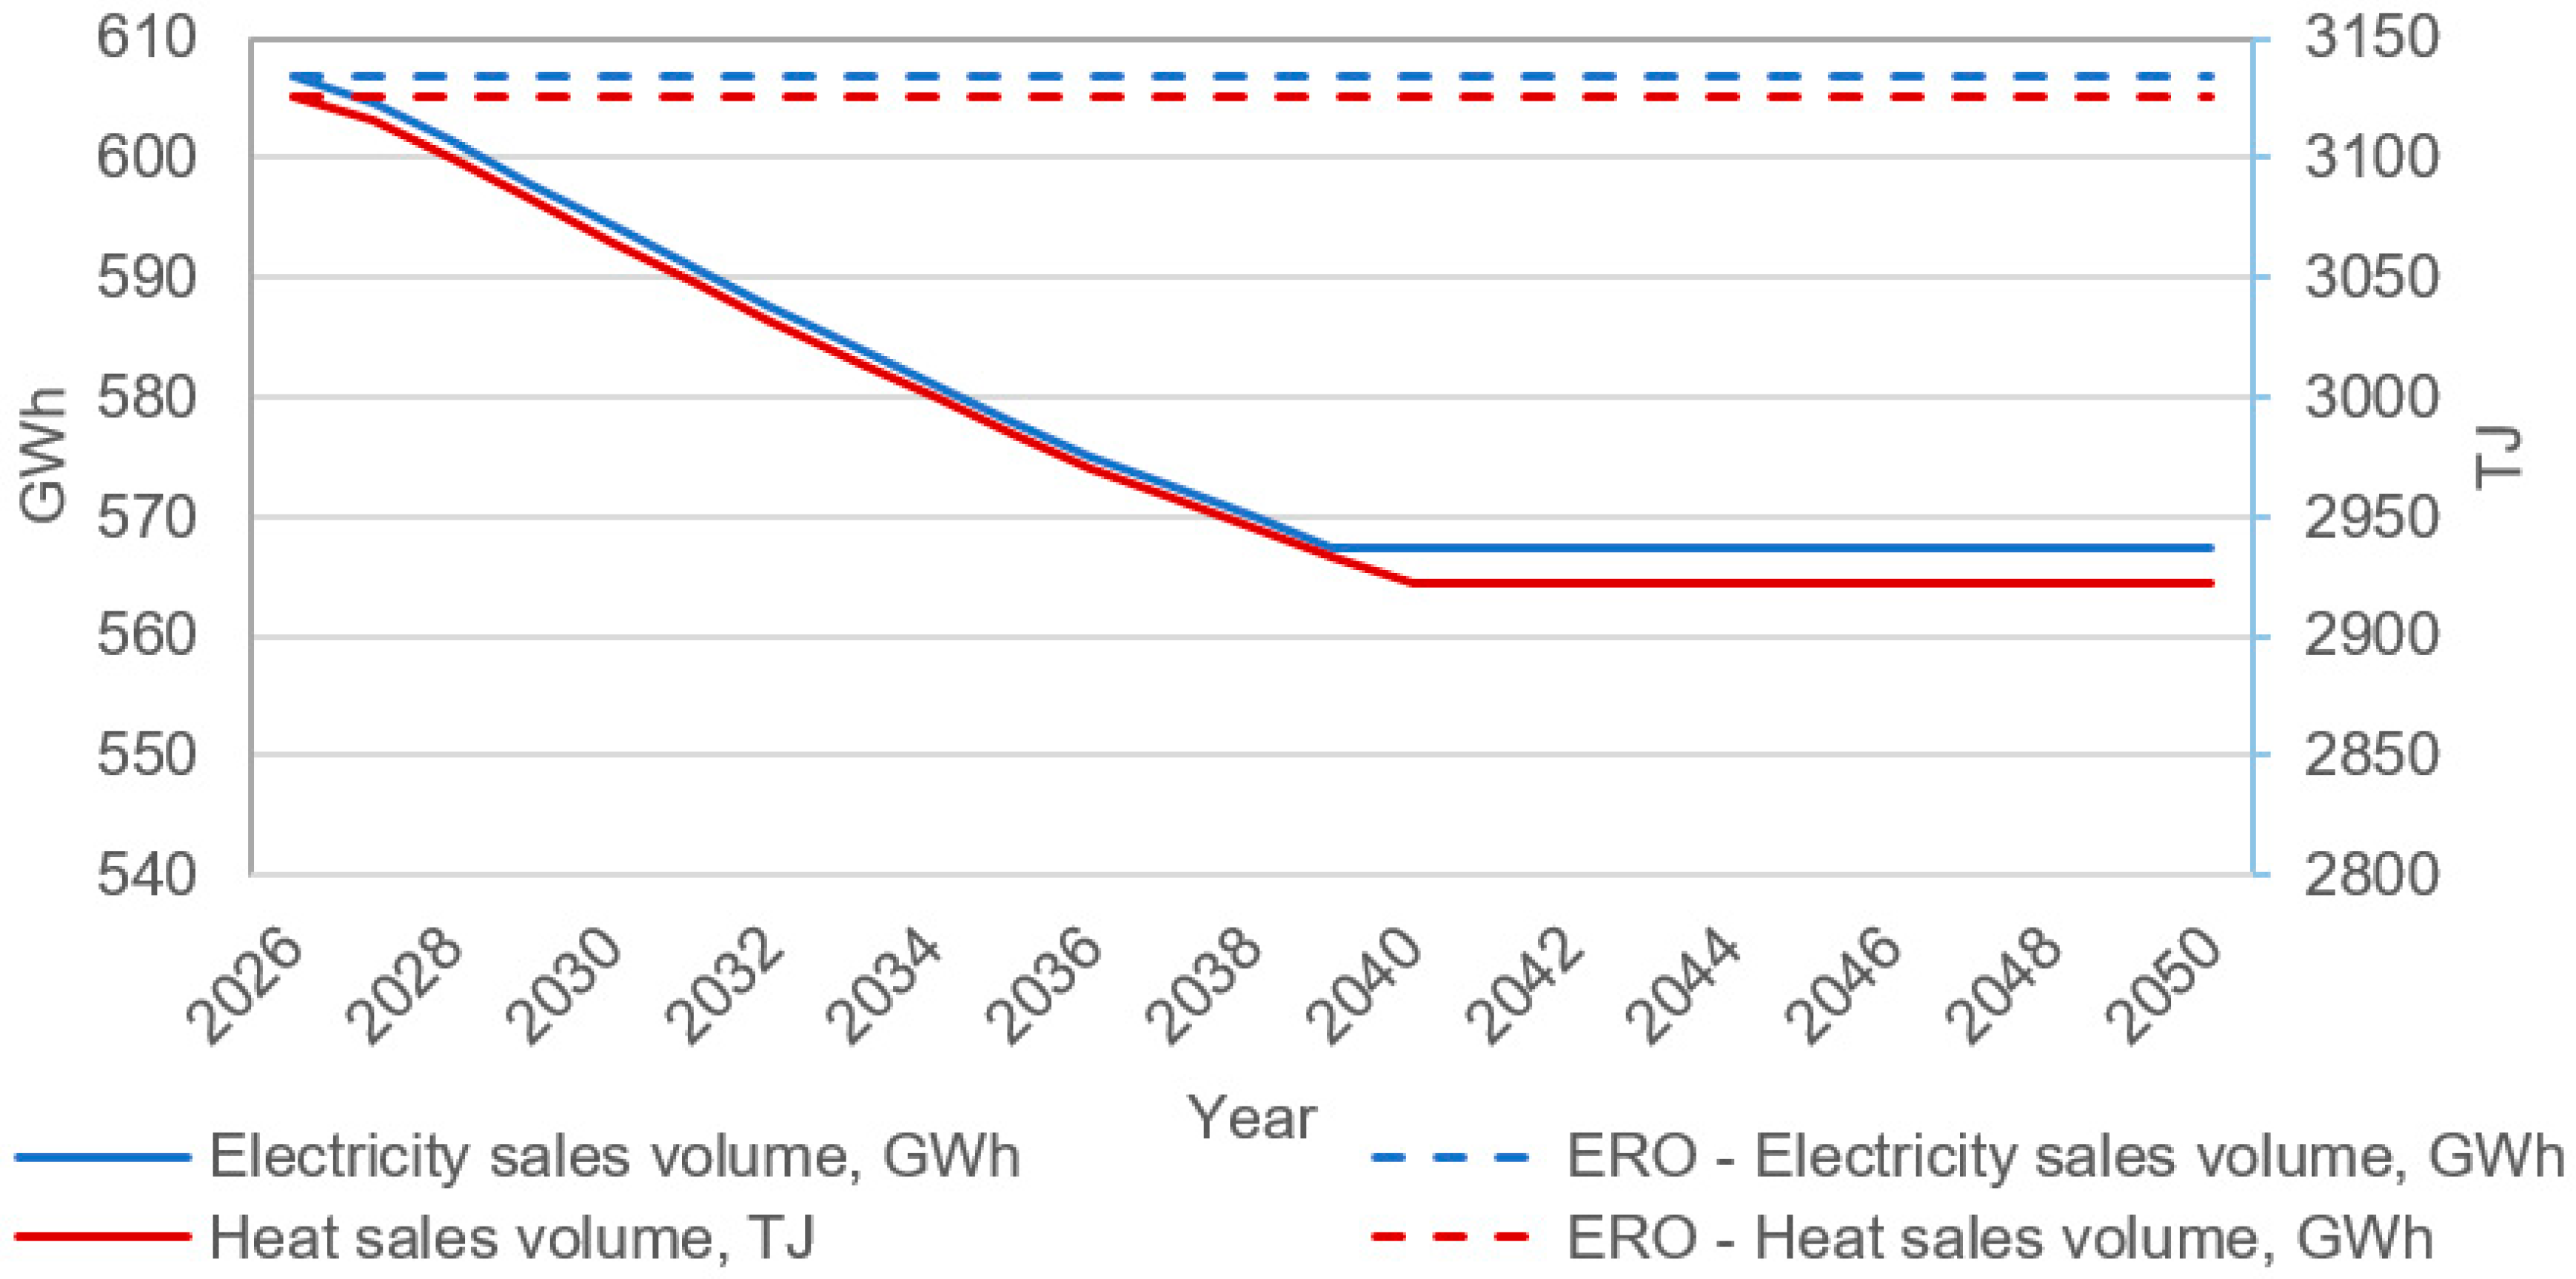
Figure 1 presents the production and sales volumes of electricity and heat, in accordance with the long-term production plans/projections. As can be seen, in the analysed period, an approximate 6.5% decrease in electricity and gas production volumes was assumed, which also had an impact on the reduction of the amount of natural gas consumption and in the level of carbon dioxide emission, to a similar extent. Attention should be paid to the differences between the actual energy sales volumes and the fixed levels of those parameters assumed by ERO—in accordance with the discussed assumptions—at the stage of assessment of the existing financial gap (the incentive effect).
3. Results
This section is divided into two parts. The first one presents the results of comparison of the two aforementioned support mechanisms, taking into account the technical and economic assumptions presented above. The second part presents the results of the scenario analysis for the fluctuating electricity price assumed by the regulator to establish the ICP and the future changes in electricity market prices.
3.1. Results for the Basic Assumptions
The calculation results for the key economic efficiency ratios for the scenario, including revenues from participation in the capacity market, as well as the individual cogeneration premium, are presented in
Table 6.
In the analysed option without support, the internal rate of return on investment is IRR (FCFF) = 9.14%, while the discounted value of cashflows—with a discount rate of 5.56—NPV (FCFF) = €23 million. The variant taking into account the capacity market support at the level of 55.82 €/kW presents the more favourable results. In this case, the internal return rate on investment is IRR (FCFF) = 14.70, and the discounted value of cashflows—with a discount rate of 5.56%—NPV (FCFF) = €63.24 million.
The LCOE (formula 4) value at the level of 49.15 €/MWh means that the average market prices in the investigated period would have to fall below this level in order for the project in question to cease to be profitable. The value is as much as 6 €/MWh lower than the bottom price for the no-support option.
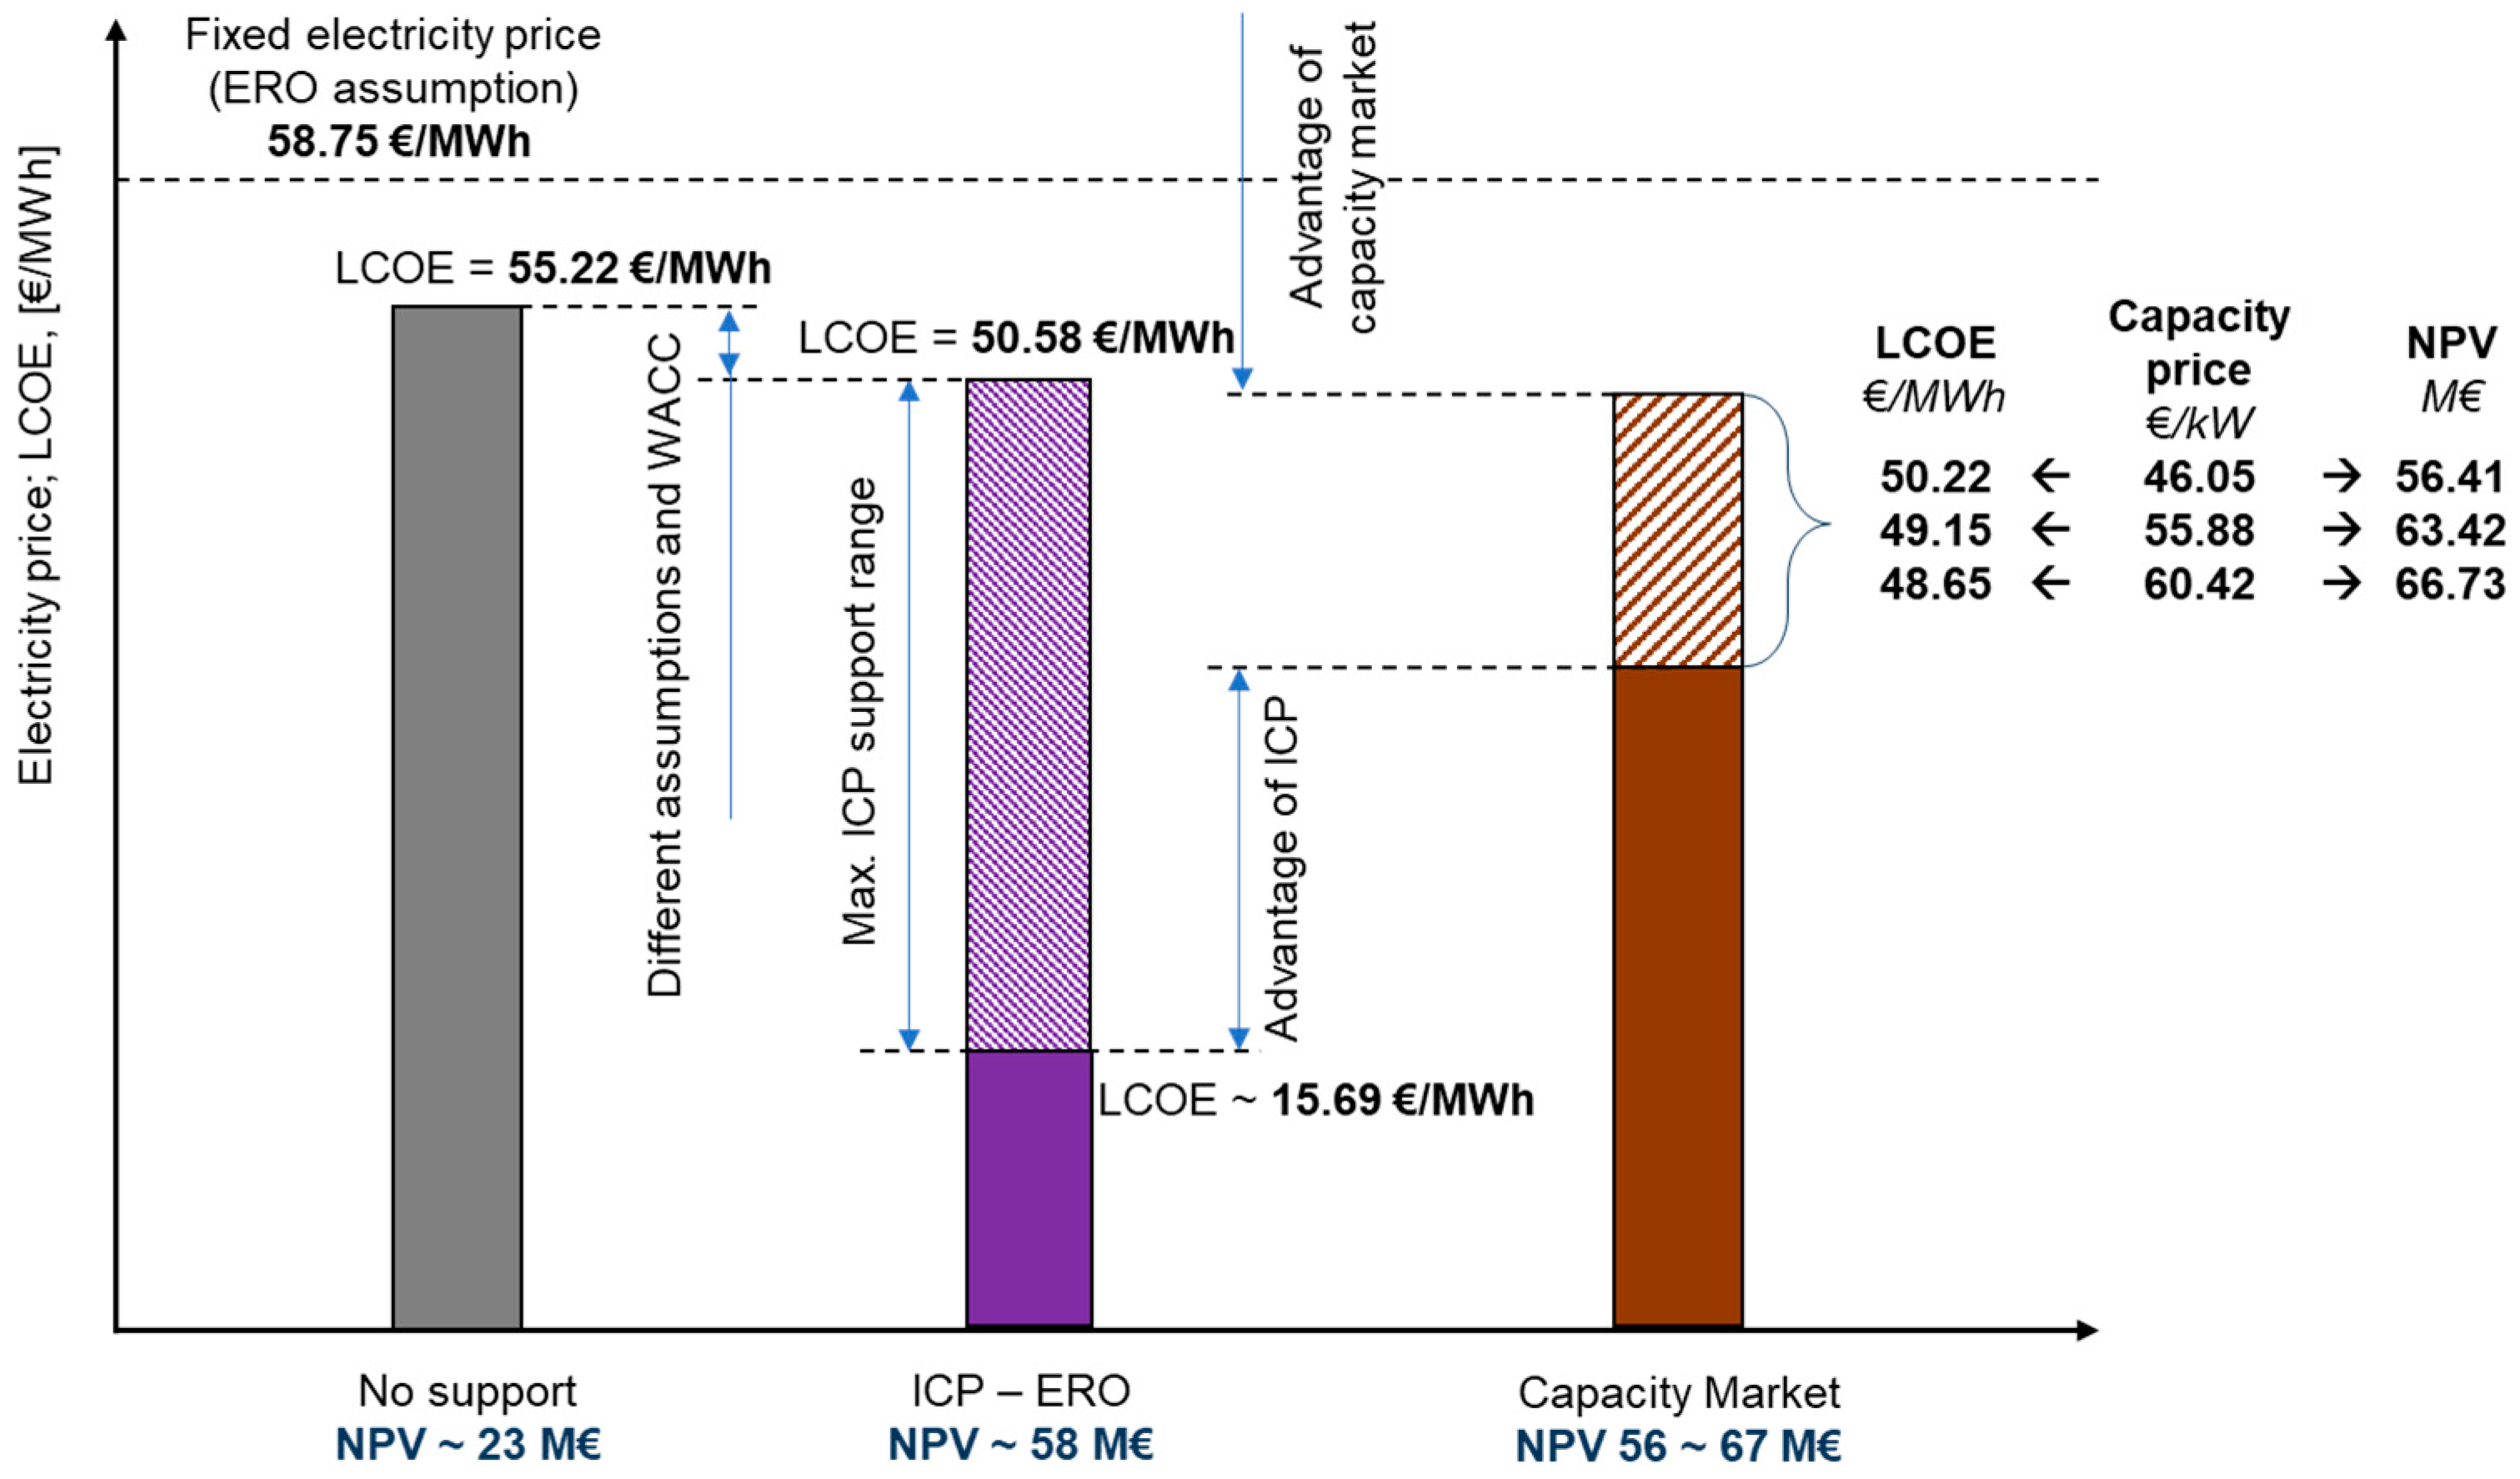
Due to the positive NPV calculated for the sake of ERO’s assessment of the “incentive effect” (at the level of €58 million), the analysed project is not entitled to the individual cogeneration premium (ICP). It should be noted that the NPV is calculated with the “minimum capital cost” assumed by ERO, with a fixed level of production, and importantly, without taking into account the replacement expenditure, thus the differences between the abovementioned ratio and the NPV value without support. The border level of an average market price below which, according to ERO’s assumptions (used at the stage of assessment of the “incentive effect”), should reduce the electricity prices in order for the entity to apply for support in the form of ICP for the analysed project equals the estimated LCOE and is 50.58 €/MWh. The LCOE ratio, estimated for the same pricing assumptions, but of the cost of capital assumed by the investor and the real production and sales energy volumes, is higher and amounts to 55.22 €/MWh.
Detailed relation between the analysed support systems and the lack of thereof, and the ERO-assumed, fixed electricity price at the level of 58.75 €/MWh, are presented in
Figure 2.
In the case of the variant without any support (grey bar), the determined LCOE rate is 55.22 €/MWh, which means that the assumed electricity price—the dashed line—would have to fall below this level for the project to cease to be profitable. Due to the inability to apply for ICP, the revenues in this mechanism would be zero, and thus the results should be the same as in the no-support scenario. However, during the previous analysis it was decided to include the calculations (purple bar) made for the cost of capital and the fixed volumes of energy production and sales, assumed by ERO in the assessment of the financial gap. According to these assumptions, the electricity price would have to be below 50.58 €/MWh (estimated LCOE level) for the investment to cease to be profitable (which would mean the possibility to participate in the ICP selection process). In this situation, the ICP would be tenable up to the price level of approximately 15.69 €/MWh (which results from the maximum allowable support at the level of 34.88 €/MWh)—the dashed area of the chart.
An important issue with this support mechanism is also the fact that the aim of granting the ICP is to zero the NPV established under ERO assumptions. This means that the ICP may “increase” the too low electricity price, but only to the level of 50.58 €/MWh and not to the required amount of 55.22 €/MWh.
In the case of receiving support from the capacity market (brown bar), calculations were made for three historical price levels in the capacity market. It should be noted that the calculated LCOE falls between 50.22 and 48.65 €/MWh in the scope of prices corresponding to the minimum (46.05 €/MWh) and maximum (60.42 €/MWh) capacity auction clearing prices in the already carried out capacity auctions.
As may be noted, the LCOE values for the capacity market constitute limits for the absolute advantage of this form of support over ICP. At the same time, market prices below this level (from the perspective of cost analysis) make up for the advantage of ICP. Yet, as it will be presented further on in this work, this advantage carries a high risk within itself.
3.2. Results of the Scenario Analysis
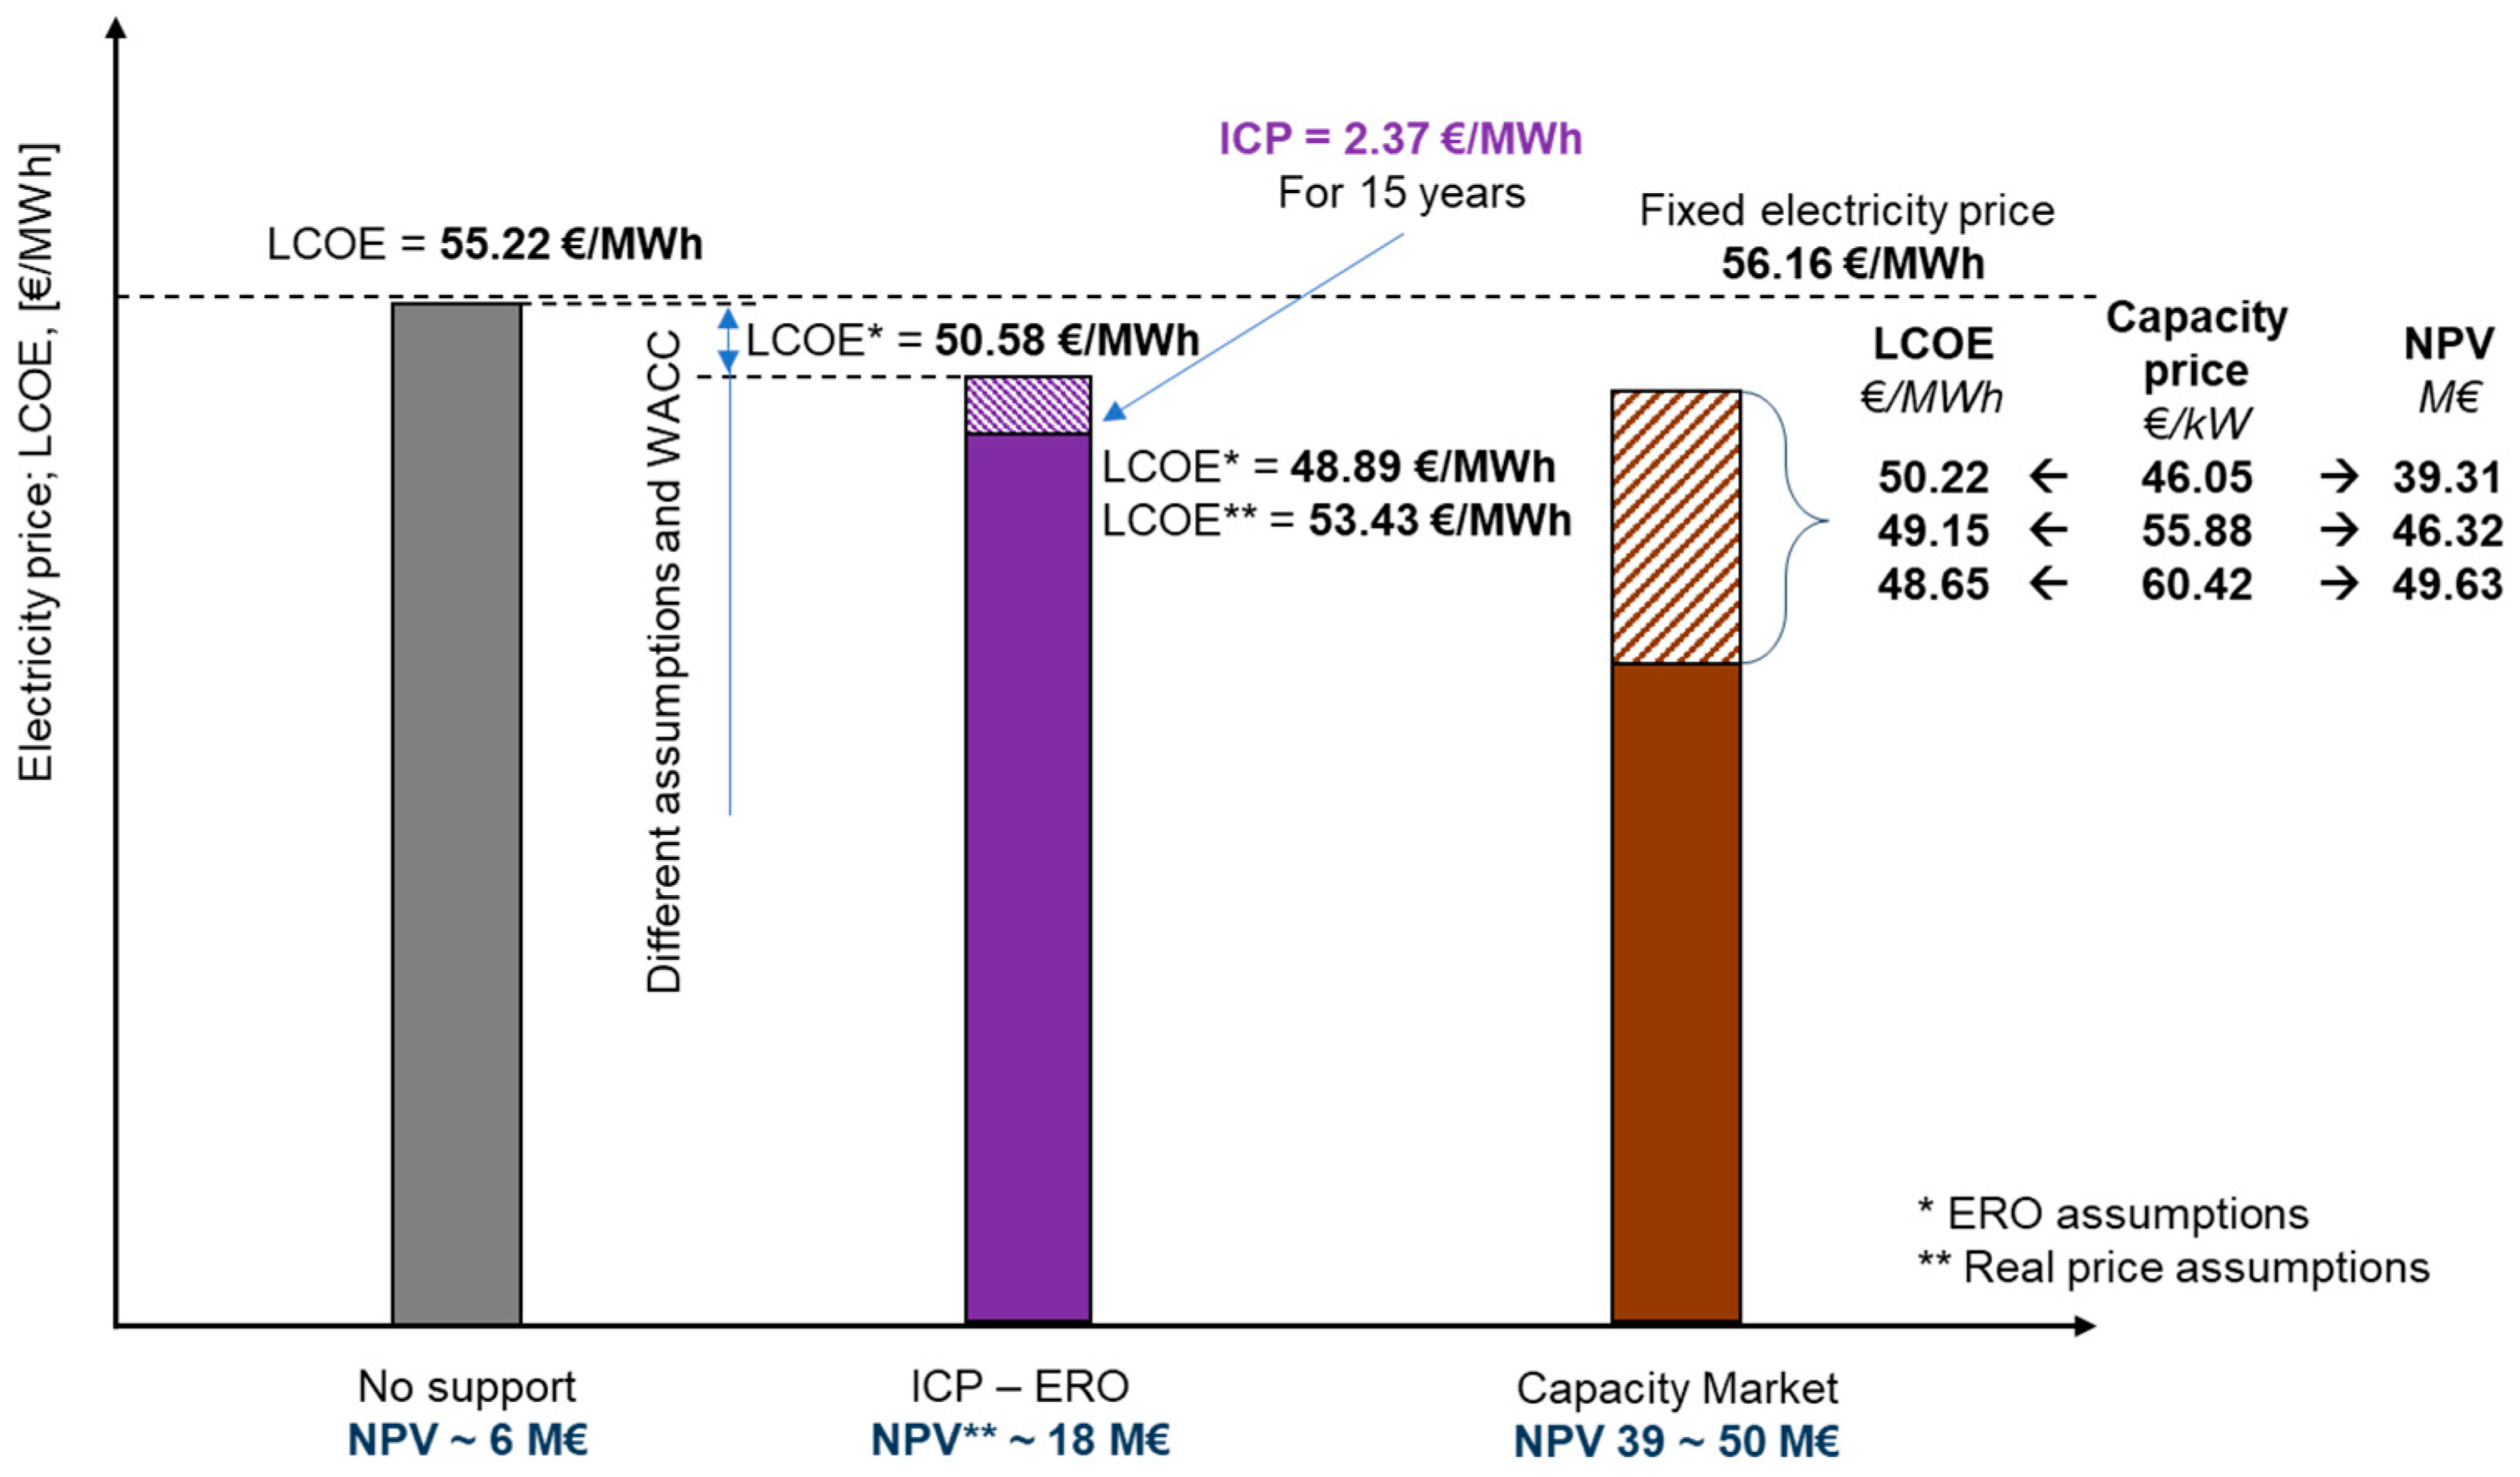
One of the key high-risk factors in the case of cogeneration support in the form of individual cogeneration premium is the discrepancy in the scope of prices assumed to establish the ICP and the real prices of electricity in the future. To assess this relation, the following assumptions were made:
The price of electricity taken by ERO to calculate the ICP amounts to 48.84 €/MWh—it is a level below the one determined by LCOE (50.58 €/MWh) for ERO assumptions, which entitles it to be granted ICP (one must bear in mind that the prices adopted by ERO stem from the market situation; hence, assuming such a low price would have to be purposeful or otherwise mean significant price drops in the market in the years to come).
Based on the above assumption, an ICP (formula 1) is calculated, which amounts to 2.37 €/MWh.
In such conditions, the changes in market electricity prices have been assumed as:
- ∘
+15% compared to ERO assumptions—the price rises to 56.16 €/MWh;
- ∘
−15% compared to ERO assumptions—the price falls to 41.51 €/MWh.
The analysis results are presented accordingly in
Figure 3 (for the 15% price increase) and in
Figure 4 (for the 15% price reduction).
The analysis of the obtained results shows that the 15% increase compared to the ICP calculation allows for achieving a positive NPV at the level of €18 million (the purple bar in
Figure 3), which constitutes a much better result when compared with the no-support scenario (NPV= €6 million—the grey bar). It comes from the fact that the market electricity prices allow for charging “double margins” on each kWh of sold energy, i.e., both from the capacity market and the ICP. Despite such a privileged situation, it is not the best solution, because in the same conditions, with revenue drawn from the capacity market (the brown bar in
Figure 3), it is possible to reach the NPV value amounting to €50 million (for the price of € 60.42/kW).
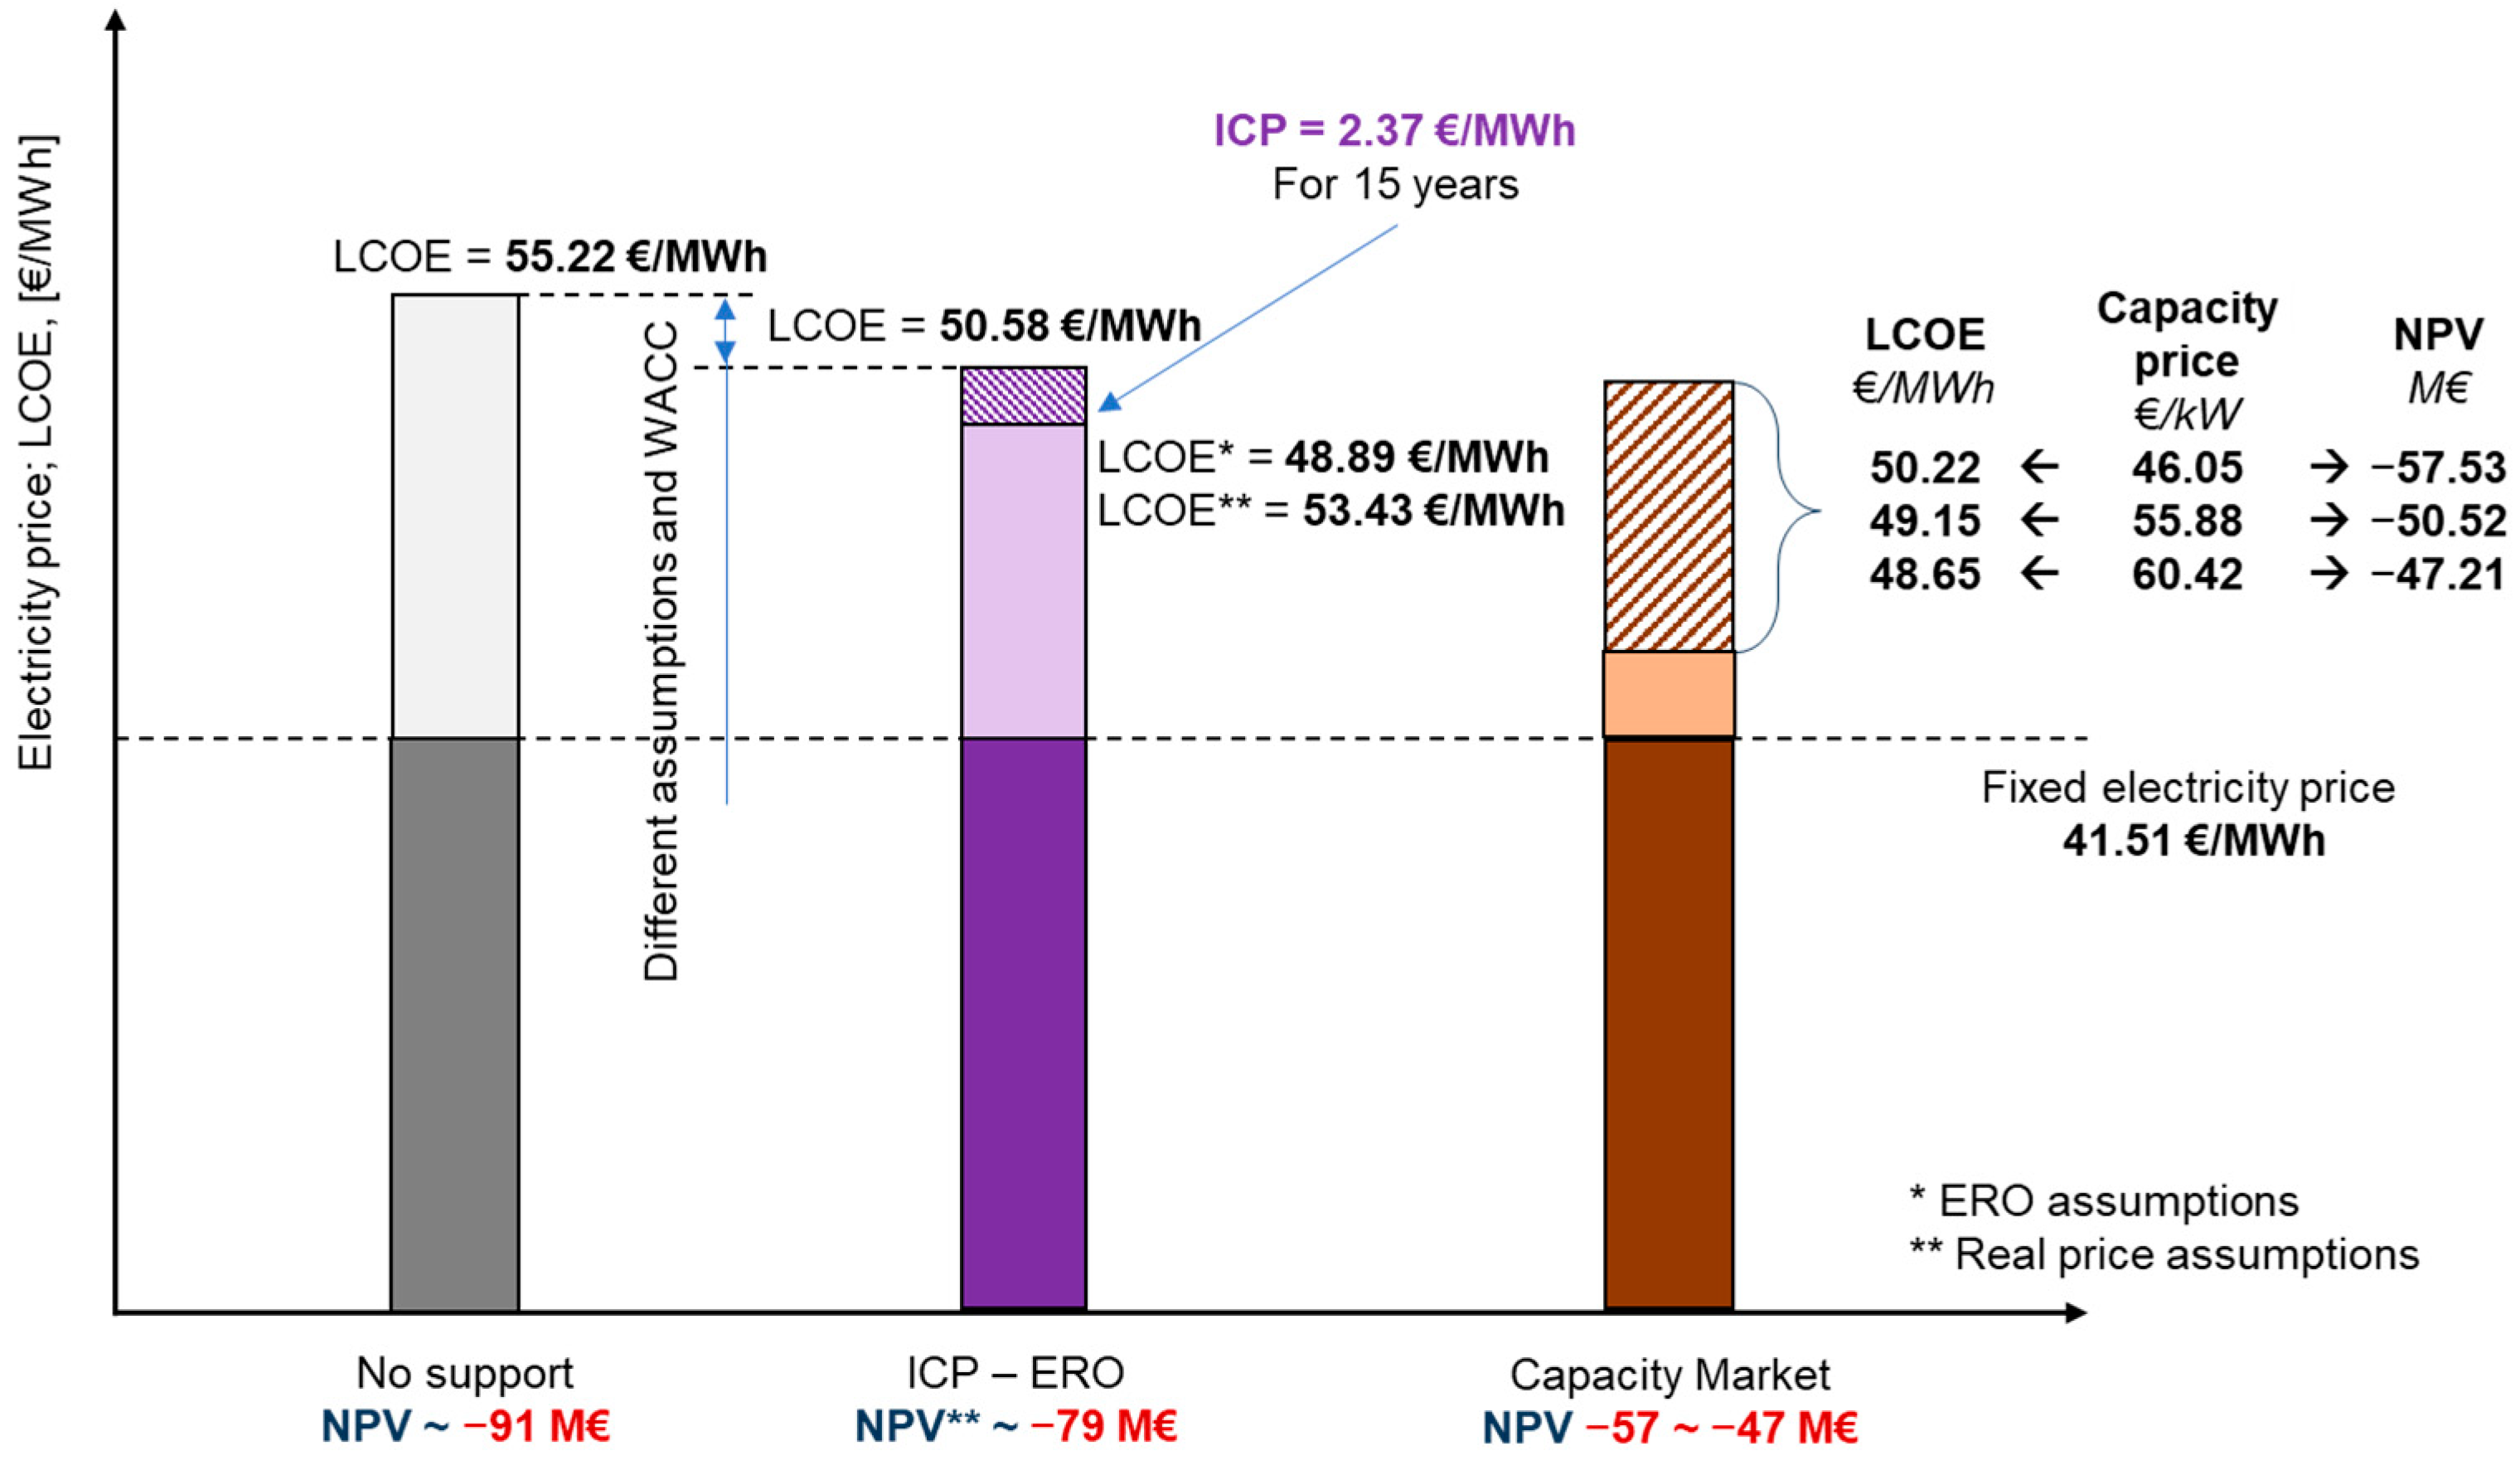
On the other hand, the reduction of electricity price by 15% compared to the level assumed for ICP calculation generates the NPV of €−79 million (the purple bar in
Figure 4), which means a much better result compared to the no-support scenario (NPV = €−91 million—the grey bar). However, it is still a value far from zero, because the real market prices remain at a level below those adopted by ERO for establishing the ICP; hence, the premium is insufficient to cover the emerging difference. At the same time, to achieve the ICP, one must constantly produce electricity, which, in the analysed circumstances, seems to lack the economic justification. The bright-coloured area of the bars, above the electricity price levels, depicts the losses incurred for the adopted conditions. In the case of ICP, these losses are partially levelled by the granted premium; its amount, however, as mentioned before, was calculated for different, more favourable market conditions.
The situation of the analysed enterprise in the case of support from the capacity market is presented by the brown bar; the NPV value is also negative and amounts to approximately €-47 million for the maximum analysed capacity price (60.42 €/kW). The value was estimated with regard to an assumption that energy production at such unfavourable prices will take place. It is worth noting that the capacity market (unlike ICP) is a more flexible mechanism in this respect, especially in the case of the analysed cogeneration systems, where the electricity production is but one of many revenue sources.
4. Discussion
Receiving support as part of the considered mechanisms (i.e., capacity market and individual cogeneration premium), as well as the application procedures, is associated with a number of possible risk factors.
The basic difference between the considered support mechanisms is their aim. The capacity market is a mechanism based on the rules of demand and supply. The value of “support” determined in this way is a price for the provision of a particular service—the capacity obligation. More importantly, the impact of capacity market revenue on the financial result of a unit is subject to no restriction, unlike the ICP, where the aim is the support itself—in the form of public aid—of the newly constructed cogeneration units. The support is only provided to an extent required to start the investment at a level (NPV = 0) understood as a bonus to each sold MWh. At the same time, the analysis and establishing an ICP is a one-time action carried out in accordance with the regulator’s assumptions, which, in the case of a price change, may generate additional revenues—as was shown in the previous section—resulting from the difference between the price assumed by the regulator and the market reality later on.
Thus, in terms of future cashflows, both mechanisms at the very start determine the level of support, which—providing that all formal requirements are met and, in the case of ICP, the volumes of sold electricity are maintained—remains unchanged. Therefore, the difference between the two mechanisms comes down to the following:
making the support dependent on the level of sold electricity (ICP) or the lack of such dependence (CM);
the differences in formal requirements, including the necessity to prove the financial gap, in the case of ICP;
the assumptions adopted by ERO when establishing the ICP;
the level of declared capacity obligation;
the auction clearing price reached in the capacity market.
It should be noted that the future energy prices do not influence the difference between the considered support mechanisms. On the other hand, they determine the absolute economic efficiency of an investment.
From the above considerations and calculations, three main decision factors emerge, delimiting the choice between the described support mechanisms for which detailed analysis has been carried out. For the capacity market, it is most of all the auction-based price of capacity, while for the ICP, it is the assumed electricity price as of the moment of designating the support level and the future electricity sales volume.
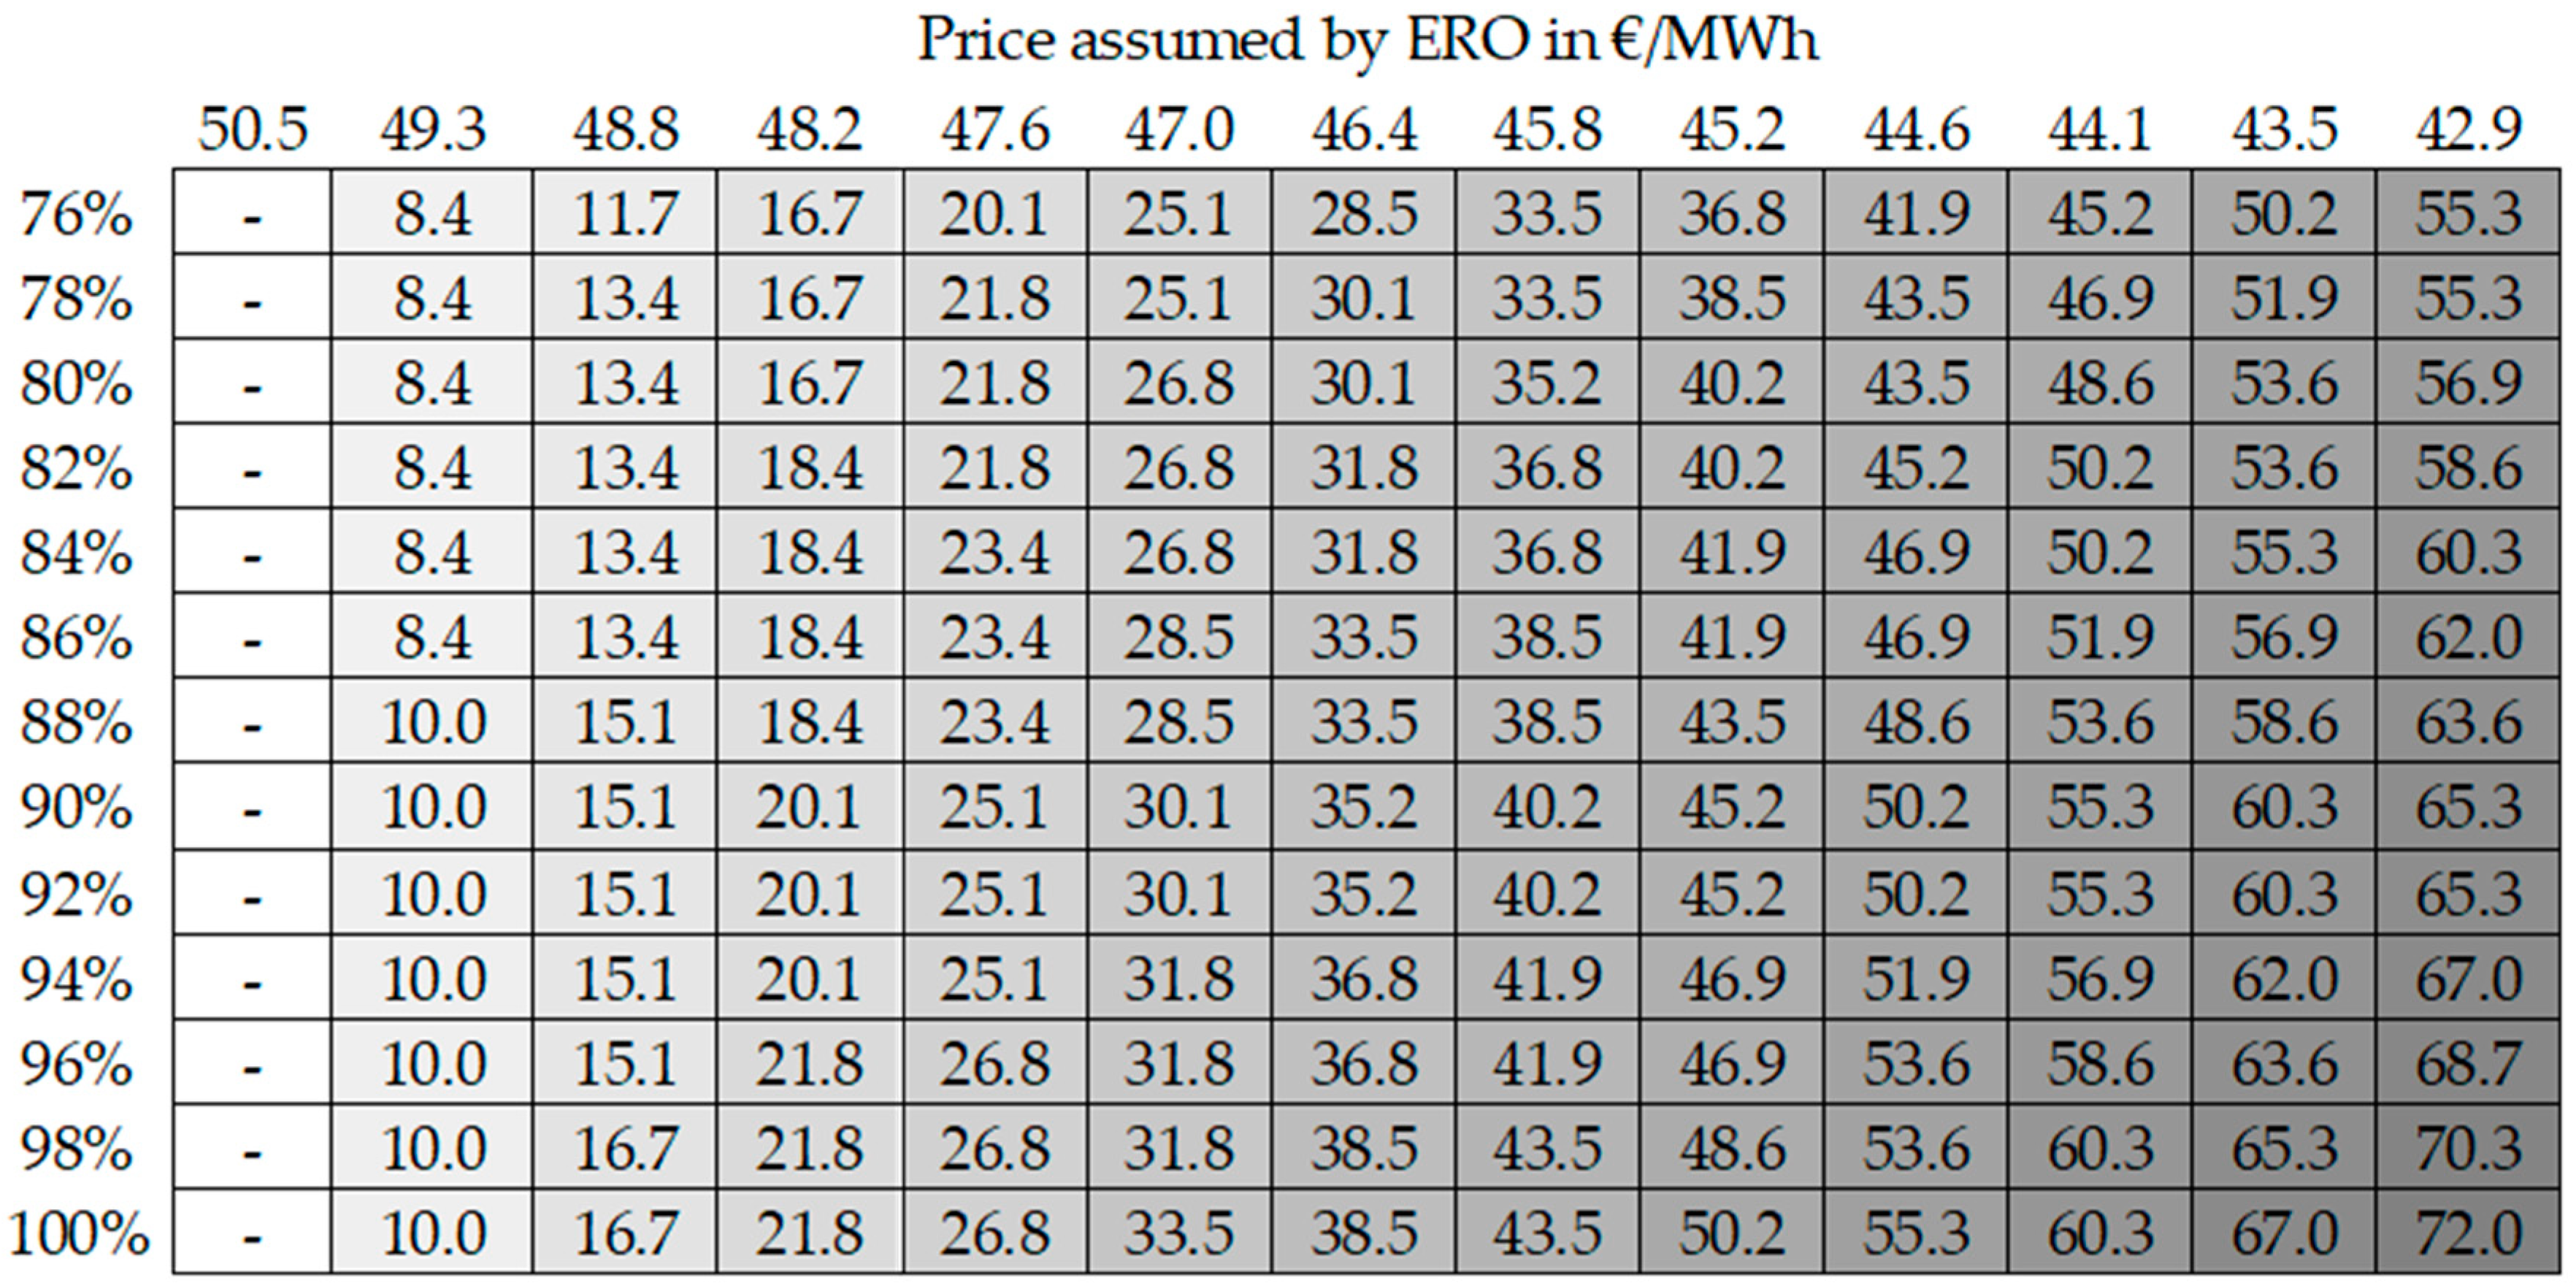
Based on the example of these factors, a sensitivity analysis was carried out, its aim being to establish the border levels of the considered parameters in order to decide which of the support mechanisms would be more adequate (
Figure 5).
As can be noted in
Figure 5, for example, for the price of 47.0 €/MWh assumed by ERO to establish the ICP and with the planned electricity production of 80% of the available production potential, the minimum capacity price deciding on the capacity market’s advantage as a support mechanism is 26.8 €/kW.
As may be easily noted, an ICP established with the price assumed by the regulator at 50.5 €/MWh and more gives the capacity market full advantage, regardless of the granted support price and planned electricity production volume. On the other hand, setting an ICP with a regulator-assumed price of 42.9 €/MWh and energy sales of 96% gives advantage to this mechanism—the price required on the capacity market of 68.7 €/kW exceeds the hitherto historical prices and equals itself with the capacity market auction entry price (approx. 69 €/kW).
If, however, the above results are juxtaposed with the real capacity market prices (55.88–60.42 €/kW), then for the ICP to gain advantage, ERO would have to lower the projected energy price by 25% (58.76 to 44.1 €/MWh) which, even in the current situation, seems very unlikely.
Another group of factors determining the relations between each of the analysed support mechanisms are the formal and legal requirements connected with each of them, and so—with respect to the aim of introduction of the capacity market (that being providing electricity supplies at every hour of the year by ensuring an appropriate level of disposal capacity in the system)—materialisation of each of the risk factors related to both the investment process and carrying out of the capacity obligation may result not only in the reduction or lack of expected revenues but also in the need to incur financial penalties.
On the other hand, in terms of risks related to commercial production, an important issue is the lack of regular revenues from ICP due to its dependence on the level of actually produced electricity. Thus, depending on the heating requirements in the years to come and both planned and unplanned periods of unavailability, the volume of produced electricity may deviate—within the anticipated return on investment horizon—from the projections at the stage of planning.
Nonetheless, the main issue in the case of ICP in the current formal and legal reality is the stage of assessment of the “incentive effect” or, more precisely, the technical end economic description form. It is not as much about the necessity to present the financial gap as it is about the adopted assumptions, which, in the current form, deviate from the market reality. Naturally, the differences between the anticipated prices and the capital cost will always emerge and constitute an element that brings about the potential of a higher revenue from a given support mechanism, as was shown above. The issue, however, is the differences related to the assumed production volumes, or replacement investments, whose amount should, at this stage, reflect the reality, and it does not. These differences result in the support mechanism entry threshold being artificially inflated, which seems illogical with regard to its preliminary aim.
5. Conclusions
Based on the analyses of the economic efficiency of a planned investment in a new gas-fired cogeneration unit, taking into account the potential support mechanisms in the form of capacity market and the individual cogeneration premium, as well as on the basis of the concluded sensitivity analyses of the risk factors with the largest impact, the following conclusions may be formulated. The mechanism of cogeneration support in the form of an individual cogeneration premium is burdened with a high risk for a unit of this type to participate in the selection process carried out by the President of ERO. The investment does not meet the preliminary qualification criteria verified at the stage of applicating for the concession promise, entitling the user to apply for this form of support.
The scenario analysis allowed us to assess the mutual relations between the two support mechanisms. The situation of the analysed enterprise in the case of granting support from the capacity market in all scenarios proved better than in the case of the ICP support. The next step was to analyse the sensitivity and thus determine the market conditions for which it would be possible to ascertain an absolute advantage of one of the mechanisms. This analysis proved that for the price assumed by ERO to determine the ICP at the level of 50.5 €/MWh and more, we can speak of the capacity market’s advantage. While setting the ICP with a price assumed by the regulator at 42.9 €/MWh and with energy sales of at least 96%, the latter of the mechanisms proves more advantageous.
The goal of an individual cogeneration premium is to provide support aimed at NPV = 0, although, as was shown, the unfavourable differences in ERO’s assumptions as to the market conditions may cause actual negative NPV values for the investors. Importantly, the differences may also prove advantageous for the investor. The basic feature of the ICP as a support mechanism, as well as the highest-risk factor for the considered cogeneration units operating in the fluctuating market environment, is the dependence of the real support on the volumes of produced and sold electricity. Each deviation from the volumes declared at the selection process causes the decrease in revenues and negatively influences the investment’s economic efficiency.
Unlike ICP, the support from participating in the capacity market may generate a positive and unlimited NPV. It should be emphasized that also new production units, according to the capacity auction regulations, have the status of price-makers, which means that they may withdraw from a capacity auction at any time, whenever they feel that the capacity price in the next round of auction proceedings might fall below the designated level which guarantees a satisfactory revenue return on investment. Moreover, the revenues from the capacity market are independent of the electricity production and sales volume. Thus, the generation units are granted a large degree of operational flexibility, required especially in the dynamically changing market conditions. This mechanism also allows a better use of the economic potential of heat accumulators in the planned units. Therefore, from the financial implications point of view—presented in this paper as production costs, LCOE—the capacity market seems to be more adapted to market realities than ICP. The CHP unit presented in this paper could obtain NPV by EUR 33–44 million higher than in the case of ICP.
The use of the generally known methods described in our work to solve the research problem and the calculations carried out allowed for the analysis and comparison of the two governmental support mechanisms (the capacity market and individual cogeneration premium) that can potentially be used by the owners of large cogeneration gas units in Poland. Based on our results, we were also able to compare the functioning and mutual interaction of these mechanisms. The contribution of the presented research also includes the identification of existing regulatory barriers which may reduce the effectiveness of the support system. This will be helpful in developing a better and more coherent support policy in CEE (Central and Eastern Europe) countries with a significant share of cogeneration capacities.
The main limitation of this research is the engineering nature of the empirical analyses that focus on the comparison of support mechanisms in the context of market realities. There is no qualitative assessment focusing on the direction of the introduced changes and their impact on the economy as a whole. Nevertheless, the applied approach, although very limited, is—to the best of our knowledge—necessary, and, at the same time, is thus the novelty of this paper. As it was presented in the Introduction, the subject of support systems is still widely discussed. However, most of the papers focus on the qualitative aspects of designing support policy. These analyses should be enriched or assessed in the context of policy engineering and this is the goal of this publication.
The insights and relationships presented in this paper may provide information for support policy-makers as well as for researchers of this topic. Of course, this work does not in any way exhaust the issues related to the assessment of support systems. Further research should, on the one hand, enrich the analysis with qualitative aspects and, on the other hand, aim to create a multidimensional sensitivity analysis taking into account the remaining market factors such as gas prices, heat prices, etc. What is more, such analyses should be performed for the support systems available in other countries. Such a comparison would become an invaluable tool for developing a coherent energy policy.


