Article

Diagnosing Hydraulic Fracture Geometry, Complexity, and Fracture Wellbore Connectivity Using Chemical Tracer Flowback †

Department of Petroleum Engineering, The University of Texas at Austin, Austin, TX 78703, USA
*
Author to whom correspondence should be addressed.
This paper is an extended version of our paper published in 2018 SPE/AAPG/SEG Unconventional Resources Technology Conference, 23–25 July 2018, Houston, Texas, USA, p. 10.
Energies 2020, 13(21), 5644; https://doi.org/10.3390/en13215644
Submission received: 29 August 2020 / Revised: 20 October 2020 / Accepted: 22 October 2020 / Published: 28 October 2020
(This article belongs to the Section H: Geo-Energy)

Abstract

:
The productivity of a hydraulically fractured well depends on the fracture geometry and fracture–wellbore connectivity. Unlike other fracture diagnostics techniques, flowback tracer response will be dominated only by the fractures, which are open and connected to the wellbore. Single well chemical tracer field tests have been used for hydraulic fracture diagnostics to estimate the stagewise production contribution. In this study, a chemical tracer flowback analysis is presented to estimate the fraction of the created fracture area, which is open and connected to the wellbore. A geomechanics coupled fluid flow and tracer transport model is developed to analyze the impact of (a) fracture geometry, (b) fracture propagation and closure effects, and (c) fracture complexity on the tracer response curves. Tracer injection and flowback in a complex fracture network is modeled with the help of an effective model. Multiple peaks in the tracer response curves can be explained by the closure of activated natural fractures. Low tracer recovery typically observed in field tests can be explained by tracer retention due to fracture closure. In a complex fracture network, segment length and permeability are lumped to define an effective connected fracture length, a parameter that correlates with production. Neural network-based inverse modeling is performed to estimate effective connected fracture length using tracer data. A new method to analyze chemical tracer data which includes the effect of flow and geomechanics on tracer flowback is presented. The proposed approach can help in estimating the degree of connectivity between the wellbore and created hydraulic fractures.

1. Introduction

The most common fracture diagnostic methods are microseismic [1,2], tiltmeter [3], well testing [4], radioactive tracers [5], chemical tracers [6,7], pressure interference [8,9,10] and water hammer measurements [11]. Each of these diagnostic methods has inherent advantages and limitations. Tiltmeter and microseismic mapping provide information about the dimensions and extent of the fracture network but cannot provide information about the fracture conductivity and the fracture connectivity to the wellbore. On the other hand, fluid and tracer transport are dominated by open and connected fractures and how well they are connected to the wellbore, and these are reflected in the tracer response curve. Chemical tracer flowback analysis can be used as an alternative fracture diagnostic method to extend or complement traditional diagnostic tools.
In conventional reservoirs, chemical tracer tests have been used to determine the flow of fluids in waterflooded reservoirs [12]. Two types of tracer tests; inter-well tracer tests (IWTTs) and single-well tracer tests (SWTTs) have been widely performed. IWTTs have been used to obtain information about volumetric sweep, identification of offending injectors, directional flow trends, delineation of flow barriers, and evaluation of sweep improvement treatments [13]. Single-well tracer tests have been used to determine residual oil saturation [14,15]. In unconventional reservoirs, IWTTs have been used to understand fracture communication with offset wells [16,17,18], and to estimate the fracture volume between well pairs [7]. Recently, single-well chemical tracer tests have also been used to estimate the relative contribution of a stage to the overall flow from a multi-fractured well [19,20].
Single-well chemical tracer tests for hydraulic fracture diagnosis were first investigated by Gardien et al. [6]. They used tracer flowback simulations to investigate the influence of fracture geometry on the shape of the tracer response curve. Elahi and Jafarpour [21] investigated the sensitivity of tracer flowback to fracture length and conductivity. Tian et al. [22] presented a partitioning chemical tracer-based method to estimate fracture volume. These studies were based on static planar bi-wing fracture geometry and constant fracture conductivity during flowback.
Li et al. [23] analyzed chemical tracer flowback to evaluate the fracture network using temporal moment and classified the fracture network depending upon the degree of primary and secondary hydraulic fractures. In this study a correlation analysis between cumulative flow capacity and cumulative storage capacity was used and the tracer injection modeling during the fracture propagation was not considered in the analysis. Li et al. [24] improved previous tracer flowback analysis by conducting numerical experiments by generating the fracture network stochastically, and modeling tracer transport in discrete fracture networks. They introduced a new parameter, conductivity weighted effective fracture density, to describe the secondary fracture. Although fracture conductivity was not assumed to be uniform, there was no information about the impact of fracture propagation on tracer transport during tracer injection.
Existing flowback tracer analysis studies have ignored fracture propagation during tracer injection and fracture conductivity changes during flowback due to geomechanical effects. However, during flowback, as fracture pressure is reduced, the induced unpropped (IU) fracture can close over time and lead to tracer retention in the reservoir and fractures. The IU fracture closure affects the tracer recovery, and this is clearly reflected in the tracer response curve. Models that assume static planar fractures with no fracture closure due to pore pressure depletion are unable to capture these important features of the tracer response curve. In this paper, the tracer injection and flowback simulations coupled with fracture propagation and fracture closure modeling are presented. The fluid flow and tracer transport model developed for this study is described in next section.

2. Model Description

The tracer transport model is implemented in the finite-volume method based geomechanical reservoir simulator developed by Zheng et al. [25]. In the case of tracer transport modeling, two fundamental assumptions are applicable, tracers do not occupy any volume, and they do not affect the physical properties of the phases [26].

2.1. Fluid Flow and Geomechanics Model

Coupled flow between two different domains (reservoir and fracture) is modeled as shown in Figure 1. Equation (1) represents the fluid flow in the reservoir (matrix) domain. This equation was derived using the conservation of mass and Darcy’s law.
ϕ m c t p m t · ( k m = λ j p m ) α · ( U t ) = q f r a c t u r e m a t r i x
where ϕ m is the reservoir porosity, c t is the total compressibility, p m is the fluid pressure in the reservoir, k m = is the reservoir permeability tensor,   λ j is the relative fluid mobility (relative permeability/viscosity) for phase j, α is the Biot’s coefficient, U is the geomechanical displacement vector field, and q f r a c t u r e m a t r i x is the leak-off/injection from fracture to matrix (reservoir) domain.
The first term on the left-hand side in Equation (1) is the accumulation term. The second term on the left-hand side corresponds to the flux between reservoir cells. The third term on the left-hand side includes the poroelastic coupling term which relates the change in the pore volume due to geomechanical displacement.
Equation (2) describes the fluid flow inside the fracture domain. Fluid flow in the fracture domain is modeled as the flow between parallel plates. This equation is derived from the Reynolds lubrication equation which accounts for the mass conservation and momentum conservation.
c f p f t + 1 w f w f t · ( w f 2 12   μ p f ) = q w e l l + q m a t r i x f r a c t u r e
where c f is the fluid compressibility, p f is the pressure in the fracture domain, w f is the fracture width (fracture width is calculated using geomechanical displacement from Equation (3)), μ is the relative fluid viscosity, q w e l l is the source/sink term corresponding to injection or production from a well, and q m a t r i x f r a c t u r e is the leak-off/injection from the matrix (reservoir) to the fracture domain.
The second term on the left-hand side in Equation (2) corresponds to pressure change in the fracture domain due to the change in fracture volume. The third term on the left-hand side corresponds to the flux between fracture cells.
For geomechanical modeling, the displacement Equation (3) was formulated in [27] using the condition of mechanical equilibrium and the linear elastic constitutive relations for the stress tensor and strain. Fracture pressure is applied as a traction boundary condition while solving the displacement equation.
ρ r 2 U t 2 =   ( 2 μ + λ ) 2 U +   · [ μ U T + λ t r ( U ) I ( μ + λ ) U + σ 0 ] α p m
The equations mentioned above (fluid flow in matrix and fracture domain and displacement equation) are solved in a coupled manner which is described in detail in [25]. The displacement equation is coupled with a fracture closure model which will be described in the next section.

2.2. Fracture Closure Model

Barton-Bandis normal contact stiffness relationship [28] is used to model fracture closure. Bandis et al. [28] derived a relationship between the normal contact stress acting on a closing fracture surface and the amount of closure by conducting several experiments of rock joints deformation under normal loading. The magnitude of fracture closure can be related to offset width, stiffness, and fracture width. The contact relationship from Bandis et al. [28] is simplified in [29], which is shown in Equation (4).
σ n = ( w o f f s e t w ) a b ( w o f f s e t w )
where σ n is the normal contact stress acting on the fracture surface, w is the current width of the closing fracture, w o f f s e t is the fracture width at which asperities in the closing fracture come in contact, a and b are the coefficients which depend on the initial normal stiffness and offset width as follows:
a = 1 K n i          b = 1 K n i w o f f s e t
where K n i is the initial normal stiffness which is computed using the joint roughness coefficient, joint compressive strength, and joint aperture. The fracture closure model is describe in detail in [29].

2.3. Mathematical Formulation for Tracer Transport

The continuity equation for a tracer component k in terms of volume of component k per unit pore volume [30] is shown in Equation (6).
t ( φ l = 1 n p ρ k S l C k l ) + · [ l = 1 n p ρ k C k l u l ] · [ l = 1 n p ρ k φ S l D k l · C k l ] = R k
where l denotes a phase (water, oil, or gas), n p is the total number of phases, ρ k is the density of pure component k . D k l is the dispersion tensor including molecular diffusion and mechanical dispersion. The source/sink term R k corresponds to injection or production from the wells. The phase flux velocity can be calculated from Darcy’s law as shown in Equation (7).
u l = K r l K = μ l P l
where K r l is the relative permeability, K = is the permeability tensor, μ l is the phase viscosity.
Tracers typically follow the phase they are going to trace. However, there are some partitioning tracers which can partition and flow with different phases. A water–oil partitioning tracer moves back and forth between the water and oil phases. The partitioning tracers move with the water phase velocity when they are in the water phase, and when they are in the oil phase, they move with the oil phase velocity [31]. Let T be a partitioning tracer which partitions between oil and water phase as per the distribution or partition coefficient ( K T ) then concentration of the tracer in the oil and water phase will depend on K T as per Equation (1).
K T = C T o C T w
where C T o and C T w are concentrations of tracer T in the oil and water phase, respectively. K T is the distribution or partition coefficient of the tracer T . The partition coefficient is a thermodynamic property having dependence on temperature, salinity, and concentration, and can be measured in the laboratory [32].
By combining Equations (6) and (7) and assuming two-phase (oil and water) flow, tracer transport equation can be written as follows:
t [ ϕ   ( S w C T w +   S o C T o ) ] 2 [ K = ( λ w C T w +   λ o C T o )   p ]   2 [ ϕ ( S w D T w C T w +   S o D T o C T o ) ] = R k
where S w and S o are water and oil saturation respectively, λ w and λ o are water and oil phase mobility, D T w and D T o are dispersion coefficients for the tracer T in water and oil phases, respectively.
Replacing C T o in Equation (9) from Equation (8), the following equation is obtained:
t [ ϕ ( S w + S o K T ) C T w ] 2 [ K = ( λ w +   λ o K T ) C T w   p ]   2 [ ϕ ( S w D T w +   S o D T o K T ) C T w ] = R k
Equation (10) with appropriate modification is used for modeling tracer transport in the reservoir and the fracture domain.

2.4. Tracer Transport Model in the Reservoir Domain

Equation (10) is used to solve for the tracer transport in the reservoir domain. This equation includes the effect of both convective and diffusive tracer transport. The finite-volume method is used for discretizing the tracer transport equation in the reservoir (matrix) domain. Equation (10) for the matrix domain in an integral form can be written as follows:
Ω ϕ ( S w m +   S o m K T ) C T w m t   d Ω Ω · ( K = ( λ w m + λ o m K T ) C T w m   p m ) d Ω     Ω · ( ϕ ( S w m D T w + S o m D T o K T )   C T w m )   d Ω = Q T L f m
where m subscript/superscript represents the properties in the matrix domain, Ω is the control volume,   C T w m is the tracer T concentration in the water phase in the matrix domain, Q T L f m is the tracer-leak off volume rate from fracture to the matrix. This tracer leak-off term also appears in the fracture domain equation with an opposite sign. Tracer leak-off coupling between matrix and fracture domain will be discussed in Section 2.6.
After applying the finite volume discretization for the cell “i” on Equation (11), the following equation is obtained:
ϕ ( S w m + S o m K T ) Ω Δ t ( C T w m i k + 1 C T w m i k ) j = 1 N e K = ( λ w u + λ o u K T ) Γ j N j ( p m i k + 1 p m i N j k ) δ i N j C T w m u j = 1 N e ϕ ( S w m D T w + S o m D T o K T ) Γ j N j ( C T w m i k + 1 C T w m i N j k + 1 ) δ i N j = Q T L f m
where Γ j N j is the face area between the owner and neighbor cells. j refers to the neighbor cells of cell i. where superscript “u” represents the properties obtained by upwinding. Upwinding is required for stabilizing the numerical solution in the IMPEC (Implicit pressure explicit concentration) formulation used in our model. Upwinding helps in numerically simulating the direction of propagation of information in the flow field.

2.5. Tracer Transport Model in the Fracture Domain

Flow in the fracture is modeled as the flow between two variable-width parallel plates. Equation (10) is modified to include the effect of volume change (due to fracture opening/closure) on the tracer transport. Equation (13) describes the tracer transport equation in the fracture domain.
t [ w f ( S w f +   S o f K T ) C T w f ] 2 [ w f 3 12 ( λ w f + λ o f K T )   C T w f   p f ]   2 [ w f ( S w f D T w + S o f D T o K T )   C T w f ] = q w C T w f + q o K T C T w f + Q T L m f
where superscript f represents the property in the fracture domain, w f is the fracture width, C T w f is the tracer T concentration in the water phase in the fracture domain, q w and q o are the water and oil production/injection rates respectively. Q T L m f is the tracer-leak off volume rate from the matrix to fracture.
The first-term on the left-hand side (LHS) of Equation (13) corresponds to the change in the tracer concentration due to the tracer accumulation and also due to the fracture volume change. Convective tracer flow between fracture elements is captured by the second term on the LHS. The third term on the LHS captures the tracer transport due to the dispersion.
Equation (13) is discretized using the finite area method as described in [33]. In the finite volume method, a three-dimensional region is discretized spatially into volumes (3D domains). Similarly, in the finite area method, a two-dimensional region is discretized spatially into surfaces (2D domains). Finite area domains are discretized by arbitrary polygons and require surface data along a finite volume boundary for discretization. Equation (13) in an integral form can be written as follows:
S w f ( S w f + S o f K T ) C T w f t d S + S ( S w f + S o f K T ) C T w f w f t d S S n · w f 3 12 ( λ w f + λ o f K T ) p f C T w f d L S n · w f ( S w f D T w + S o f D T o K T ) C T w f d L = ( q w + q o K T ) C T w f + S K m μ f ( λ w u + λ o u K T ) p m p f δ n C T w u
where superscript “u” represents the properties obtained by upwinding, and S is the control surface for the finite area discretization.
After applying the finite area discretization for face “i” on Equation (14), the following equation is obtained:
w f ( S w f + S o f K T ) S Δ t ( C T w f i k + 1 C T w f i k ) + ( S w f + S o f K T ) C T w f S Δ t ( w f i k + 1 w f i k ) j = 1 N e ( w f e k ) 3 L e 12 ( λ w f + λ o f K T ) ( p f i k + 1 p f i N j k ) δ i N j C T w e f u j = 1 N e w f e L e δ i N j ( S w f D T w + S o f D T o K T ) ( C T w f i k + 1 C T w f i N j k + 1 ) = ( q w k + 1 + q o k + 1 K T ) C T w f k + 1 + K m S μ f ( λ w u + λ o u K T ) p m k + 1 p f k + 1 δ n C T w f u
where δ n is the normal distance between the matrix cell center and the fracture face. “k” refers to the time-step. j refers to the neighbor faces of face i. w f e is the edge width value which is the average of the width of the owner face and neighbor face.

2.6. Coupling of Matrix and Fracture Domain Tracer Equations

The discretized tracer transport Equations (12) and (15) for the reservoir and fracture domain are assembled in a single matrix to solve for the tracer transport.
Tracer flow across the matrix fracture interface depends upon the tracer concentration on the fracture faces and the tracer concentration in the crack boundary cells of the reservoir domain. The matrix-fracture tracer flux will, in turn, affect the tracer concentration in the fracture and reservoir domain. This will require multiple iterations to converge if matrix and fracture domain equations are solved sequentially. Iterative solution methodology may also lead to instability in the simulation. To avoid multiple iterations and instabilities, the matrix and fracture domain tracer equations are solved simultaneously. Reservoir and fracture tracer equation matrix coefficients are combined into a single matrix as shown in Figure 2.

2.7. Solution Algorithm

The developed tracer transport model is integrated with the geomechanical reservoir simulator [25]. The overall solution algorithm is shown in Figure 3. The tracer model is based on IMPEC (Implicit in pressure, explicit in concentration) implementation. At the start of a time-step, the fracture propagation loop is executed by solving coupled equations for displacement, pressure, fluid distribution, and wellbore [34]. Then the saturation equation is solved. Coupled tracer equations are solved after obtaining the converged values of pressure, saturation, and fracture width. GMRES solver [35] with an ILUT preconditioner [36] is used to solve the linear system of equations.

2.8. Multiple Tracer Option

The developed tracer model can be used to solve for any number of tracers. Based on the user-provided number of tracers, all tracer properties, concentration fields, and equations are populated and stored as a list of pointers. Once the coupled reservoir displacement, pressure, and saturation equations are solved, tracer transport equation for all tracers is solved.

3. Tracer Flowback Simulations with Fracture Propagation

Water-soluble tracer slug injection and flowback was simulated for a propagating planar fracture. Important reservoir and geomechanical properties for these simulations are summarized in Table 1.
Fracturing fluid was injected at a constant injection rate for 30 min. The tracer slug was injected for 15 min at a constant concentration (0.01 by volume). Tracer concentration inside the propagating fracture is shown in Figure 4. During the early time of fracture propagation, tracer concentration in the hydraulic fracture is the same as the injected tracer concentration. Once the tracer injection is stopped, injected fracturing fluid displaces the tracer towards the fracture tips and in the reservoir through leak-off. At the start of the flowback, tracer concentration near the wellbore is very low. Flowback tracer concentration starts with a very low value, and a Gaussian type tracer response curve with a single peak was observed, as shown in Figure 5.

3.1. Impact of Fracture Length on Tracer Response Curves

Preliminary tracer tests were simulated to obtain tracer response curves by varying reservoir permeability from 10 nD to 5 µD. An increase in the reservoir permeability leads to a decrease in the created hydraulic fracture length due to higher leak-off rates (all other parameters are kept constant). The objective of these simulations was to analyze the difference in the tracer response curves to get some qualitative information about fracture length. An equal volume of tracer was injected in all cases, and the flowback was performed at the same constant bottom-hole pressure in each case. In these preliminary simulations, fracture closure during flowback was not considered. For this analysis, the tracer concentration in the flowback fluid was normalized against injected tracer concentration, as explained in Equation (16).
N o r m a l i z e d   T r a c e r   C o n c e n t r a t i o n   ( C D ) =   T r a c e r   C o n c e n t r a t i o n   i n   F l o w b a c k I n j e c t e d   T r a c e r   C o n c e n t r a t i o n
Normalized tracer concentration ( C D ) vs. time is plotted on a semi-log scale for all reservoir permeability ( K m ) cases (Figure 6). It was observed that an increase in the reservoir permeability leads to an early peak in the tracer response curve. An increase in reservoir permeability leads to an increase in the tracer dilution due to the higher flow rate of reservoir fluids from the matrix to fracture during flowback. Also, in case of lower fracture length (higher matrix permeability), the tracer penetrates deeper into the matrix, and dilution of tracer occurs due to mixing with the reservoir fluid. This tracer dilution leads to a decrease in the tracer peak concentration in higher matrix permeability cases, and increased dispersion is observed in the tracer response curve. Figure 7 shows the plot of peak tracer concentration vs. fracture half-length. The peak tracer concentration during flowback was observed to increase with an increase in the fracture length. The time at which tracer concentration reaches the peak value was measured for each case and is plotted vs. fracture length (Figure 8). It was observed that the time of peak concentration is directly proportional to fracture length, and this correlation can be used to obtain qualitative information about fracture length.
Figure 9 shows the plot of tracer recovery (as a percentage of tracer injected) against time. Since fracture closure was not modeled in these simulations, almost 100% recovery of the injected tracer was observed during flowback. However, several field studies have shown very low tracer recovery [19,20,37]. The tracer retention due to fracture closure can help in understanding the low tracer recovery, which is explained in the next section.

3.2. Impact of Fracture Closure on Tracer Flowback

The impact of fracture closure on the tracer response curve and tracer recovery was analyzed. During flowback, increased effective stress on the fracture faces can lead to fracture closure. This fracture closure hinders the tracer transport from the fracture to the wellbore. The fracture closure phenomenon is modeled using the Barton–Bandis normal contact stiffness relationship [28]. The magnitude of fracture closure depends on the fracture stiffness ( K n i ) and offset width. In this section, the fracture stiffness was varied (from 108 Pa/m to 1011 Pa/m) to analyze the impact of fracture closure on the tracer flowback. Reservoir permeability (1 µD) was same for all cases. Figure 10 illustrates the sensitivity of stiffness on the fracture width during the closure. It was observed that the rate of fracture closure is inversely proportional to the stiffness.
Figure 11 shows the impact of the fracture closure rate on the tracer response curve. Flowback tracer concentration decreases sharply when fracture stiffness is lower (faster fracture closure). It was also observed that the peak concentration decreases with an increase in fracture closure rate. Figure 12 and Figure 13 demonstrate the impact of fracture closure on the tracer recovered during flowback. These simulation results indicate that the tracer recovery decreases with an increase in the fracture closure. These preliminary simulations were conducted using a planar bi-wing fracture. In the next few sections, this analysis is extended for complex fractures.

3.3. Effect of Fracture Complexity

In this section, the effect of secondary fracture intensity on the flowback tracer concentration of a multifractured horizontal well was analyzed. A simulation case was set up with four static fractures on a single wellbore having a different spacing of secondary fractures (Figure 14). A dual porosity-dual permeability model was used, and secondary fracture spacing was varied from 0.61 m to 6.1 m (2 ft to 20 ft). The Barton–Bandis fracture permeability model [28] was used to analyze the secondary fracture closure effects. Each fracture was tagged with a unique tracer, and an equal volume of tracer was injected in all four fractures.
Decrease in fracture spacing leads to an increase in fracture complexity and an increase in the number of secondary fractures. In case of higher number of secondary fractures, leak-off of tracer from fracture to matrix is higher. Also, during flowback, the secondary fractures close because of the increase in the effective stress caused by pressure depletion due to production. A higher number of secondary fractures will lead to higher depletion and higher increase in effective stress. Hence an increase in the number of secondary fractures will lead to an increase in fracture closure effects. In the case of a higher number of secondary fractures, because of tracer leak-off and fracture closure, tracer flowback to the surface is lower. Simulation results (Figure 15) indicate that the tracer recovery decreases with an increase in fracture complexity (higher number of secondary fractures).

4. Fracture Wellbore Connectivity Using Chemical Tracer Flowback

In this section, a simulation study is presented to model tracer injection and flowback in a complex fracture network with the help of an effective model to analyze the field tracer tests.

4.1. Complicated Tracer Response Curves Typically Observed in a Field Tracer Test

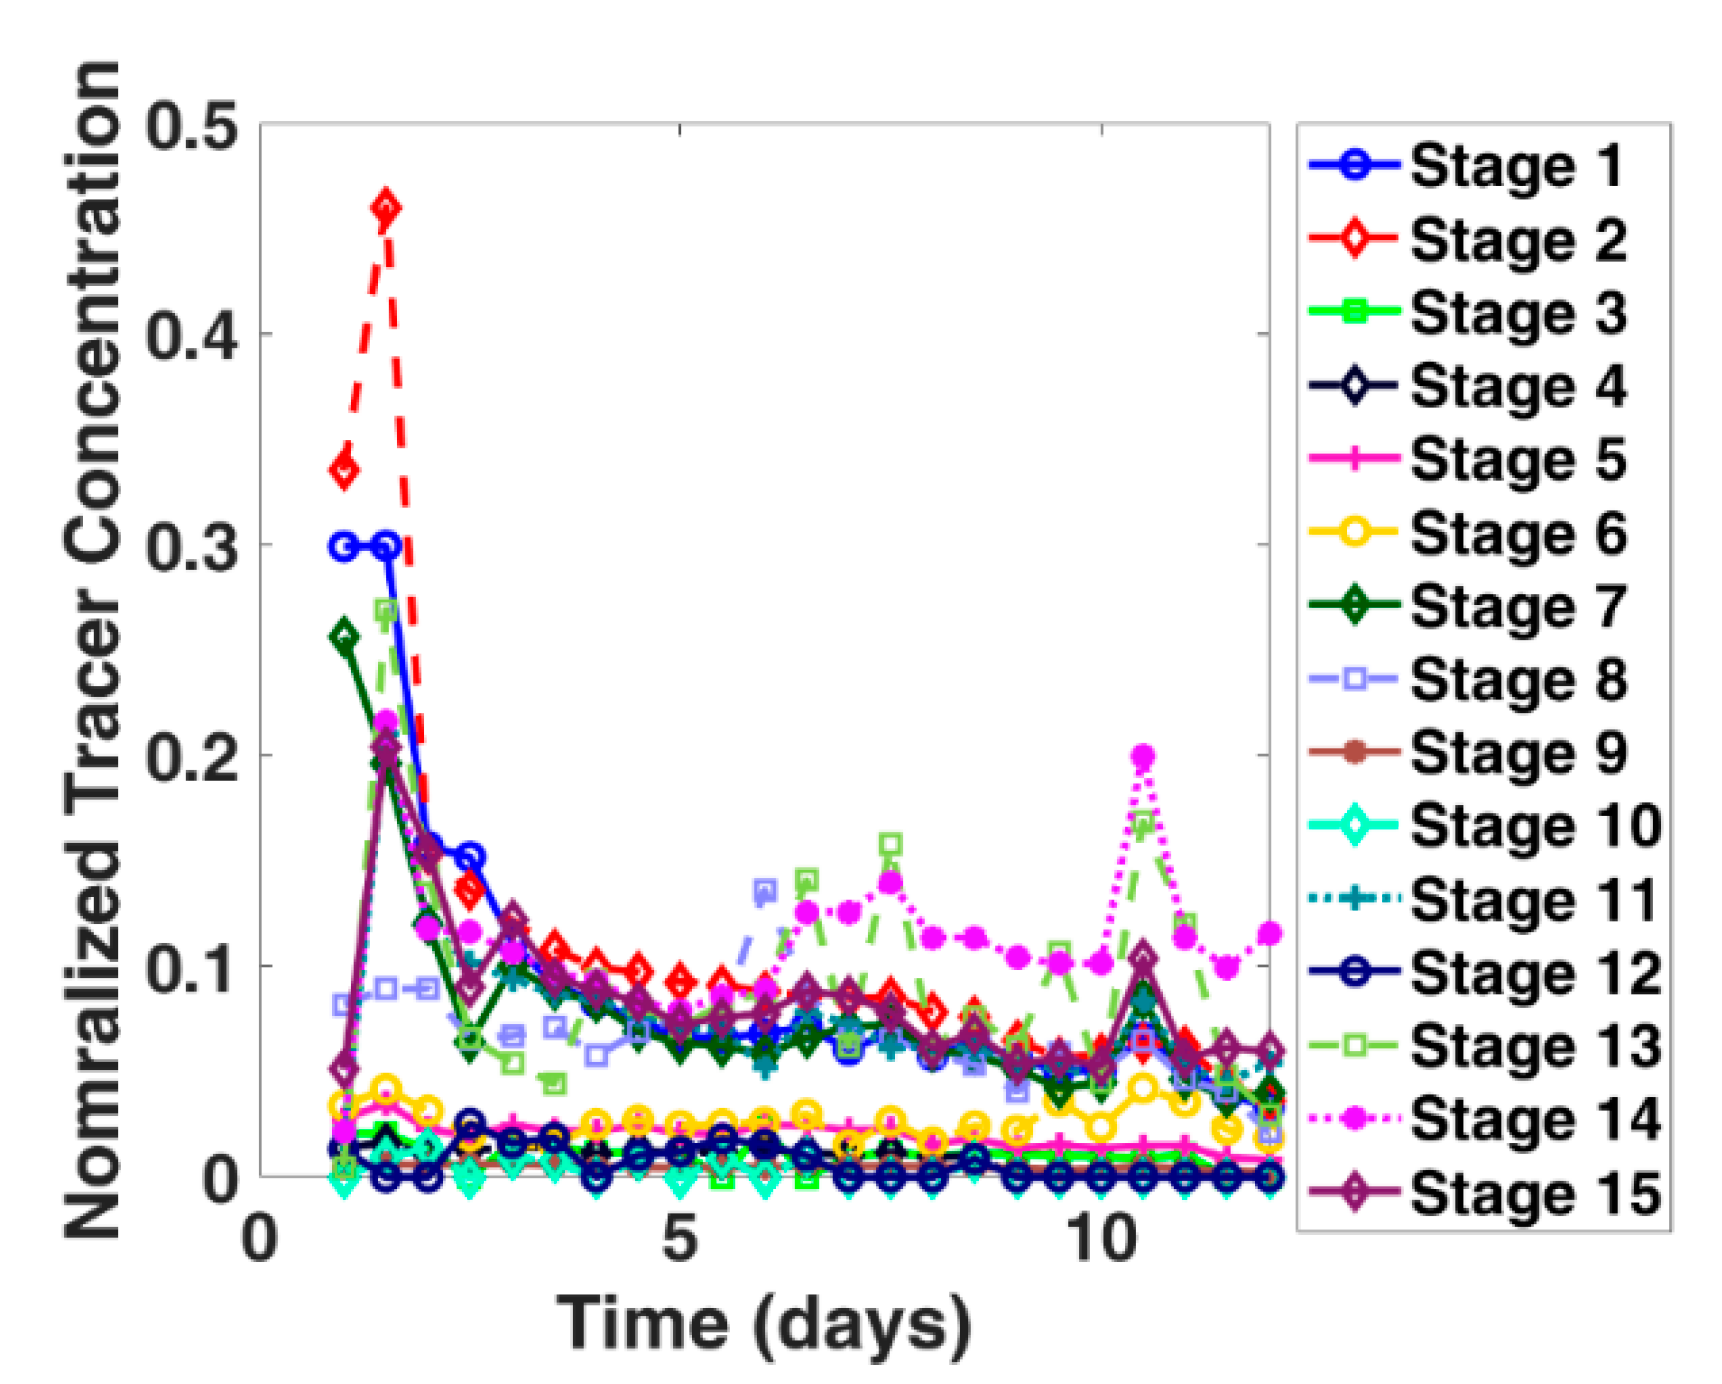
A typical field tracer test in a hydraulically fractured well shows very complex tracer response curves (Figure 16).There is no uniform trend observed in a tracer flowback test. A few stages have negligible tracer concentration during flowback/production, indicating that these stages have a minimal contribution towards flowback/production. By ignoring these small contributing stages, tracer response curves can be divided into two main categories.
  • Simple tracer response curves with a single distinct early peak. (Figure 17a)
  • Tracer response curves with multiple peaks. (Figure 17b)
As explained in the previous sections, if tracer flowback from a slug injection tracer test with a propped fracture that is connected to the wellbore is analyzed, a Gaussian type tracer response curve with one peak (Figure 5) is observed. Johnston et al. (2005) [38] classified the tracer response curves into four general types (Gaussian, backward tailed, bimodal, multimodal) based on the matrix and fracture flow segregation depending upon fracture network heterogeneity. In their study, fracture aperture was assumed to be constant, and geomechanical effects were not considered. However, in the case of a tracer flowback test in a hydraulic fracturing operation, fracture width may change during flowback due to changes in fracture pressure. Fracture closure in a complex fracture network can lead to a decrease in the fracture connectivity to the wellbore [29]. This reduction in fracture wellbore connectivity will be reflected in the tracer recovery and hydrocarbon production. The impact of fracture closure on the number of peaks in a tracer response curve, tracer recovery, and hydrocarbon production are discussed in this work using a tracer flowback simulation model.

4.2. Simulation Model Description

In a naturally fractured reservoir, complex fracture networks are formed during hydraulic fracturing operations [39,40,41,42]. Figure 18 shows a hydraulic fracture network along with pre-existing natural fractures. The activated natural fractures in a complex fracture network aligned against maximum stress have relatively small fracture aperture, which makes it difficult for conventional size proppants to flow into them. These activated natural fractures do not contain proppant and can be referred to as induced unpropped (IU) fractures [43]. These IU fractures may close during flowback/production because of the high stress acting on them [44].
Fractures in a complex fracture network can be put into three categories based on the connectivity of a fracture to the wellbore: (1) closed fractures, (2) open and connected fractures, and (3) fractures open but not connected to the wellbore (Figure 19).
In the case of a low permeability reservoir, early flow in the reservoir at the matrix–fracture interface is mostly linear, and a complex fracture network can be simplified to an effective model comprised of multiple planar fracture segments connected to each other. Figure 20 shows a complex fracture network represented as an “effective” model having multiple segments with variable widths during flowback. Open fracture segments are assumed to have infinite conductivity (1000 mD in our simulations). The middle segment (FCL) corresponds to activated natural fractures aligned against the maximum stress.
To analyze the effect of IU fracture closure, middle segment (FCL) fracture closure was modeled using the Barton–Bandis contact relationship [26]. The impact of IU fracture closure on the tracer response curve, tracer recovery, and hydrocarbon production was analyzed. The effective model was used, as described in Figure 20. For the sensitivity analysis, the same volume of water-soluble tracer was injected in each case, and tracer flowback was performed at a constant bottomhole pressure. Tracer concentration at the producer well was normalized (CD) against the injected tracer concentration and plotted against time.

4.3. Multiple Peaks in the Tracer Response Curve Due to the Fracture Closure in a Complex Fracture Network

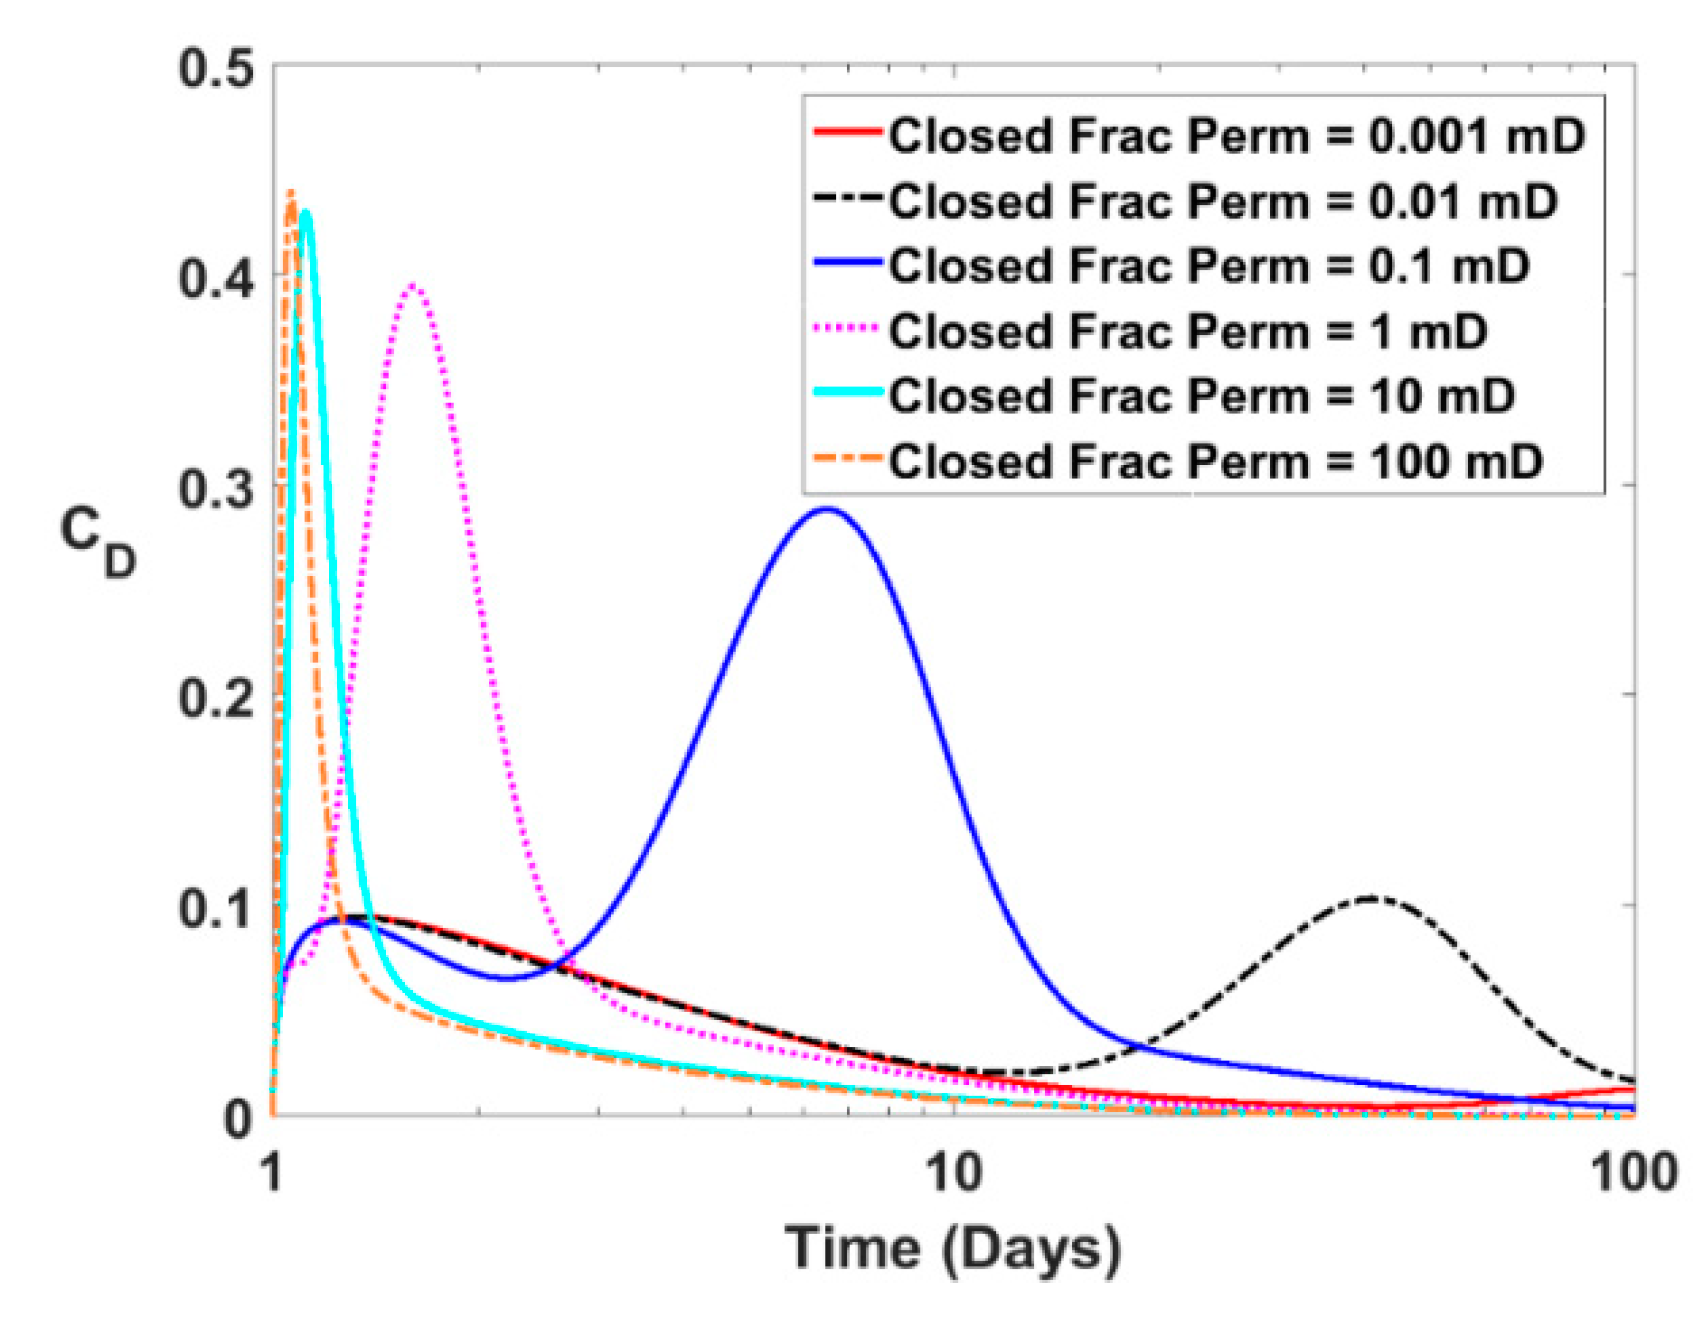
First, the sensitivity of the fracture closure rate on the tracer response from a complex fracture network was analyzed. Fracture stiffness ( K n i ) was varied from 2 × 10⁸ to 2 × 10¹¹ Pa/m. Figure 21 shows the tracer concentration during flowback at different rates of IU fracture closure. Multiple peaks are observed in case of fast closure when the closed IU fracture permeability is lower than the propped fracture permeability. The closed IU fracture acts as a resistance to tracer flow from the fracture segments far away from the wellbore. This slower flow from the disconnected fracture segments leads to late time peaks in the tracer response curves.
Next, the impact of the closed IU fracture permeability on the tracer response curves was analyzed. As per the Barton–Bandis closure model, at a fixed fracture stiffness, the residual fracture permeability (after closure) depends on offset width. The offset width was varied so that the closed fracture permeability ranges from the matrix permeability (1 µD) to the propped fracture permeability (1 Darcy). Figure 22 shows that multiple peaks are observed when the IU fracture is conductive enough to allow tracer flowback from the fracture segments away from the wellbore. When the residual permeability of the IU fractures is higher (comparable to the propped fracture conductivity), all fracture segments in a fracture network are connected to the wellbore, and flow in the fracture network is equivalent to the flow from a single open fracture. This results in a Gaussian type (single peak) tracer response curve. When the residual permeability of IU fractures is very low (comparable to the matrix permeability), fracture segments behind IU fractures are disconnected from the wellbore and flow in the fracture network is equivalent to the flow from a single fracture with a smaller created fracture network area, and this also results in a Gaussian type (single peak) tracer response curve. However, when the residual permeability of IU fractures has an intermediate value between the matrix and propped fracture permeability, multiple peaks are observed due to delayed flow from the fracture segments connected by IU fractures.
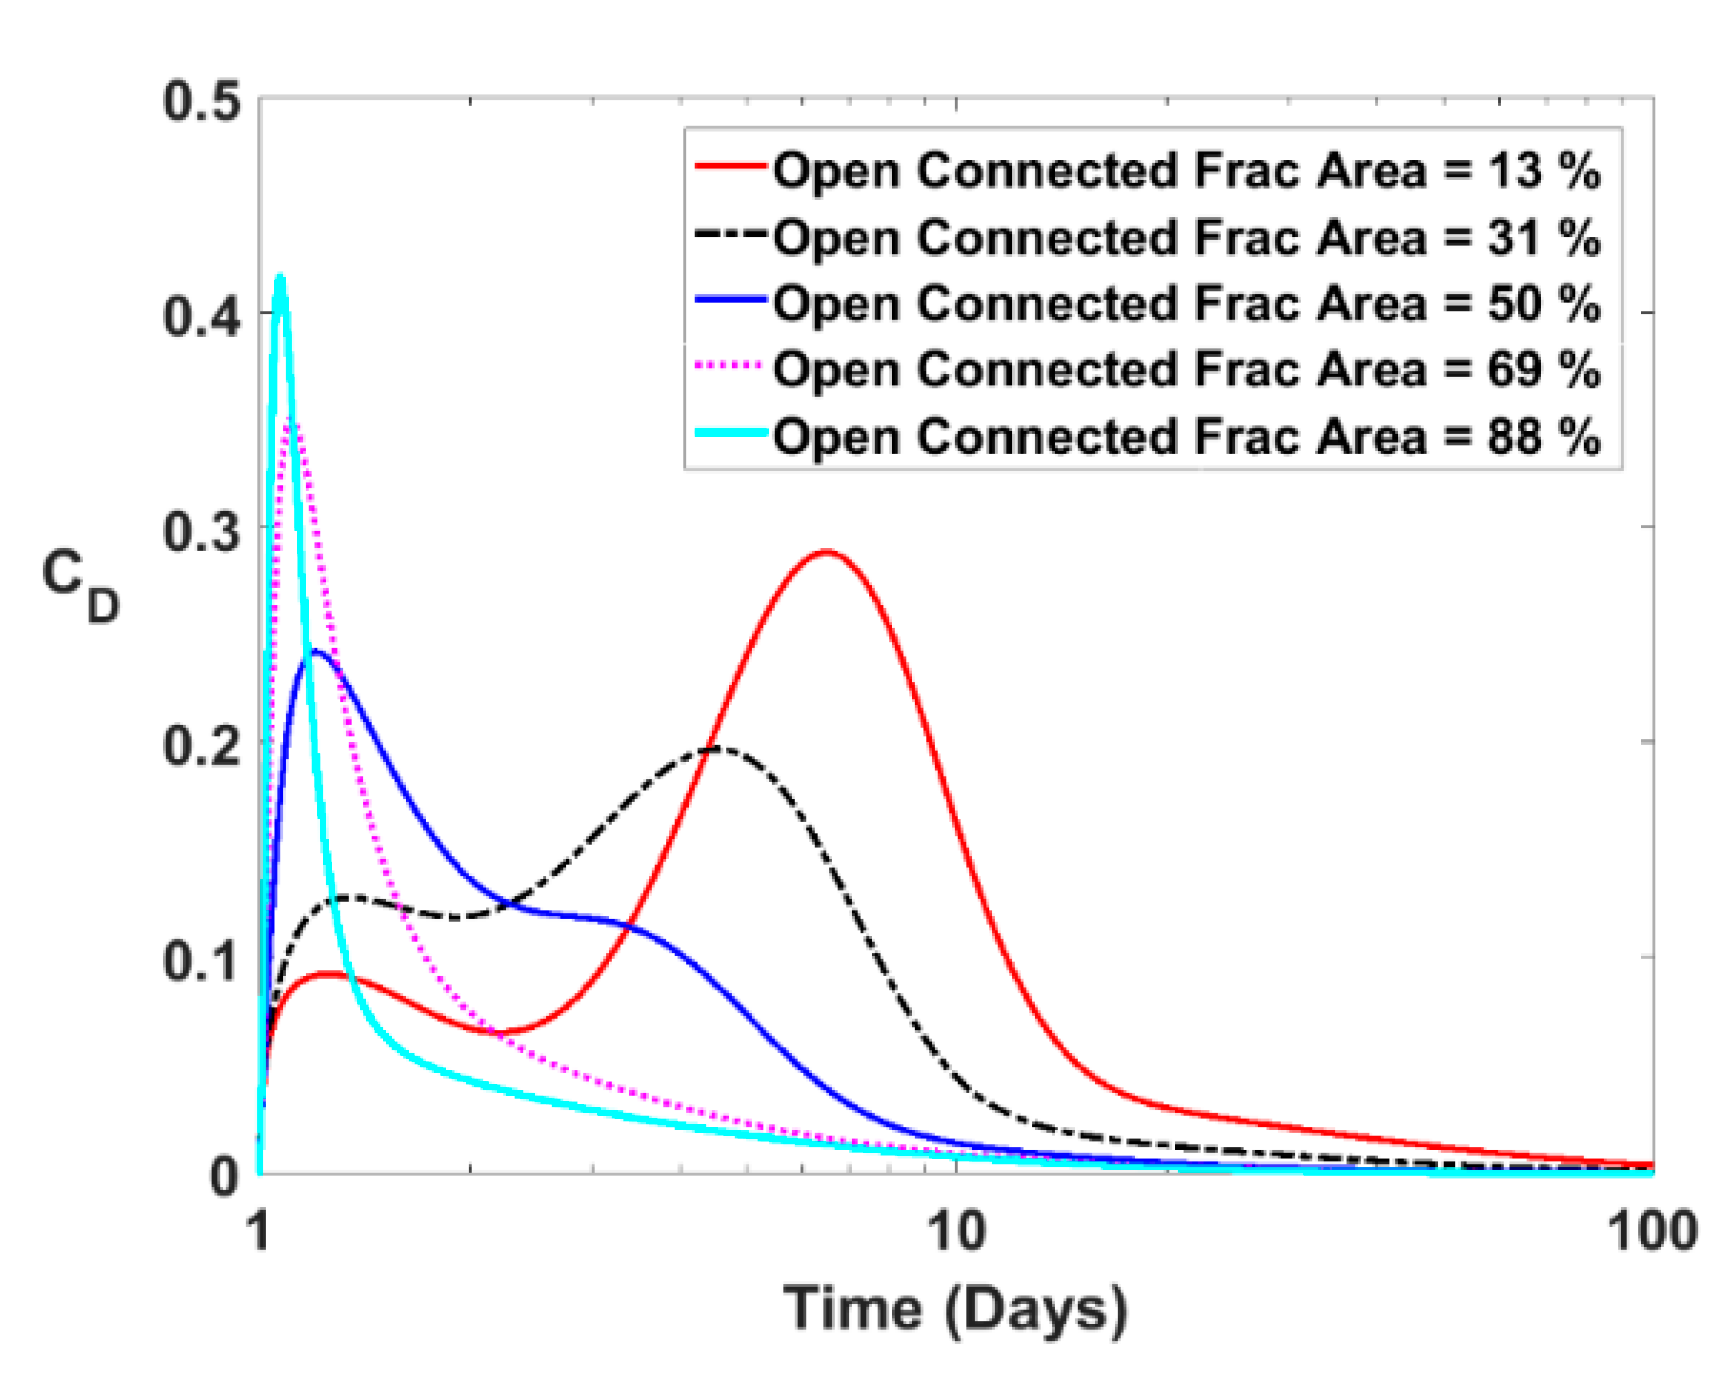
Next, the impact of the created fracture area, which is open and connected (FOC as shown in Figure 20) to the wellbore was analyzed. Figure 23 shows that multiple peaks can be observed when IU fracture closure leads to a reduction in the open connected (FOC) fracture area. It was observed that the first open-connected segment flows back early and contributes to the first peak. When the area of the open connected segments is smaller, then early time tracer recovery is lower, and the fracture segments connected via IU fractures lead to the late time tracer peaks. The first peak concentration is found to be proportional to the area of the open-connected segments. Hence, the volume of tracer recovered under the first peak can provide information regarding the fraction of the created fracture network that is open and connected to the wellbore.

4.4. Impact of Fracture Closure on the Tracer Recovery from Complex Fractures

Fracture closure during flowback results in tracer retention in fracture networks, which can lead to low tracer recovery during flowback. Field tracer tests have also indicated very low tracer recovery. Based on our simulation results, tracer recovery vs. the open connected fracture area was plotted. Figure 24a shows that tracer recovery decreases with a decrease in the open connected fracture area. It was also observed that a decrease in closed fracture permeability also leads to lower tracer recovery. Figure 24b shows the impact of initial water saturation on water-soluble tracer recovery. Lower water saturation reduces the water rate and water-soluble tracer production during flowback, and the tracer recovery decreases with a decrease in initial water saturation in the reservoir.

4.5. Tracer Recovery vs. Hydrocarbon Production

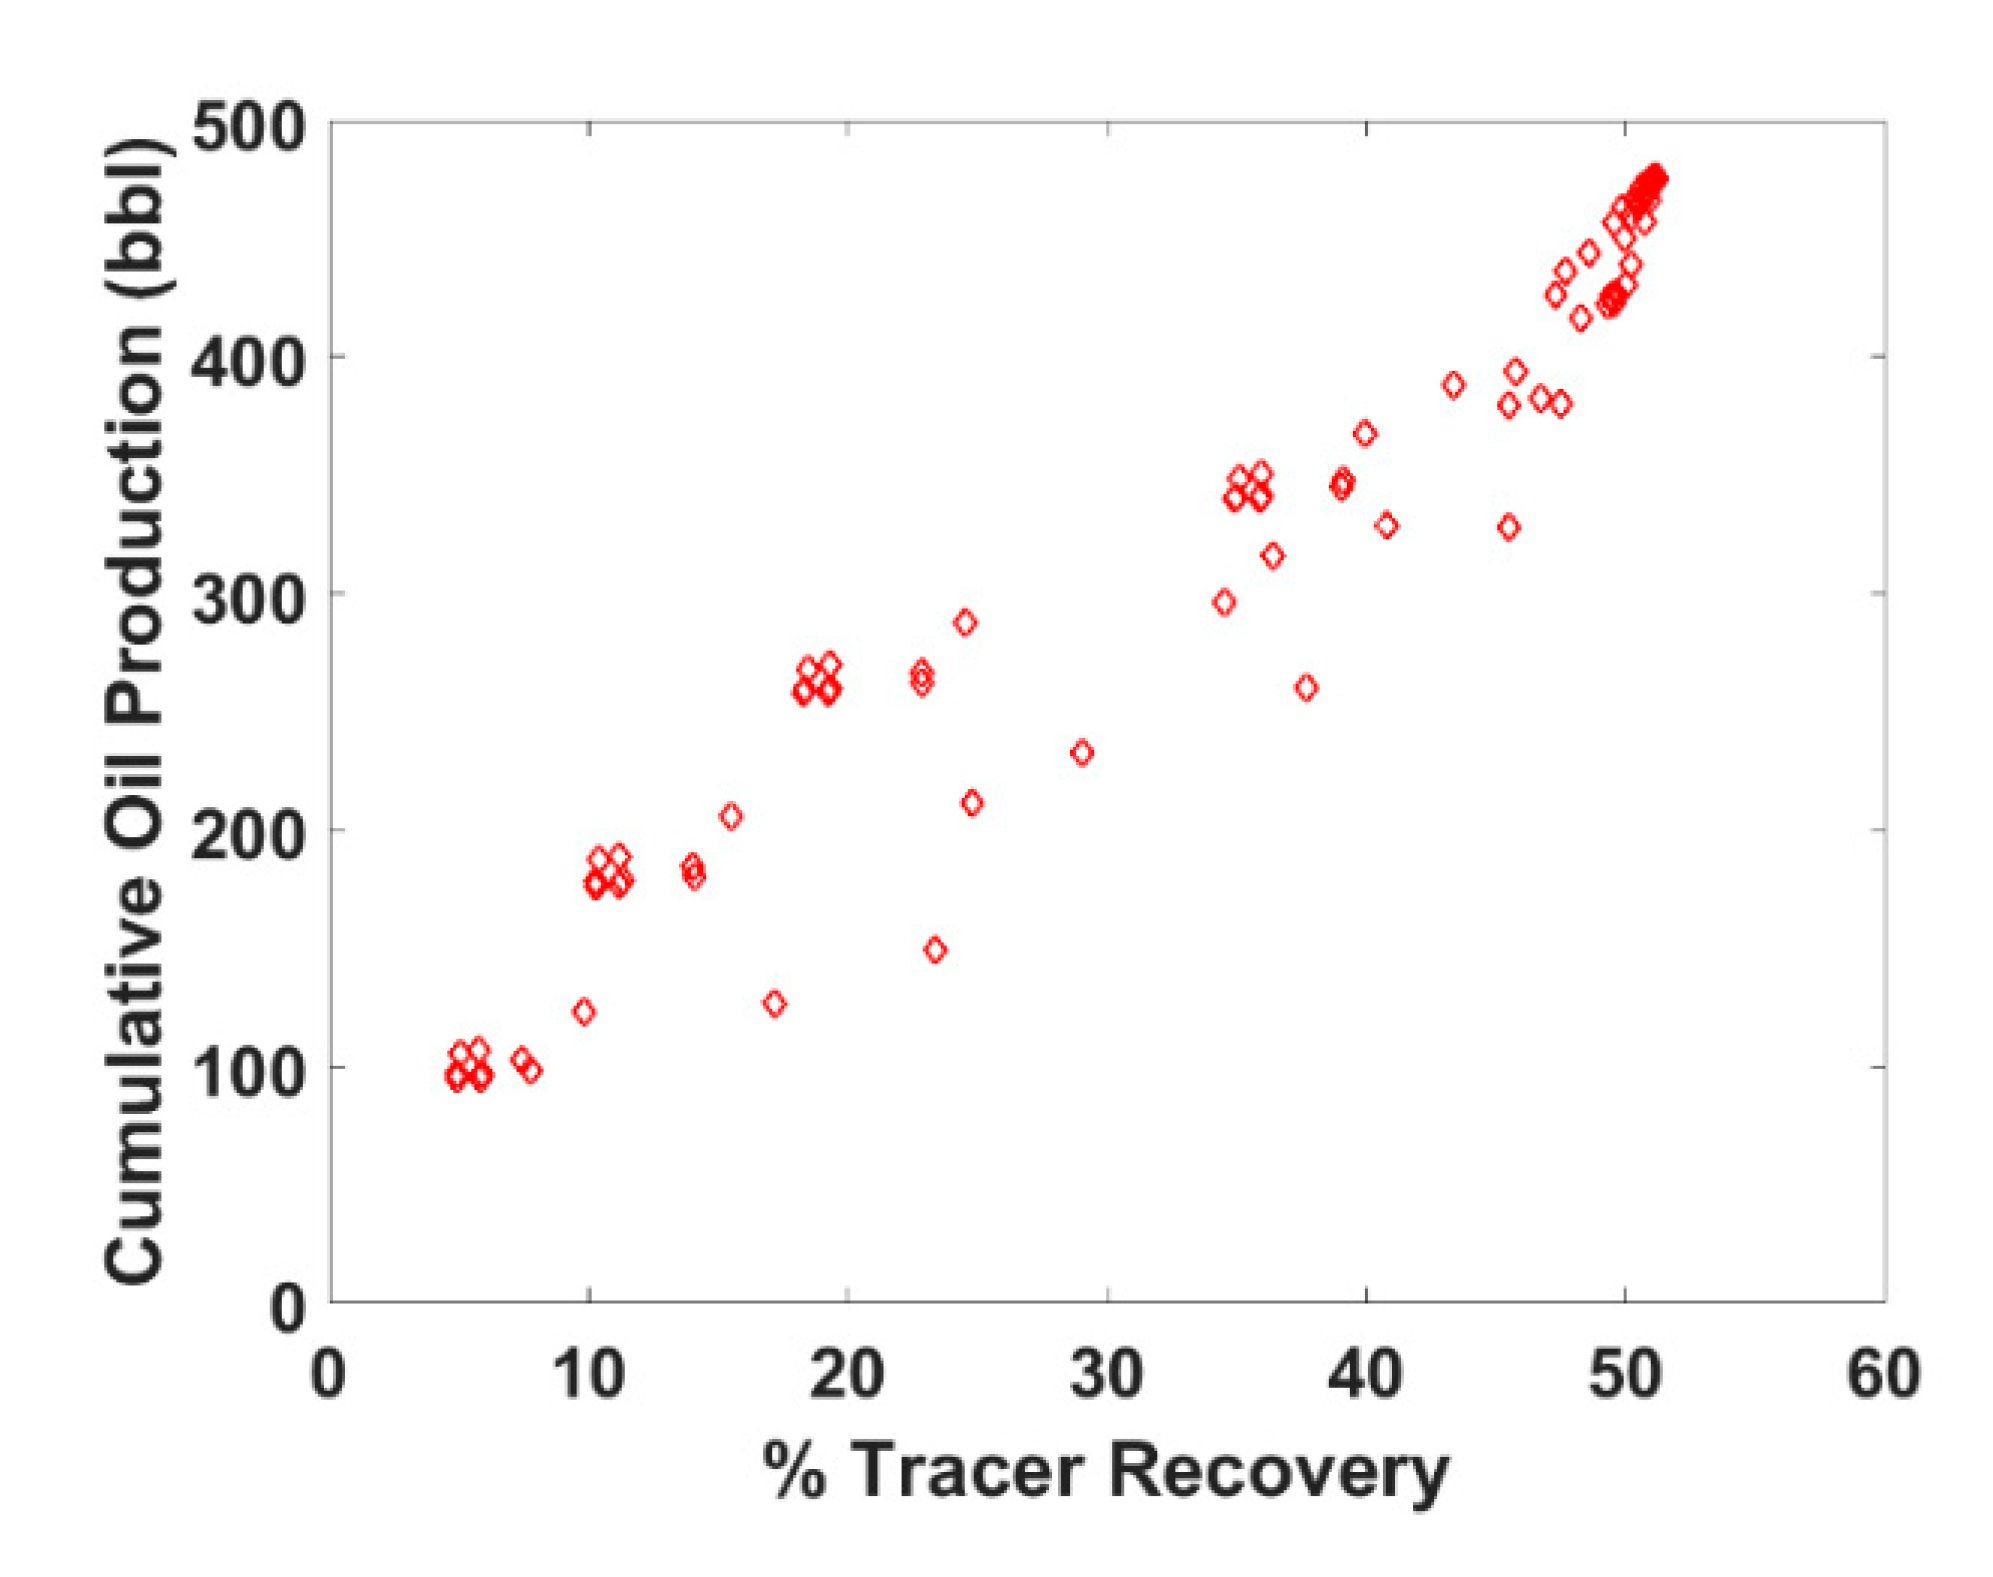
For the sensitivity analysis, we varied effective model parameters, and simulated 176 cases. The cumulative oil production vs. tracer recovery was plotted for these simulation cases as shown in Figure 25. It was observed that there is a strong correlation between production from a stage and the tracer recovery from that stage. This information can be used to calculate the contribution of a stage to the overall flow from a multi-fractured well.

4.6. Inverse Modeling with Neural Network

Based on the forward modeling of tracer injection and flowback, the importance of fracture closure on tracer response curves and hydrocarbon production has been identified. In this section, an inverse modeling approach is discussed to estimate the fracture parameters from a given set of tracer data.
In our effective model (Figure 26), there are six parameters, length, and permeability of all three segments. K1, K2, and K3 are permeabilities of the fracture segments, and LF1, LF2, and LF3 are lengths of the three fracture segments. These large number of parameters makes the inverse problem very difficult. These parameters were lumped to simplify the inverse problem. It is known that the flow from a fracture segment is proportional to the fracture length and permeability of the segment. However, the permeability of a segment will also affect the flow from the segments behind it. Based on these directional correlations, the fracture lengths and permeabilities were combined to define a lumped parameter called the effective connected fracture length (Equation (17)). Effective connected fracture length can be defined as follows:
E f f e c t i v e   C o n n e c t e d   F r a c t u r e   L e n g t h =   log K 1 log K f [ L F 1 + log K 2 log K f { L F 2 + log K 3 log K f ( L F 3 ) } ]
where Kf is the propped fracture permeability. It was observed that lumping all parameters to a single parameter (effective connected fracture length) helps in finding a better fit to the tracer recovery (Figure 27). The lumped parameter has a good correlation with tracer recovery, and it can be used to predict production.
The inverse problem was formulated to estimate the effective connected fracture length from the following observations from a tracer test:
  • Tracer recovery
  • Number of peaks
  • First peak concentration
  • First peak time
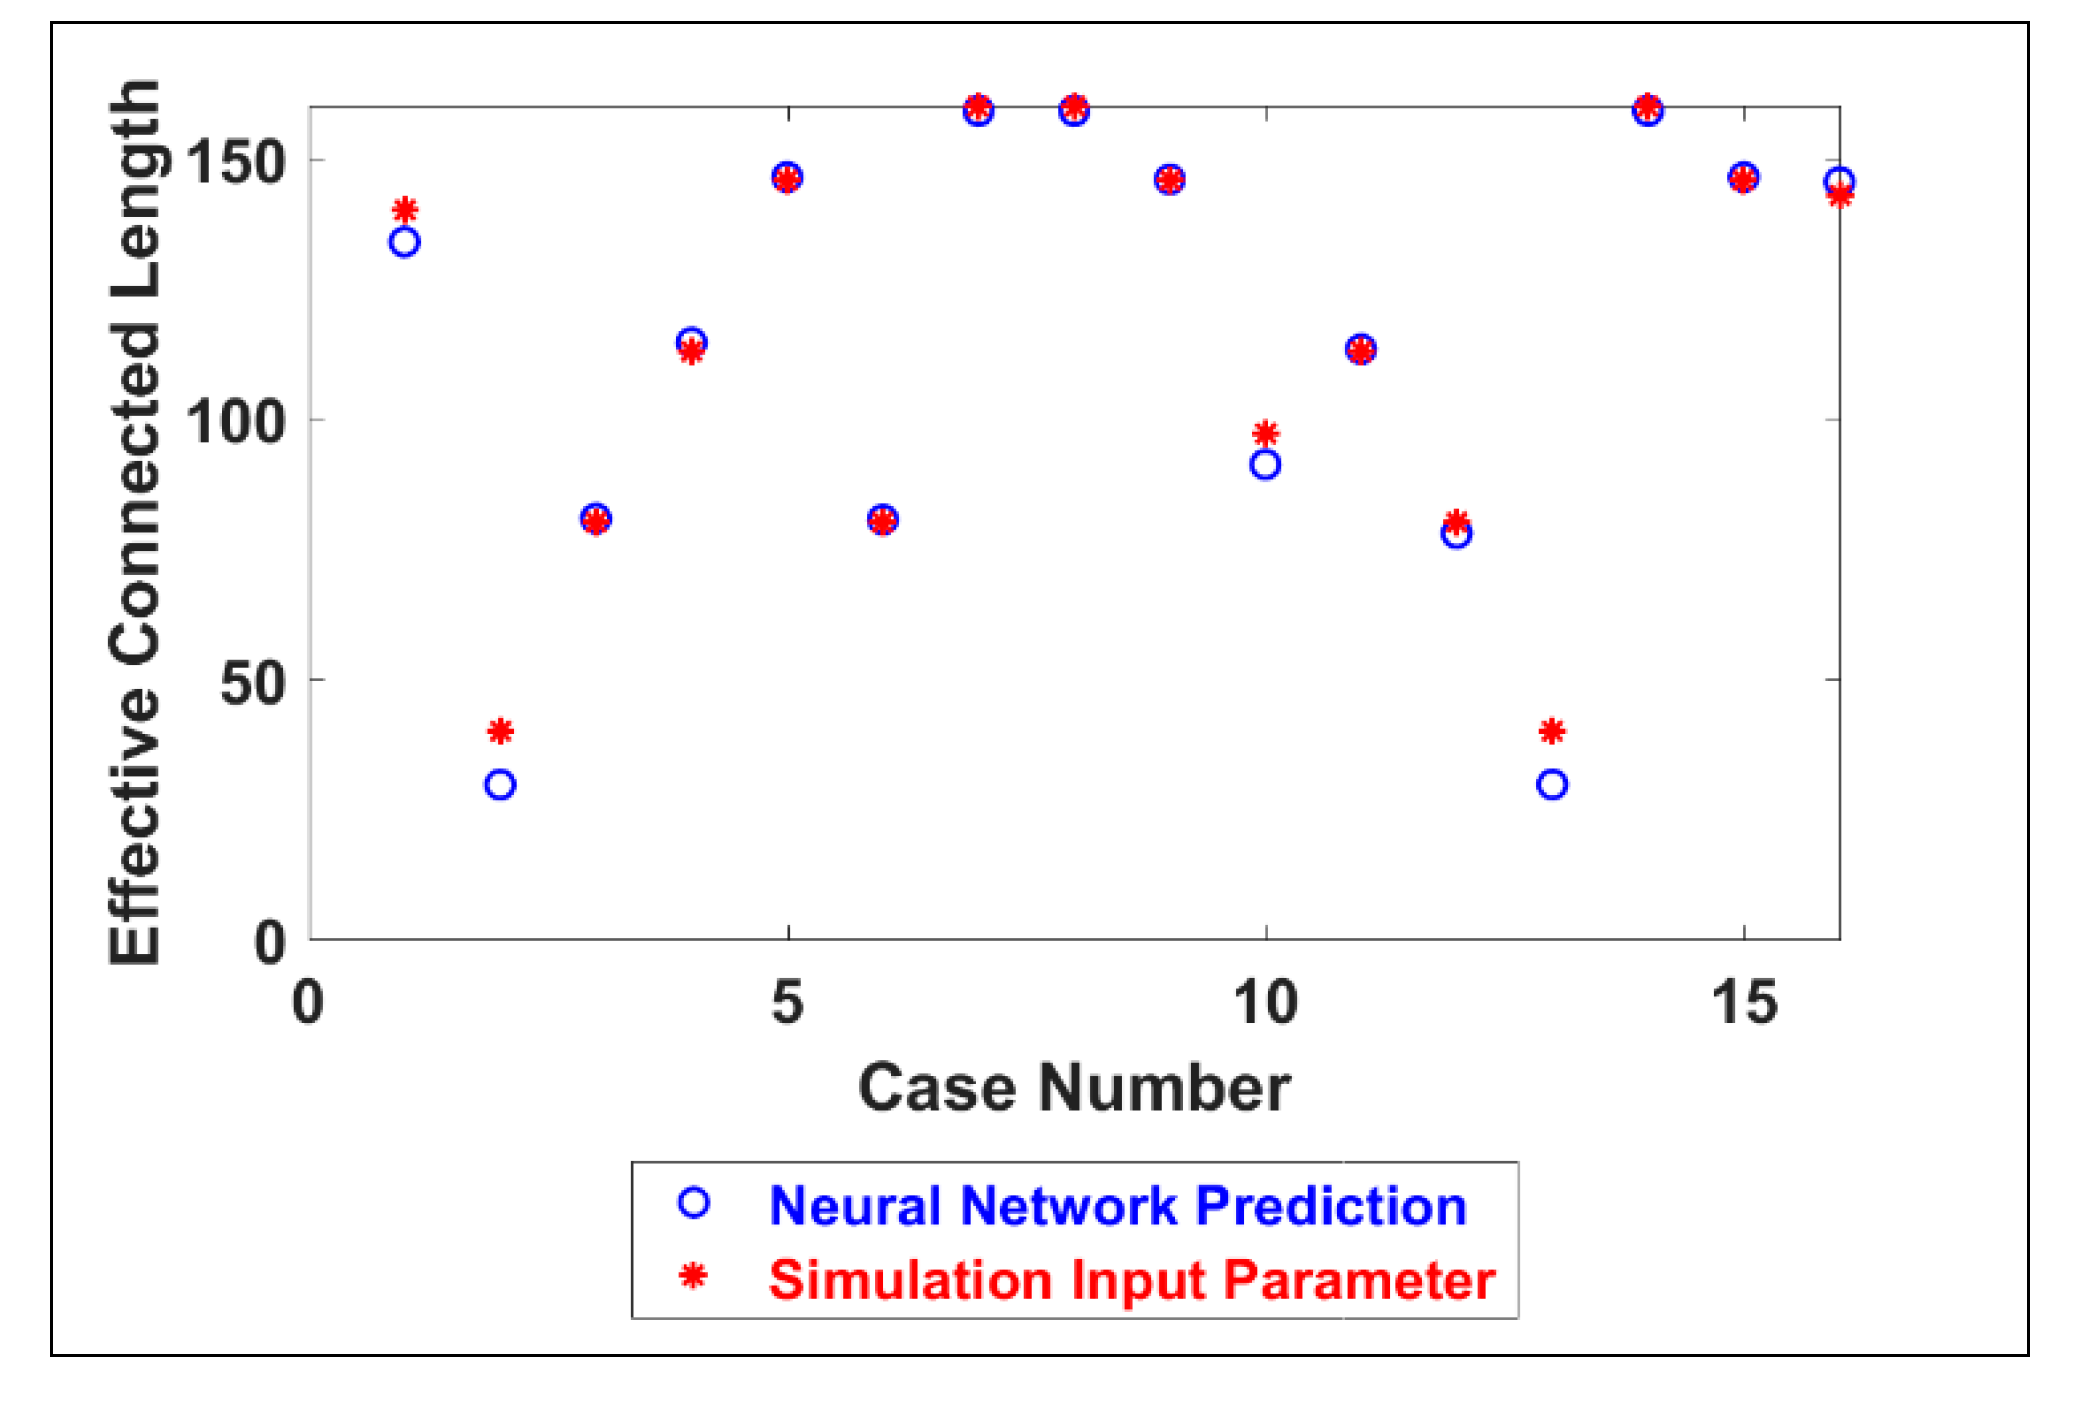
A neural network-based inverse model was used. The neural network was trained for a set of known tracer response curves and the effective connected fracture length from the simulation cases. The trained neural network was then used for estimating the effective connected fracture length for cases not included in the training. Figure 28 shows that the trained neural network prediction has a good match (error around 5%) with the effective connected fracture length used as the simulation input. A similar type of inverse model can be used for data from an actual field tracer test to estimate the effective connected fracture length. This parameter has a good correlation with the cumulative production.

5. Conclusions

Understanding the connectivity of a hydraulic fracture network to the wellbore is important while analyzing multi-fractured well performance. In this paper, a tracer flowback based method is proposed to estimate the open connected fracture area in a created fracture network. An effective model was used to simulate tracer injection and flowback from a complex fracture network. IU fracture closure due to geomechanical effects was modeled using the Barton-Bandis fracture closure model. A sensitivity analysis was performed to quantify the impact of fracture closure on tracer response curves, tracer recovery, and hydrocarbon production. Important conclusions drawn from this paper are presented below:
  • Multiple peaks in the tracer response curves can be explained by the closure of IU fractures during flowback.
  • Tracer recovery (%) and the number of peaks can help determine the fraction of the created fracture area that is open and connected to the wellbore.
  • Early time peaks correlate with fracture closure occurring near the wellbore. Late time peaks are observed due to tracer flowback from fractures that are connected to the wellbore through IU fractures.
  • The area under the early time peak is directly correlated with the fraction of created fracture area that is in good hydraulic communication with the wellbore.
  • The area under later peaks is related to the area of the fracture that is only connected to the wellbore through induced unpropped (IU) fractures. The timing of these peaks is related to the conductivity of the IU fractures.
  • Low tracer recovery typically observed in the field can be explained by the closure of induced unpropped fractures and low initial water saturation in the reservoir.
  • Production from a stage is directly proportional to the tracer recovery from that stage. This can help in comparing the production performance of a fracture stage with respect to overall flow from a multi-fractured well.

Author Contributions

A.K. and M.M.S. conceived the research idea. A.K. developed the numerical tracer transport model. A.K. performed the simulations, documented the results, and analyzed the data. M.M.S. supervised the research. All authors have read and agreed to the published version of the manuscript.

Funding

This research received no external funding.

Acknowledgments

The authors would like to acknowledge the funding and support from the member companies of the Hydraulic Fracturing and Sand Control Joint Industry Consortium at the University of Texas at Austin.

Conflicts of Interest

The authors declare no conflict of interest.

References

  1. Warpinski, R.N.; Sullivan, R.B.; Uhl, J.; Waltman, C.; Machovoie, S. Improved microseismic fracture mapping using perforation timing measurements for velocity calibration. SPE J. 2005, 10, 14–23. [Google Scholar] [CrossRef]
  2. Mayerhofer, J.M.; Lolon, E.P.; Youngblood, J.E.; Heinze, J.R. Integration of microseismic-fracture-mapping results with numerical fracture network production modeling in the Barnett Shale. In Proceedings of the SPE Annual Technical Conference and Exhibition, San Antonio, TX, USA, 24–27 September 2006; Society of Petroleum Engineers: Richardson, TX, USA, 2006. [Google Scholar] [CrossRef]
  3. Wright, A.C.; Davis, E.J.; Golich, G.M.; Ward, J.F.; Demetrius, S.L.; Minner, W.A.; Weijers, L. Downhole tiltmeter fracture mapping: Finally measuring hydraulic fracture dimensions. In Proceedings of the SPE Western Regional Meeting, Bakersfield, CA, USA, 10–13 May 1998; Society of Petroleum Engineers: Richardson, TX, USA, 1998. [Google Scholar] [CrossRef]
  4. Cipolla, L.C.; Mayerhofer, M. Understanding fracture performance by integrating well testing & fracture modeling. In Proceedings of the SPE Annual Technical Conference and Exhibition, New Orleans, LA, USA, 27–30 September 1998; Society of Petroleum Engineers: Richardson, TX, USA, 1998. [Google Scholar] [CrossRef]
  5. Scott, P.M.; Johnson, R.L.; Datey, A.; Vandenborn, C.B.; Woodroof, A.R. Evaluating hydraulic fracture geometry from sonic anisotropy and radioactive tracer logs. In Proceedings of the SPE Asia Pacific Oil and Gas Conference and Exhibition, Brisbane, Australia, 18–20 October 2010; Society of Petroleum Engineers: Richardson, TX, USA, 2010. [Google Scholar] [CrossRef]
  6. Gardien, J.C.; Pope, G.A.; Hill, A.D. Hydraulic fracture diagnosis using chemical tracers. In Proceedings of the SPE Annual Technical Conference and Exhibition, Denver, CO, USA, 6–9 October 1996; Society of Petroleum Engineers: Richardson, TX, USA, 1996. [Google Scholar]
  7. Leong, Y.; de Iongh, J.E.; Bähring, S.; Tuxen, A.K.; Nielsen, T.B. Estimation of fracture volume between well pairs using deuterium tracer. In Proceedings of the SPE Annual Technical Conference and Exhibition, Houston, TX, USA, 28–30 September 2015; Society of Petroleum Engineers: Richardson, TX, USA, 2015. [Google Scholar]
  8. Awada, A.; Santo, M.; Lougheed, D.; Xu, D.; Virues, C. Is That Interference? A Workflow for Identifying and Analyzing Communication Through Hydraulic Fractures in a Multi-Well Pad. In Proceedings of the Unconventional Resources Technology Conference, San Antonio, TX, USA, 20–22 July 2015. [Google Scholar] [CrossRef]
  9. Seth, P.; Manchanda, R.; Kumar, A.; Sharma, M. Estimating hydraulic fracture geometry by analyzing the pressure interference between fractured horizontal wells. In Proceedings of the SPE Annual Technical Conference and Exhibition, Dallas, TX, USA, 24–26 September 2018; Society of Petroleum Engineers: Richardson, TX, USA, 2018. [Google Scholar]
  10. Seth, P.; Shrivastava, K.; Kumar, A.; Sharma, M.M. Pressure Interference between Fractured Horizontal Wells: Impact of Complex Fracture Growth on Offset Well Pressure Measurements. In Proceedings of the 53rd US Rock Mechanics/Geomechanics Symposium, New York, NY, USA, 23–26 June 2019; American Rock Mechanics Association: Alexandria, VA, USA, 2019. [Google Scholar]
  11. Carey, A.M.; Mondal, S.; Sharma, M.M. Analysis of water hammer signatures for fracture diagnostics. In Proceedings of the SPE Annual Technical Conference and Exhibition, Houston, TX, USA, 28–30 September 2015; Society of Petroleum Engineers: Richardson, TX, USA, 2015. [Google Scholar] [CrossRef]
  12. Du, Y.; Guan, L. Interwell tracer tests: Lessons learnted from past field studies. In Proceedings of the SPE Asia Pacific Oil and Gas Conference and Exhibition, Jakarta, Indonesia, 5–7 April 2005; Society of Petroleum Engineers: Richardson, TX, USA, 2005. [Google Scholar] [CrossRef]
  13. Wagner, O.R. The use of tracers in diagnosing interwell reservoir heterogeneities-Field results. J. Petrol. Technol. 1977, 29, 1–410. [Google Scholar] [CrossRef]
  14. Deans, H.A. Method of Determining Fluid Saturations in Reservoirs. U.S. Patent 3,623,842, 30 November 1971. [Google Scholar]
  15. Khaledialidusti, R.; Kleppe, J. A comprehensive framework for the theoretical assessment of the single-well-chemical-tracer tests. J. Petrol. Sci. Eng. 2017, 159, 164–181. [Google Scholar] [CrossRef]
  16. Mulkern, E.M.; Asadi, M.; McCallun, S. Fracture extent and zonal communication evaluation using chemical gas tracers. In Proceedings of the SPE Eastern Regional Meeting, Morgantown, WV, USA, 12–14 October 2010; Society of Petroleum Engineers: Richardson, TX, USA, 2010. [Google Scholar] [CrossRef]
  17. Kumar, A.; Seth, P.; Shrivastava, K.; Manchanda, R.; Sharma, M.M. Well interference diagnosis through integrated analysis of tracer and pressure interference tests. In Proceedings of the Unconventional Resources Technology Conference, Houston, TX, USA, 23–25 July 2018; Society of Exploration Geophysicists: Houston, TX, USA; American Association of Petroleum Geologists: Tulsa, OK, USA; Society of Petroleum Engineers: Richardson, TX, USA, 2018; pp. 1404–1415. [Google Scholar] [CrossRef]
  18. Kumar, A.; Seth, P.; Shrivastava, K.; Manchanda, R.; Sharma, M.M. Integrated Analysis of Tracer and Pressure-Interference Tests To Identify Well Interference. SPE J. 2020. [Google Scholar] [CrossRef]
  19. Catlett, D.R.; Spencer, J.D.; Lolon, E.; Bucior, D. Evaluation of two horizontal wells in the eagle ford using oil-based chemical tracer technology to optimize stimulation design. In Proceedings of the SPE Hydraulic Fracturing Technology Conference, The Woodlands, TX, USA, 4–6 February 2013; Society of Petroleum Engineers: Richardson, TX, USA, 2013. [Google Scholar] [CrossRef]
  20. Goswick, A.R.; LaRue, J.L. Utilizing oil soluble tracers to understand stimulation efficiency along the lateral. In Proceedings of the SPE Annual Technical Conference and Exhibition, Amsterdam, The Netherlands, 27–29 October 2014; Society of Petroleum Engineers: Richardson, TX, USA, 2014. [Google Scholar] [CrossRef] [Green Version]
  21. Elahi, H.S.; Jafarpour, B. Dynamic fracture characterization from tracer-test and flow-rate data with ensemble Kalman filter. SPE J 2018, 23, 449–466. [Google Scholar] [CrossRef]
  22. Tian, W.; Shen, T.; Liu, J.; Wu, X. Hydraulic fracture diagnosis using partitioning tracer in shale gas reservoir. In Proceedings of the SPE Asia Pacific Hydraulic Fracturing Conference, Beijing, China, 24–26 August 2016; Society of Petroleum Engineers: Richardson, TX, USA, 2016. [Google Scholar]
  23. Li, L.; Pinprayong, V.; Meng, F.; Jiang, H.; Li, J. Fracture Network Evaluation Using Tracer Flowback: A Case Study. In Proceedings of the SPE Symposium: Production Enhancement and Cost Optimisation, Kuala Lumpur, Malaysia, 7–8 November 2017; Society of Petroleum Engineers: Richardson, TX, USA, 2017. [Google Scholar]
  24. Li, L.; Jiang, H.; Wu, K.; Li, J.; Chen, Z. An analysis of tracer flowback profiles to reduce uncertainty in fracture-network geometries. J. Petrol. Sci. Eng. 2019, 173, 246–257. [Google Scholar] [CrossRef]
  25. Zheng, S.; Kumar, A.; Gala, D.P.; Shrivastava, K.; Sharma, M.M. Simulating Production from Complex Fracture Networks: Impact of Geomechanics and Closure of Propped/Unpropped Fractures. In Proceedings of the Unconventional Resources Technology Conference, Denver, CO, USA, 22–24 July 2019; Society of Exploration Geophysicists: Houston, TX, USA, 2019; pp. 2322–2338. [Google Scholar] [CrossRef]
  26. Agca, C.; Pope, G.A.; Sepehrnoori, K. Modelling and analysis of tracer flow in oil reservoirs. J. Petrol. Sci. Eng. 1990, 4, 3–19. [Google Scholar] [CrossRef]
  27. Bryant, C.E.; Hwang, J.; Sharma, M.M. Arbitrary fracture propagation in heterogeneous poroelastic formations using a finite volume-based cohesive zone model. In Proceedings of the SPE Hydraulic Fracturing Technology Conference, The Woodlands, TX, USA, 3–5 February 2015; Society of Petroleum Engineers: Richardson, TX, USA, 2015. [Google Scholar] [CrossRef]
  28. Bandis, C.S.; Lumsden, A.C.; Barton, N.R. Fundamentals of rock joint deformation. Int. J. Rock Mech. Min. Sci. Geomech. Abstr. 1983, 20, 249–268. [Google Scholar] [CrossRef]
  29. Seth, P.; Kumar, A.; Manchanda, R.; Shrivastava, K.; Sharma, M.M. Hydraulic Fracture Closure in a Poroelastic Medium and its Implications on Productivity. In Proceedings of the 52nd US Rock Mechanics/Geomechanics Symposium, Seattle, WA, USA, 17–20 June 2018; American Rock Mechanics Association: Alexandria, VA, USA, 2018. [Google Scholar]
  30. Lake, L.W. Enhanced Oil Recovery; Prentice Hall: Upper Saddle River, NJ, USA, 1989. [Google Scholar]
  31. Jin, M.; Delshad, M.; Dwarakanath, V.; McKinney, D.C.; Pope, G.A.; Sepehrnoori, K.; Tilburg, C.E.; Jackson, R.E. Partitioning tracer test for detection, estimation, and remediation performance assessment of subsurface nonaqueous phase liquids. Water Resour. Res. 1995, 31, 1201–1211. [Google Scholar] [CrossRef]
  32. Zemel, B. Tracers in the Oil Field; Elsevier: Amsterdam, The Netherlands, 1995. [Google Scholar]
  33. Bryant, E.C. Hydraulic Fracture Modeling with Finite Volumes and Areas. Ph.D. Thesis, The University of Texas at Austin, Austin, TX, USA, 2016. [Google Scholar]
  34. Zheng, S.; Manchanda, R.; Sharma, M.M. Development of a fully implicit 3-D geomechanical fracture simulator. J. Petrol. Sci. Eng. 2019, 179, 758–775. [Google Scholar] [CrossRef]
  35. Saad, Y.; Schultz, M.H. GMRES: A generalized minimal residual algorithm for solving nonsymmetric linear systems. SIAM J. Sci. Stat. Comput. 1986, 7, 856–869. [Google Scholar] [CrossRef] [Green Version]
  36. Saad, Y. ILUT: A dual threshold incomplete LU factorization. Numer. Linear Algebra Appl. 1994, 1, 387–402. [Google Scholar] [CrossRef]
  37. King, E.G.; Leonard, D. Utilizing fluid and proppant tracer results to analyze multi-fractured well flow back in shales: A framework for optimizing fracture design and application. In Proceedings of the SPE Hydraulic Fracturing Technology Conference, The Woodlands, TX, USA, 24–26 January 2011. [Google Scholar] [CrossRef]
  38. Johnston, B.P.; Atkinson, T.C.; Odling, N.E.; Barker, J.A. Models of tracer breakthrough and permeability in simple fractured porous media. Geol. Soc. Lond. Spec. Publ. 2005, 249, 91–102. [Google Scholar] [CrossRef]
  39. Fisher, K.M.; Wright, C.A.; Davidson, B.M.; Goodwin, A.K.; Fielder, E.O.; Buckler, W.S.; Steinsberger, N.P. Integrating fracture mapping technologies to optimize stimulations in the Barnett Shale. In Proceedings of the SPE Annual Technical Conference and Exhibition, San Antonio, TX, USA, 29 September–2 October 2002; Society of Petroleum Engineers: Richardson, TX, USA, 2002. [Google Scholar] [CrossRef]
  40. Weng, X.; Kresse, O.; Cohen, C.E.; Wu, R.; Gu, H. Modeling of hydraulic fracture network propagation in a naturally fractured formation. In Proceedings of the SPE Hydraulic Fracturing Technology Conference, The Woodlands, TX, USA, 24–26 January 2011; Society of Petroleum Engineers: Richardson, TX, USA, 2011. [Google Scholar] [CrossRef]
  41. Shrivastava, K.; Sharma, M.M. Mechanisms for the formation of complex fracture networks in naturally fractured rocks. In Proceedings of the SPE Hydraulic Fracturing Technology Conference and Exhibition, The Woodlands, TX, USA, 23–25 January 2018; Society of Petroleum Engineers: Richardson, TX, USA, 2018. [Google Scholar]
  42. Shrivastava, K.; Agrawal, S.; Kumar, A.; Sharma, M.M. 3-D interactions of hydraulic fractures with natural fractures. In Proceedings of the SPE International Hydraulic Fracturing Technology Conference and Exhibition, Muscat, Oman, 16–18 October 2018; Society of Petroleum Engineers: Richardson, TX, USA, 2018. [Google Scholar]
  43. Sharma, M.M.; Manchanda, R. The role of induced un-propped (IU) fractures in unconventional oil and gas wells. In Proceedings of the SPE Annual Technical Conference and Exhibition, Houston, TX, USA, 28–30 September 2015; Society of Petroleum Engineers: Richardson, TX, USA, 2015. [Google Scholar] [CrossRef]
  44. Kumar, A.; Seth, P.; Shrivastava, K.; Sharma, M.M. Optimizing drawdown strategies in wells producing from complex fracture networks. In Proceedings of the SPE International Hydraulic Fracturing Technology Conference and Exhibition, Muscat, Oman, 16–18 October 2018; Society of Petroleum Engineers: Richardson, TX, USA, 2018. [Google Scholar] [CrossRef]
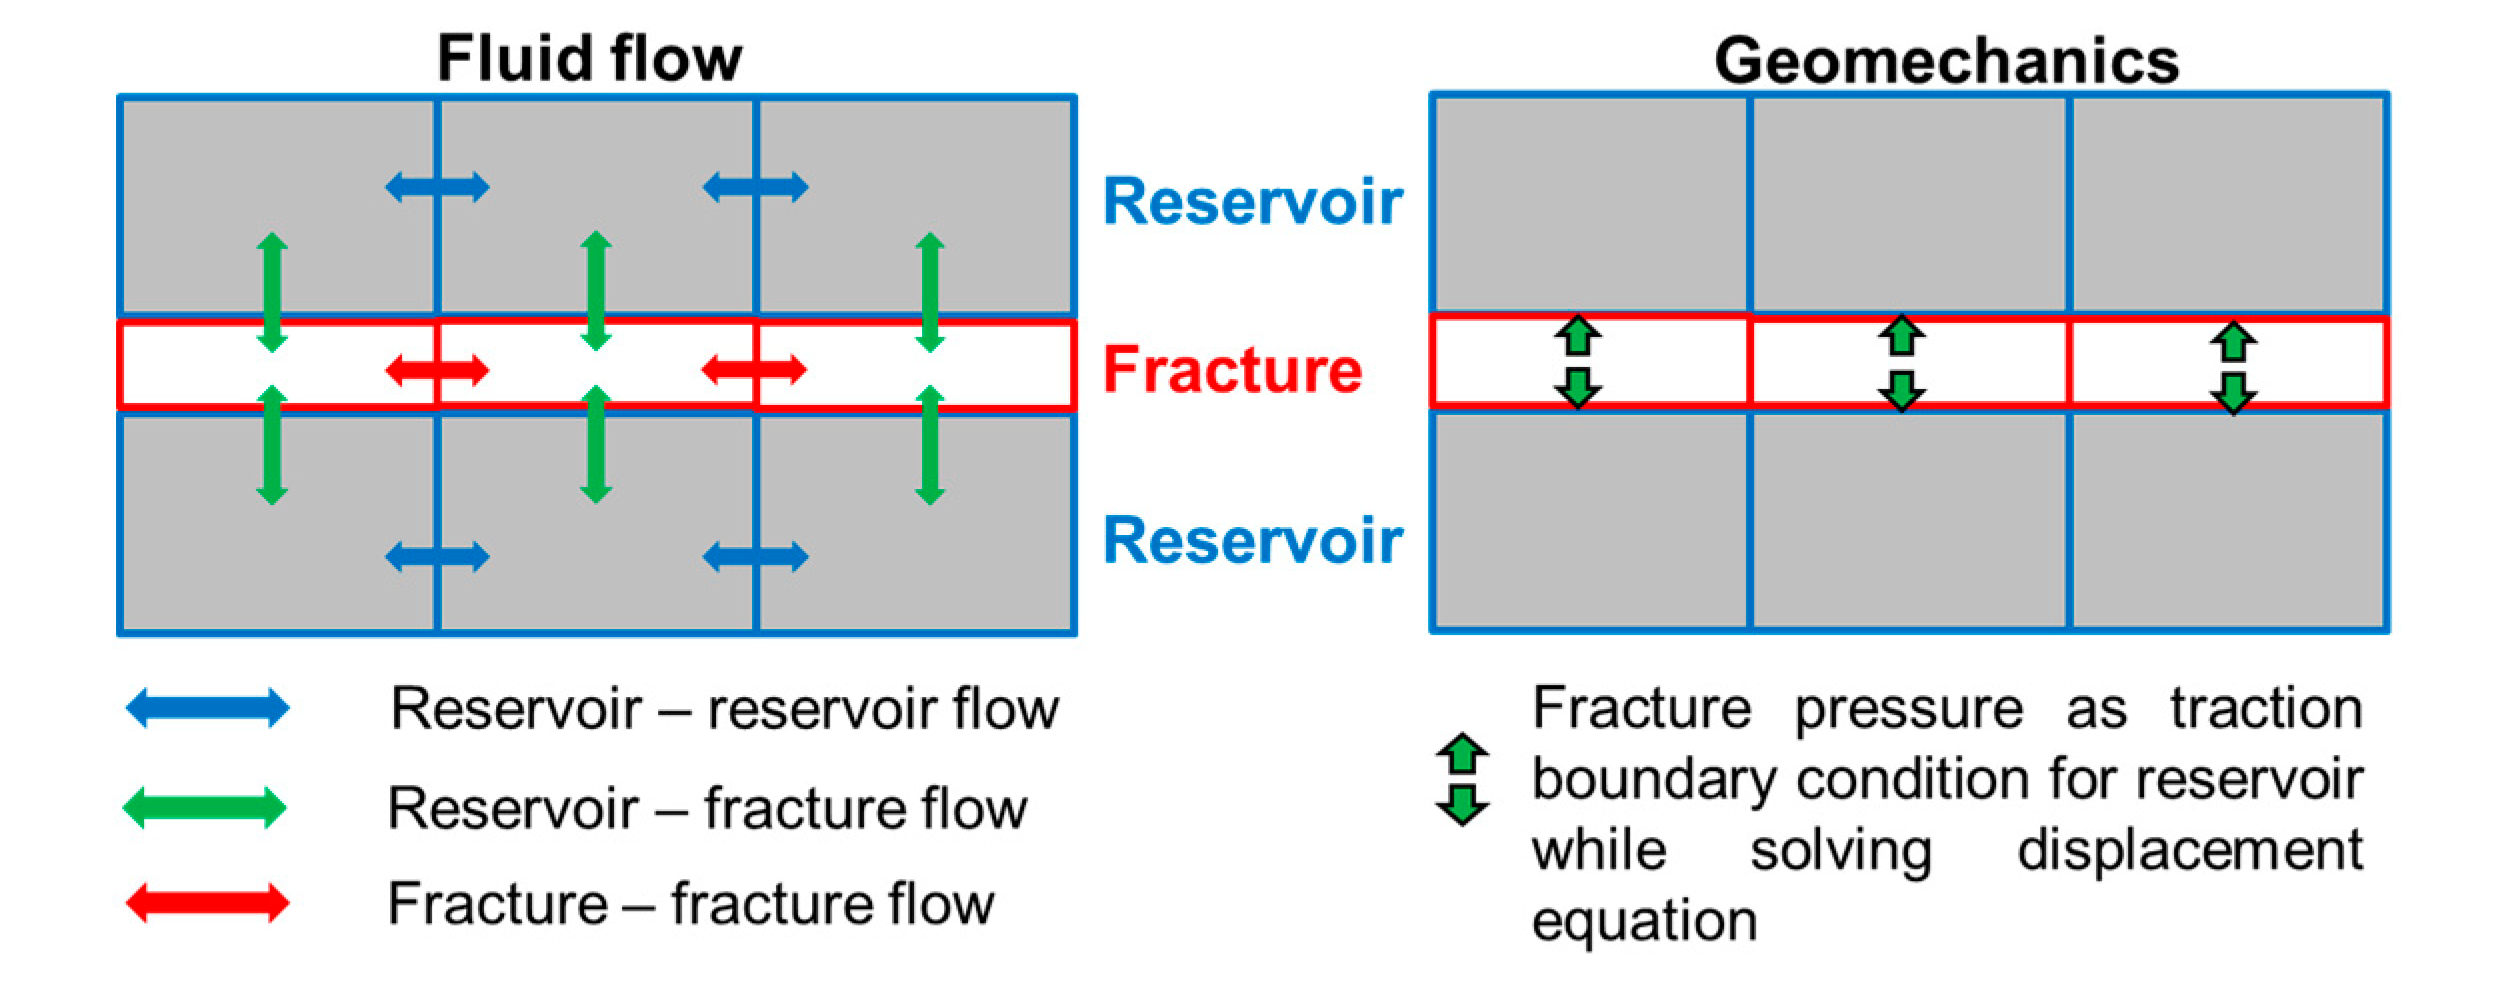
Figure 1. Fluid flow and geomechanics coupling between reservoir and fracture domains.
Energies 13 05644 g001
Figure 2. Matrix structure for the coupled reservoir and fracture domain tracer equations.
Energies 13 05644 g002
Figure 3. Block flow diagram for the tracer transport model integrated in the geomechanical reservoir simulator.
Energies 13 05644 g003
Figure 4. Slug injection in a propagating planar fracture. Fracture surface plane is shown at different times during fracture propagation.
Energies 13 05644 g004
Figure 5. Tracer response curve from a slug injection tracer flowback.
Energies 13 05644 g005
Figure 6. Tracer response curves during flowback for several reservoir permeability cases. An increase in reservoir permeability leads to an early peak and a decrease in the peak tracer concentration.
Energies 13 05644 g006
Figure 7. Peak tracer concentration vs. fracture half-length.
Energies 13 05644 g007
Figure 8. Time at which peak tracer concentration is observed increases with an increase in the fracture length.
Energies 13 05644 g008
Figure 9. Flowback tracer recovery vs. time when fracture closure is not modeled.
Energies 13 05644 g009
Figure 10. Fracture closure rate is controlled by stiffness (Kni).
Energies 13 05644 g010
Figure 11. Impact of fracture stiffness (rate of fracture closure) on the tracer response curve.
Energies 13 05644 g011
Figure 12. Flowback tracer recovery vs. time for several fracture stiffness values.
Energies 13 05644 g012
Figure 13. Percentage tracer recovered decreases with a decrease in the fracture stiffness. At lower fracture stiffness, fracture closure is faster, and this leads to tracer retention in the fracture and the reservoir.
Energies 13 05644 g013
Figure 14. A simulation model for a multifractured well with secondary fractures.
Energies 13 05644 g014
Figure 15. Effect of fracture complexity on tracer recovery.
Energies 13 05644 g015
Figure 16. Tracer response curve from a multi-fractured well having 15 stages. Each stage was tagged with a unique chemical tracer.
Energies 13 05644 g016
Figure 17. Tracer response curve divided into two categories. Plot (a) shows stages having a single early peak. Plot (b) shows stages having multiple peaks.
Energies 13 05644 g017
Figure 18. Complex fracture network created in the presence of natural fractures [30] (a). Hydraulic fractures and activated natural fractures in a complex fracture network (b).
Energies 13 05644 g018
Figure 19. Fractures in a complex fracture network categorized based on the connectivity of a fracture to the wellbore.
Energies 13 05644 g019
Figure 20. Complex fracture network simplified to an effective model.
Energies 13 05644 g020
Figure 21. The impact of fracture stiffness (closure rate) on tracer response curves from a complex fracture.
Energies 13 05644 g021
Figure 22. Impact of residual fracture permeability of IU fractures on tracer response curves.
Energies 13 05644 g022
Figure 23. Impact of open connected (FOC) fracture area on tracer response curves.
Energies 13 05644 g023
Figure 24. Impact of open connected (FOC) fracture area on tracer recovery (a). Effect of initial water saturation on tracer recovery (b).
Energies 13 05644 g024
Figure 25. Cumulative oil production vs. tracer recovery.
Energies 13 05644 g025
Figure 26. Effective model representing three fracture segments.
Energies 13 05644 g026
Figure 27. Advantage of lumping the fracture lengths and permeabilities to a single parameter (effective connected fracture length). The left plot shows a very weak correlation between tracer recovery and first connected fracture length. The right plot shows that lumping the parameters helps in finding a good correlation to the tracer recovery.
Energies 13 05644 g027
Figure 28. Inverse model prediction comparison with the simulation input parameters.
Energies 13 05644 g028
Table 1. Reservoir and geomechanical properties for tracer flowback simulations.
PropertyValue
Porosity0.1
Reservoir PermeabilityVaried from 10 nD to 5 µD
Initial Reservoir Pressure40 MPa
Young’s Modulus20 GPa
Maximum Horizontal Stress (SHmax)52 MPa
Minimum Horizontal Stress (Shmin)50 MPa
Fracturing Fluid Injection Rate10−4 m3/sec
Total Injection Time30 Minutes
Injected Tracer Concentration0.01 by volume
Flowback Pressure20 MPa
Publisher’s Note: MDPI stays neutral with regard to jurisdictional claims in published maps and institutional affiliations.