Abstract
Using sodium metal in sodium-oxygen batteries with aprotic electrolyte enables achieving a very high theoretical energy density. However, the promised values for energy density and capacity are not met in practical studies yet due to poor utilization of the void space in the cathode during battery discharge. In this work, we achieve better cathode utilization and higher discharge capacities by using pulse discharging. We optimize the chosen resting-to-pulse times, the applied current density, and elucidate that three-dimensional cathode materials yield higher capacities compared to two-dimensional ones. By implication, the pulse discharging mode ensures better supply with dissolved oxygen within the cathode. The higher amount of dissolved oxygen accumulated during the resting period after a current pulse is essential to form more of the discharge product, i.e., the metal oxide sodium superoxide. Interestingly, we show for the first time that the superoxide is deposited in a very unusual form of stacked and highly oriented crystal layers. Our findings on the pulse discharging can be transferred to other metal-oxygen battery systems and might assist in achieving their full potential regarding practical energy density.
1. Introduction
In recent years the demand for improved lithium ion batteries (LIBs) has increased, especially in the field of electromobility and portable energy supply. Concerns over limited availability and increasing prices for compounds in the current state-of-the-art LIBs facilitated the research on alternative battery technologies. When aiming for the highest theoretical capacities, the so-called “next generation” batteries, such as metal-oxygen batteries, are considered as a viable addition to the already established metal-ion batteries [1].
Due to the significantly higher abundance of Na compared to Li combined with a high theoretical energy density of 1105 Wh/kg [2], sodium-oxygen batteries (Na/O2 batteries) are discussed as a viable alternative. Since the first description of a rechargeable Na/O2 battery at room temperature with sodium superoxide (NaO2) as discharge product by Hartmann et al., in 2013, the number of publications increased significantly since then [2,3,4,5]. Despite the promising groundwork, the practical application of Na/O2 batteries is currently not feasible due to fundamental challenges that have to be overcome first. Besides severe dendrite formation [6,7,8,9], poor cyclability [10,11,12], metastability of NaO2 [13,14,15,16,17], and the high reactivity of oxygen species formed during cycling [14,18,19,20,21,22,23], the optimal utilization of cathodes is crucial when aiming for the highest capacities possible.
The limited utilization of typical cathodes in metal-oxygen batteries is attributed to the lack of dissolved O2 in the electrolyte due to its low solubility and a limited diffusivity [24,25,26,27,28,29]. In the end, those limitations can lead to a very uneven distribution and thus poor utilization of free space in the pores of the cathode of Na/O2 batteries [24]. It was shown—both in theoretical and experimental work—that the size of the discharge product in the cathode is very sensitive to the applied electrochemical conditions: At high current densities more but smaller NaO2 cuboids are formed while at lower current densities fewer but larger cuboids are formed [24,30].
One possibility to increase the concentration of dissolved O2 within the electrolyte is to utilize perfluorinated additives [27,28,29]. Another approach to overcome this challenge of limited supply of O2 is presented by Nichols et al., who reported about an improved cathode utilization by increasing the partial pressure of O2 within the battery [26]. Their finding elucidated the importance of locally available dissolved O2 within the cathode, which coincides with the generally accepted solution-mediated growth mechanism for the formation of NaO2 cuboids [3,25,31,32,33,34]. A different approach to achieve a more homogeneous distribution of the discharge product is the introduction of catalysts, which improve the reduction reaction of dissolved oxygen to superoxide ions. Especially in Li/O2 batteries, heterogeneous catalysts were introduced to enhance the reachable discharge capacities and cycling performance [35]. However, recent studies also showed that heterogeneous catalysts also induces the degradation of the electrolyte [36,37]. On the contrary, homogeneous catalysts as redox mediators enhance the cell performance of Me/O2 without inducing cell degradation [38]. In the case of Na/O2 batteries, ethyl viologen has been shown to improve the discharge process by achieving higher discharge capacities at lower over potentials by facilitating the solution-mediated growth of NaO2 [39].
In the following, the solution-mediated growth of NaO2 during discharge is summarized. Dissolved O2 molecules are reduced on the cathode surface, thus forming superoxide ions. These superoxide ions diffuse in the electrolyte and may attach to the surface of an already existing NaO2 cuboid in conjunction with a sodium ion, advancing the growth. Alternatively, a new nucleation process may be initiated if a critical concentration of superoxide and sodium ions is reached locally (the interested reader is referred to Hartmann et al. for further information [25]). With ongoing galvanostatic discharging, the electronically insulating discharge product will cover the cathode surface while the applied overall current density is kept constant. As a result, the local current density will increase over time. Consequently, the growth and size of NaO2 in deeper regions of the cathode is significantly influenced by two factors: higher local current densities and lower supply of O2, leading to smaller and fewer NaO2 cuboids and thus limiting the overall discharge capacity.
We herein present a study on how to improve the availability of O2 in the cathode of Na/O2 batteries by a pulse current discharging (PCD) protocol. Furthermore, we show that the PCD can be used to overcome the bottleneck of locally available O2 by increasing the concentration of O2 within the electrolyte during the resting time periods where no current is applied to the system. In the end, this discharging protocol can be combined with all of the aforementioned approaches [3,25,26,27,28,29,31,32,33,34,35,36,37,38,39] yielding even higher discharge capacities.
2. Materials and Methods
2.1. Battery Setup and Sample Preparation
The Na/O2 battery tests were conducted with a modified Swagelok-T-battery design (Giessen cell), which is described in more detail elsewhere [12,40]. Pieces of pure sodium (BASF SE) rolled and cut to a disk-shape (diameter: 10 mm) were used as anode material. Glass fiber filters (Whatman GF/A; diameter: 12 mm) were used as separator material. They were also used as a reservoir for the 80 µL of electrolyte used. The electrolyte consisted of 1 M sodium trifluoromethanesulfonate (NaOTf; Sigma–Aldrich, Steinheim, Germany; 98%) as conducting salt in bis(2-methoxyethyl) ether (Diglyme; Sigma–Aldrich; anhydrous 99.5%). Diglyme was dried over molecular sieves (pore diameter 3 Å) for a minimum of one week. NaOTf was kept under reduced pressure at 120 °C for 24 h to evaporate water residues. The water content of the electrolytes was determined by the Karl–Fischer titration technique (Deutsche METROHM GmbH & Co. KG, Filderstadt, Germany) to be always below 50 ppm (mass fraction). As cathode material, commercially available binder-free gas diffusion layers (Freudenberg H23C2) with a diameter of 10 mm were used. Additionally, Ketjenblack JD 600D cathodes were utilized whose preparation is described elsewhere [40]. The diameter of the Ketjenblack cathodes was set to 10 mm with a carbon loading ranging between 0.4 and 0.8 mg. All batteries were assembled in an argon-filled glove box (GS Glovebox Systemtechnik, Malsch, Germany) with water content below 0.6 ppm in Ar and O2 content below 1.0 ppm in Ar. Before the electrochemical battery tests, the gas reservoir of the batteries was flushed with 1 bar overpressure of pure O2 (5.0, Linde AG, Pullach, Germany) for 10 s. Subsequently, the gas reservoir was opened for less than one second to reduce the overpressure inside the battery to atmospheric pressure.
2.2. Electrochemical Testing
The Swagelok batteries were investigated galvanostatically in a temperature chamber at 25 °C (298.15 K) with either a battery cycler system 4300 (Maccor, Tulsa, USA) or a VMP3 electrochemical testing unit (BioLogic, Seyssinet-Pariset, France). During continuous discharging the uninterrupted respective current density (i.e., 167 or 500 µA cm−2) was applied to the Swagelok battery after 30 min of open circuit voltage (OCV). The batteries were discharged to a cut-off voltage of 1.6 V vs. Na+/Na.
The discharging protocol for which an uninterrupted current was applied to dissolve the Na anode and form NaO2 within the cathode will be referred to as “continuous discharging” (CD) in the following. When an intermittent current was applied to discharge the Na/O2 battery, the protocol will be referred to as “pulse discharging”.
2.3. Pulse Discharging Protocol
To better introduce the technique of pulse discharging, we briefly describe it in the following and outline implications for battery operation (also cf. Figure 1).
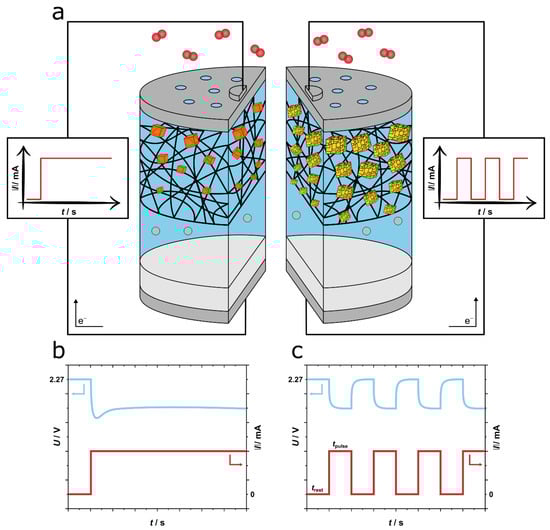
Figure 1.
Illustration of the sodium-oxygen battery and discharging protocols considered in this work: (a) Schematic of the battery with discharge at constant current (left) and discharge at pulse current (right). (b) Qualitative description of the voltage response of a sodium-oxygen battery under constant current discharge and (c) under pulse discharging.
The pulse discharging procedure was conducted galvanostatically by applying a current density within each pulse. In between each respective pulse the battery was resting by setting the current density to zero and allowing the battery to reach OCV. The pulse discharging protocol consists of alternating steps between pulse and resting until a cut-off potential of 1.6 V vs. Na+/Na is reached, thus representing a full discharge.
Compared to a continuous discharging protocol the concentration of O2 within the electrolyte in the cathode is on average higher during pulse discharging. During continuous discharging the concentration of O2 in the cathode is immediately diminished by the reduction of O2 and the subsequent initial nucleaion of NaO2 and a growth phase. Generally, the kinetics for the solubility of O2 and its diffusivity become a limiting factor for the nucleation and growth of NaO2 as the concentration of superoxide ions is significantly lower than the concentration of sodium ions within the electrolyte. In comparison, during pulse discharging the concentration of O2 can rise again within each individual resting period. However, how fast the concentration is restored locally depends on the solubility and diffusivity of O2 in the electrolyte [41]. Consequently, the ratio of resting to pulse time (trest/tpulse) governs the recovery of O2 in the electrolyte. It is mandatory to adjust this resting/pulse time ratio for each individual electrochemical battery and electrolyte composition chosen to gain the full benefit of pulse discharging.
During pulse discharging various intermittent current densities (i.e., 500 and 1500 µA cm−2) were applied after 30 min of an initial period of OCV. The resting time for which no current is applied to the battery was set to 10 s, whereas the pulse time of applied current was adjusted to either 10, 5, 2, 1, or 0.5 s. The batteries were discharged to a cut-off voltage of 1.6 V vs. Na+/Na. The respective current densities applied for each pulse discharging experiment are provided in the results section in Table 1.

Table 1.
Summary of the pulse discharge experiments with Freudenberg H23C2 used as Table 2. For direct comparison, continuous discharging experiments that would be used in a three-battery parallel circuit setup are highlighted in bold.
2.4. SEM Measurements
SEM investigations were conducted using a Merlin high resolution Schottky field emission electron microscope (Zeiss SMT, Oberkochen, Germany). For SEM measurements the batteries were disassembled in the glovebox and the cathodes were washed three times with 50 µL of pure diglyme to remove residues of conducting salt from the cathode surface. Afterwards the cathodes were stored under vacuum to remove the remaining diglyme from the cathodes. These dried cathodes were put on a SEM sample holder and transferred to the SEM via a high vacuum transfer module (EM VCT 500; Leica, Wetzlar, Germany) to avoid exposure to atmosphere.
2.5. Discharge Product Characterization
The discharge product was characterized by a combination of Raman and X-ray diffraction (XRD) measurements. The XRD measurements were conducted using a powder X-ray diffractometer (X’Pert Pro; PANalytical, Alemlo, Netherlands). A Cu Kα X-ray source operated at 40 kV and 40 mA was used for this purpose. Raman spectroscopy was performed using a Senterra Raman microscope (Bruker, Billerica, USA), which is equipped with a Nd:YAG laser (λ = 532 nm) using a laser power of 0.2 mW during measurement.
To protect the air-sensitive samples, a self-made gas-tight sample holder was used, which was sealed with Kapton foil. The respective electrodes were removed from the batteries, washed and dried similar to the samples investigated by SEM.
3. Results and Discussion
3.1. Pulse Discharging Experiments—Aiming for Higher Discharge Capacities
In a first step, we aimed to elucidate the beneficial effect of O2 recovery within the cathode during the resting steps. To do so, various ratios of resting time to pulse time were chosen for the respective Na/O2 batteries. All batteries were discharged with an applied current density of 500 µA cm−2 to a cut-off potential of 1.6 V vs. Na+/Na, and Freudenberg H23C2 cathodes were utilized.
The discharge capacities achieved for pulse discharged batteries as well as continuously discharged batteries are displayed as bar graphs in Figure S1 and summarized in Table 1. By direct comparison, the pulse discharging (yellow bars in Figure S1) leads to significantly higher discharge capacities than continuous discharging (orange bar in Figure S1), when applying the same current density. Additionally, the obtained discharge capacity is higher for higher trest/tpulse ratios. As each battery is resting for 10 s independent of the pulse time, these higher trest/tpulse ratios exemplify that at shorter pulse times the concentration of O2 does not drop too low and can presumably be restored near to its initial maximum concentration during the resting time.
A similar trend of obtainable discharge capacities has been reported by Wang et al., for pulse discharged Li/O2 batteries [42]. However, we extend their findings by elucidating the influence of the trest/tpulse ratio. For very short pulse times of 0.5 and 1 s the obtained capacities are similar at approximately 5.5 mAh. This trend for short pulse times might be attributed to a limitation in accessible surface area at the carbon cathode: the otherwise persistent bottleneck of solubility and diffusivity of O2 is presumably overcome and the available cathode surface is more limiting at these high trest/tpulse ratios, thus leading to the observed saturation in obtainable discharge capacity.
To reveal why higher capacities can be obtained during pulse discharging, SEM measurements were conducted to investigate the size of the formed discharge product, i.e., the cuboid NaO2 (cf. Figure 2). By comparing a large cross-section of cathodes of Na/O2 batteries that are either discharged continuously (cf. Figure 2a) or by pulsing for 1 s and resting for 10 s (cf. Figure 2b), the difference in discharge capacity becomes noticeable. In both SEM images a high number of NaO2 cuboids is visible within the carbon fiber network, but the size of the formed NaO2 particles is significantly larger when the battery is discharged by an intermittent current (cf. Figure 2b). An evaluation of the NaO2 cuboid size distribution for the pulsed discharged battery is presented in Figure S2. It reveals an estimated cuboid edge length (CEL) of approximately 21 µm, with the CEL ranging from 9 µm up to 35 µm. The difference in CEL also becomes evident by comparing the cuboids formed at pulse discharging to those at continuous discharging at 500 µA cm−2.
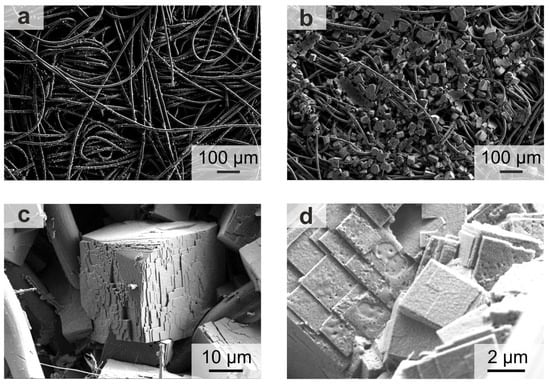
Figure 2.
SEM images of the cathode of Na/O2 batteries after full discharge (100% state of discharge, SOD): (a) continuous discharging at 500 µA cm−2, 0.670 mAh; (b–d) pulse discharging at 500 µA cm−2 with 10 s resting and 1 s pulse, 5.642 mAh.
Schröder et al. elucidated that the size and distribution of NaO2 cuboids within cathodes depends on the applied current density [24]. When a Na/O2 battery is fully discharged with uninterrupted high current densities of 400 or 600 µA cm−2, the maximum CEL was determined to 12 and 5 µm, respectively.
In comparison, the herein observed size of the cuboids formed by pulse discharging (cf. Figure 2b and Figure S2) is more similar to the size of cuboids that are formed after discharging a battery continuously at much lower current densities of 50 µA cm−2 [24]. This similarity in size becomes apparent when comparing the amount of charge transferred per time interval. When applying a pulse for 1 s at 500 µA cm−2 and resting the battery for 10 s, the current density is comparable to 45 µA cm−2 per second for the complete time interval.
Interestingly, the shape of the NaO2 cuboids changes when using pulse discharging (cf. Figure 2c,d). Instead of the typical flat cuboid surfaces formed at continuous discharging [3,24], the cuboids formed by pulse discharging seem to consist of several prismatic layers that agglomerated to a stack. These stacks are highly oriented to each other always displaying the high crystallographic order of the NaO2(100) surface [43,44]. Since this finding was—to the best of our knowledge—never reported before, we provide a suggestion to qualitatively explain the shape of the stacked cuboids in the following.
In general, the surface free energy of these stacked cuboids is higher than that of their flat counterparts. Therefore, we assume that the growth kinetics determine the morphology. Rost et al. describe how the roughness of a surface depends on the surface mobility of the deposited material and the incoming flux of the deposited material [45]. If the deposited material has a high surface mobility a flat surface is formed. The adsorbed species are able to diffuse to surface defects (e.g., step edges) and attach to them, thus leading to a smoother surface. However, the deposition flux has the opposite effect: leading to rougher surface at higher flux rates.
If we assume that the supply of O2 within the cathode is significantly lower than the supply of electrons that is provided to the cathode per time interval, then the model presented by Rost et al. can be used to describe the observed morphology of the stacked cuboids: During continuous discharging, the cuboids have a flat surface. Thus, incoming NaO2* (dissolved molecules of sodium superoxide) are assumed to have a high surface mobility when adsorbed on the NaO2 cuboid surface. In the case of pulse discharging, during each pulse at elevated current densities (e.g., PCD at 500 µA cm−2 compared to CD at 45 µA cm−2) a high amount of NaO2 * molecules are formed in a short time interval, thus leading to a significantly higher incoming flux to the NaO2 cuboid surface. The higher flux ultimately leads to a rougher surface, which is exemplified by the NaO2 stacked morphology that we observe.
To achieve highest possible discharge capacities by pulse discharging, one might consider to always choose high ratios of trest/tpulse (cf. Figure S1). However, these high trest/tpulse ratios also have some major drawbacks in the case of Na/O2 batteries that need to be addressed, i.e., the lack of stability of the discharge product. Many studies have shown that the formed discharge product is only metastable and slowly decomposes to Na2O2, hydrous Na2O2 or even NaOH [13,15,16,22,34,46,47,48]. This problem becomes very apparent for high trest/tpulse ratios during pulse discharging at 500 µA cm−2. Due to the small pulse times and the high resting times, it takes longer to fully discharge the Na/O2 battery. While fully discharging at small trest/tpulse ratios needs only several hours (e.g., 24 h for 10 s rest and 5 s pulse), at high trest/tpulse ratios it can take up to over 300 h to completely discharge a battery when pulsing for 0.5 s and resting 10 s. As a result, the discharge product decomposes.
This finding is confirmed in our work by XRD and Raman measurements of a cathode that was fully discharged with a pulse time of 1 s and a resting time of 10 s (cf. Figure 3). Both measurements, which were performed ex situ, reveal that NaO2 is the dominant species observed after discharging. However, XRD also shows that hydrous Na2O2 is present within the sample, thus confirming the metastability of the discharge product.
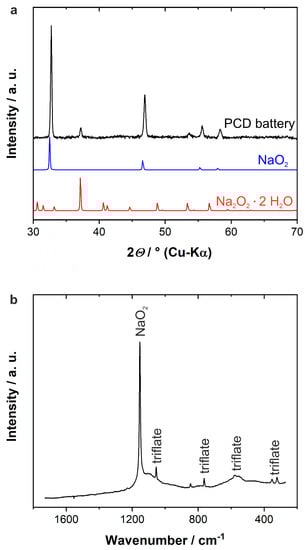
Figure 3.
Ex situ XRD and Raman measurements of a cathode of one Na/O2 battery that was discharged at 500 µA cm−2 to the cut-off potential of 1.6 V vs. Na+/Na by applying the pulse discharging protocol with 1 s pulse time and 10 s resting at OCV. (a) Reference X-ray diffractograms for NaO2 (blue) and hydrous Na2O2 are provided to assign the reflexes of the PCD battery (black). Raman signals in (b) are assigned based on Raman measurements from previous work [3,49].
Due to the degradation of NaO2 over time, the round trip efficiency for charge and discharge of the Na/O2 batteries decreases dramatically when applying such high trest/tpulse ratios during pulse discharging due to the higher overpotentials from Na2O2 decomposition at subsequent charging steps [13]. Therefore, the ratio of resting time and pulse time has to be chosen very carefully, when the utilization of the cathode surface, and thus the obtainable discharge capacity, is optimized without losing the high round trip efficiency of Na/O2 batteries. When discharging a Na/O2 batteries with 5 s pulse time and 10 s resting time, a typical charging profile is obtained [12] (cf. Figure S3). This result indicates that subsequent charging is possible after discharging thus showing the cyclability at low ratios of trest/tpulse.
One has to consider that the simultaneous decomposition of NaO2 during discharge might expose new nucleation and growth sites on the cathode surface and thus artificially increasing the obtainable maximum discharge capacity. To tackle this issue, we first performed a full discharge (defined as 100% state of discharge) to a cut-off potential of 1.6 V vs. Na+/Na, which was followed by a resting time of 24 h at OCV (cf. Figure S4). After this resting period, we discharged the very same battery again to the cut-off voltage of 1.6 V vs. Na+/Na. Immediately, after less than 0.1 s, the cut-off potential was reached, and no additional capacity was gained. This procedure was repeated two times subsequently, thus resulting in 72 h of total resting time at OCV with no additional discharge capacity gained each time. Therefore, we conclude that the generally higher discharge capacity from pulse discharging is not related to discharge product decomposition and the exposure of new nucleation sites. Instead, the formation of the much larger NaO2 cuboids within the cathode determines the high discharge capacities.
3.2. Comparing Optimized Pulse Discharging to Constant Current Discharge
Besides choosing an optimal ratio of trest/tpulse to achieve high current densities while maintaining sufficient round trip efficiency, another important aspect of the pulse discharged batteries needs to be addressed: an uninterrupted current that can be drawn by a battery system in general. While pulse discharging is per definition an interrupted discharging protocol, several batteries in one system need to be connected in a parallel circuit to always maintain an uninterrupted current density from the system. For instance, three batteries need to be set up in parallel circuit if each should be pulse discharged with 5 s pulse and 10 s resting time. When switching between these three batteries, only one battery is discharged at a time while the others can rest, thus resulting in an uninterrupted current from the battery system. To elucidate if such a setup and pulse discharging is still to be favored over constant current discharge, a similar setup of three batteries in parallel circuit needs to be discharged continuously. Here we chose a discharge current density of approximately 167 µA cm−2 at continuous discharging and compared this to pulse discharging at 500 µA cm−2 with 5 s pulse and 10 s resting time.
The comparison between batteries discharged continuously at 167 µA cm−2 or by pulse discharging 500 µA cm−2 is displayed in Figure 4. The two left bars represent a single battery for both mentioned discharging settings. Evidently, pulse discharging results in a higher discharge capacity (3.783 mAh, yellow bar) compared to a continuously discharged battery (2.899 mAh, orange bar). To resemble the conditions for the three-battery parallel circuit qualitatively, the capacity of a single battery was multiplied by a factor of three to estimate which of these setups in theory should provide more capacity. The result is depicted in the two bars on the right side of Figure 4. In this idealized scenario, the pulse discharging setup provides approximately 30% more capacity than the continuously discharged setup. For additional comparison, the obtained capacities after discharging are summarized in Table 1. The respective values for the comparison of the three-battery setups are highlighted and underlined with a dotted line.
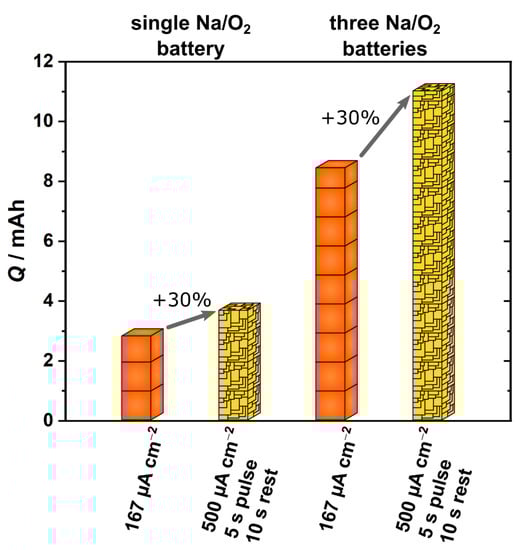
Figure 4.
Comparison of discharge capacities obtained with continuous discharging and pulse discharging. The settings for discharging were chosen to address two parallel circuit settings, each containing three Na/O2 batteries with an incoming and outgoing current density of 500 µA cm−2 for these two setups. While the current density stays at 500 µA cm−2 for the battery during pulse discharging, the current density is split between the three batteries during continuous discharging, thus resulting in a current density of 167 µA cm−2 for each individual battery.
A similar comparison is possible if Na/O2 batteries are discharged continuously at 500 µA cm−2 as well as pulse discharged at 1500 µA cm−2 with 5 s pulse and 10 s resting time (cf. Table 1, dashed underline). A single continuously discharged battery provides a capacity of 0.670 mAh while a complementary single pulse discharged battery ends up with a capacity of 0.801 mAh. Again, the pulse discharged battery reached the higher discharge capacity, which is even more pronounced in the three-battery setup (2.403 mAh three pulse discharge batteries vs. 2.010 mAh three continuously discharged batteries). These higher current densities result in overall lower capacities, with the benefit of pulse discharging in this scenario providing approximately 14% more capacity than continuous discharging.
It has to be emphasized at this point that this observation needs to be proven by real application measurements since we did not utilize a battery pack with battery management system. However, we conducted several three-battery parallel circuit measurements for continuous discharging, which are consistent with the simplified results from Figure 4 and Table 1. At times, even lower capacities were observed for these three-battery continuous discharging setups. As these batteries exhibit a unified potential in the parallel circuit, all batteries stop discharging as soon as one battery is discharged earlier or even malfunctioning. This elucidates how susceptible a parallel setup for continuous discharging might be.
3.3. Differences with 3D and 2D Cathode Materials
Two types of cathode materials were tested to evaluate pulse discharging in Na/O2 batteries. Besides commercial Freudenberg H23C2 gas diffusion layer cathodes, Ketjenblack EC JD600 cathodes were also used. All continuous and pulse discharging experiments as well as the related capacities with Freudenberg H23C2 as cathode are listed in Table 1 while the results for Ketjenblack EC JD600 cathodes are summarized in Table 2.
Table 2.
Summary of the pulse discharge and continuous discharge experiments with self-made two-dimensional Ketjenblack EC 600JD cathodes for the formation of NaO2. For the three-battery setup comparison between pulse discharging and continuous discharging the values are highlighted in bold, respectively.
The commercial Freudenberg cathode materials are carbon fiber based with a thickness of more than 200 µm and a thin microporous layer coated on one side, thus representing three-dimensional cathodes regarding the µm-sized discharge product NaO2. The Ketjenblack cathodes are fundamentally different. Due to their slurry based preparation method, the preparation route using small carbon nanoparticles leads to the formation of a densely packed cathode material with a very high BET surface area [12]. However, these agglomerated carbon nanoparticles have negligible void space in-between. Consequently, these cathodes can be seen as two-dimensional surface areas on which the µm-sized discharge product is directly formed on top, facing the O2 reservoir/gas phase.
We observe that the nature of the cathode material—being designed for the use in 2D or 3D—governs the discharge capacity for pulse discharging. For the three-dimensional cathode systems (Freudenberg H23C2, Table 1), pulse discharging is superior to continuous discharging at the chosen discharge settings (i.e., 500 µA cm−2 pulse discharging with 5 s pulse and 10 s resting vs. 167 µA cm−2 continuous discharging). However, if the same settings are used for Na/O2 batteries with Ketjenblack cathodes, pulse discharging (1.340 mAh) is inferior to the complementary continuous discharging (2.927 mAh) (cf. Table 2). In the case of Ketjenblack cathodes, most of the cathode surface used for the formation of NaO2 is already facing the O2 reservoir and therefore is much faster supplied with dissolved O2.
4. Conclusions
Utilizing the entire cathode is crucial for aiming at maximum capacities in Na/O2 batteries. We applied a pulse discharging protocol, which enables the local concentration of O2 within the electrolyte at the cathode to rise during each resting step. During each pulse step this increased concentration is used to form more and larger NaO2 cuboids, thus enhancing the discharge capacity. We elucidate that the beneficial effect of pulse discharging strongly depends on the chosen ratio of trest to tpulse as well as on the cathode type (2D or 3D in terms of utilizable void space). Additionally, we compared the pulse discharging protocol to continuous discharging in an application-related parallel circuit setup scenario to elucidate the limitations of this cycling protocol. For commercially available 3D cathodes, an increase in discharge capacity is observable while for 2D cathodes pulse discharging proves to be less beneficial than continuous discharging at lower current densities.
Overall, pulse discharging is a powerful electrochemical protocol to increase the obtainable capacities for Na/O2 batteries. However, many pitfalls have to be overcome before it can be realized in technical applications. Depending on the electrolyte composition and other battery components used, a suitable 3D cathode is necessary to employ the increased concentration of O2 within deeper regions of the cathode. Simultaneously, the ratio between resting time and pulse time has to be chosen carefully. When increasing the resting time compared to the pulse time, the obtainable capacity increases. However, as a consequence, the overall time needed for a full discharge of the battery increases as well. In the case of the Na/O2 battery, this shortcoming is problematic due to the metastable discharge product NaO2 and its decomposition, which reduces the round-trip efficiency in the end. Shallow cycling might be a solution for cycling Na/O2 batteries at very high trest/tpulse ratios. Another option is to increase the stability of the discharge product by introducing additives to the electrolyte that slow down the decomposition process.
When thinking about practical application of the parallel circuit setup, pulse discharging requires an intelligent battery management system that controls the alternating current between the Na/O2 batteries. With such a computed application, it could also be possible to disconnect malfunctioning or already discharged batteries while at the same time adjusting the trest/tpulse ratio of the remaining batteries, thus maintaining the outgoing current density of the battery pack. Moreover, in a large stationary application, there is the possibility of replacing failed batteries with new ones.
In the end, a beneficial implementation of pulse discharging is very demanding from the electrochemical point of view as well as from looking at the engineering of well managed battery systems, but it potentially enables to achieve higher capacities and increased energy densities also for other metal-oxygen batteries than the Na/O2 battery.
Supplementary Materials
The following are available online at https://www.mdpi.com/1996-1073/13/21/5650/s1, Figure S1: Obtainable discharge capacity for various trest/tpulse times, Figure S2: Histogram for NaO2 cuboid edge length, Figure S3: PCD and charging profiles, Figure S4: Long-term NaO2 degradation measurements.
Author Contributions
Conceptualization, D.L. and D.S.; methodology, D.L. and D.S.; validation, D.L., T.D. and V.M.; formal analysis, D.L., J.J.A.K. and D.S.; investigation, D.L., T.D. and V.M.; writing—original draft preparation, D.L., J.J.A.K. and D.S.; writing—review and editing, D.L., J.J.A.K. and D.S.; visualization, D.L. and J.J.A.K.; supervision, D.L. and D.S.; project administration, D.L. and D.S.; funding acquisition, D.S. All authors have read and agreed to the published version of the manuscript.
Funding
This research was funded by the Bundesministerium für Bildung und Forschung (BMBF) in the framework of the MeLuBatt project (FKz 03XP0110A).
Acknowledgments
Financial support from the Bundesministerium für Bildung und Forschung (BMBF) is gratefully acknowledged. The authors thank Jürgen Janek for fruitful discussions, and Manuel Weiss for proofreading the manuscript.
Conflicts of Interest
The authors declare no conflict of interest.
References
- Thackeray, M.M.; Wolverton, C.; Isaacs, E.D. Electrical energy storage for transportation—approaching the limits of, and going beyond, lithium-ion batteries. Energy Environ. Sci. 2012, 5, 7854–7863. [Google Scholar] [CrossRef]
- Adelhelm, P.; Hartmann, P.; Bender, C.L.; Busche, M.; Eufinger, C.; Janek, J. From lithium to sodium: Cell chemistry of room temperature sodium–air and sodium–sulfur batteries. Beilstein J. Nanotechnol. 2015, 6, 1016–1055. [Google Scholar] [CrossRef]
- Hartmann, P.; Bender, C.L.; Vračar, M.; Dürr, A.K.; Garsuch, A.; Janek, J.; Adelhelm, P. A rechargeable room-temperature sodium superoxide (NaO2) battery. Nat. Mater. 2013, 12, 228–232. [Google Scholar] [CrossRef] [PubMed]
- Sun, B.; Pompe, C.; Dongmo, S.; Zhang, J.; Kretschmer, K.; Schröder, D.; Janek, J.; Wang, G. Next-Generation Rechargeable Batteries: Challenges for Developing Rechargeable Room-Temperature Sodium Oxygen Batteries. Adv. Mater. Technol. 2018, 3, 1800110–1800128. [Google Scholar] [CrossRef]
- Bender, C.L.; Schröder, D.; Pinedo, R.; Adelhelm, P.; Janek, J. One- or Two-Electron Transfer? The Ambiguous Nature of the Discharge Products in Sodium-Oxygen Batteries. Angew. Chem. Int. Ed. 2016, 55, 4640–4649. [Google Scholar] [CrossRef] [PubMed]
- Freunberger, S.A.; Chen, Y.; Peng, Z.; Griffin, J.M.; Hardwick, L.J.; Bardé, F.; Novák, P.; Bruce, P.G. Reactions in the Rechargeable Lithium-O2 Battery with Alkyl Carbonate Electrolytes. J. Am. Chem. Soc. 2011, 133, 8040–8047. [Google Scholar] [CrossRef]
- Thotiyl, M.M.O.; Freunberger, S.A.; Peng, Z.; Bruce, P.G. The Carbon Electrode in Nonaqueous Li-O2 Cells. J. Am. Chem. Soc. 2013, 135, 494–500. [Google Scholar] [CrossRef]
- Medenbach, L.; Bender, C.L.; Haas, R.; Mogwitz, B.; Pompe, C.; Adelhelm, P.; Schröder, D.; Janek, J. Origins of Dendrite Formation in Sodium-Oxygen Batteries and Possible Countermeasures. Energy Technol. 2017, 5, 2265–2274. [Google Scholar] [CrossRef]
- Kim, H.; Jeong, G.; Kim, Y.-U.; Kim, J.-H.; Parke, C.-M.; Sohn, H.-J. Metallic anodes for next generation secondary batteries. Chem. Soc. Rev. 2013, 42, 9011. [Google Scholar] [CrossRef]
- Yadegari, H.; Sun, Q.; Sun, X. Sodium-Oxygen Batteries: A Comparative Review from Chemical and Electrochemical Fundamentals to Future Perspective. Adv. Mater. 2016, 28, 7065–7093. [Google Scholar] [CrossRef]
- Zhang, W.; Huang, Y.; Liu, Y.; Wang, L.; Chou, S.; Liu, H. Strategies Toward Stable Nonaqueous Alkali Metal-O2 Batteries. Adv. Energy Mater. 2019, 9, 1900464. [Google Scholar] [CrossRef]
- Bender, C.L.; Hartmann, P.; Vračar, M.; Adelhelm, P.; Janek, J. On the Thermodynamics, the Role of the Carbon Cathode, and the Cycle Life of the Sodium Superoxide (NaO2) Battery. Adv. Energy Mater. 2014, 1301863–1301874. [Google Scholar] [CrossRef]
- Pinedo, R.; Weber, D.A.; Bergner, B.; Schröder, D.; Adelhelm, P.; Janek, J. Insights into the Chemical Nature and Formation Mechanisms of Discharge Products in Na-O2 Batteries by Means of Operando X-ray Diffraction. J. Phys. Chem. C 2016, 120, 8472–8481. [Google Scholar] [CrossRef]
- Liu, C.; Carboni, M.; Brant, W.R.; Pan, R.; Hedman, J.; Zhu, J.; Gustafsson, T.; Younesi, R. On the Stability of NaO2 in Na-O2 Batteries. ACS Appl. Mater. Interfaces 2018, 10, 13534–13541. [Google Scholar] [CrossRef]
- Landa-Medrano, I.; Pinedo, R.; Bi, X.; de Larramendi, I.R.; Lezama, L.; Janek, J.; Amine, K.; Lu, J.; Rojo, T. New Insights into the Instability of Discharge Products in Na−O2 Batteries. ACS Appl. Mater. Interfaces 2016, 8, 20120–20127. [Google Scholar] [CrossRef] [PubMed]
- Yadegari, H.; Banis, M.N.; Lin, X.; Koo, A.; Li, R.; Sun, X. Revealing the Chemical Mechanism of NaO2 Decomposition by In Situ Raman Imaging. Chem. Mater. 2018, 30, 5156–5160. [Google Scholar] [CrossRef]
- Kim, J.; Park, H.; Lee, B.; Seong, W.M.; Lim, H.-D.; Bae, Y.; Kim, H.; Kim, W.K.; Ryu, K.H.; Kang, K. Dissolution and ionization of sodium superoxide in sodium-oxygen batteries. Nat. Commun. 2016, 7, 10670. [Google Scholar] [CrossRef] [PubMed]
- Hayyan, M.; Hashim, M.A.; AlNashef, I.M. Superoxide Ion: Generation and Chemical Implications. Chem. Rev. 2016, 116, 3029–3085. [Google Scholar] [CrossRef]
- Dilimon, V.S.; Hwang, C.; Cho, Y.-G.; Yang, J.; Lim, H.-D.; Kang, K.; Kang, S.J.; Song, H.-K. Superoxide stability for reversible Na-O2 electrochemistry. Sci. Rep. 2017, 7, 17635. [Google Scholar] [CrossRef]
- He, M.; Lau, K.C.; Ren, X.; Xiao, N.; McCulloch, W.D.; Curtiss, L.A.; Wu, Y. Concentrated Electrolyte for the Sodium-Oxygen Battery: Solvation Structure and Improved Cycle Life. Angew. Chem. Int. Ed. 2016, 55, 15310–15314. [Google Scholar] [CrossRef]
- Schafzahl, L.; Mahne, N.; Schafzahl, B.; Wilkening, M.; Slugovc, C.; Borisov, S.M.; Freunberger, S.A. Singlet Oxygen during Cycling of the Aprotic Sodium-O2 Battery. Angew. Chem. Int. Ed. 2017, 56, 15728–15732. [Google Scholar] [CrossRef] [PubMed]
- Mourad, E.; Petit, Y.K.; Spezia, R.; Samojlov, A.; Summa, F.F.; Prehal, C.; Leypold, C.; Mahne, N.; Slugovc, C.; Fontaine, O.; et al. Singlet oxygen from cation driven superoxide disproportionation and consequences for aprotic metal-O2 batteries. Energy Environ. Sci. 2019, 12, 2559. [Google Scholar] [CrossRef]
- Lozano, I.; Córdoba, D.; Rodríguez, H.B.; Landa-Medrano, I.; Ortiz-Vitoriano, N.; Rojo, T.; de Larramendi, I.R.; Calvo, E.J. Singlet oxygen formation in Na-O2 battery cathodes catalyzed by ammonium Brönsted acid. J. Electroanal. Chem. 2020, 872, 114265. [Google Scholar] [CrossRef]
- Schröder, D.; Bender, C.L.; Osenberg, M.; Hilger, A.; Manke, I.; Janek, J. Visualizing Current-Dependent Morphology and Distribution of Discharge Products in Sodium-Oxygen Battery Cathodes. Sci. Rep. 2016, 6, 24288. [Google Scholar] [CrossRef] [PubMed]
- Hartmann, P.; Heinemann, M.; Bender, C.L.; Graf, K.; Baumann, R.-P.; Adelhelm, P.; Heiliger, C.; Janek, J. Discharge and Charge Reaction Paths in Sodium−Oxygen Batteries: Does NaO2 Form by Direct Electrochemical Growth or by Precipitation from Solution? J. Phys. Chem. C 2015, 119, 22778–22786. [Google Scholar] [CrossRef]
- Nichols, J.E.; Knudsen, K.B.; McCloskey, B.D. Oxygen Pressure Influences Spatial NaO2 Deposition and the Sudden Death Mechanism in Na−O2 Batteries. J. Phys. Chem. C 2018, 122, 13462–13472. [Google Scholar] [CrossRef]
- Balaish, M.; Kraytsberg, A.; Ein-Eli, Y. Realization of an Artificial Three-Phase Reaction Zone in a Li–Air Battery. ChemElectroChem 2014, 1, 90–94. [Google Scholar] [CrossRef]
- Schürmann, A.; Haas, R.; Murat, M.; Kuritz, N.; Balaish, M.; Ein-Eli, Y.; Janek, J.; Natan, A.; Schröder, D. Diffusivity and Solubility of Oxygen in Solvents for Metal/Oxygen Batteries: A Combined Theoretical and Experimental Study. J. Electrochem. Soc. 2018, 165, A3095–A3099. [Google Scholar] [CrossRef]
- Wijaya, O.; Hartmann, P.; Younesi, R.; Markovits, I.I.E.; Rinaldi, A.; Janek, J.; Yazami, R. A gamma fluorinated ether as an additive for enhanced oxygen activity in Li–O2 batteries. J. Mater. Chem. A 2015, 3, 19061–19067. [Google Scholar] [CrossRef]
- Kang, S.Y.; Mo, Y.; Ong, S.P.; Ceder, G. Nanoscale Stabilization of Sodium Oxides: Implications for Na−O2 Batteries. Nano Lett. 2014, 14, 1016–1020. [Google Scholar] [CrossRef]
- Xia, C.; Fernandes, R.; Adams, B.; Nazar, L.F. The critical role of phase-transfer catalysis in aprotic sodium oxygen batteries. Nat. Chem. 2015, 7, 496–501. [Google Scholar] [CrossRef] [PubMed]
- Xia, C.; Fernandes, R.; Cho, F.H.; Sudhakar, N.; Buonacorsi, B.; Walker, S.; Xu, M.; Baugh, J.; Nazar, L.F. Direct Evidence of Solution-Mediated Superoxide Transport and Organic Radical Formation in Sodium-Oxygen Batteries. J. Am. Chem. Soc. 2016, 138, 11219–11226. [Google Scholar] [CrossRef] [PubMed]
- Lutz, L.; Corte, D.A.D.; Tang, M.; Salager, E.; Deschamps, M.; Grimaud, A.; Johnson, L.; Bruce, P.G.; Tarascon, J.-M. Role of Electrolyte Anions in the Na−O2 Battery: Implications for NaO2 Solvation and the Stability of the Sodium Solid Electrolyte Interphase in Glyme Ethers. Chem. Mater. 2017, 29, 6066–6075. [Google Scholar] [CrossRef]
- Lutz, L.; Dachraoui, W.; Demortière, A.; Johnson, L.R.; Bruce, P.G.; Grimaud, A.; Tarascon, J.-M. Operando Monitoring of the Solution-Mediated Discharge and Charge Processes in a Na−O2 Battery Using Liquid-Electrochemical Transmission Electron Microscopy. Nano Lett. 2018, 18, 1280–1289. [Google Scholar] [CrossRef]
- Débart, A.; Paterson, A.J.; Bao, J.; Bruce, P.G. α-MnO2 Nanowires: A Catalyst for the O2 Electrode in Rechargeable Lithium Batteries. Angew. Chem. Int. Ed. 2008, 47, 4521–4524. [Google Scholar] [CrossRef]
- McCloskey, B.D.; Scheffler, R.; Speidel, A.; Bethune, D.S.; Shelby, R.M.; Luntz, A.C. On the Efficacy of Electrocatalysis in Nonaqueous Li-O2 Batteries. J. Am. Chem. Soc. 2011, 133, 18038–18041. [Google Scholar] [CrossRef]
- Ma, S.; Wu, Y.; Wang, J.; Zhang, Y.; Zhang, Y.; Yan, X.; Wei, Y.; Liu, P.; Wang, J.; Jiang, K.; et al. Reversibility of Noble Metal-Catalyzed Aprotic Li-O2 Batteries. Nano Lett. 2015, 15, 8084–8090. [Google Scholar] [CrossRef] [PubMed]
- Landa-Medrano, I.; Lozano, I.; Ortiz-Vitoriano, N.; de Larramendi, I.R.; Rojo, T. Redox mediators: A shuttle to efficacy in metal–O2 batteries. J. Mater. Chem. A 2019, 7, 8746. [Google Scholar] [CrossRef]
- Frith, J.T.; Landa-Medrano, I.; de Larramendi, I.R.; Rojo, T.; Owena, J.R.; Garcia-Araez, N. Improving Na–O2 batteries with redox mediators. Chem. Commun. 2017, 53, 12008. [Google Scholar] [CrossRef]
- Bergner, B.J.; Busche, M.R.; Pinedo, R.; Berkes, B.B.; Schröder, D.; Janek, J. How to Improve Capacity and Cycling Stability for Next Generation Li−O2 Batteries: Approach with a Solid Electrolyte and Elevated Redox Mediator Concentrations. ACS Appl. Mater. Interfaces 2016, 8, 7756–7765. [Google Scholar] [CrossRef] [PubMed]
- Schröder, D.; Laue, V.; Krewer, U. Numerical simulation of gas-diffusion-electrodes with moving gas–liquid interface: A study on pulse-current operation and electrode flooding. Comput. Chem. Eng. 2016, 84, 217–225. [Google Scholar] [CrossRef]
- Wang, F.; Li, X. Discharge Li-O2 batteries with intermittent current. J. Power Sources 2018, 394, 50–56. [Google Scholar] [CrossRef]
- Lee, B.; Seo, D.-H.; Lim, H.-D.; Park, I.; Park, K.-Y.; Kim, J.; Kang, K. First-Principles Study of the Reaction Mechanism in Sodium−Oxygen Batteries. Chem. Mater. 2014, 26, 1048–1055. [Google Scholar] [CrossRef]
- Arcelus, O.; Li, C.; Rojo, T.; Carrasco, J. Electronic Structure of Sodium Superoxide Bulk, (100) Surface, and Clusters using Hybrid Density Functional: Relevance for Na−O2 Batteries. J. Phys. Chem. Lett. 2015, 6, 2027–2031. [Google Scholar] [CrossRef]
- Rost, M.J.; Jacobse, L.; Koper, M.T.M. The dualism between adatom- and vacancy-based single crystal growth models. Nat. Commun. 2019, 10, 5233. [Google Scholar] [CrossRef] [PubMed]
- Liu, T.; Kim, G.; Casford, M.T.L.; Grey, C.P. Mechanistic Insights into the Challenges of Cycling a Nonaqueous Na−O2 Battery. J. Phys. Chem. Lett. 2016, 7, 4841–4846. [Google Scholar] [CrossRef]
- Landa-Medrano, I.; Sorrentino, A.; Stievano, L.; de Larramendi, I.R.; Pereiro, E.; Lezama, L.; Rojo, T.; Tonti, D. Architecture of Na-O2 battery deposits revealed by transmission X-ray microscopy. Nano Energy 2017, 37, 224–231. [Google Scholar] [CrossRef]
- Banis, M.N.; Yadegari, H.; Sun, Q.; Regier, T.; Boyko, T.; Zhou, J.; Yiu, Y.M.; Li, R.; Hu, Y.; Sham, T.K.; et al. Revealing the charge/discharge mechanism of Na–O2 cells by in situ soft X-ray absorption spectroscopy. Energy Environ. Sci. 2018, 11, 2073–2077. [Google Scholar] [CrossRef]
- Hartmann, P.; Bender, C.L.; Sann, J.; Dürr, A.K.; Jansen, M.; Janek, J.; Adelhelm, P. A comprehensive study on the cell chemistry of the sodium superoxide (NaO2) battery. Phys. Chem. Chem. Phys. 2013, 15, 11661. [Google Scholar] [CrossRef]
Publisher’s Note: MDPI stays neutral with regard to jurisdictional claims in published maps and institutional affiliations. |
© 2020 by the authors. Licensee MDPI, Basel, Switzerland. This article is an open access article distributed under the terms and conditions of the Creative Commons Attribution (CC BY) license (http://creativecommons.org/licenses/by/4.0/).