Article

Cross-seasonal Experimental Study on the Comprehensive Performance of C-Si PV Window

1
College of Architecture and Environment, Sichuan University, Chengdu 610065, China
2
Institute of New Energy and Low-carbon Technology, Sichuan University, Chengdu 610065, China
*
Author to whom correspondence should be addressed.
Energies 2020, 13(21), 5684; https://doi.org/10.3390/en13215684
Submission received: 10 September 2020 / Revised: 17 October 2020 / Accepted: 28 October 2020 / Published: 30 October 2020
(This article belongs to the Section G: Energy and Buildings)

Abstract

:
PV windows can potentially produce electricity, reduce the air-conditioning load, and provide natural light. Cross-seasonal experimental tests for long period could eliminate the gap between real outdoor test and simulation estimation. In this research, the lighting-thermal-electricity performance of high-efficiency c-silicon PV windows was tested, and the improvement has been put forward according to the conditions. The long-term experiment was conducted cross different seasons, including summer, autumn, and winter seasons. The highest average power generation, 50W/m2, could be found in autumn. The average outside surface temperature of the PV window would reach 48 °C in sunny days in the autumn, which was higher than other seasons. Although the c-Si PV window maybe block the partial daylighting, the daylighting requirement still could be satisfied with the most days. Furthermore, the average Useful Daylight Illuminance was the highest in summer up to 0.79, and the average illumination uniform could be achieved at a high level in all seasons. For the improvement suggestions, some measures could be taken to reduce the indoor cooling load in summer. During winter, appropriate inner shading measures might be taken to prevent excessive illumination in the building, and allow the electricity and thermal performance of PV window.

1. Introduction

According to International Energy Outlook (2016) [1], building energy consumption is an important part of world energy consumption, which accounts for 39%. The photovoltaic (PV) window can reduce the thermal energy consumption and produce electricity. Also, the PV window could guarantee the natural lighting for the building during daytime. Therefore, PV windows applied on buildings could significantly decrease the energy consumption. The power generation of the PV window varies in accordance to the solar radiation for different seasons. In hot summer and cold winter zones in China, the temperature fluctuates quite a lot across the four seasons. The cross-seasonal investigation on the lighting-thermal-electricity performance of C-Si PV Window is necessary
The type of PV cells suitable for windows are crystalline silicon PV cells (C-Si), thin-film PV cells (a-Si), and concentrator PV cells (CPV). As shown in Figure 1b, thin-film PV cell is transparent. The electricity generation efficiency is not very high, which is reported at about 4–12% [2]. C-Si PV cell is opaque, but the natural lighting indoors can be improved by changing the fraction of cover, and the power generated is higher than that of a-Si PV cell. According to our previous study [3], compared with conventional clear windows, the air-conditioning energy consumption decreased around 22kWh, lighting energy consumption increased around 13kWh, and PV generated electricity around 20kWh in Sep. The air-conditioning energy saving and PV energy generation are the main impact of the PV window. CPVs have been designed to achieve higher conversion efficiencies so that the power generation efficiency is higher than other cells, but the cost is very high, as shown in Figure 1c [4].
The performance of PV window is affected by many factors. Jong-Hwa Song et al. [5] analyzed the performance of photovoltaic windows with different installation angles by experimental tests. The results show that the performance of photovoltaic windows vary a lot in terms of power generation and heat transfer across different installation angles. Considering the outdoor environment parameters of photovoltaic windows across different installation inclinations, only the solar radiation varied greatly, indicating that solar radiation intensity has a massive impact on the performance of photovoltaic windows. McCormick et al. [6] analyzed the influence of intermittent variation of solar radiation on the performance of PV modules. Under some cloudy weather conditions, the solar radiation fluctuated significantly, and the fluctuation of solar radiation directly affected the charging and discharging current of the rechargeable batteries. At the same time, K.E. Park et al. [7] conduct an experiment to analyze the thermoelectric performance of PV windows. With increasing temperature, the power generation efficiency decreased by 0.52%/°C. This shows that the power generation performance of photovoltaic windows is affected by the environmental temperature.
From above study, the performance of photovoltaic modules, including photovoltaic windows, is significantly influenced by sunlight and temperature. The environmental parameters, including solar radiation and temperature, are quite different during each season. Danny H. W. Li et al. [8] conducted a field test on a translucent silicon photovoltaic skylight installed on the roof of a primary school in Hong Kong. It was found that the photovoltaic skylight could reduce the peak cooling load of 29.3 kW in summer. It was found by Wang et al. [9] that translucent PV windows could provide heat for the indoor environment on sunny days in winter. Zhang Yongxi et al. [10] analyzed the performance of PV windows in different seasons through simulation. In summer, photovoltaic double-layer windows can effectively reduce indoor heat gain and cooling energy consumption. In winter, it reduces indoor heat gain, thereby increasing the indoor heating load by reducing the influx of heat from outdoor to indoor. Chen Haifei et al. [11] used different control strategies to discharge the heat from the hollow part of the air-cooled photovoltaic louver outdoors in summer and exchange heat with indoors in winter, so as to further enhance the reuse of photovoltaic window energy and improve the operation efficiency of photovoltaic windows. Yongqianging Luo et al. [12] tested and analyzed the performance of double-layer photovoltaic shutters (PVB-DSF) in winter by experimental tests. The results show that PVB-DSF can obtain higher solar heat gain coefficient (SHGC) and lower heat transfer coefficient under non-ventilated mode. Compared with brick walls, PVB-DSF can save about 1121 Wh/(m2·day) of heat energy in winter.
From the above analysis, it is evident that the performance of photovoltaic windows was different greatly in whole year due to indoor climate conditions and other factors, which leads to different improvement methods for various seasons. Therefore, it is important to analyze the cross-seasonal performance of photovoltaic windows. However, due to the limitation of experimental conditions such like site, running time, and stability. To analyze the performance of photovoltaic windows in different seasons, previous studies mostly used simulation, or only tested on typical days. It resulted in inaccurate prediction of photovoltaic window performance due to the use of typical year data [13]. For a typical day test, the miniscule amount of data leads to experimental results that cannot fully reflect the performance characteristics of photovoltaic windows. For the people view, it is difficult to balance the maximum power generation and daylighting requirement. The suitable measures should be considered to improve the view effect of PV window.
In this article, in order to more accurately study the performance of photovoltaic windows across the seasons, a long-term experimental platform for photovoltaic windows was established, and a more accurate cross-seasonal analysis of the results was carried out, and the performance and optimization methods of photovoltaic windows during different periods of the year would be carried out.

2. Theoretical Analysis

The comprehensive performance of PV window could be evaluated with the electricity-heating-lighting performance. As shown in Figure 2, the coupled heat transfer between PV window and indoor/outdoor environment was complex. Part of the solar radiation incidence on the photovoltaic window is directly transmitted to the indoor environment, and part of the solar radiation is absorbed by the PV window, and then transmitted to the indoor and outdoor environment through convection and radiation heat transfer [14].

2.1. Electricity Performance Analysis of PV Window

The PV window power generation efficiency (η) is the power conversion capacity of PV windows. The value is expressed as below [15].
η = P A w × G t
where P is the total power generation of PV window, W; Aw is the area of PV window, m2.

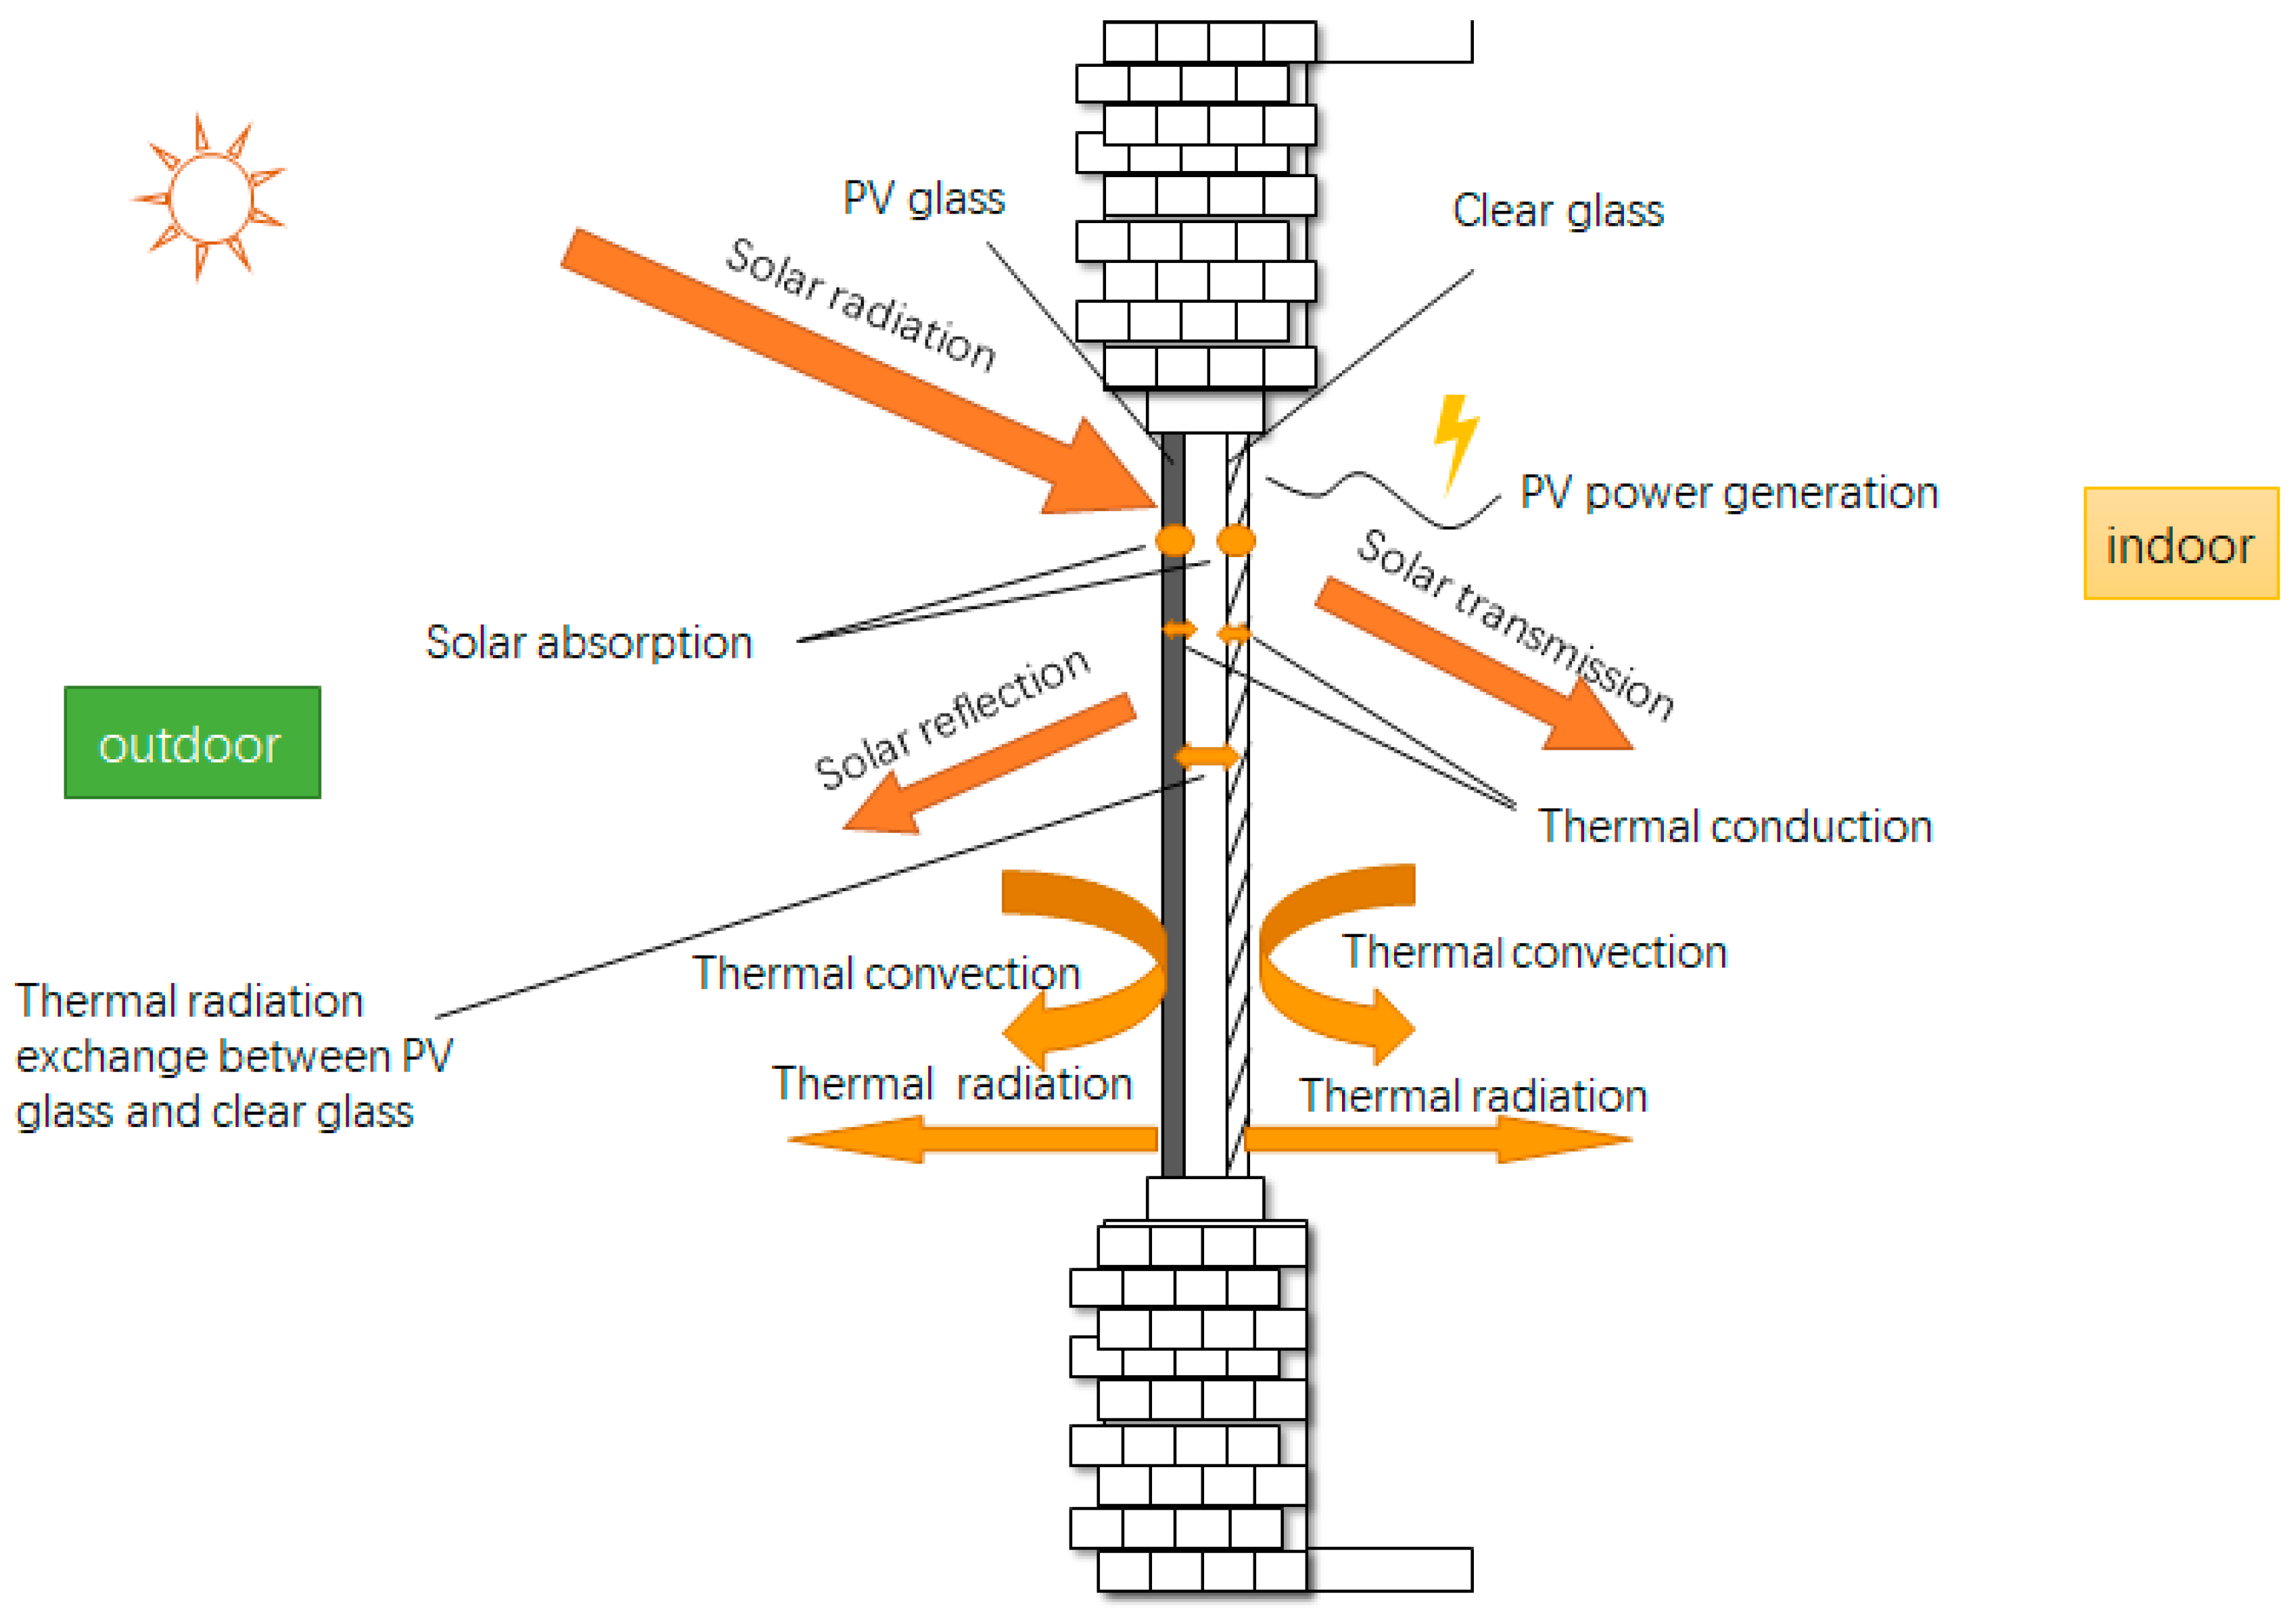
2.2. Thermal Performance Analysis of PV Window

Whilst considering the thermal performance analysis of PV windows, previous studies have mostly considered the thermal performance of transparent envelope components by analyzing the SHGC and U value [16,17]. For this research, it is focused on the PV glazing under outdoor running conditions. Meng Wang et al. [18] found SHGC of the PV window is the fraction of the incident irradiance entering through the window, including the direct transmission part, the absorption, and re-emission part. The U value of PV window is the total heat transfer coefficient from the inside to the outside of the building. The difference is that the SHGC indicates the window’s ability to block the sun’s penetration, while the U value shows the window prevents heat loss. Fokaides et al. [19] studied the heat transfer coefficients of both radiative and convective heat flows are considered in the U-value calculation. And, Tina et al. [20] clearly described the heat transfer process inside the photovoltaic panel. The heat conduction flow on the surface of the PV panel is equal to its convective heat flow. According to the previous research, the test method is selected to test whether the U value and SHGC in real outdoor conditions would be suitable for PV window under the real environment. Even the test process cannot be carried out in strictly accordance with the laboratory conditions, it still could indicate the thermal performance of PV window under a real environment. The thermal resistance of the thermal conductive heat flux sensor was ignored because its value was very small. The conductive heat flux inside the glass was assumed to be equal to the convective heat transfer between the inner surface and the indoor air at the boundary in the ideal condition.
The SHGC of the PV window could be approximately calculated by the Equation (2) [18]
SHGC G d + G r + G c G t
where Gt is the total solar radiation on the PV window, W/m2; Gd is direct solar radiation transferred into the room, W/m2; Gr is the radiation heat flux from the inside window, W/m2, Gc is the conductive heat flux transferring from inside window to the inside room, W/m2.
For the measurement of Gt and Gd, it was tested by the pyranometer vertically installed on the south facade and room inside, as shown in Figure 3. Gr and Gc were tested by the radiant heat meter and conductivity heat flux meter. The solar radiometer is installed on the outer surface of the building. The conductive heat flux meter is wrapped in tin foil and installed on the inner surface of the window. The radiant heat flux meter is installed in the room about 0.1m away from the window. The experimental data were taken every 1 min, and the corresponding values were processed according to Equation (2).
The U-value of the PV window could be approximately calculated by the below equations described in reference [18]
  U v a l u e G r + G c T i T 0
where Gr is the radiant heat loss from the inside window to the outside at nights, (W/m2); Gc is the conductive heat loss through the window, (W/m2); Ti is the indoor air temperature, (°C); T0 is the outside ambient air temperature, (°C).
The radiant heat loss was measured by the radiant heat flux meter, and the conductive heat loss of windows was measured by conductivity heat flux meter. Thermocouples were also required to be wrapped in tin foil to reduce the influence of solar radiation on temperature measurement, and experimental data were acquired every 1 min and the corresponding values were processed according to Equation (3).

2.3. Lighting Performance Analysis of PV Window

The daylighting uniform could be calculated as Equation (4) [21]:
D u n i = C min C av
where Duni is the uniformity ratio of daylighting, Cmin is the minimum indoor lighting coefficient, and Cav is the average indoor daylighting coefficient on the working surface.
Based on the GB50033–2013, indoor sunlight meets the minimum requirements with 300 lx. The excessive light on the contrary might be uncomfortable. Wei, W. et al. [22] found that the acceptable range of illumination for humans is between 700 lx ~1800 lx.
The UDI indicates when indoor lighting could be effectively utilized during the day, and is calculated using the following Equation (5) [23]:
UDI = t UD t T
where tud is the useful daylighting time, s; tT is the total daytime, s.

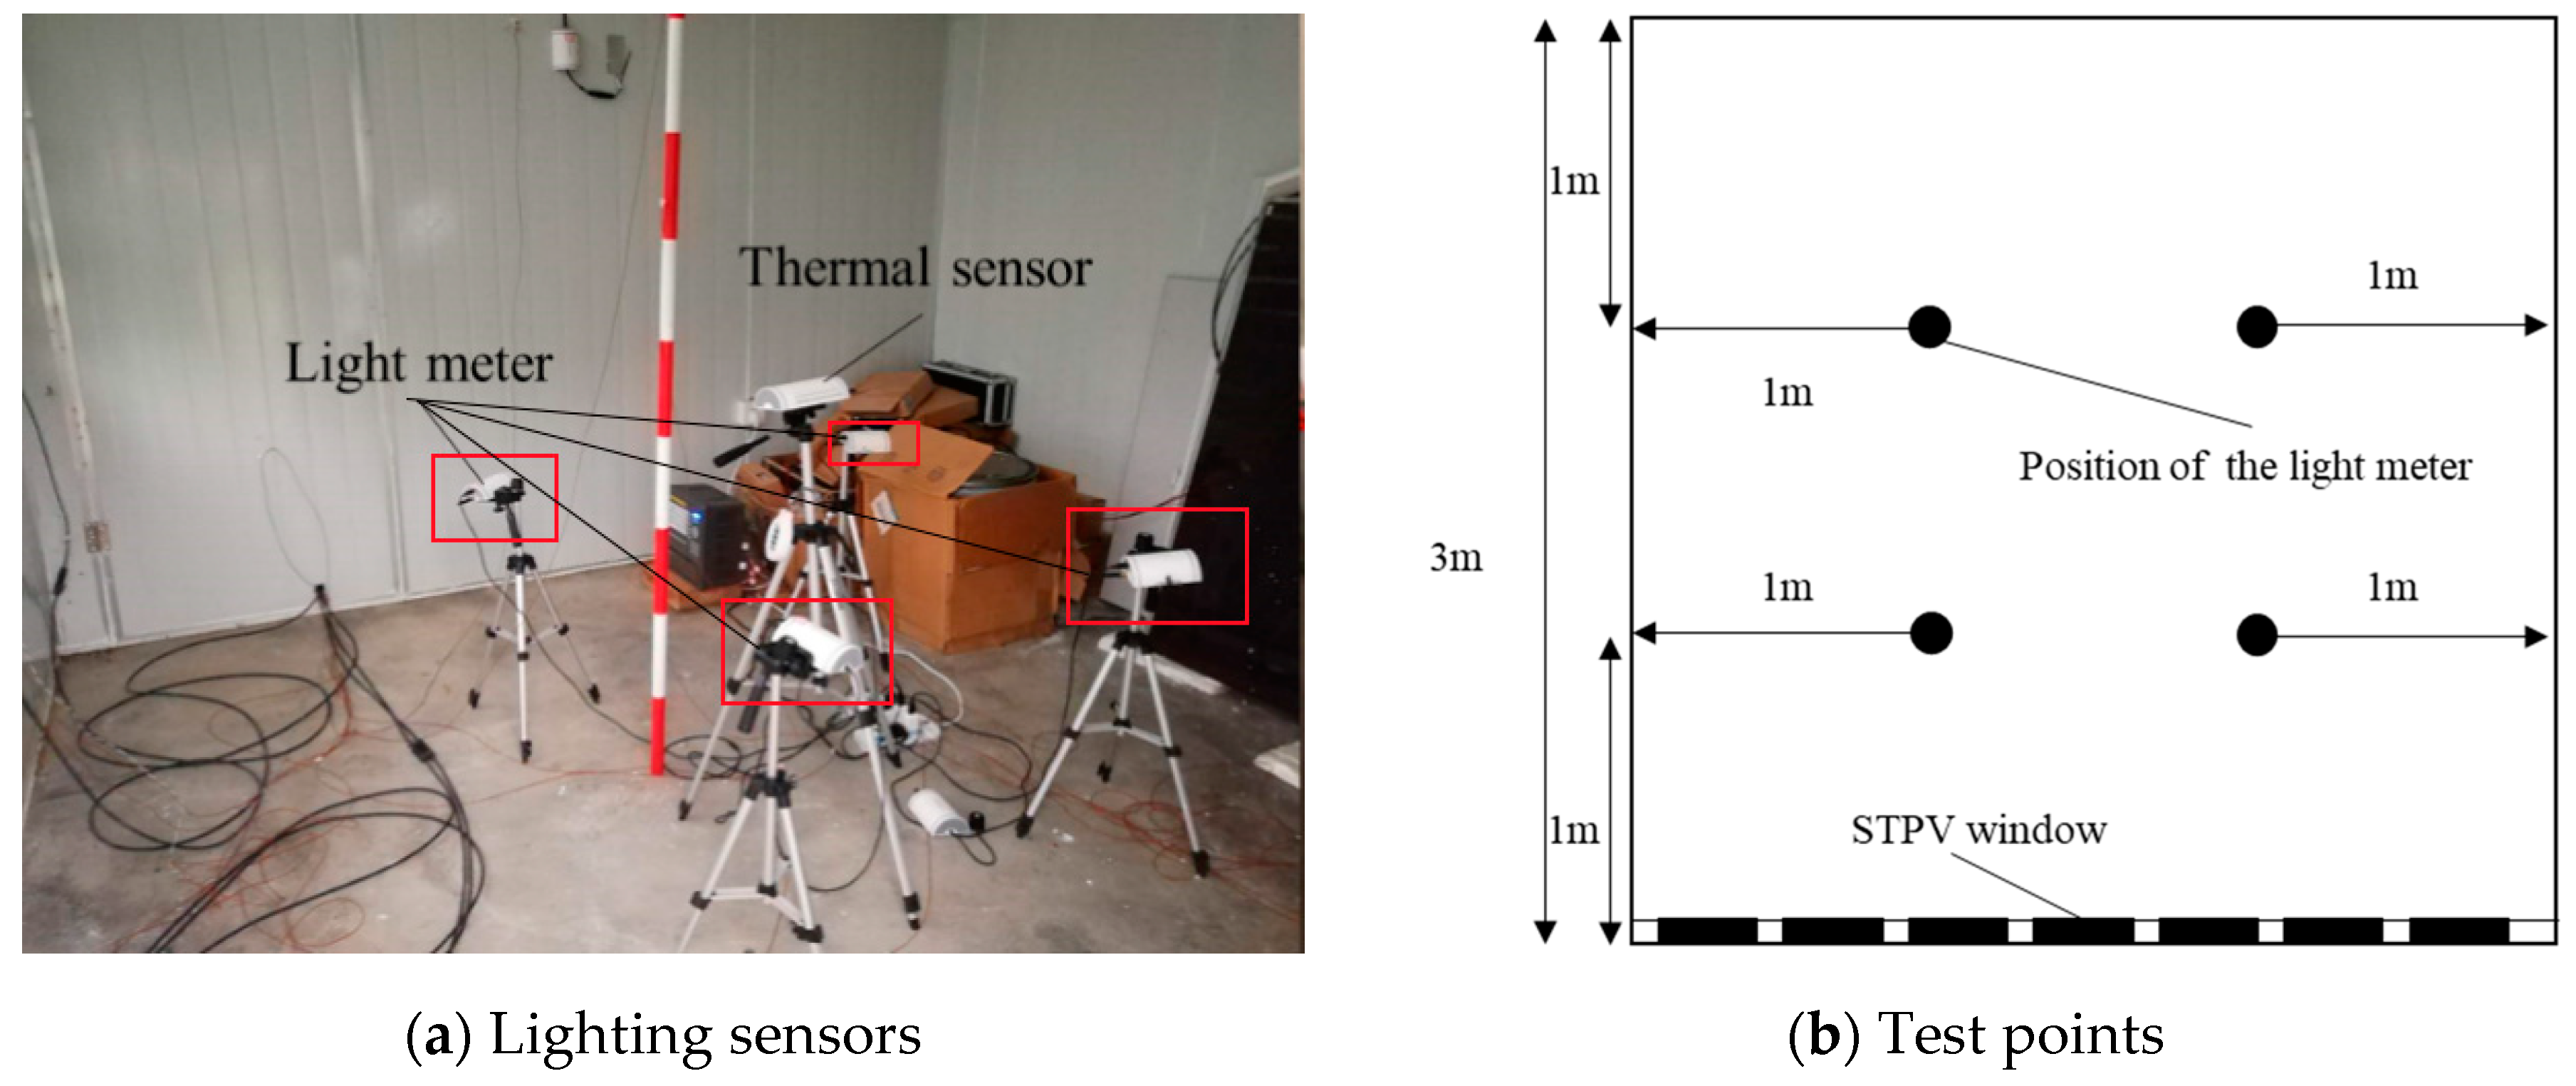
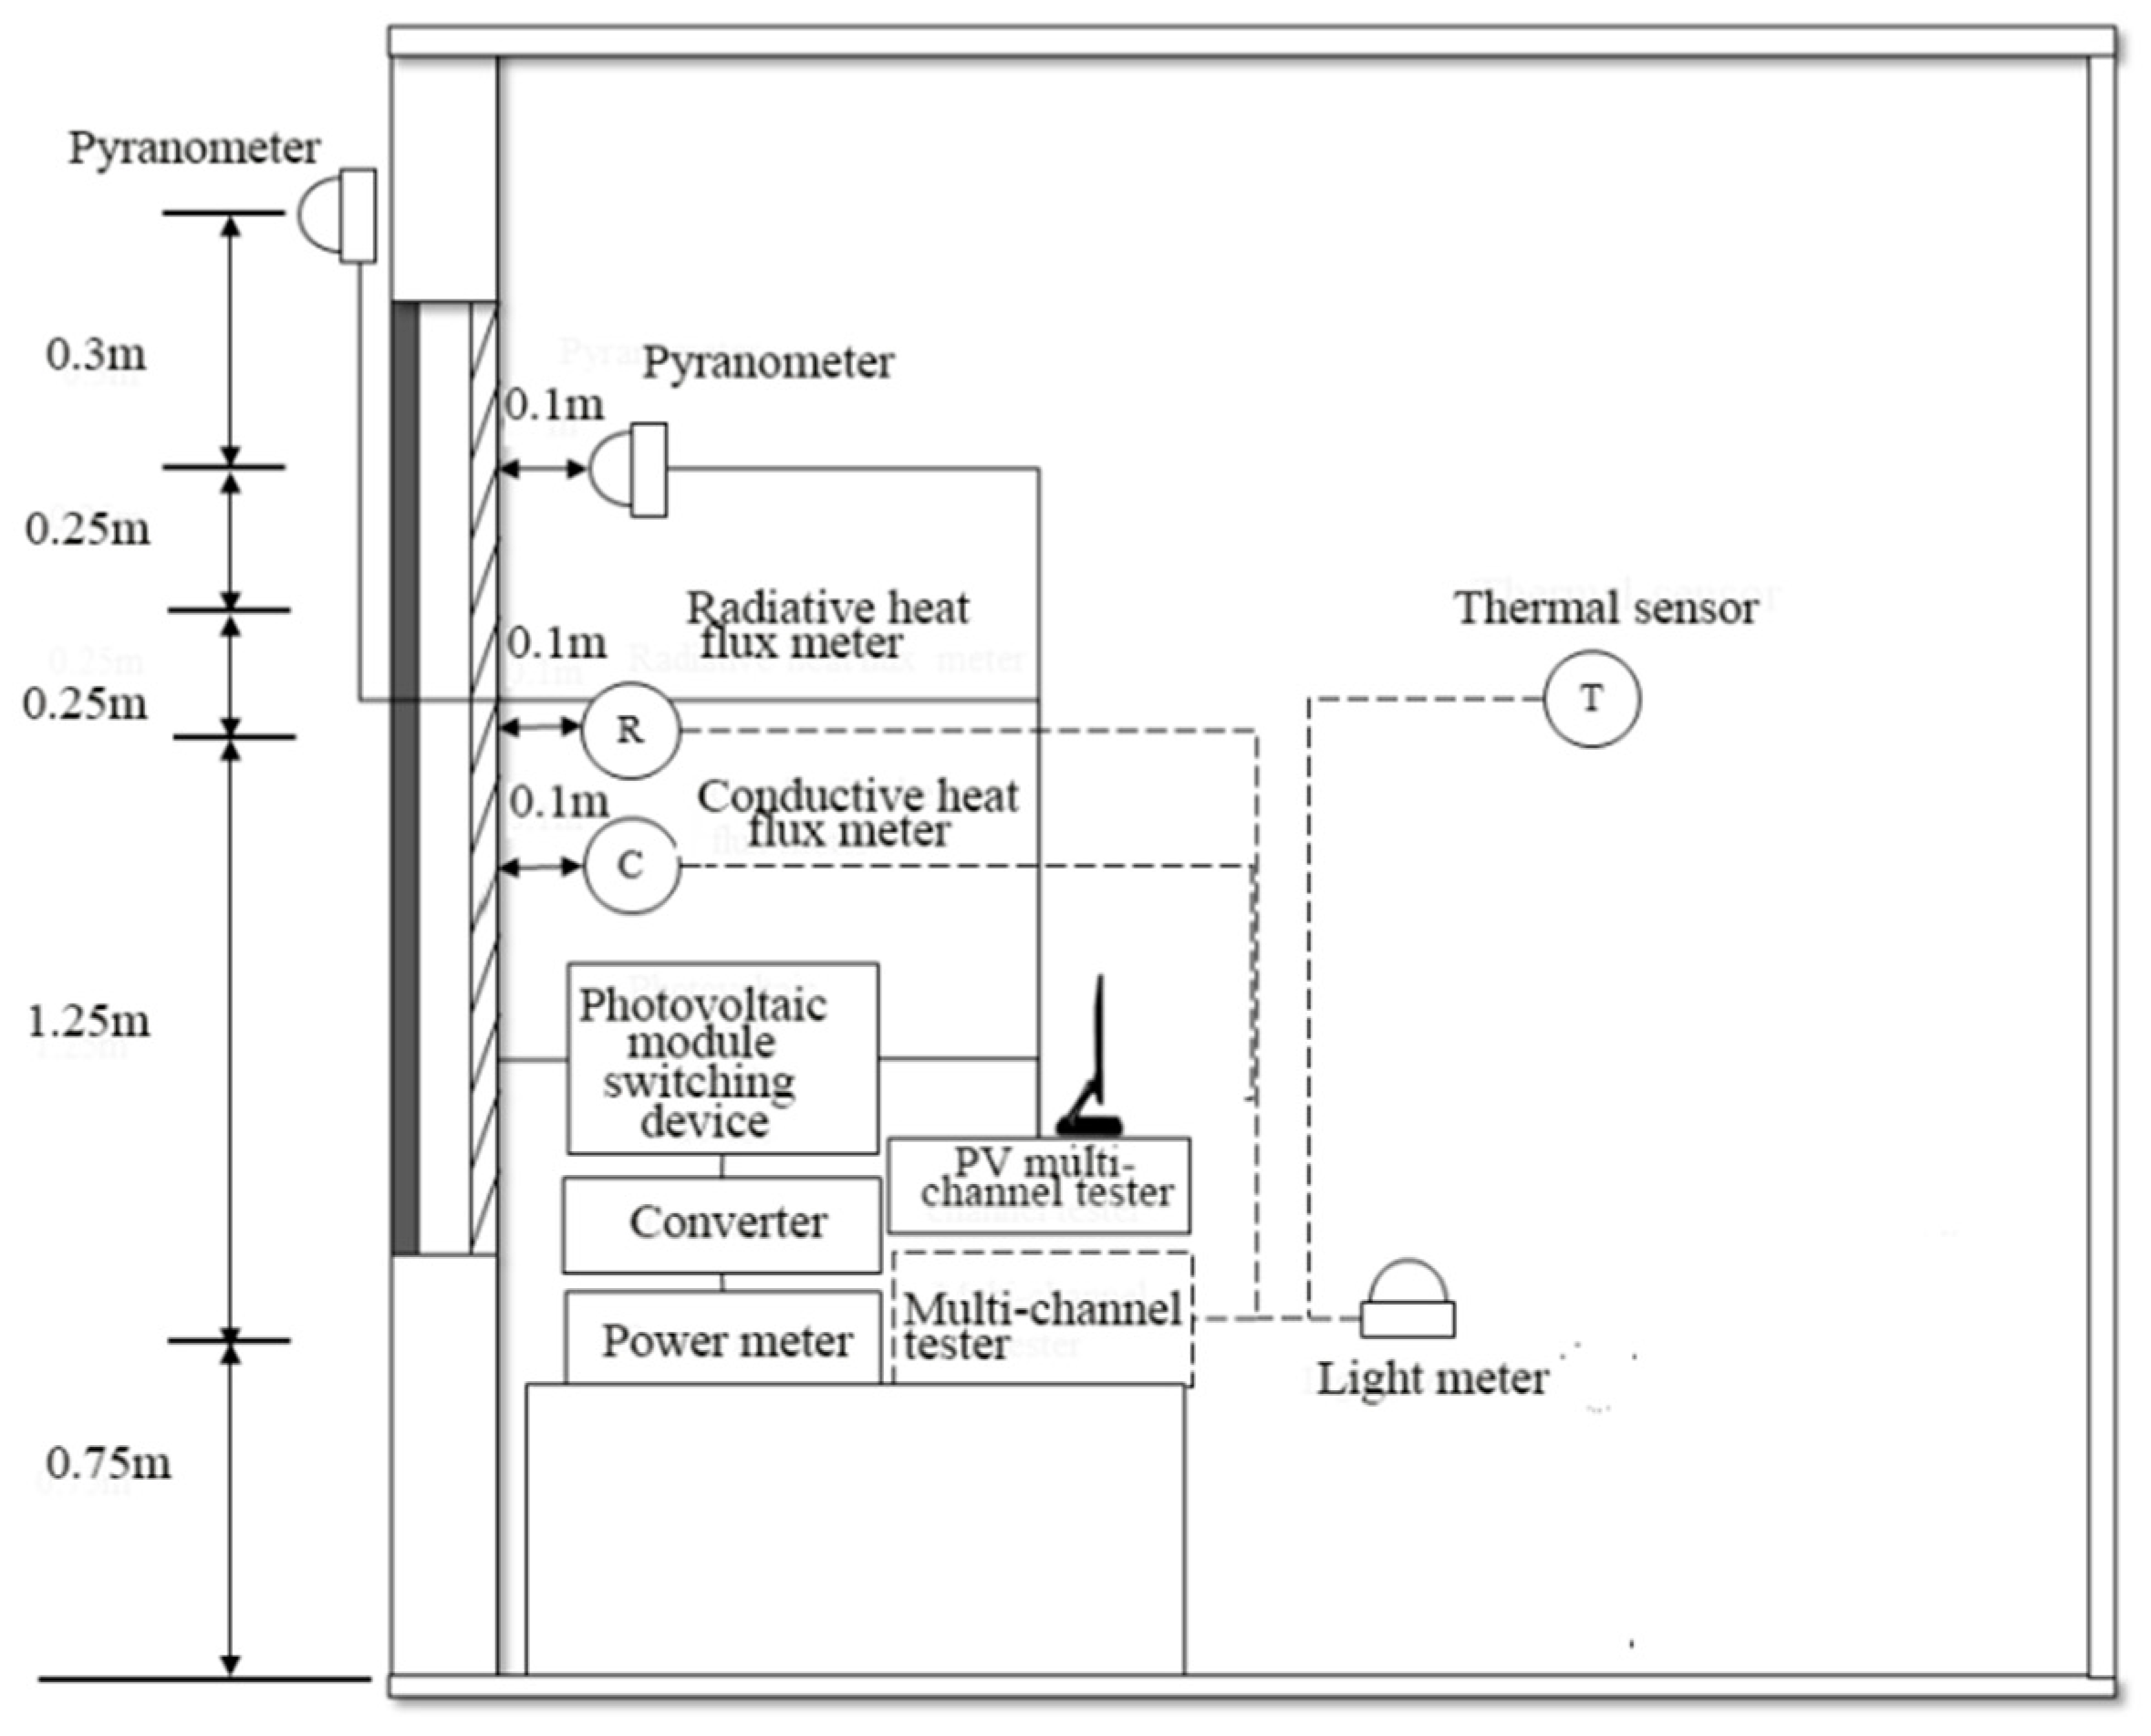
3. Experimental Test Method

The PV modules selected in this paper were produced by Suzhou Talesun PV company. The double-skin C-Si PV window was designed by the project and processed by the Talesun. The structure of the PV Window is shown in Figure 3, which is constructed with one clear glass layer, air gap, and one layer of C-Si PV module. The key parameters of the PV module are collected in Table 1.
As shown in Figure 4, the performance of the PV window was tested in Chengdu, China. It consists of one identical test unit [3 m (depth) × 3 m (width) × 3 m (height)] installed with a PV window. The walls and roof were composed of the 75 mm thick sandwich rock wool board, which could meet the requirements of the thermal insulation determined by the “Thermal Design Code for Civil Buildings” (GB 50176–2016) [24]. To maximize the performance of PV windows, the windows were south facing [25].
The experimental measurement instruments for testing performance of PV window are shown in Figure 5. The experimental test equipment can be divided into four parts: Electrical performance test system, thermal performance test system, optical performance test system, and indoor energy consumption test system. The four measuring points of illuminance measurement was marked in Figure 5a,b. The four wireless lighting sensors are tested on the same time and collected by the data recorder. According to the “Method of daylighting measurements” (GB/T 5699-2017) [26], the four points were evenly distributed indoors to test indoor daylighting illumination on the work surface. The height of the lighting sensors is 1.3 m and the horizontal position of the measuring point is as shown in Figure 5a. In the thermal performance analysis, the inner and outside surface temperature of the PV windows were tested with thermocouples. For the measurement of solar radiation, it was tested by the pyranometer vertical installed on the south facade and room inside. Radiative heat flux and conductive heat flux were tested by the radiant heat meter and conductivity heat flux meter. As shown in Figure 5c. The thermal and lighting equipment were supplied by JianTongtech company. The PV windows electrical performance test system is shown in Figure 5d. The PV testing equipment was used to test irradiance and power generation. The schematic diagram [27] of the test system is shown in Figure 6. The total specific parameters [28] of the key equipment are shown in Table 2.
According to the standard GB 50736-2012, indoor temperature was controlled between 18 and 26 °C [29]. Therefore, the indoor temperature in this experiment is controlled within 26 ± 1 °C degrees in summer and around 18 ± 1 °C in winter. Considering the building lighting consumption, according to the standard GB 50033-2013 [30], when the daylighting illumination on the indoor working surface was less than 300 lx, a 40 W fluorescent lamp was used to provide illumination.

4. Experimental Analysis of the Performance of PV Window

This project was aimed to analysis the performance of C-Si PV window in the summer, autumn, and winter seasons by testing the electrical, thermal, and lighting performance. In accordance with the solar elevation angle and the weather conditions of different seasons, August, October, and December were selected to be the typical months.
As shown in Figure 7, the average daily solar radiation during summer, autumn, and winter was 1.59 kWh/m2, 1.70 kWh/m2, and 1.71 kWh/m2, respectively. For the solar elevation angle, it could indicate the received useful solar radiation on the south façade. According to the historical weather data, it was the highest up to 75° in summer, and it was the lowest with 35° in winter, while during autumn it was 55°. Due to the combined influence of solar altitude angle and weather, although the maximum irradiance on the south-facing wall was the largest in winter, the number of sunny days were the least. At the same time, although it was mostly sunny in summer, the solar altitude angle was high. The maximum solar radiation was far less than the other two seasons. The average solar radiation intensity in the autumn was the largest. The solar radiation resource in the autumn was the richest of the three seasons.

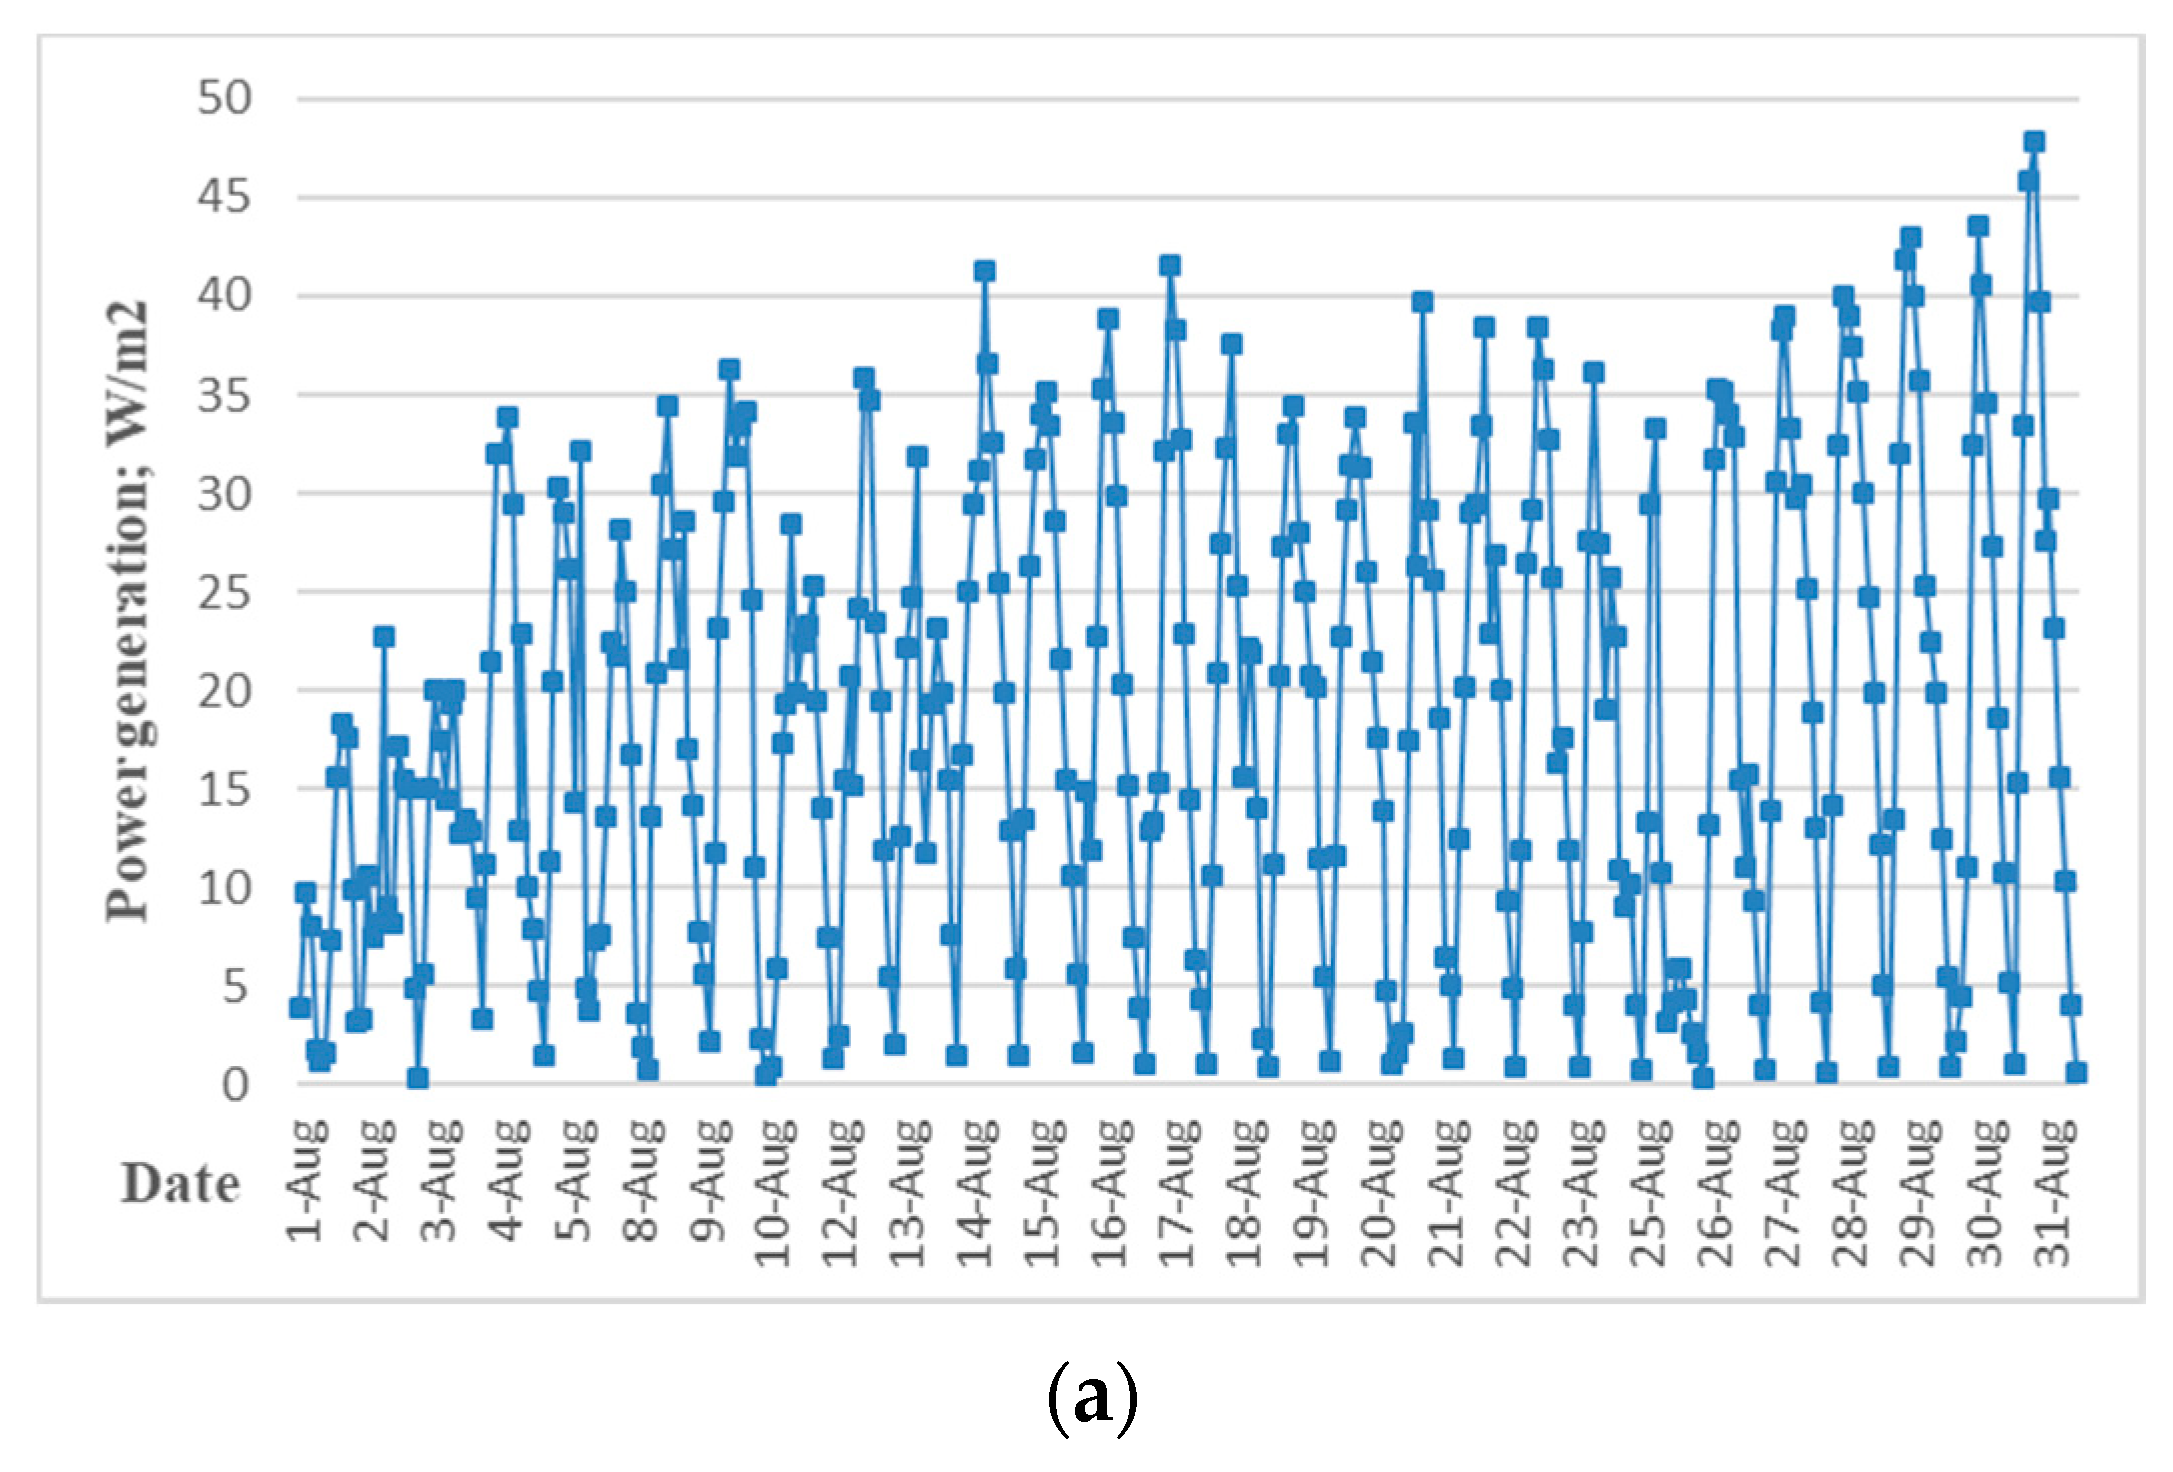
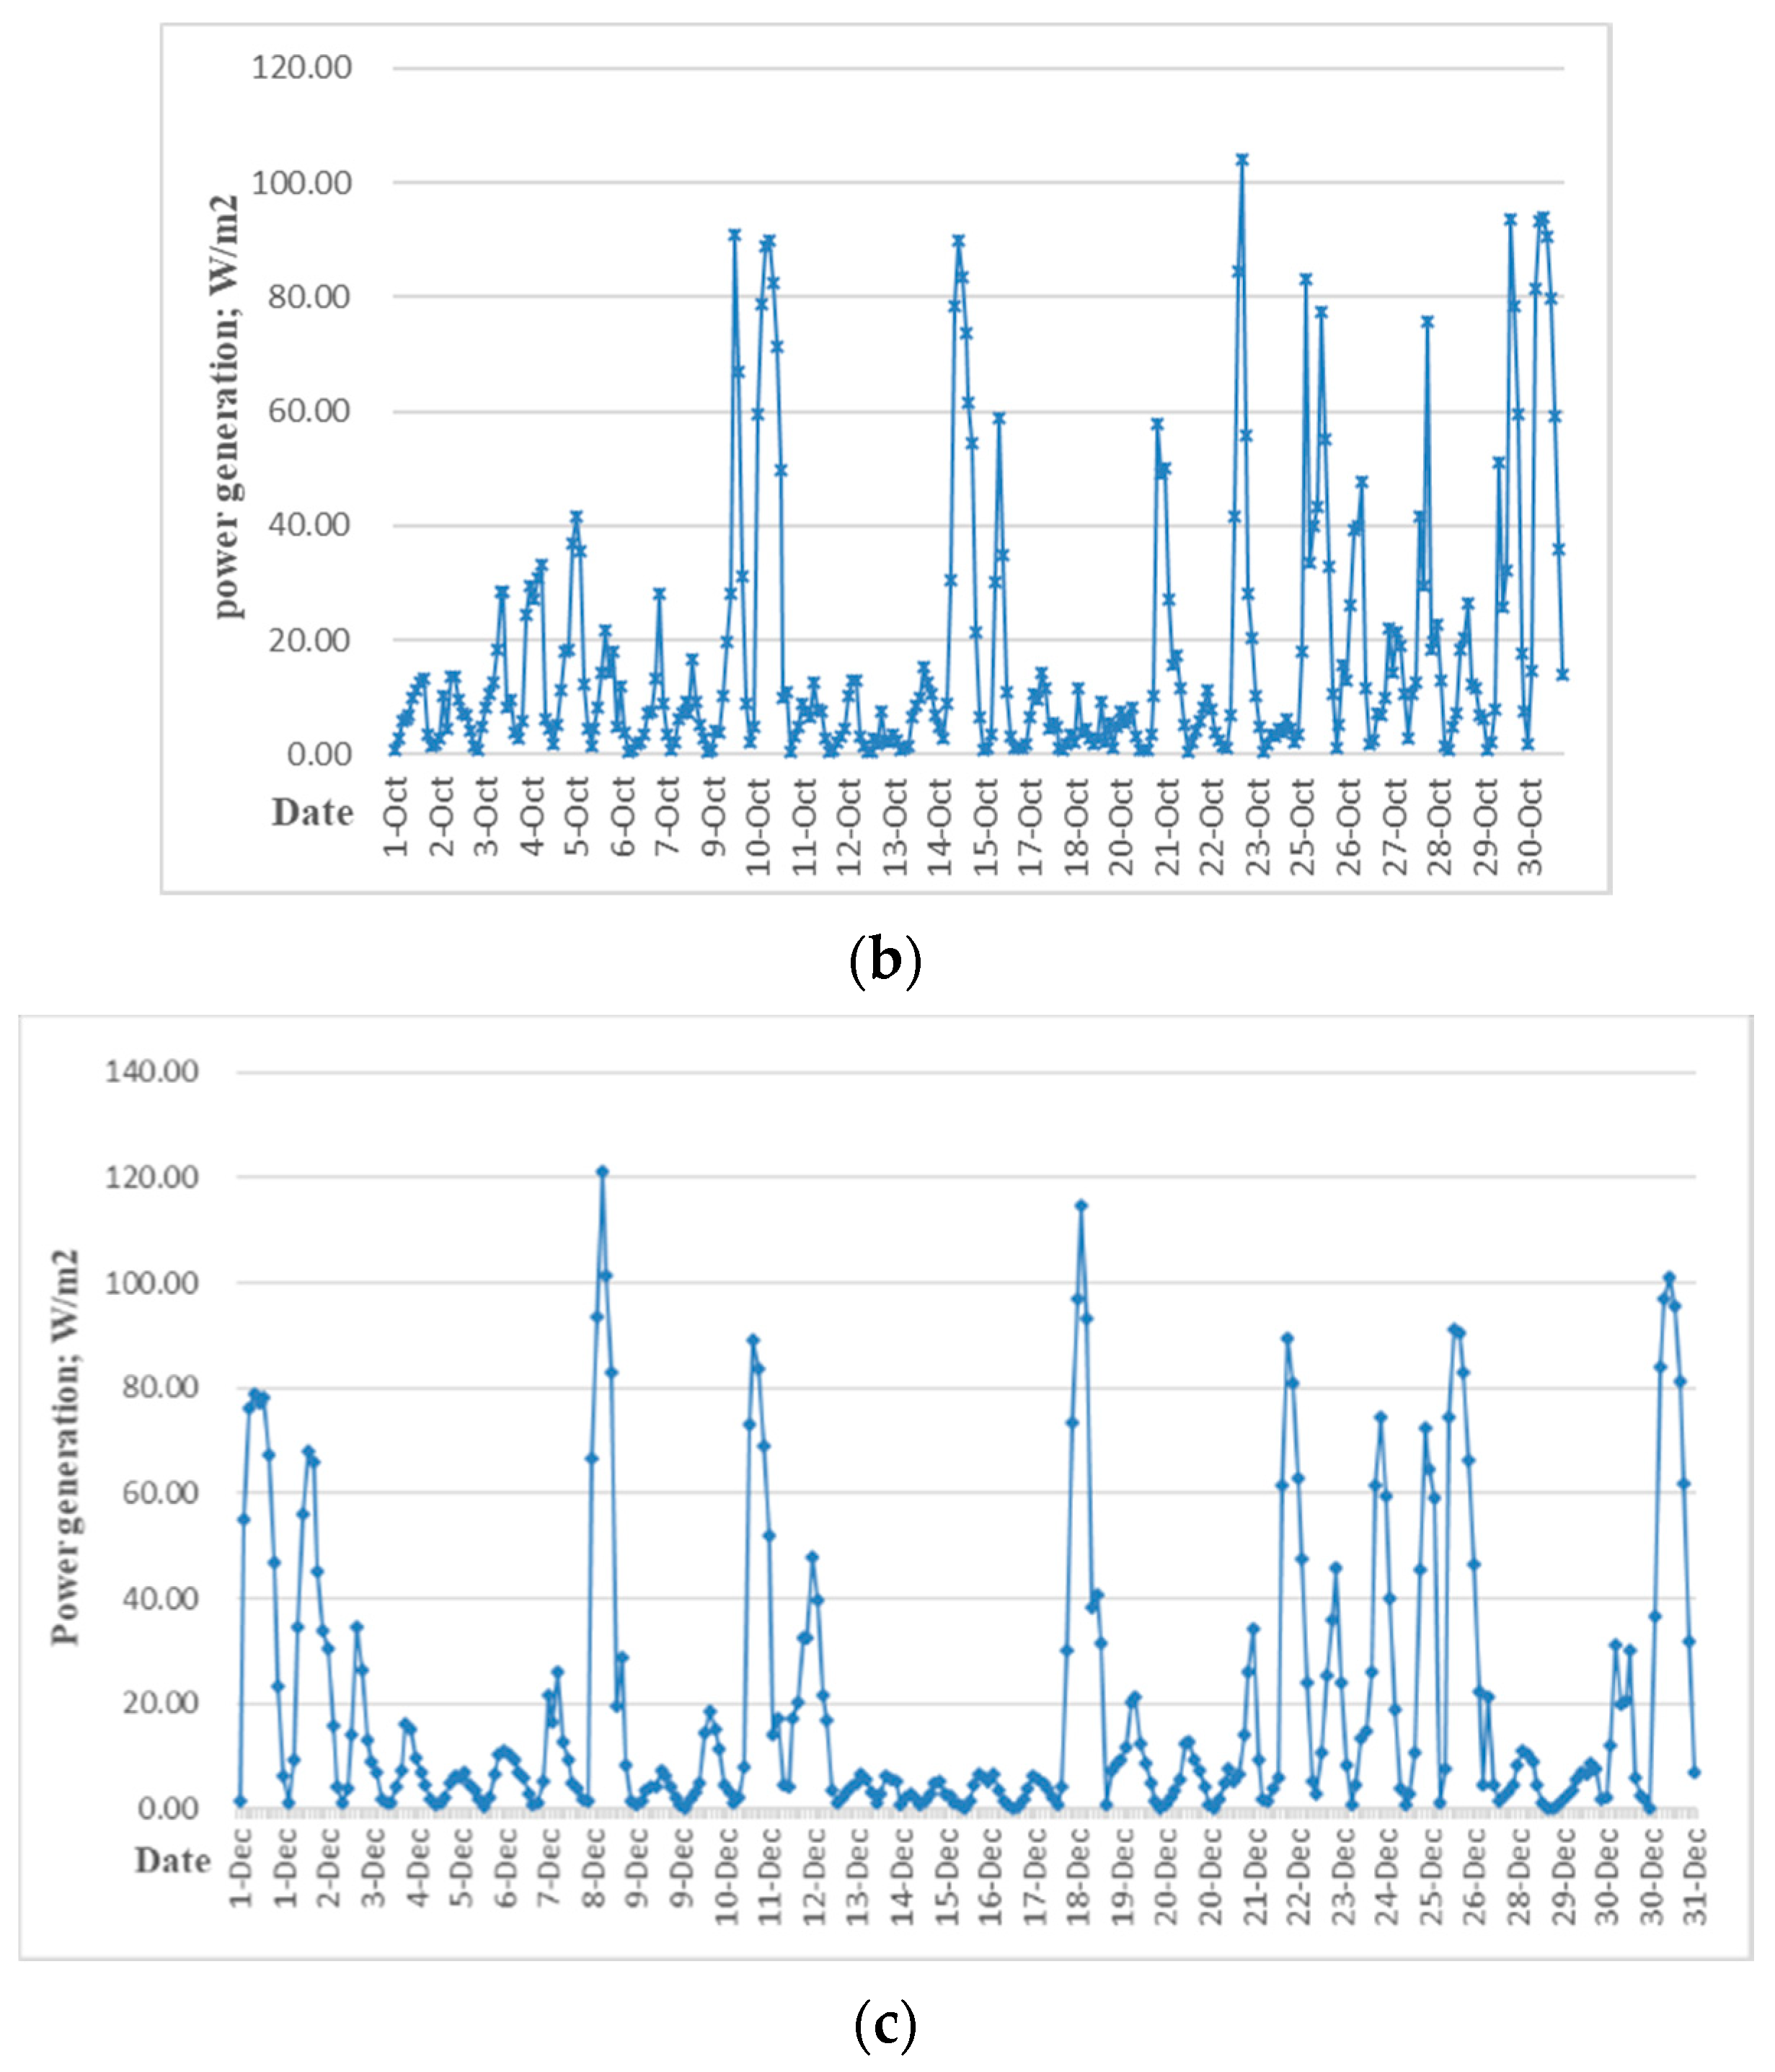
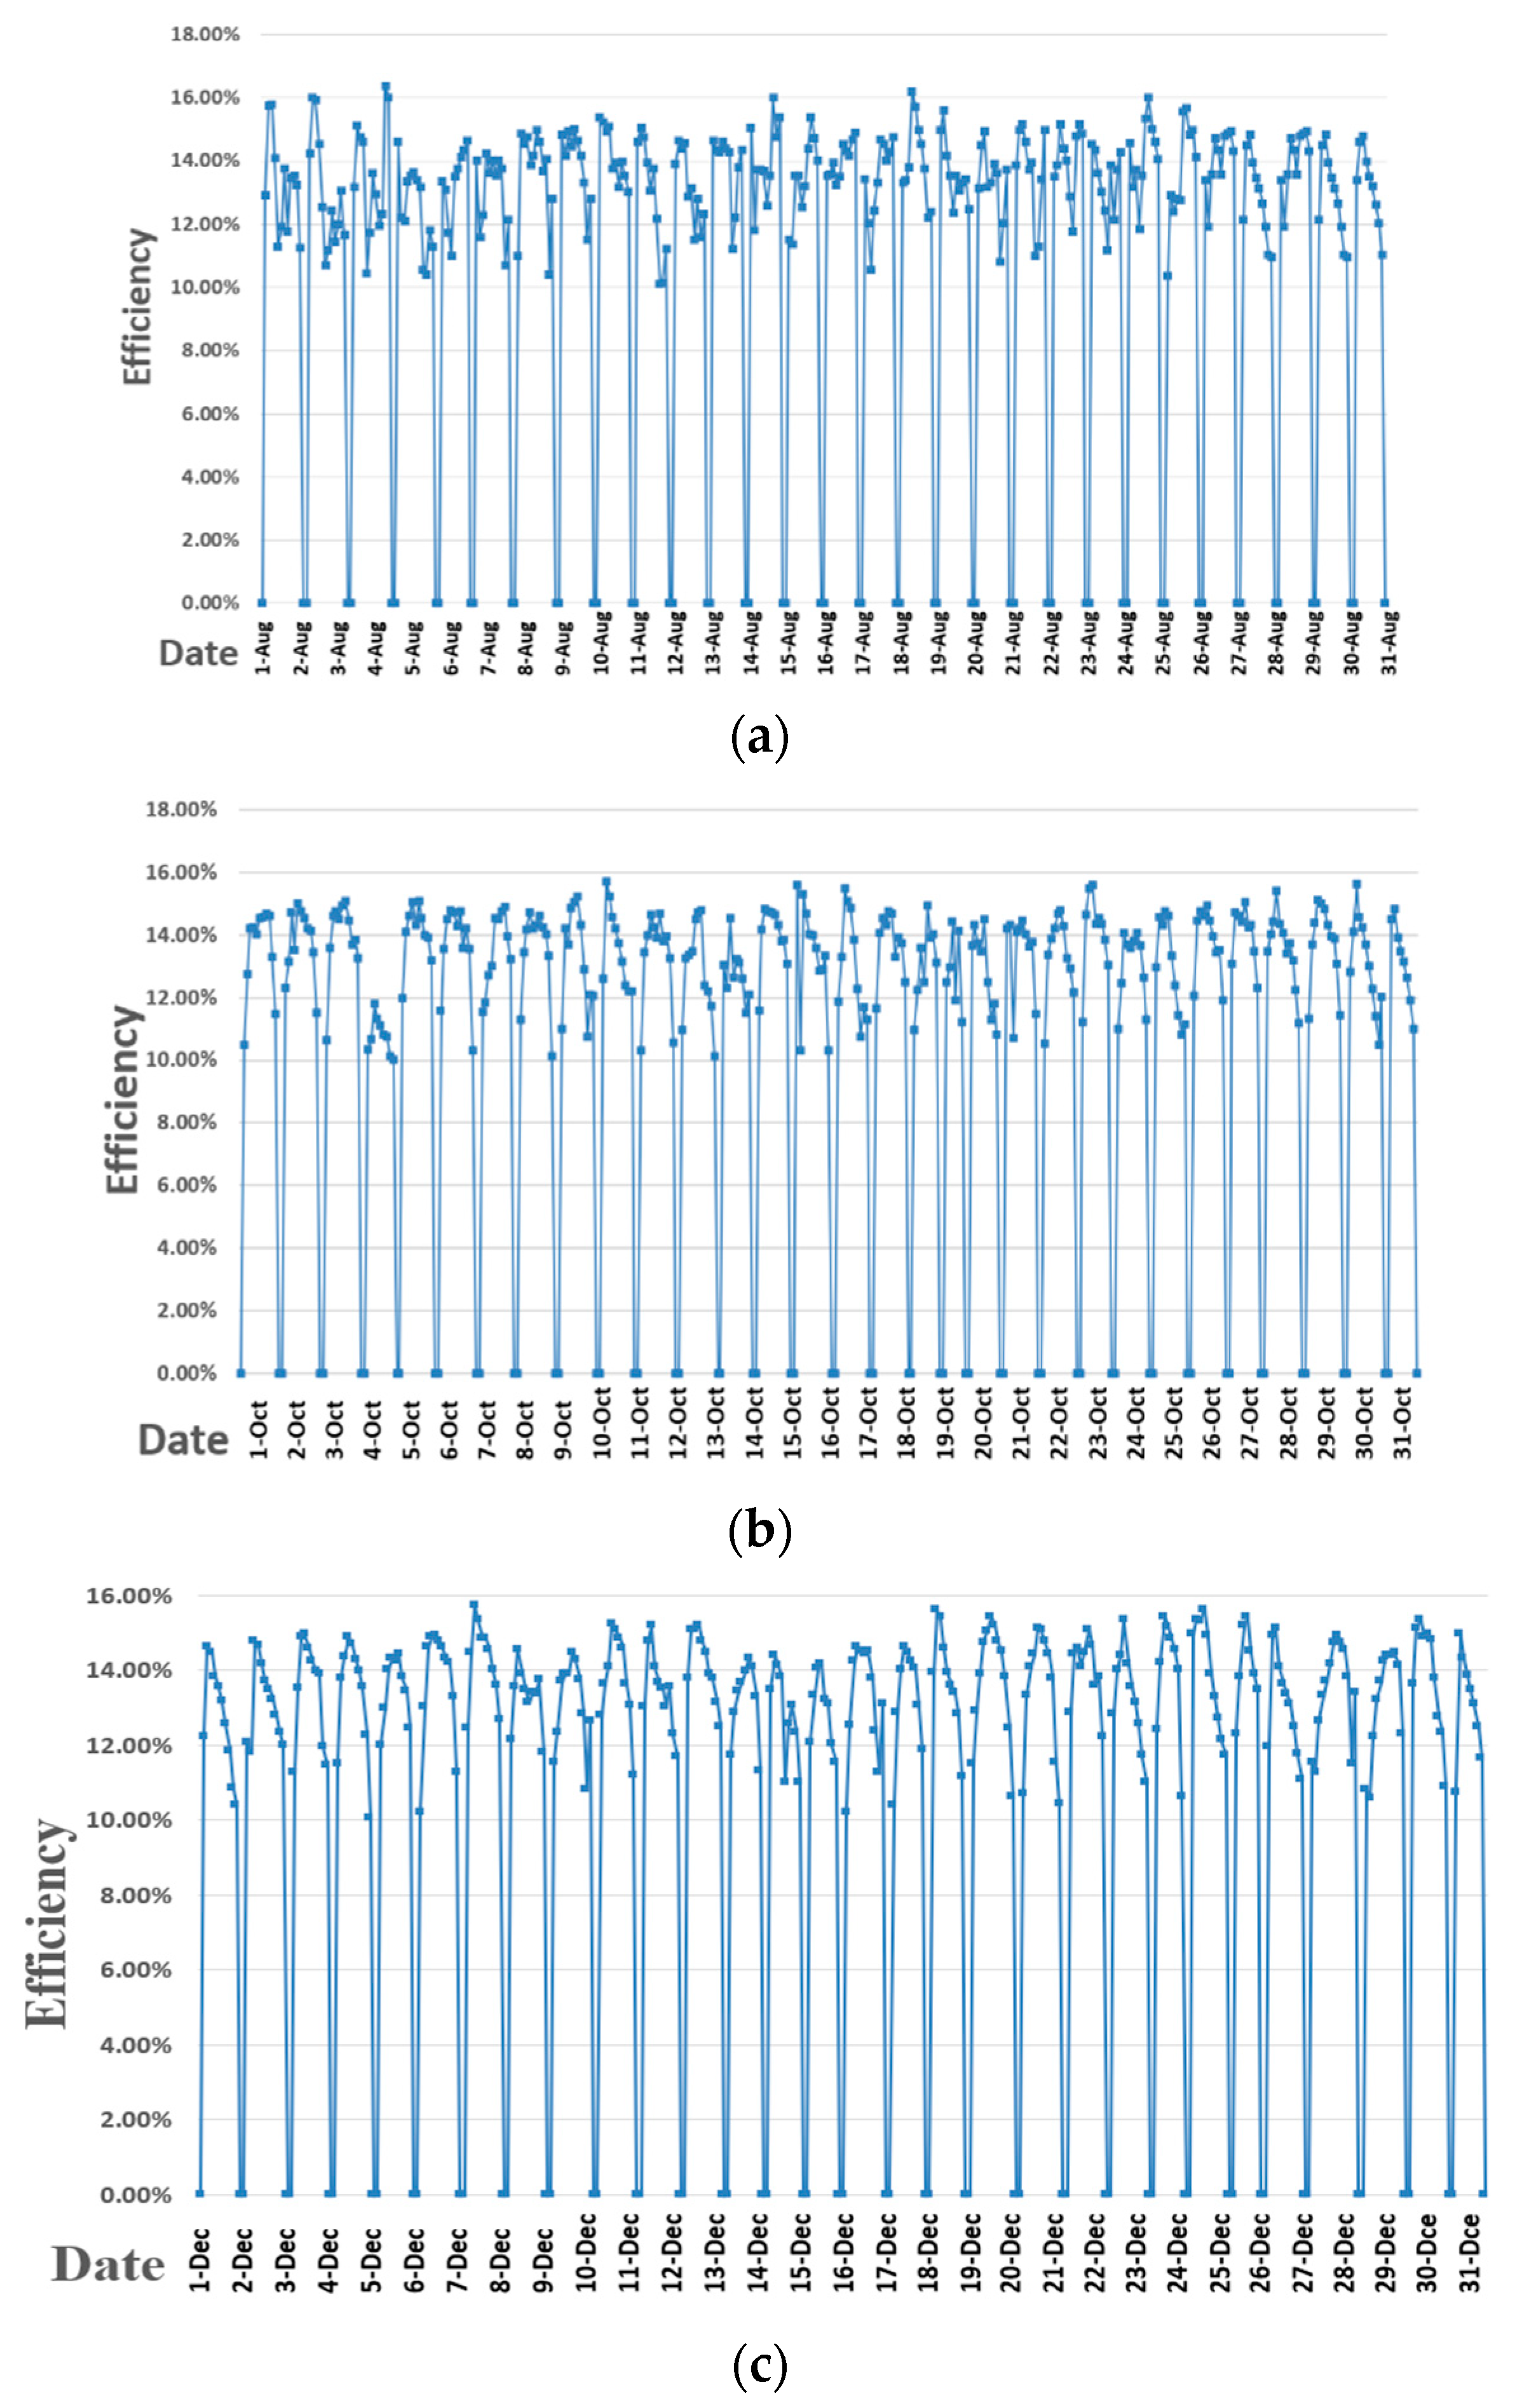
4.1. Analysis of the Electrical Performance

The power generation during the autumn is shown in Figure 8b with the average power generation reaching 50 W/m2, which is the highest among the three typical months, and even there were about eight cloudy days. The electricity generation shown in Figure 8 was DC at MPP, which is recorded by a PV charging controller in order to track the maximum power. The maximum power generation during most sunny days was around 60 W/m2~110 W/m2 because the solar radiation upon the south facade during autumn was relatively high.
Although most of days during summer had more sunlight compared with the other seasons, the irradiance on south façade was the lowest of the three seasons because the solar elevation angle was the highest. Thus, as shown in Figure 8a, the variation of the daily maximum power generation of C-Si PV window was limited during summer with the average power generation being only 13 W/m2.
During winter, the maximum power generation was highest with 120 W/m2 among these three seasons, due to the solar elevation angle being lower than that in the summer and autumn. However, more than half of days were cloudy. The average power generated was only around 45.5 W/m2, which was lower than that in autumn.
The electrical conversion efficiency of the PV window is shown in Figure 9. The average efficiency in summer, autumn, and winter was 14.4%, 13.63%, and 13.47%, respectively. Based on the data from Zhongli Talesun company, the rated conversion efficiency of the C-Si PV module was around 18%. This indicates that the innovation designed C-Si PV windows could work normally under the current climate conditions. Although the power generation performance of photovoltaic windows varied in different seasons, the power generation efficiency of photovoltaic windows did not have significant changes in different seasons.
For the further details, three continuous typical days were selected in August, October, and December, including the different climate such like sunny days, cloudy days, and overcasts day. The results were summarized in the following figures, and we also added in the article.
Figure 10 shows the solar radiation on the south elevation of typical days. Solar radiation increases in the morning, reaches its peak at noon, and decreases gradually to evening. In winter, the maximum solar radiation peak appeared at 11:00 noon on December 8, reaching 871.6 Wh/m2. However, there are more cloudy days in winter, and the peak values of the other two days are only 175.5 Wh/m2 and 49.2 Wh/m2. Generally speaking, the solar radiation in autumn is the largest, with the peak values of 612 Wh/m2, 2389 Wh/m2, and 97.0 Wh/m2, respectively. In the study by A Gagliano et al. [31], buildings in many cities have the highest monthly solar radiation on the facade in autumn, which is higher than that in summer and winter. It is consistent with the test results showed in Figure 10.
The hourly power generation 15th to 17th August is shown in Figure 11a. Although there is plenty of sunshine in most of the summer, the radiation on the south facade is limited due to the highest elevation of the sun, and the power generation is also limited. Taking 17th August as an example, from 8:00 a.m., the power generation gradually increased, and finally reached the maximum value of 41.6 Wh/m2 at 12:00 p.m., and then gradually decreased until 7:00 p.m. The other two days had a similar trend because they were sunny.
The hourly power generation in autumn is shown in Figure 11b. Different from 15th to 17th August, although there are more cloudy and overcast days from 15th to 17th October, it still could reach the maximum value of 89.9 Wh/m2 at 12:00 p.m. on 15th October. The maximum power generation is 58.8 Wh/m2 with cloudy day on 16th October, and it is 14.3 Wh/m2 with overcast day on 17th-October.
The hourly power generation from 15th to 17th December is shown in Figure 11c. On 8th December, from 8:00 a.m., the power generation gradually increases, and finally reaches the maximum value of 121.2 Wh/m2 at 12:00 p.m., and then decreases gradually until 6:00 p.m. However, there are more cloudy and overcast days in winter. On 7th and 9th December, it is only 26.0 Wh/m2 and 7.1 Wh/m2, respectively. Although winter has the maximum power generation peak value, the total power generation is not as good as that in autumn.
The electricity conversion efficiency of PV window is shown in Figure 12. On 15th, 16th, and 17th August, the average efficiency was 14.23%, 13.58%, and 13.85%, respectively. In autumn and winter, it can be found that the average conversion efficiency of photovoltaic window also fluctuated in the range of 13–15%, which was a similar trend with the monthly variation.

4.2. Analysis of the Thermal Performance

Figure 13 shows the inner and outer surface temperature. The average ambient temperature was 29.5 °C, 17.6 °C, and 9.6 °C in August, October, and December, respectively. The outside surface temperature was mainly impacted by the outdoor ambient temperature and the PV module during the daytime. The average temperature of the outside surface on sunny days reached up to 48 °C in autumn, which is higher than summer (43 °C) and winter (41 °C). Thus, the power generation during autumn was much higher than that in the summer, and the outdoor ambient temperature was much higher than that in winter. The average temperature difference between the inner and outside surface was over 7 °C during the daytime on sunny days among the three seasons, primarily due to the thermal insulation of the C-Si PV window.
At night, the average inner surface temperature was only 24 °C in summer because the indoor air temperature was controlled within 26 ± 1 °C using an air conditioner. The inner surface temperature of C-Si PV window was higher than the outer surface temperature at night during autumn and winter, which means that the heat was transmitted from indoor to outdoor at night. As shown in Figure 13, although it is affected by the heat transfer of PV window, the indoor temperature could maintain between 18 °C and 26 °C in most of the time, which indicates the indoor thermal environment was comfortable [32].
From the energy conversion formula of photovoltaic windows, the solar radiation intensity of the south-facing wall is much lower than that of the other two seasons. However, as shown in Figure 14, the outdoor air temperature in summer is much higher than that in the other two seasons, with a maximum of 40 °C. Therefore, the average temperature of the outer surface of the photovoltaic window in summer is much higher than that of the other two seasons, reaching as high as 48 °C. During autumn and winter, the difference between daytime and outdoor average ambient temperature is only 5 °C. The difference of solar radiation intensity between the south-facing walls in these two seasons is not significant, which means the difference of average daytime surface temperature of photovoltaic windows in these two seasons could be negligible with only 2 °C. However, since the average temperature in summer can reach above 30 °C the room needs indoor cooling in summer in Chengdu. Therefore, it is important to improve the insulation of photovoltaic windows in summer to reduce the impact of the heating of photovoltaic windows on the indoor thermal environment. Because the outdoor environment temperature is too low in winter, the photovoltaic windows could generate part of heating energy.
Figure 15 shows the windows heat gains of C-Si PV window. The fluctuation of windows heat gain was similar to the changes in the surface temperature of the C-Si PV window. During the daytime, due to solar radiation and the heating of the PV modules, the heat gained by the windows was much higher than that at night, amounting to over 60W/m2 in summer, 80 W/m2 in autumn, and 70 W/m2 in winter, respectively, on sunny days. At the same time, according to the previous performance analysis of photovoltaic windows, it generate less electricity in summer, and the heat gain through photovoltaic windows is more than 60W/m2 in most of the daytime. Therefore, in summer, some external shading measures need to be used to further reduce the heat gain entering the indoor environment through photovoltaic windows. In winter, the maximum indoor heat reached up to 160W/m2 through photovoltaic windows in the daytime. Also, since indoor heating is required during winter, photovoltaic windows can effectively use the excess heat generated indoor and provide heat for the building.
To further understand the thermal insulation performance of photovoltaic windows, the U-value of the window was calculated by Equation (4), and the calculated results show that the average U-value of the PV window was 2.38 W/(m2·K). It showed that the PV window could reduce the loss of indoor thermal load.
In order to analyze the shielding effect of PV window on solar radiation, the SHGC of the PV window was calculated using Equation (3). The test results show that the SHGC of the PV window is 0.22, which is smaller than that of the common glazing with 0.72. It indicates that the PV window is better than the common glazing in reducing solar heat gain, which would perhaps decrease the building cooling load in summer and increase the building heating load in winter.
The U value and SHGC statistical analysis in typical days were given, which were based on the regression method. The analysis results are summarized in Figure 16. For the U value, when the temperature difference is small, there will be some uncertain results. For the SHGC, when the solar radiation is low, there is uncertain results [18].

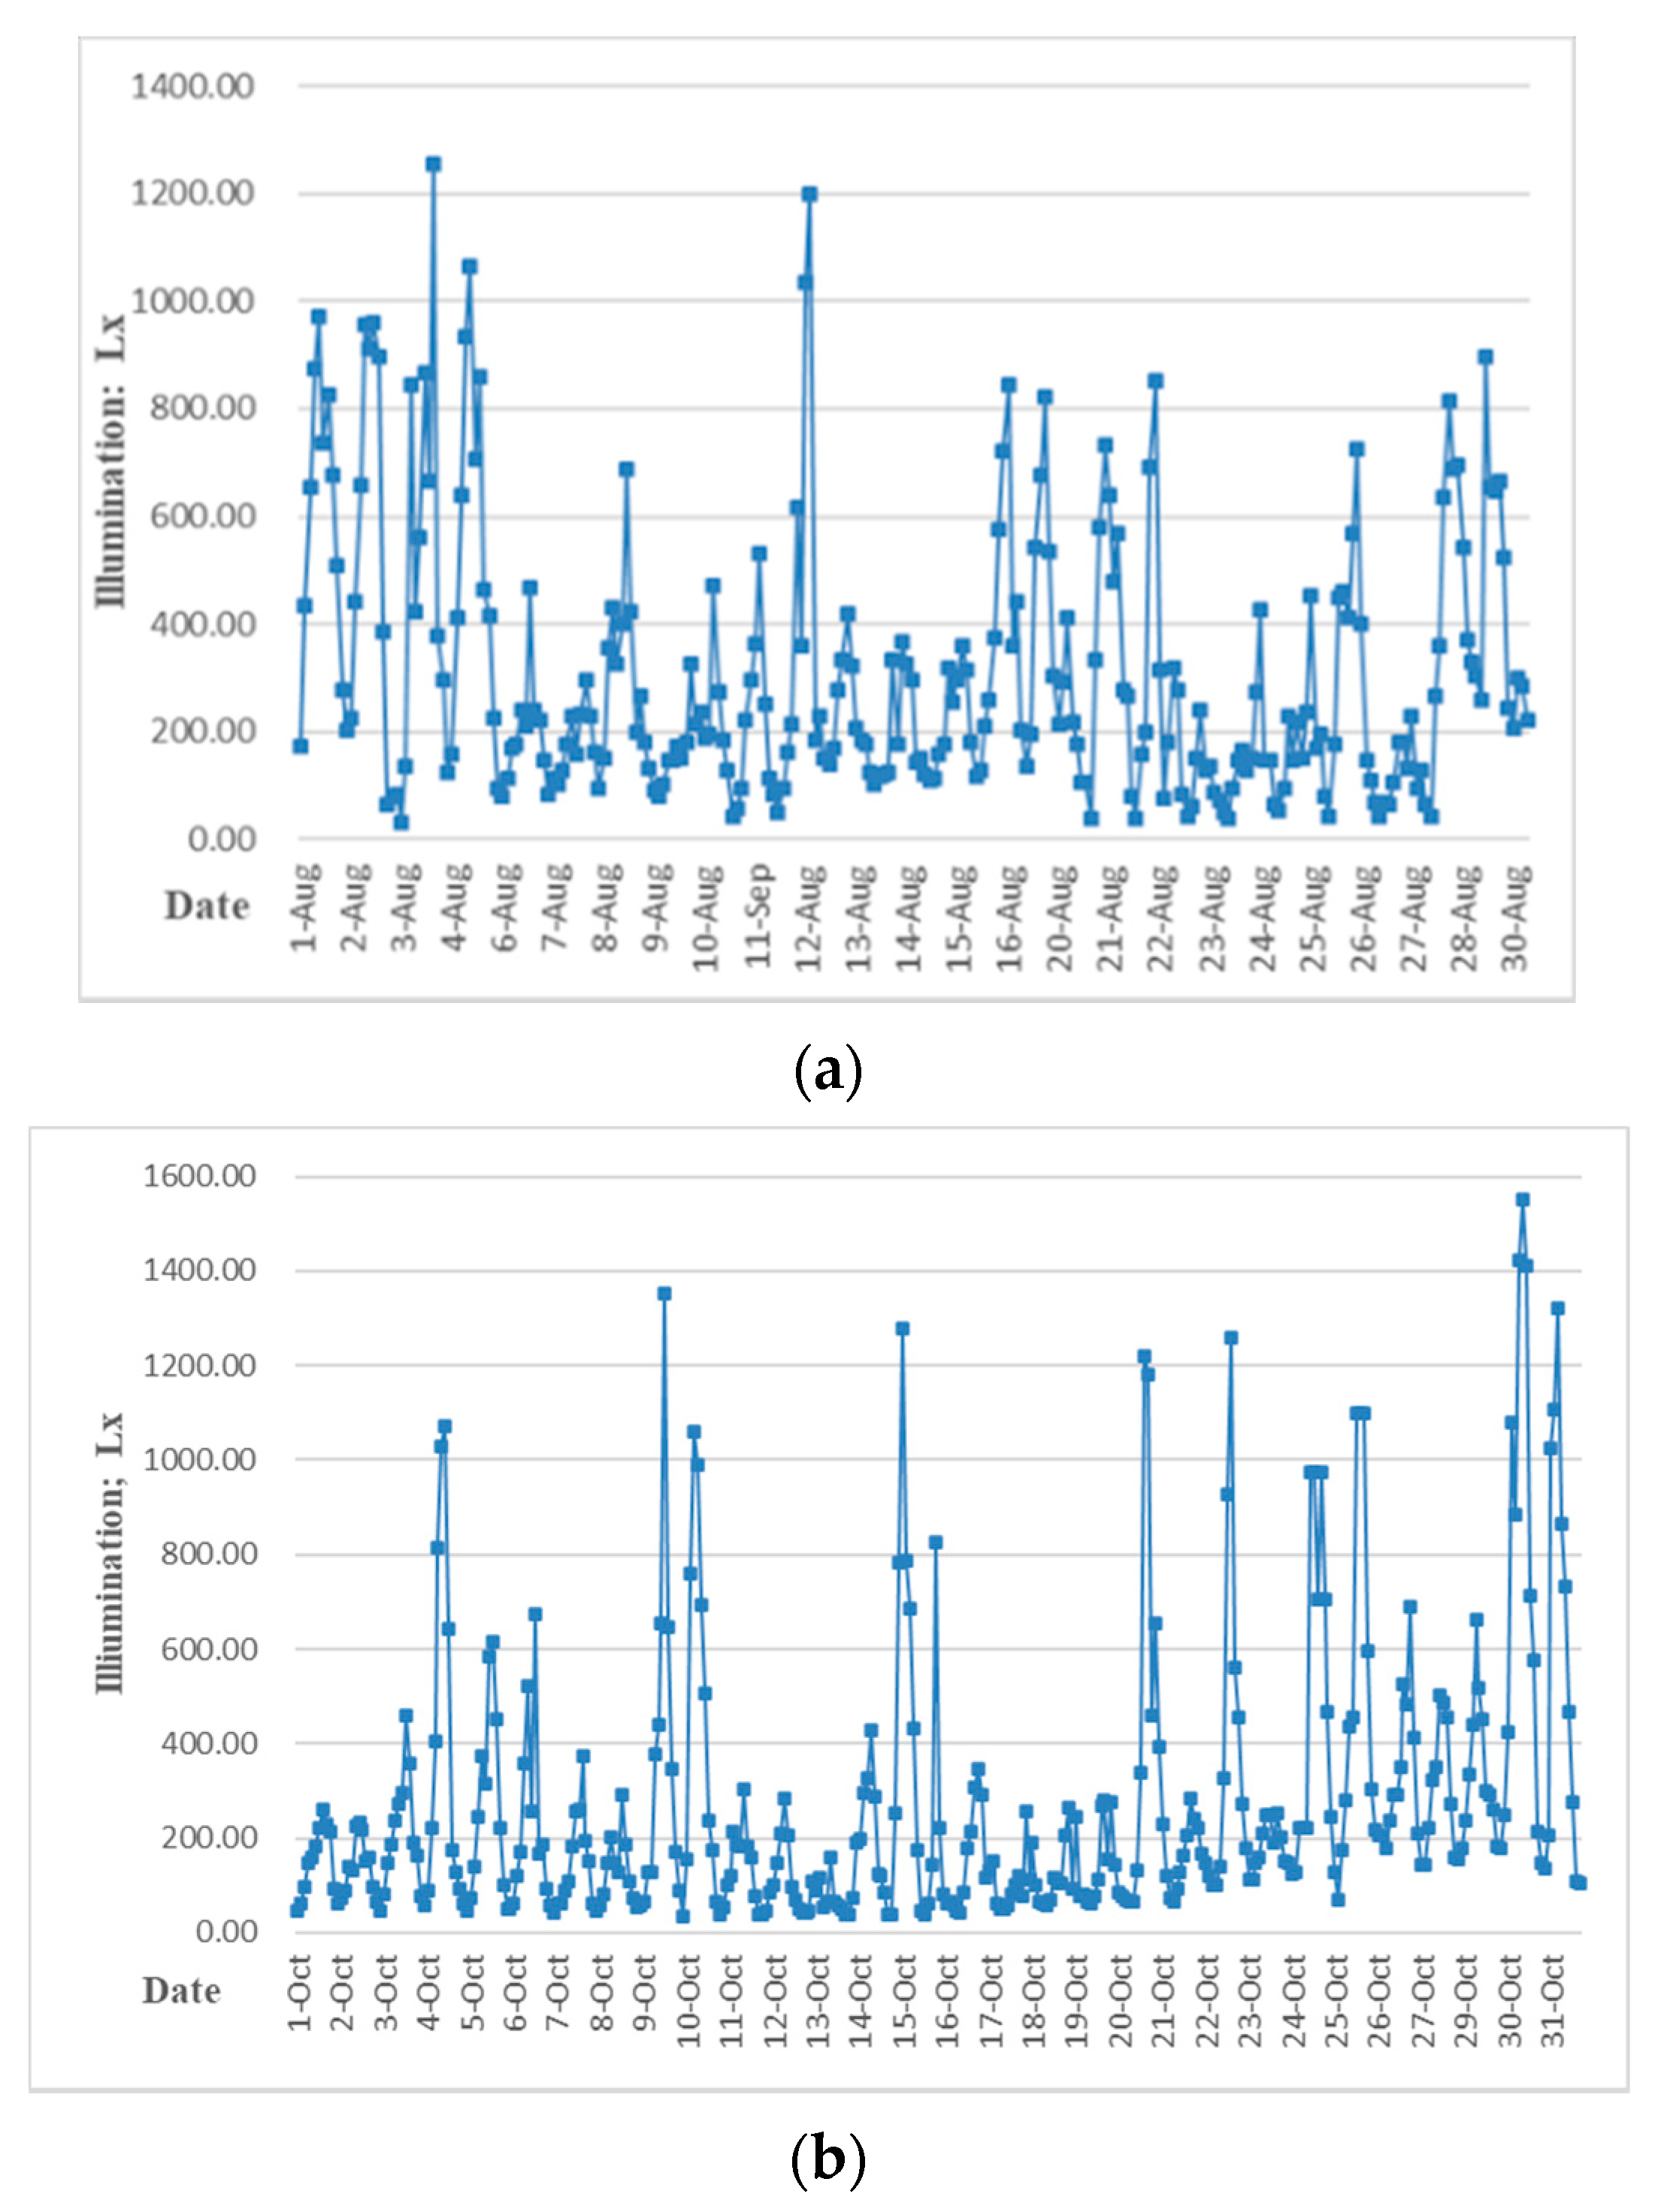
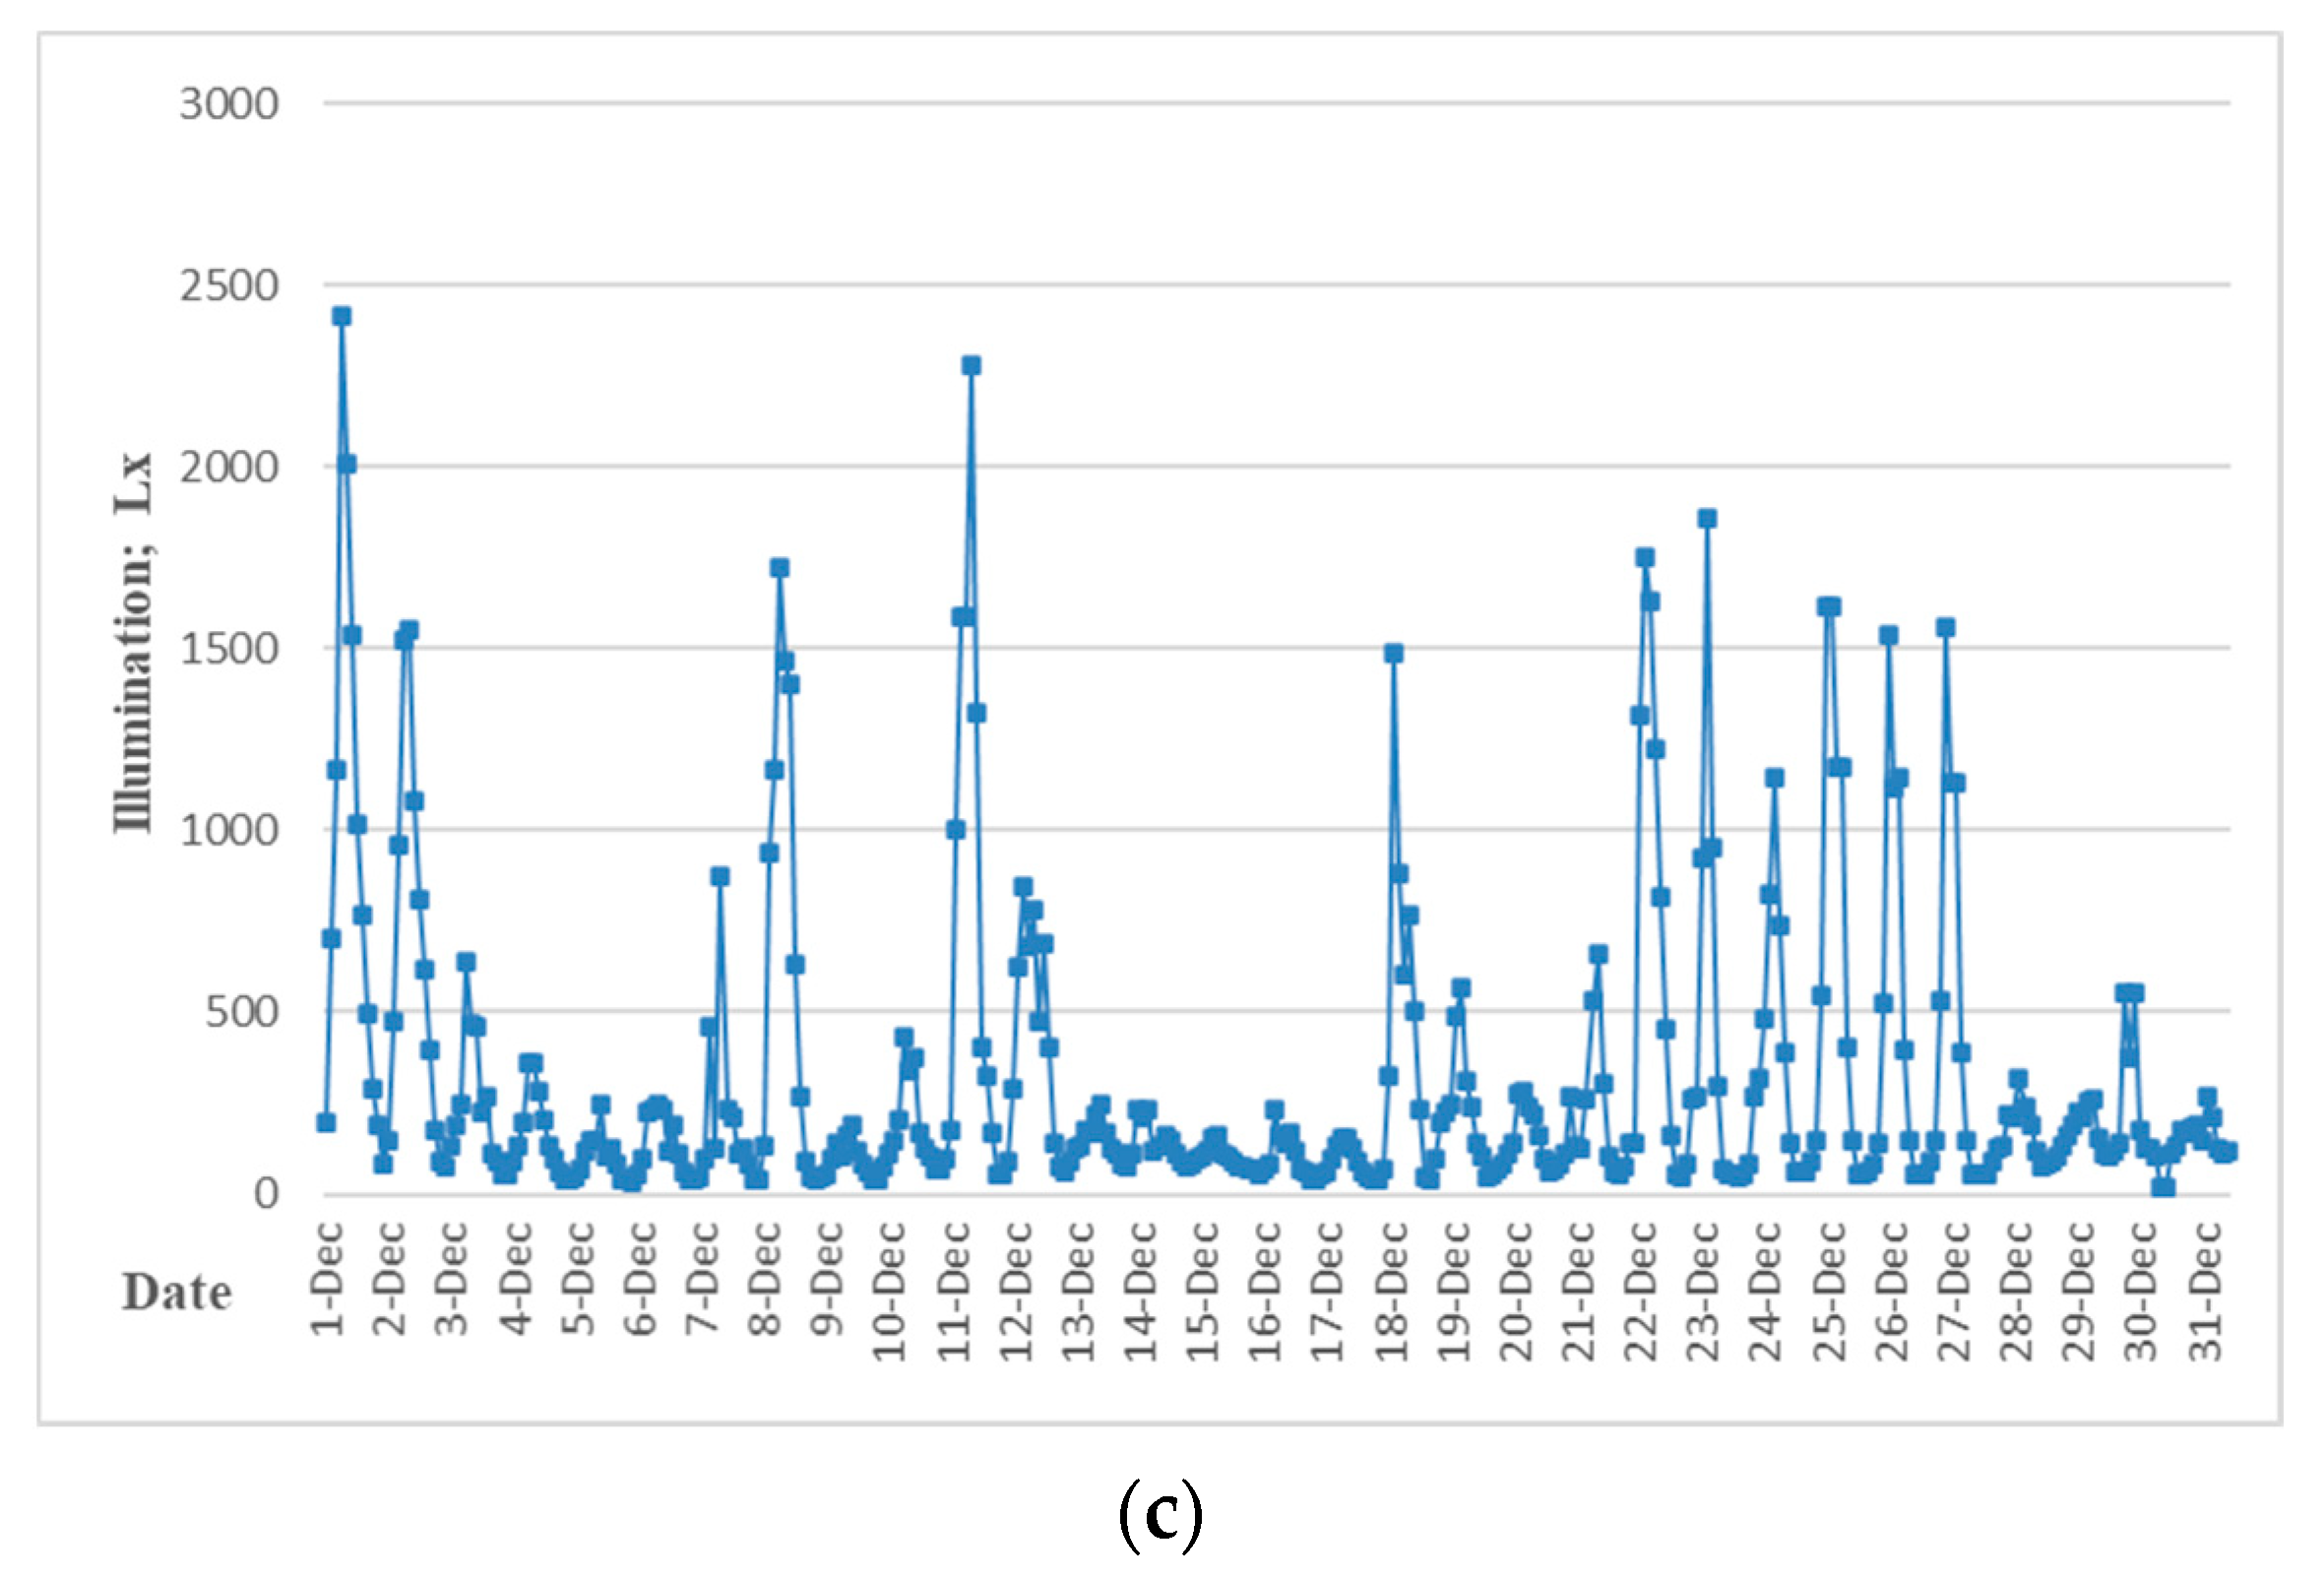
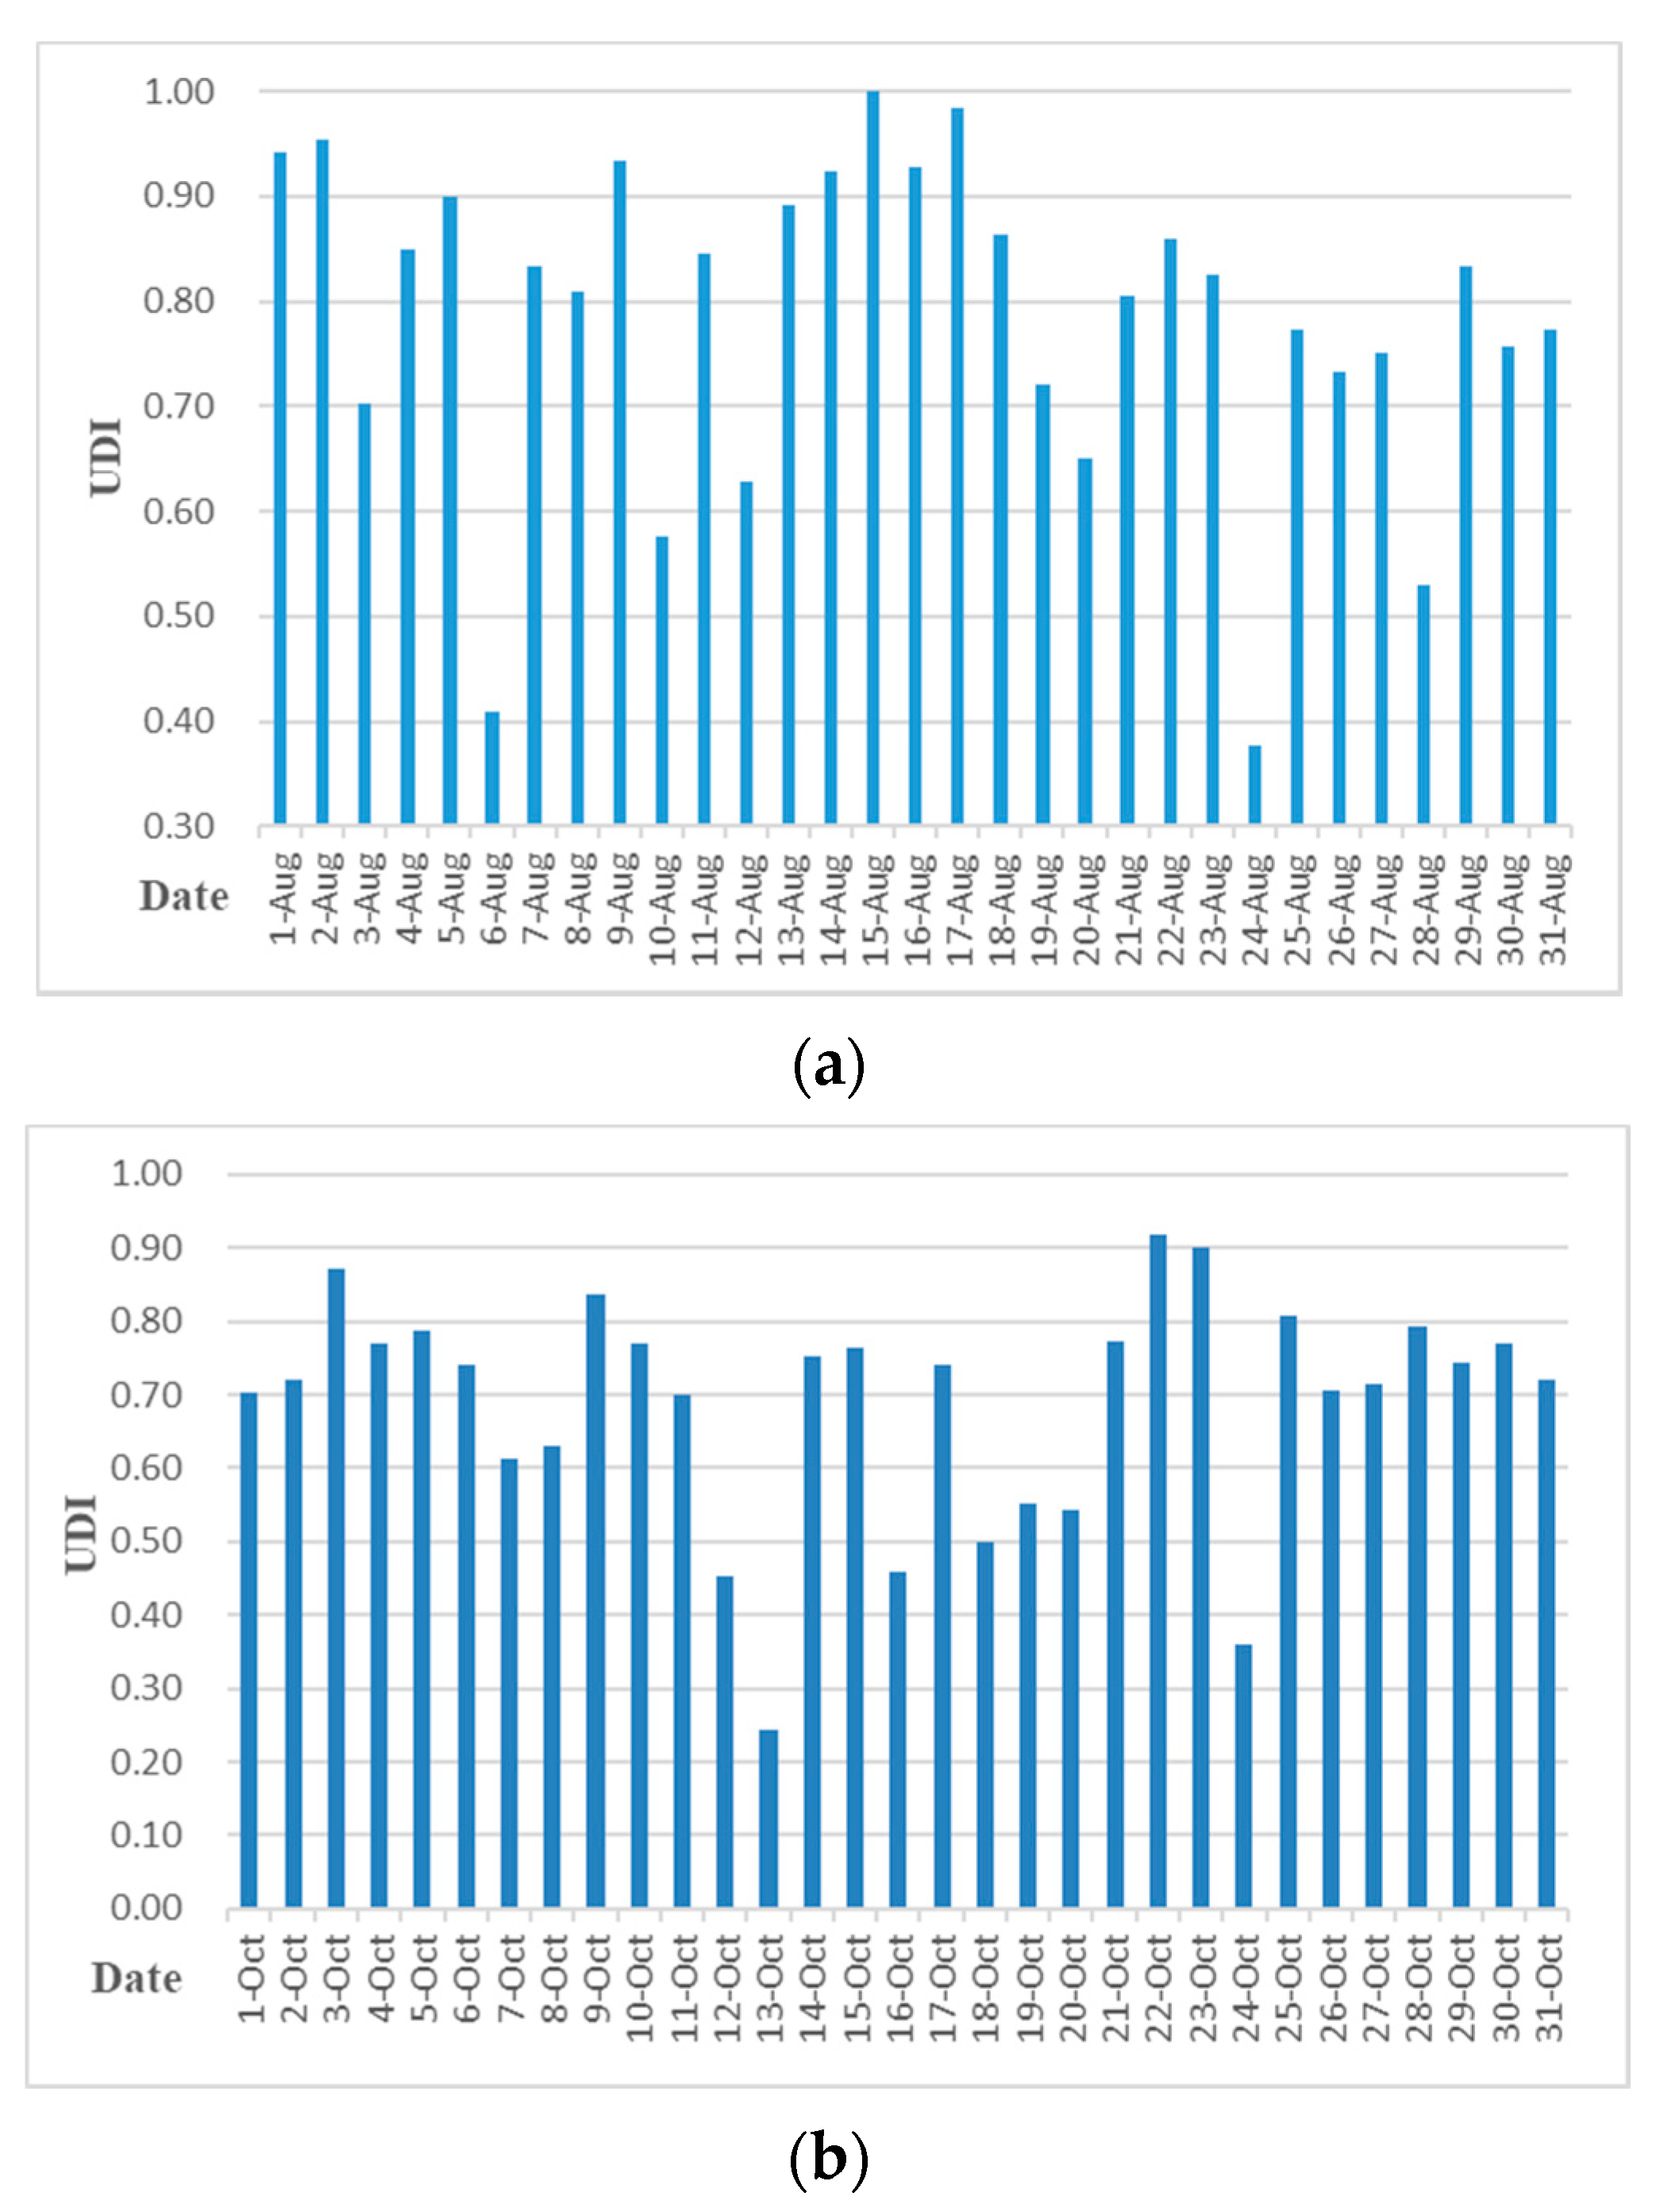
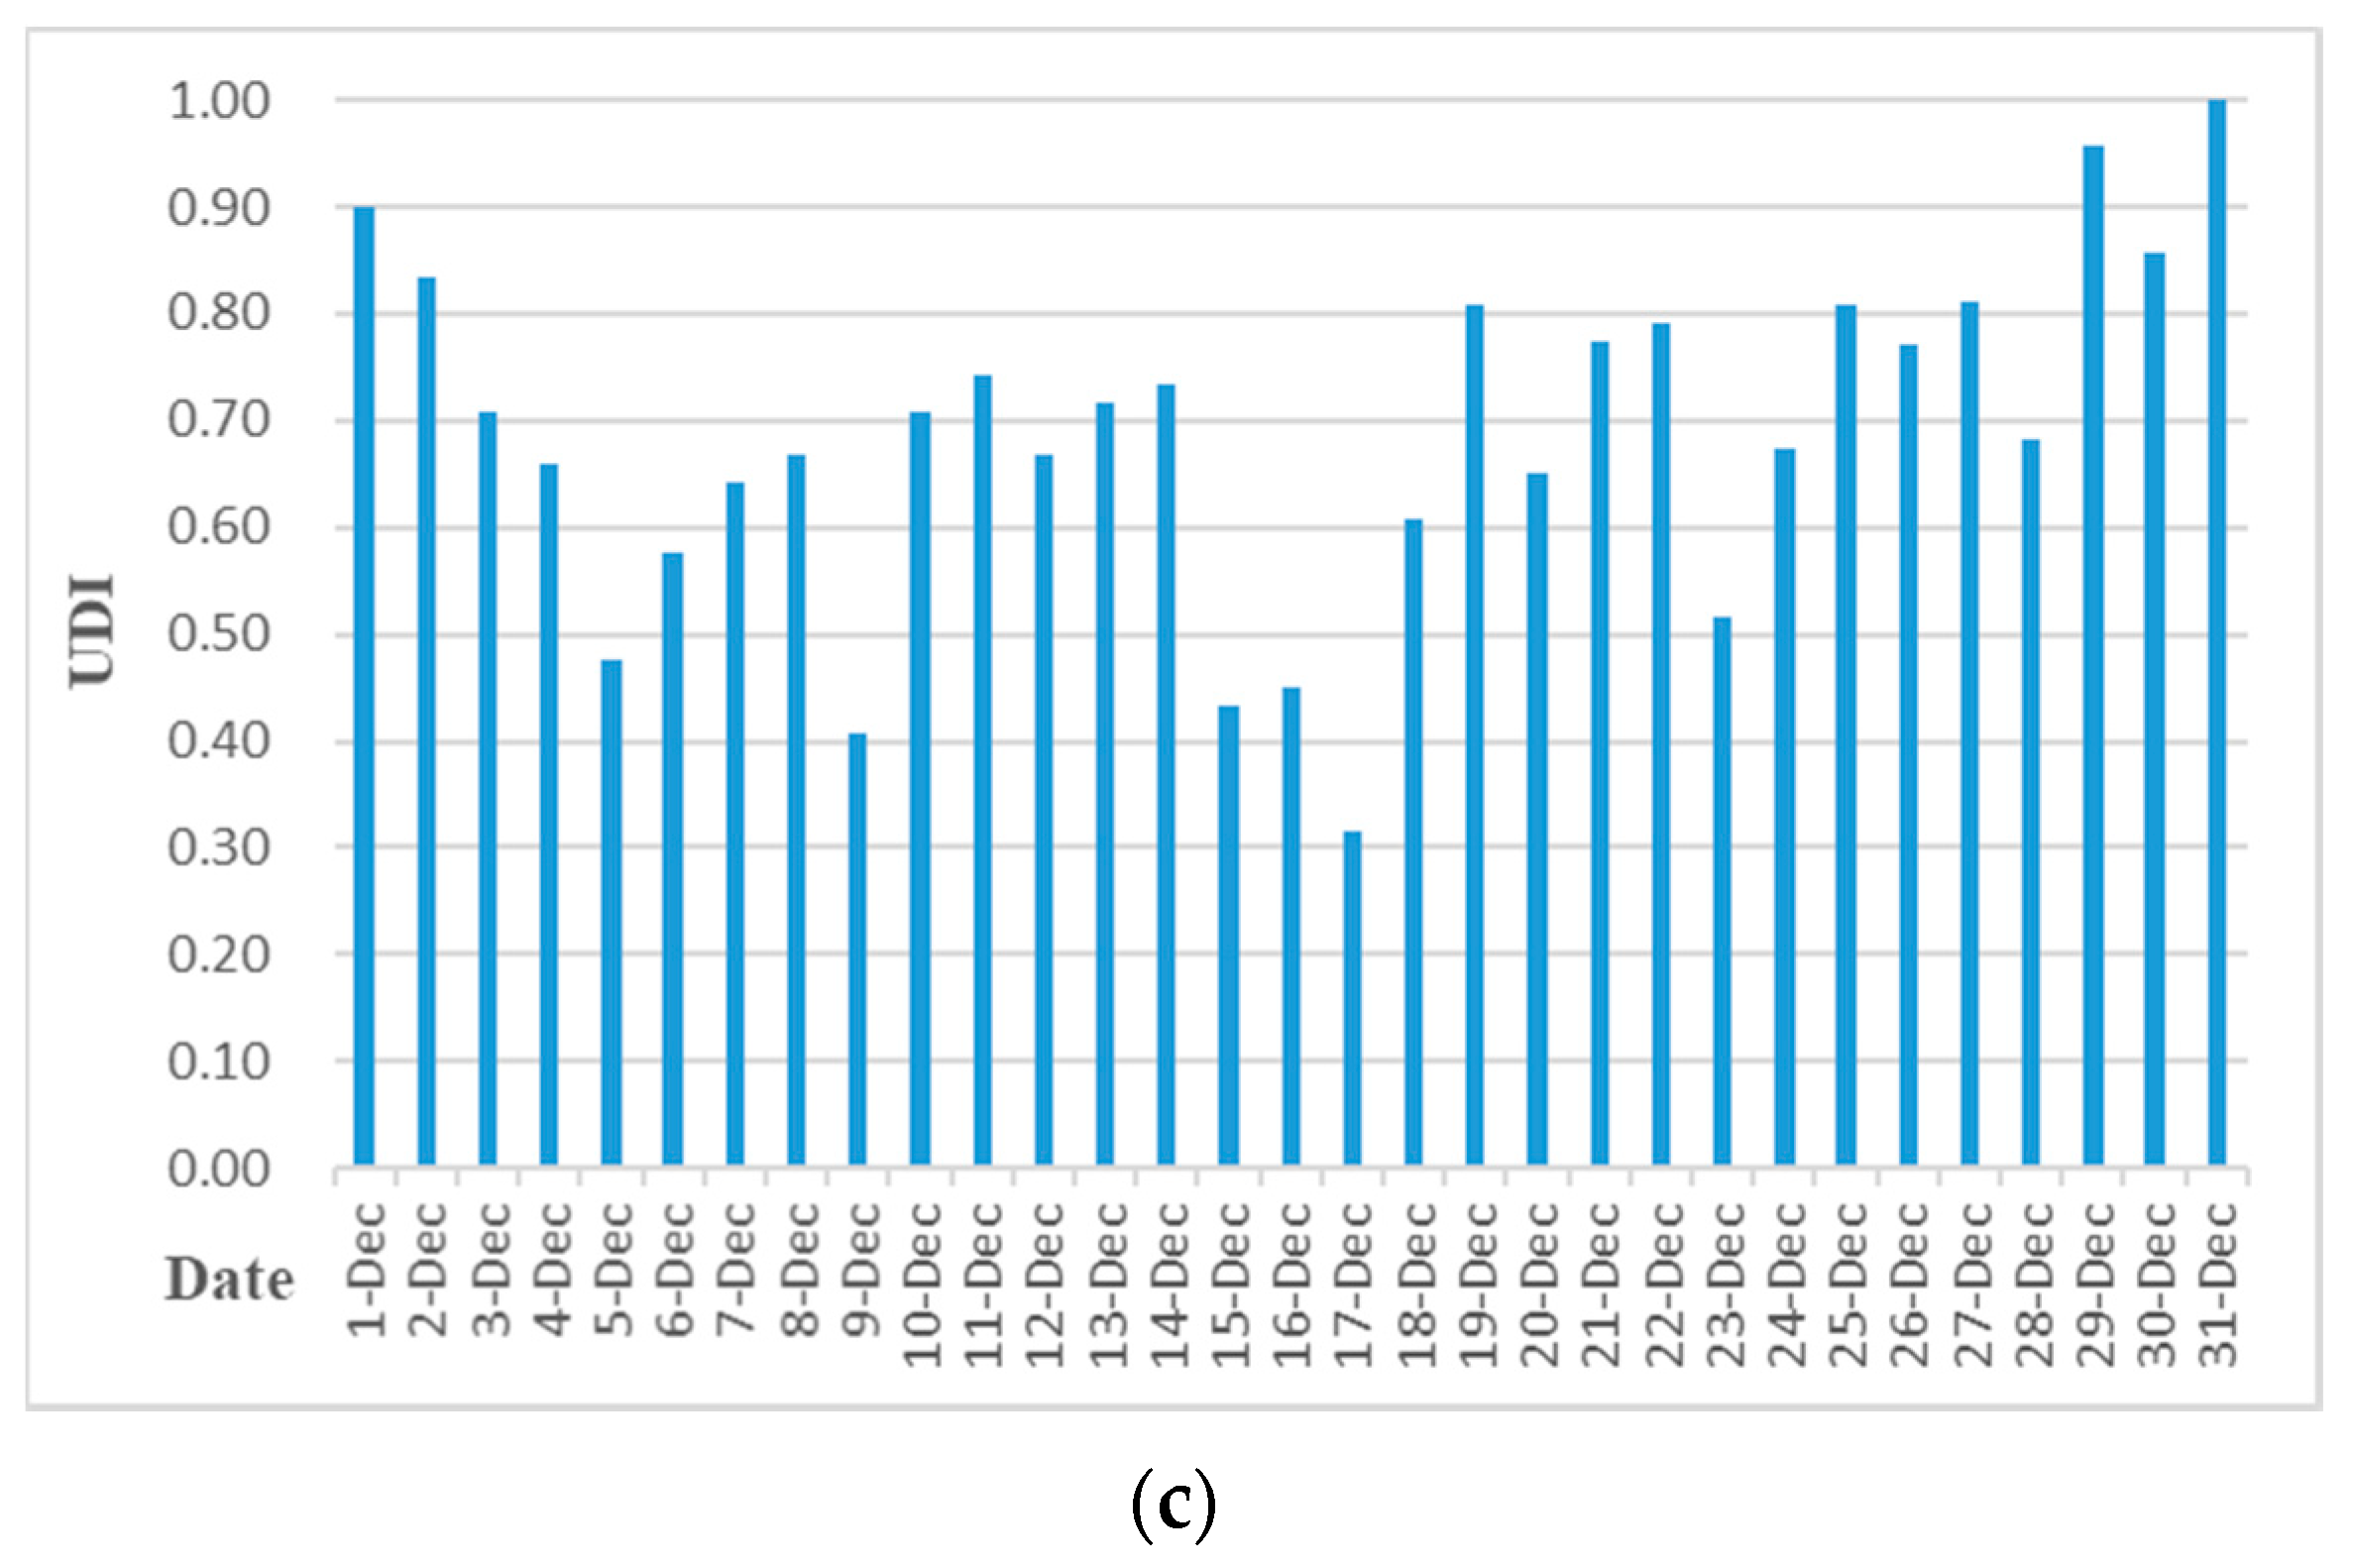
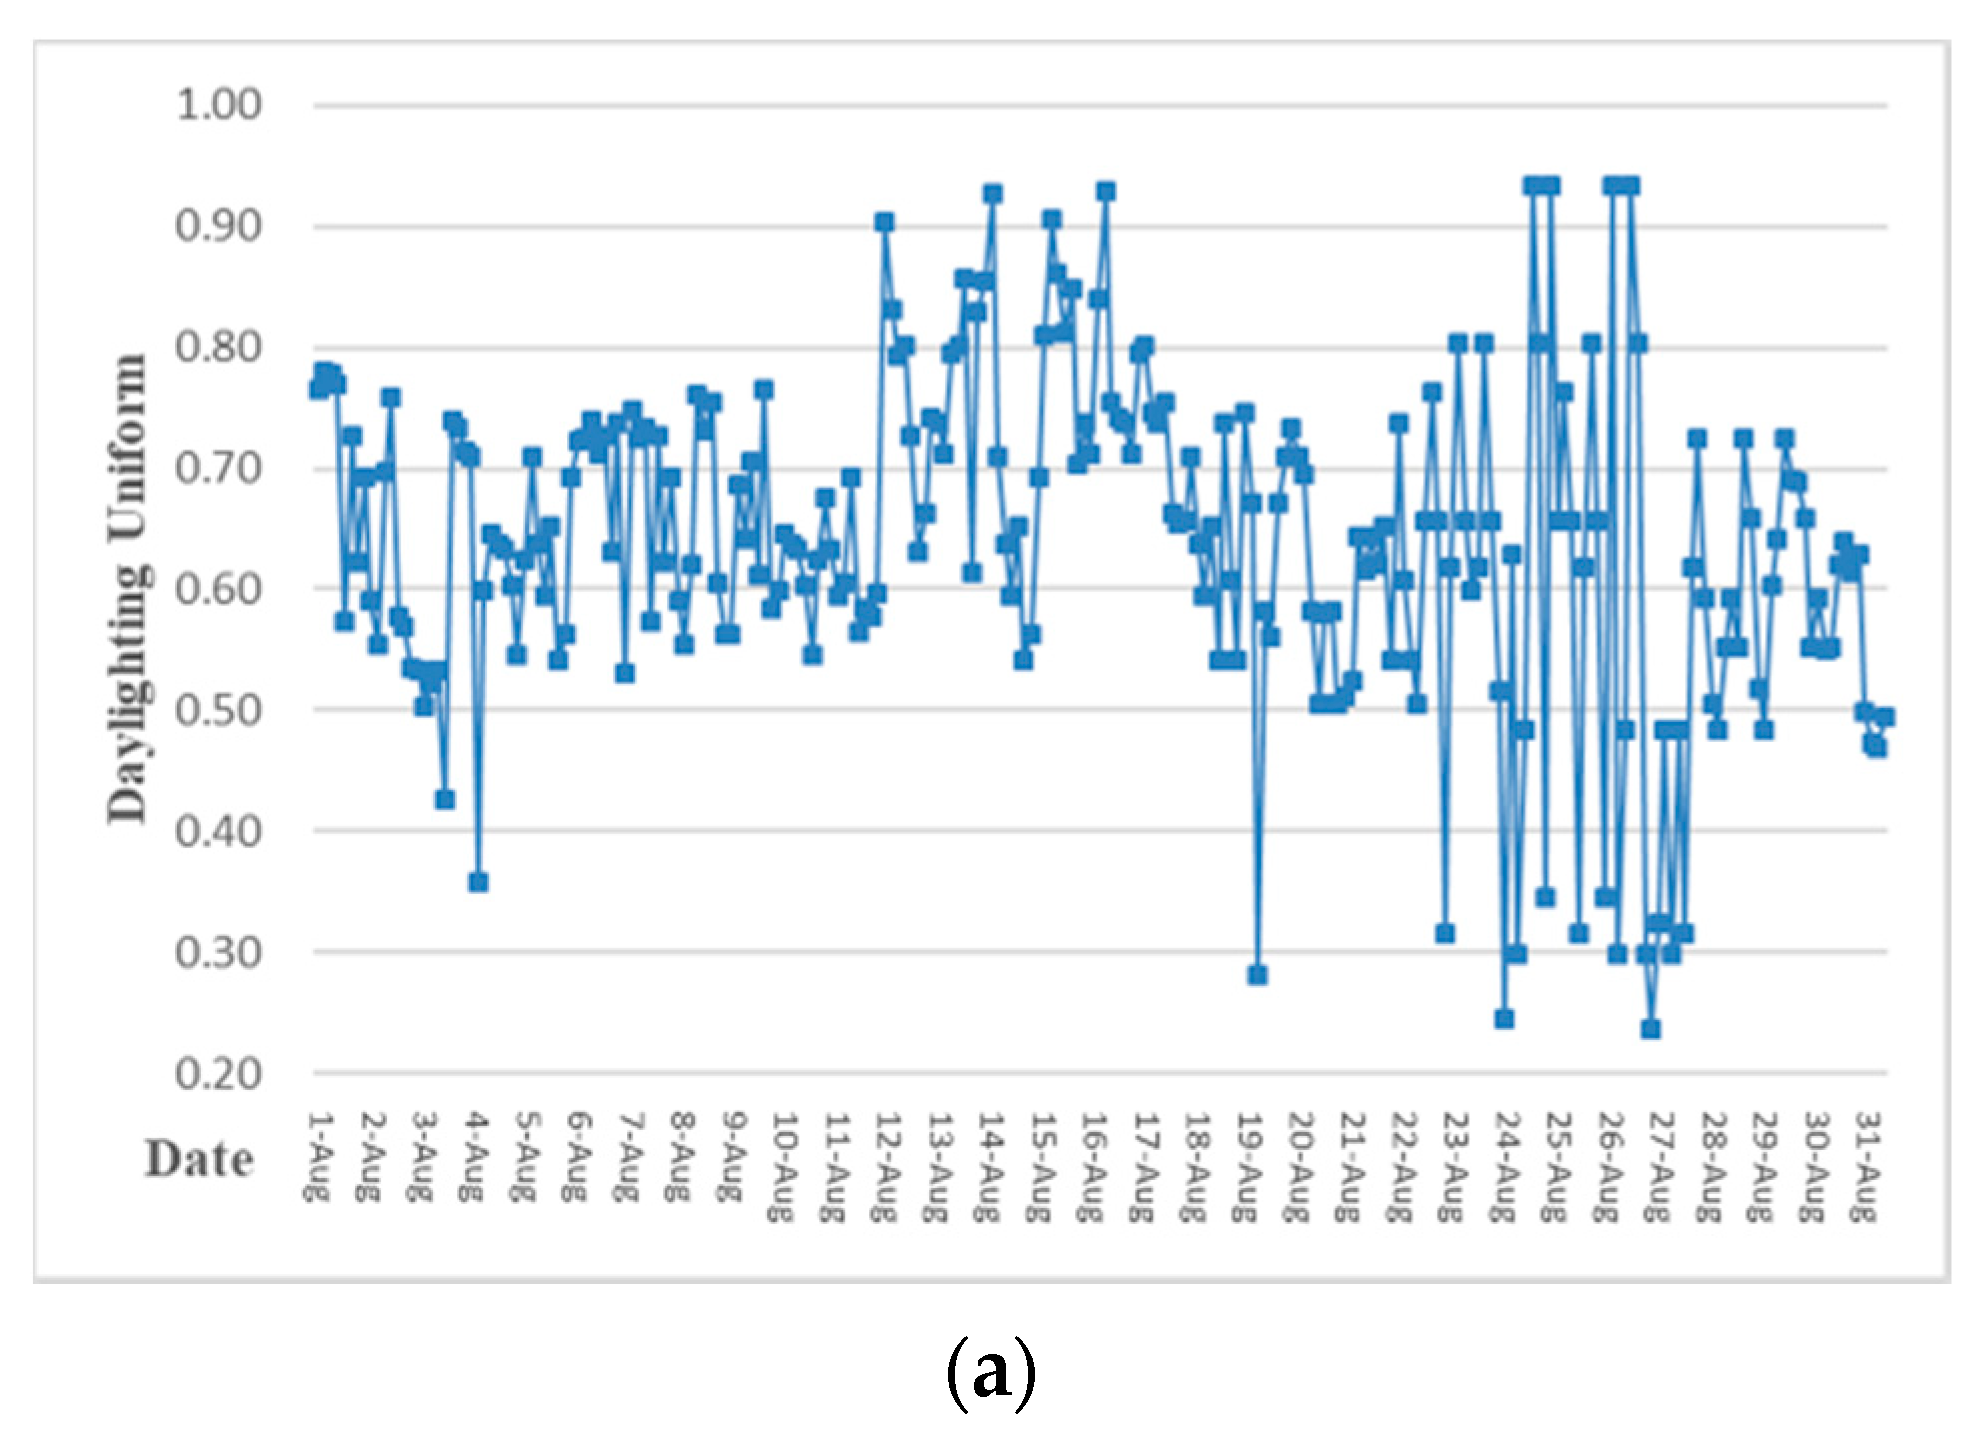
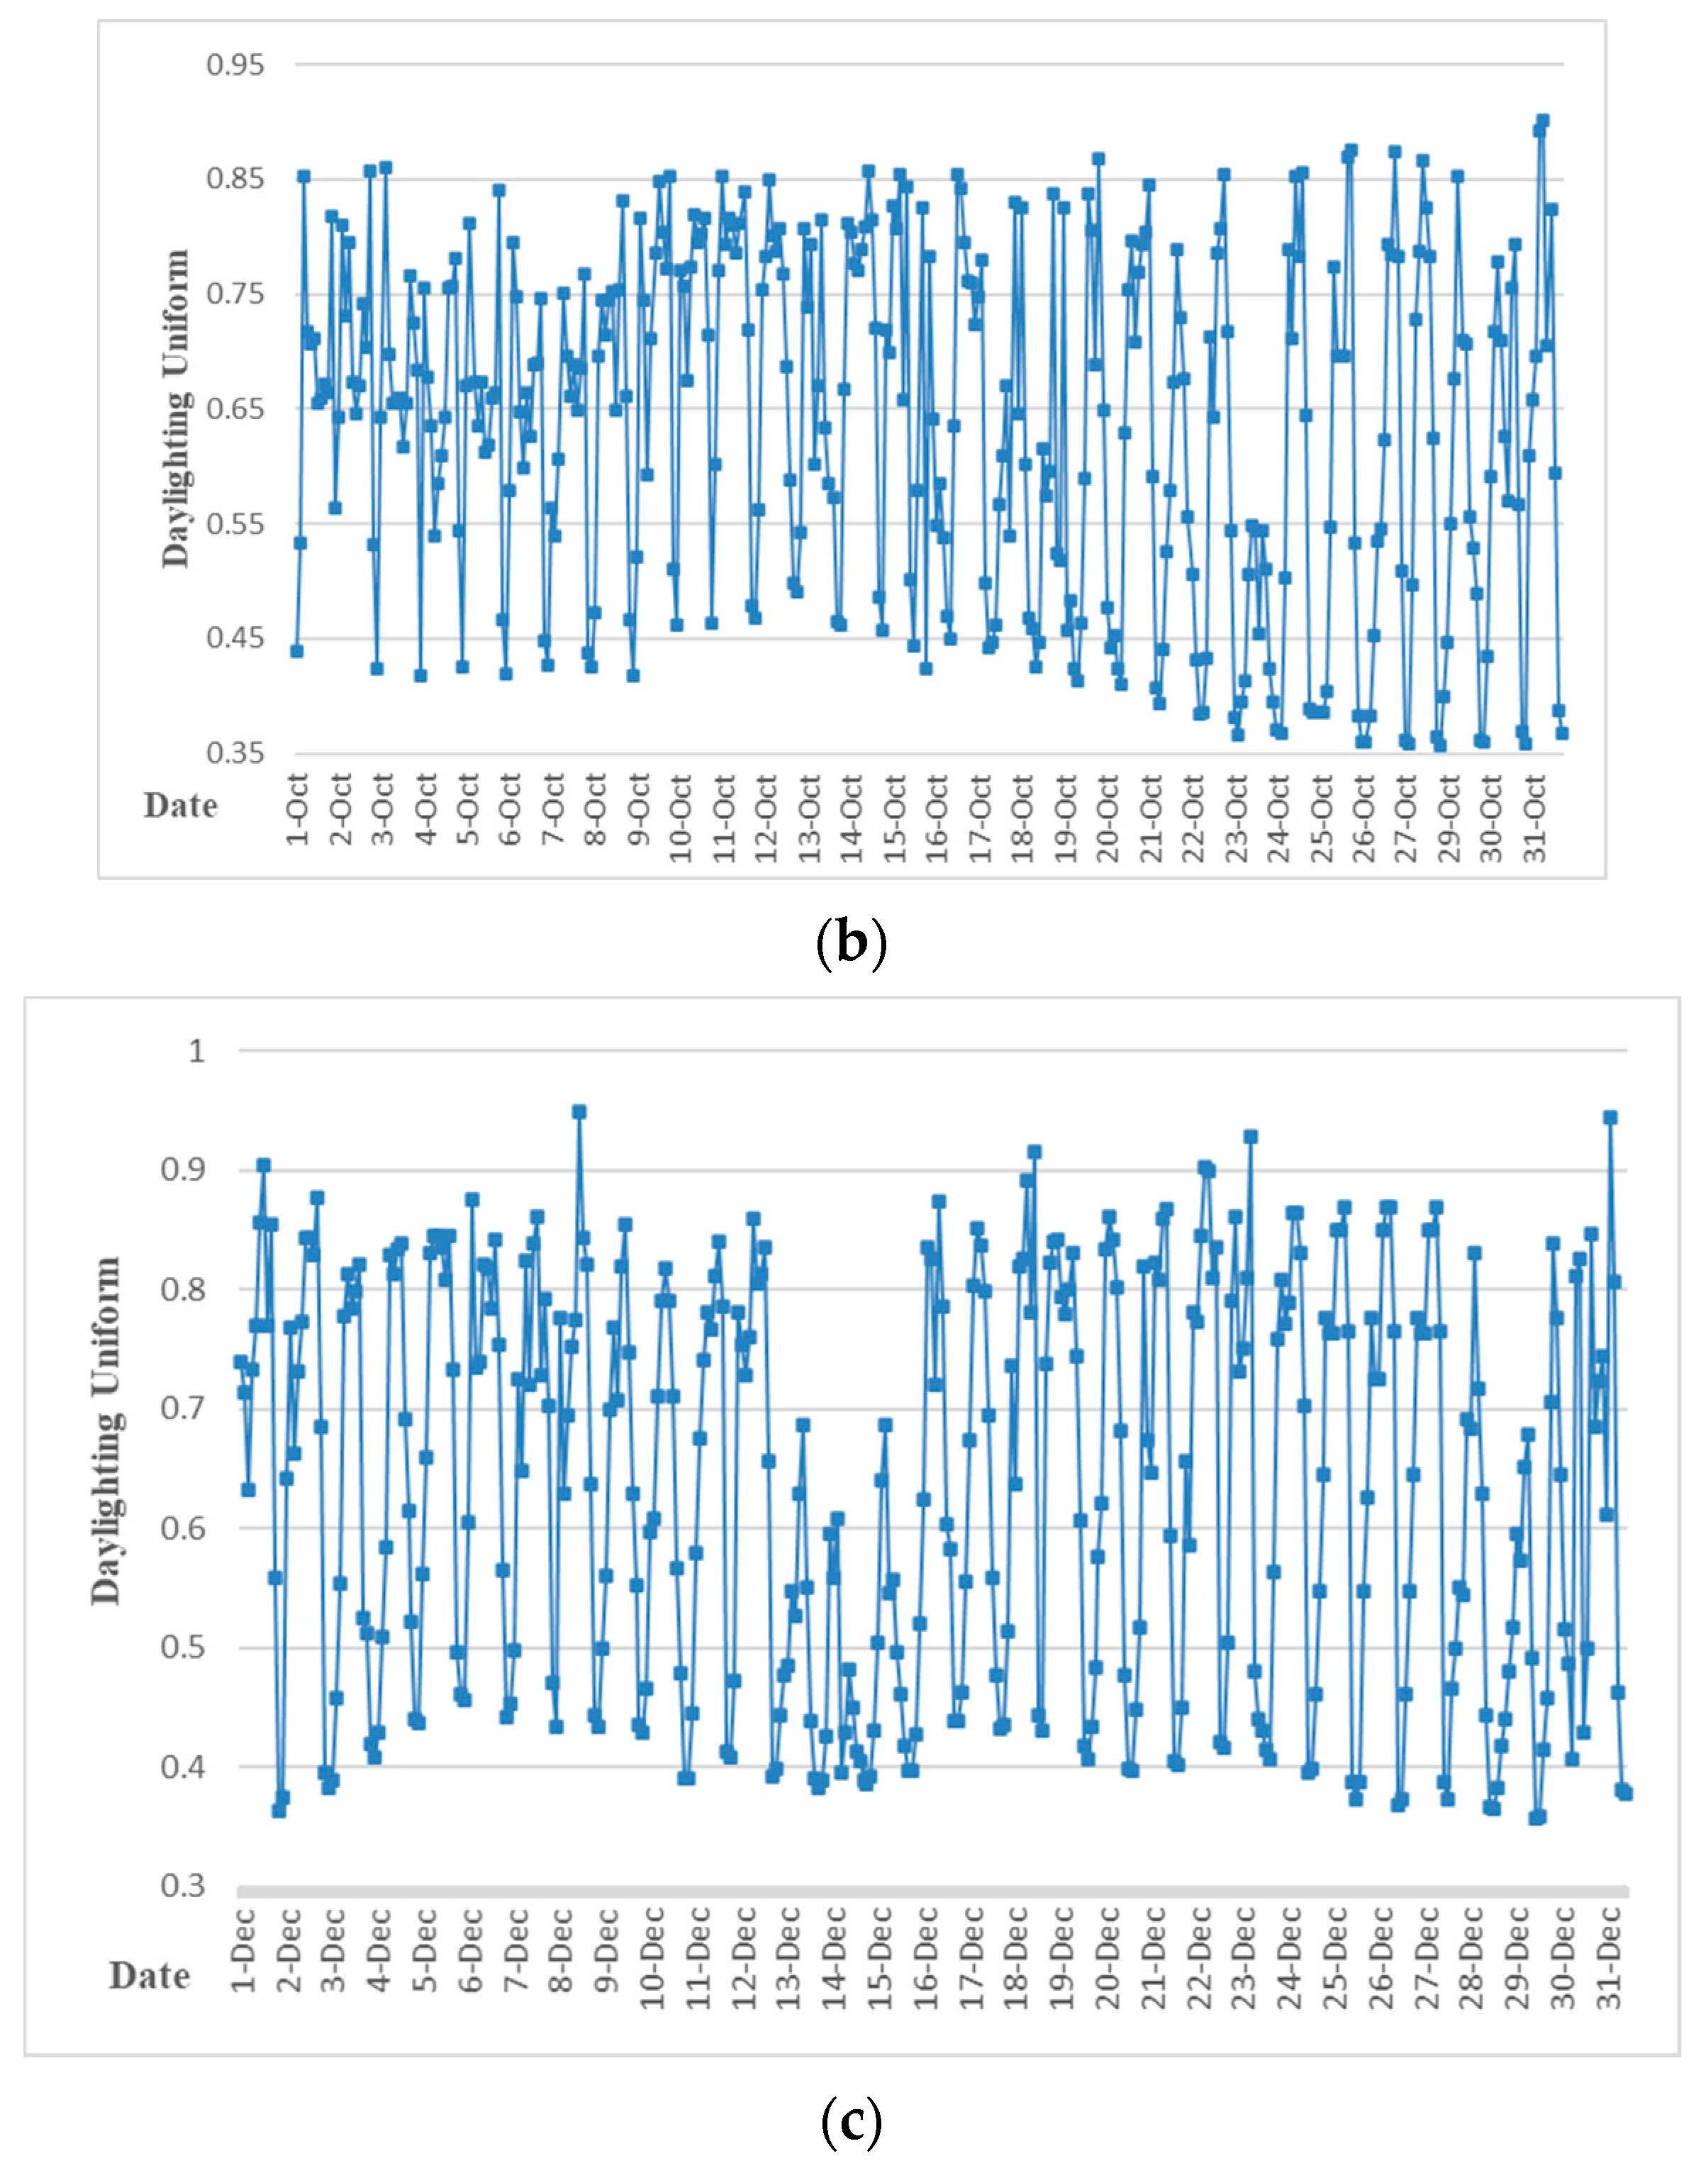
4.3. Analysis of the Daylighting Performance

As shown in Figure 17, The average value of illumination in August was 438 lx, 272 lx in autumn and 263 lx in winter. For daylighting illumination of the C-Si PV window, it should meet the requirement with 300 Lx during daytime. In summer, natural lighting can basically meet the lighting requirements during working hours in sunny days, while in autumn and winter, it can be met at noon. For the rest of the days, artificial daylighting was needed to compensate for the lack of daylighting during the early morning and late afternoon.
It can be found from the test results that the distribution of the daylighting illumination was similar to the solar radiation upon the south façade in the three seasons. In Autumn, the fluctuation of the daylighting illumination was relatively higher than that in summer. In winter, the maximum daylighting illumination during the most of the sunny days was around 1500~2500 lx, which was the highest amongst the three seasons. This might be attributed to the fact that the solar elevation angle was highest among these three seasons.
In order to further evaluate the daylighting performance of the PV window, UDI was used to indicate the time during which the natural daylighting could be effectively utilized during the daytime. The calculation results of the UDI are shown in Figure 18, the average of the UDI calculated by Equation (5) was 0.79 in summer, 0.69 in autumn, and 0.68 in winter. It may be because there are more sunny days in summer.
As mentioned before, because most of the days during summer were sunny, the illumination on indoor working face was more than 300 Lx for about 48% of the days. Meanwhile, since the solar altitude angle was the lowest in the year during summer and the solar radiation intensity on the south wall was the lowest of the year, the indoor radiation intensity was the highest. The illumination was only 1300 Lx. As shown in Figure 18, the average indoor UDI of the building could reach up to 0.79 in summer, so the indoor light environment of the photovoltaic window room during summer was the best in the whole year. In autumn, the second is the lowest in winter. In winter and autumn, some shading measures can be provided for photovoltaic windows to reduce the illumination of the highest working face in the photovoltaic room. While in summer, no extra measures are needed to improve the indoor light environment.
According to the calculation by the Equation (5), the daylighting uniform of the test unit was also shown in Figure 19. The average illumination uniform in summer, autumn, and winter could achieve a higher level with 0.6, 0.65, and 0.68, respectively.
When combined with our previous research of PV windows [3], after the unit installation with the PV window, although the indoor daylighting illumination would be reduced, the UDI and uniformity would be effectively improved because of the blocking of daylighting. It might improve the light environment.

4.4. Cross-Seasonal Performance Analysis of PV Window

To further analyze the cross-seasonal performance of PV windows, the key parameters of photovoltaic windows in each season were analyzed, such as the average radiation intensity upon south façade, the average power generation of PV window, the average heat flux through the PV window, and the maximum illumination in the photovoltaic window test room. The specific values are shown in Figure 20.
As shown in Figure 20, the left y axis is the monthly total PV generated energy and window heat gain. The right axis is the monthly total solar radiation on PV window. The distribution of PV window power is almost the same as that of the south-facing wall solar radiation intensity. Similar to the distribution of solar radiation intensity, the average power generation of PV window during autumn (September to November) was the highest of the three seasons, reaching as high as 7 kWh/m2. The average power generation in spring (March to May) is slightly lower than that in autumn and can also reach 6.8 kWh/m2. During summer (June to August), the power of photovoltaic windows was the lowest in the three seasons, only 5.86 kWh/m2. Therefore, in order to apply the photovoltaic windows for power generation, additional measures should be taken to enhance the power generation of PV windows in autumn and winter (December to February).
For the same reason, the average heat flux through the photovoltaic window during autumn is significantly higher than that in the other two seasons. However, owing to the largest difference between indoor and outdoor air temperature, the heat conductivity of the photovoltaic window in summer is higher than that in autumn and winter. Thus, the average heat flux through the photovoltaic window during summer is slightly lower than that during autumn and winter. The difference between the value and the other two seasons is obviously smaller than the difference between the average radiation intensity of vertical wall and the average power generated by photovoltaic windows. At the same time, the excessive average heat flux through photovoltaic windows increases the indoor cooling load during summer.
In terms of the lighting performance test, as shown in Table 3, since the indoor light environment was mainly affected by visible light through windows, the solar altitude angle during winter was significantly lower than that during autumn and summer, and the maximum illuminance in winter was significantly higher than that in the other two seasons. The maximum value reached about 2500 lx, which seriously affected people’s indoor visual comfort.
From the above analysis, the power generation of PV window during summer was much lower than that of the other two seasons, while the total heat flow through PV windows was slightly lower. Therefore, to improve energy saving effect in summer, some measures may be taken, such as shading. The heat released to the outside reduces the total heat flow entering the room from outdoors environment, and can reduce the indoor cooling load while reducing the PV window power generation in a small amount. At the same time, during winter, solar radiation may be used to heat the indoor air to reduce the indoor heat load. Therefore, during winter, appropriate internal shading measures can be taken to prevent excessive illumination in the test room while not reducing the heat entering the room through the window and the power generation of photovoltaic windows.

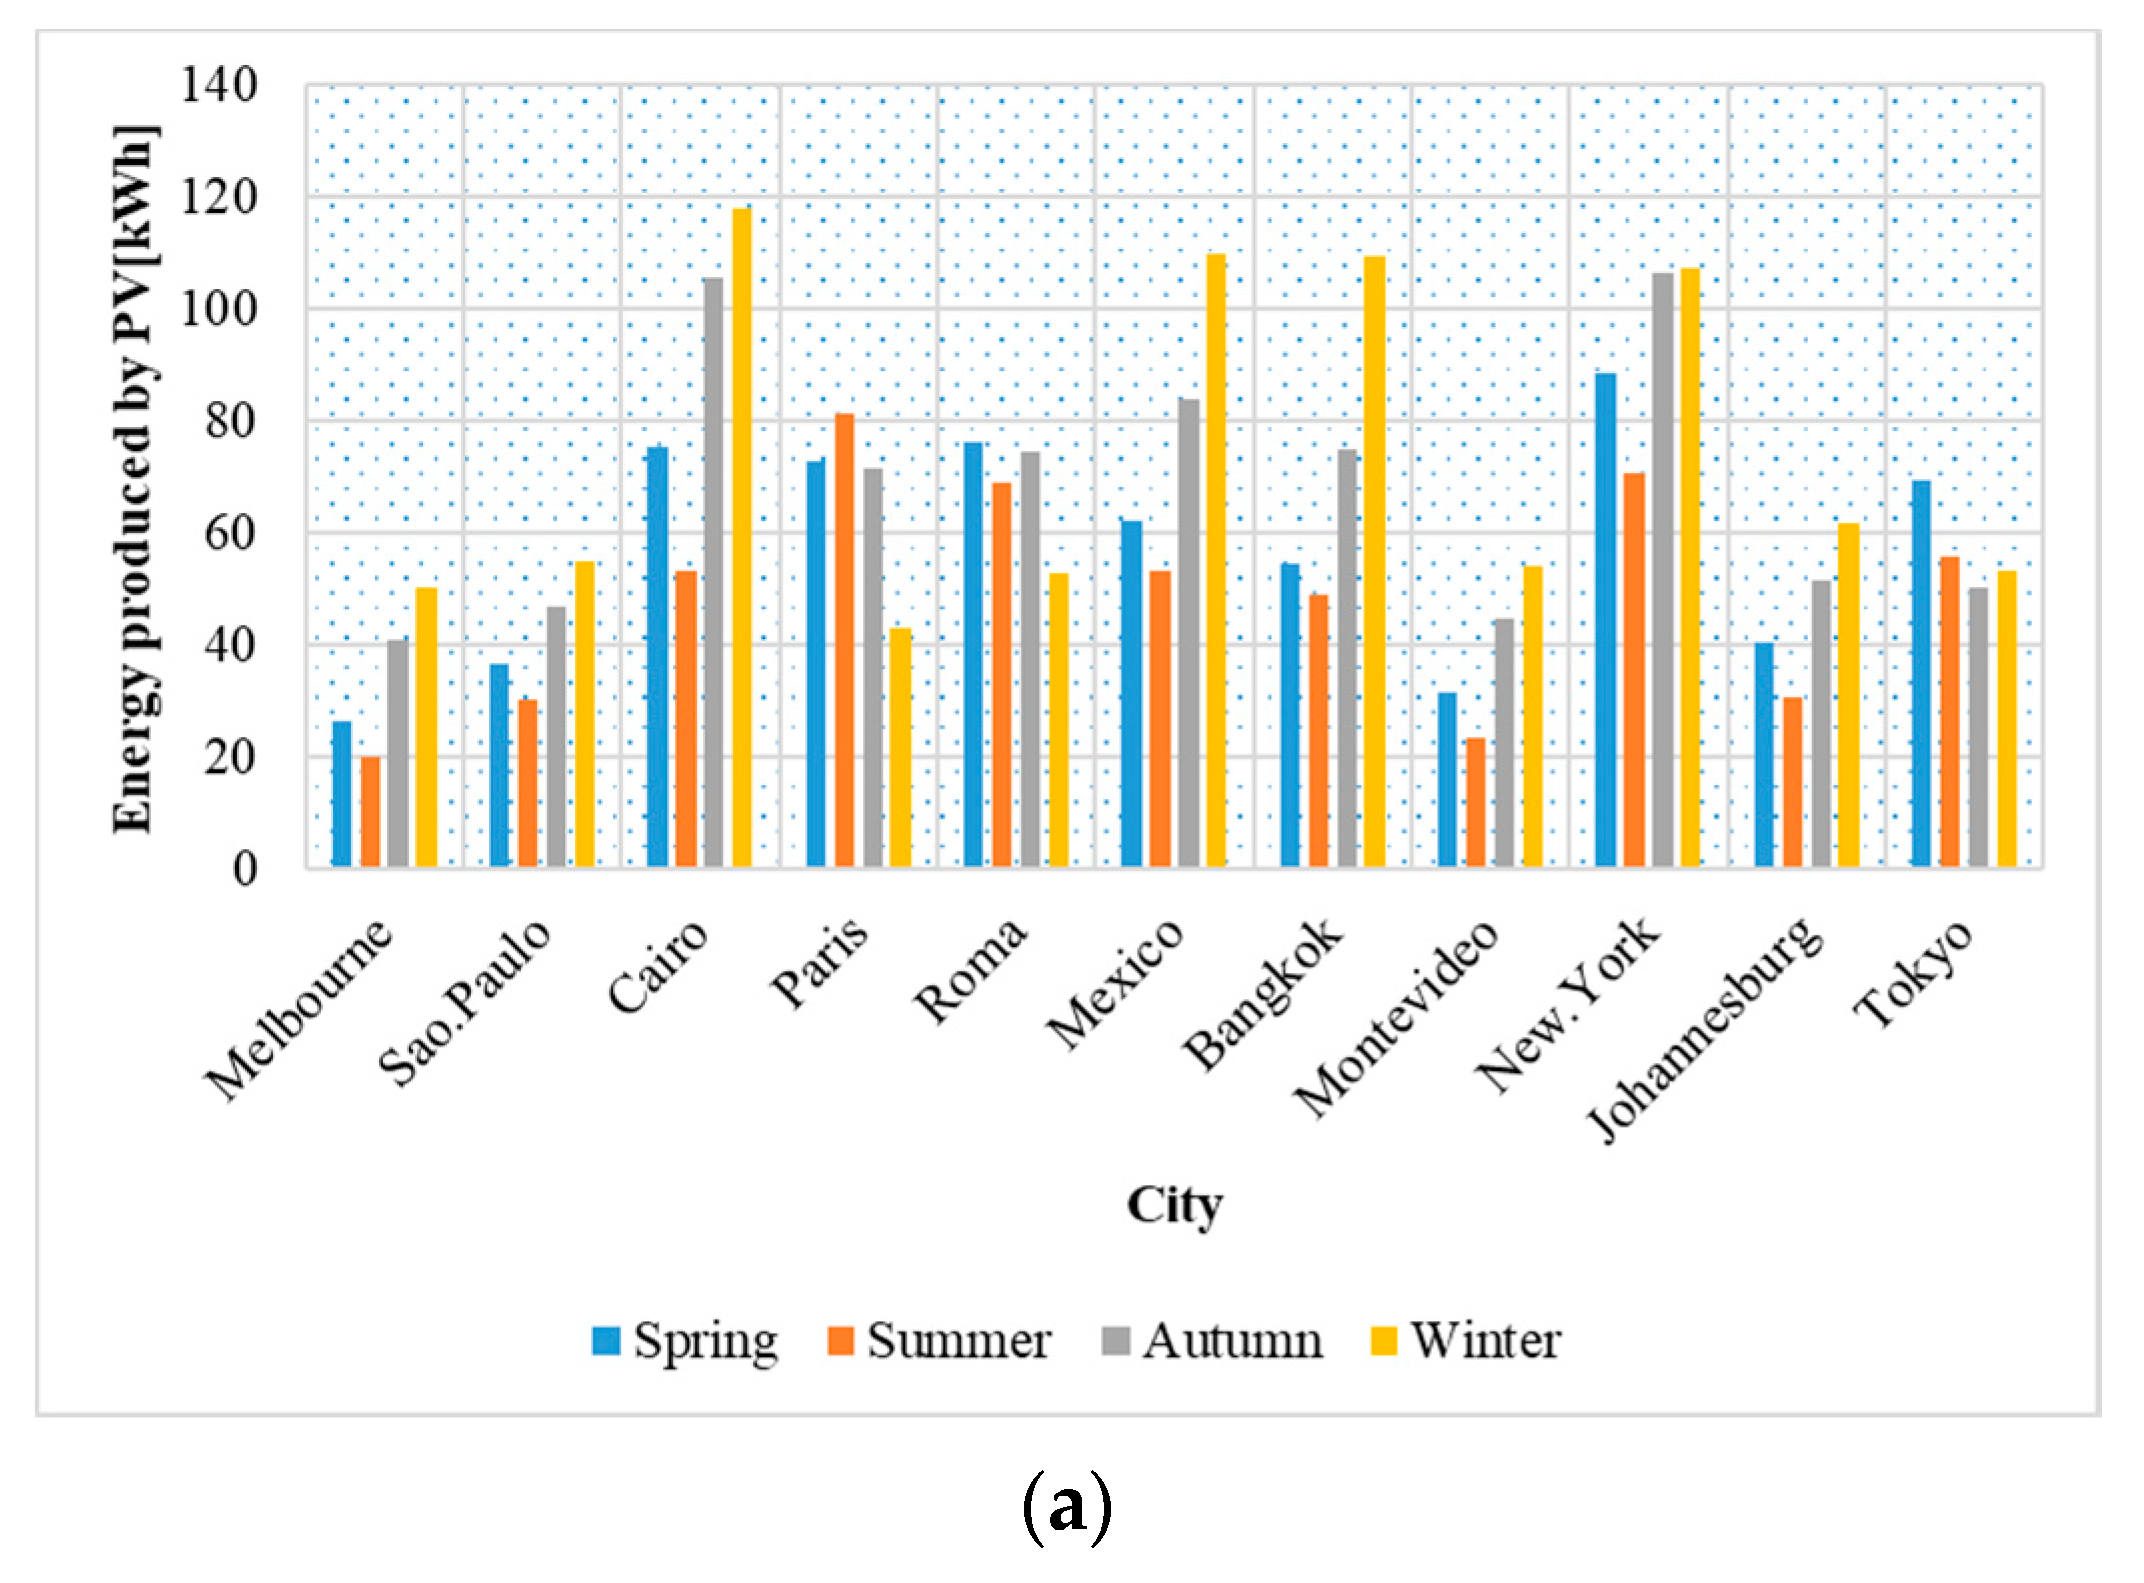
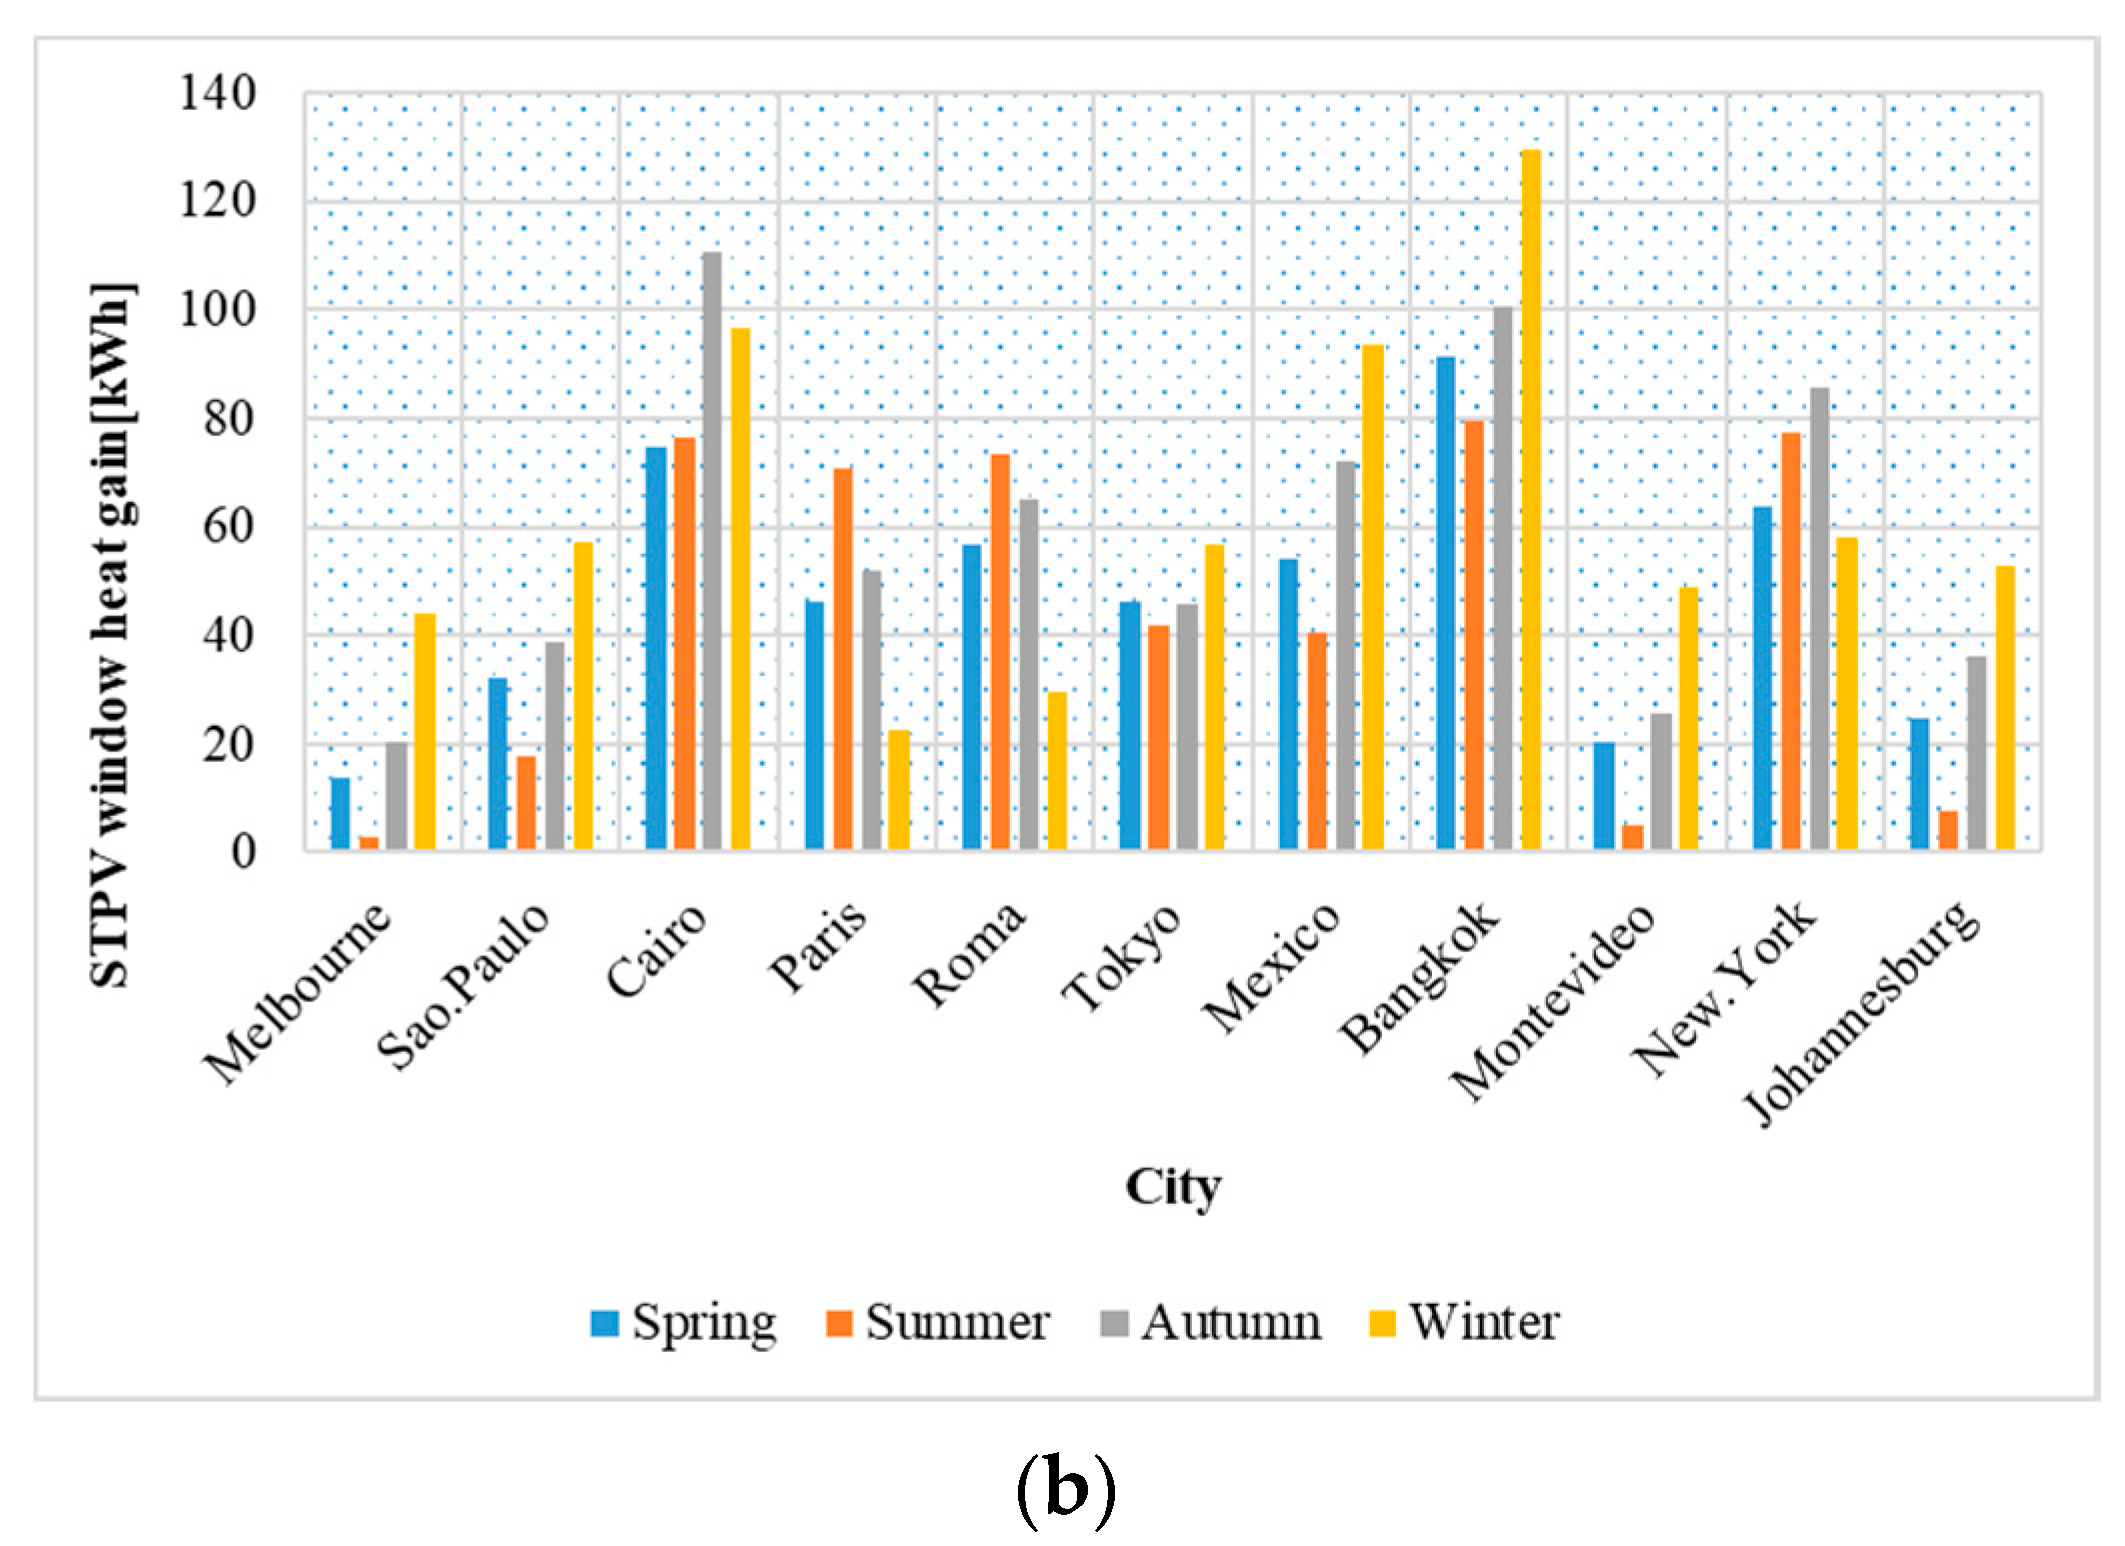
5. Application Potential Analysis of STPV Window in the World

In order to study the global application of the C-Si PV window, a model was established and 11 representative cities all over the world were selected according to different solar energy resource zones and geographical locations. These cities are distributed all over the world, including the northern and southern hemispheres and all six continents. Solar energy resources vary greatly in different parts of the world. Areas rich in solar energy resources are Johannesburg and Cairo, the comparatively rich areas are Bangkok, Montevideo, Mexico, and Melbourne, the medium are Sao Paulo, New York, and Rome, the comparatively scarce areas are Beijing and Tokyo, with the scarcest area being Paris.
The energy generation results of the simulation are shown in Figure 21a. The highest energy generation occurs in Cairo in winter with 118kWh and the lowest occurs in Melbourne in summer with 20kwh. In most countries, photovoltaic windows generate more power in autumn and winter than in spring and summer, which indicates that the power generation of photovoltaic windows is mainly affected by the solar altitude angle except for several special locations. In Paris, Rome, and Tokyo, the solar radiation in the south of autumn and winter is less than that in spring and summer due to the influence of climate, so the power generation in autumn and winter is smaller.
The heat gain results of the simulation are shown in Figure 21b. The highest window heat gain occurs in Bangkok in winter with 130 kWh and the lowest occurs in Melbourne with 3 kWh. From the comparison between Figure 21a,b, it can be seen that there is a certain correlation between window heat gain and PV power generation, because solar radiation accounts for a large proportion of window heat gain.

6. Conclusions

In this article, a comprehensive analysis of the C-Si Semi-transparent PV (STPV) window on-site test was carried out, and the test results of lighting-thermal-electricity performance were compared with different seasons. The highlight research finding could be collected as the below:
(1)
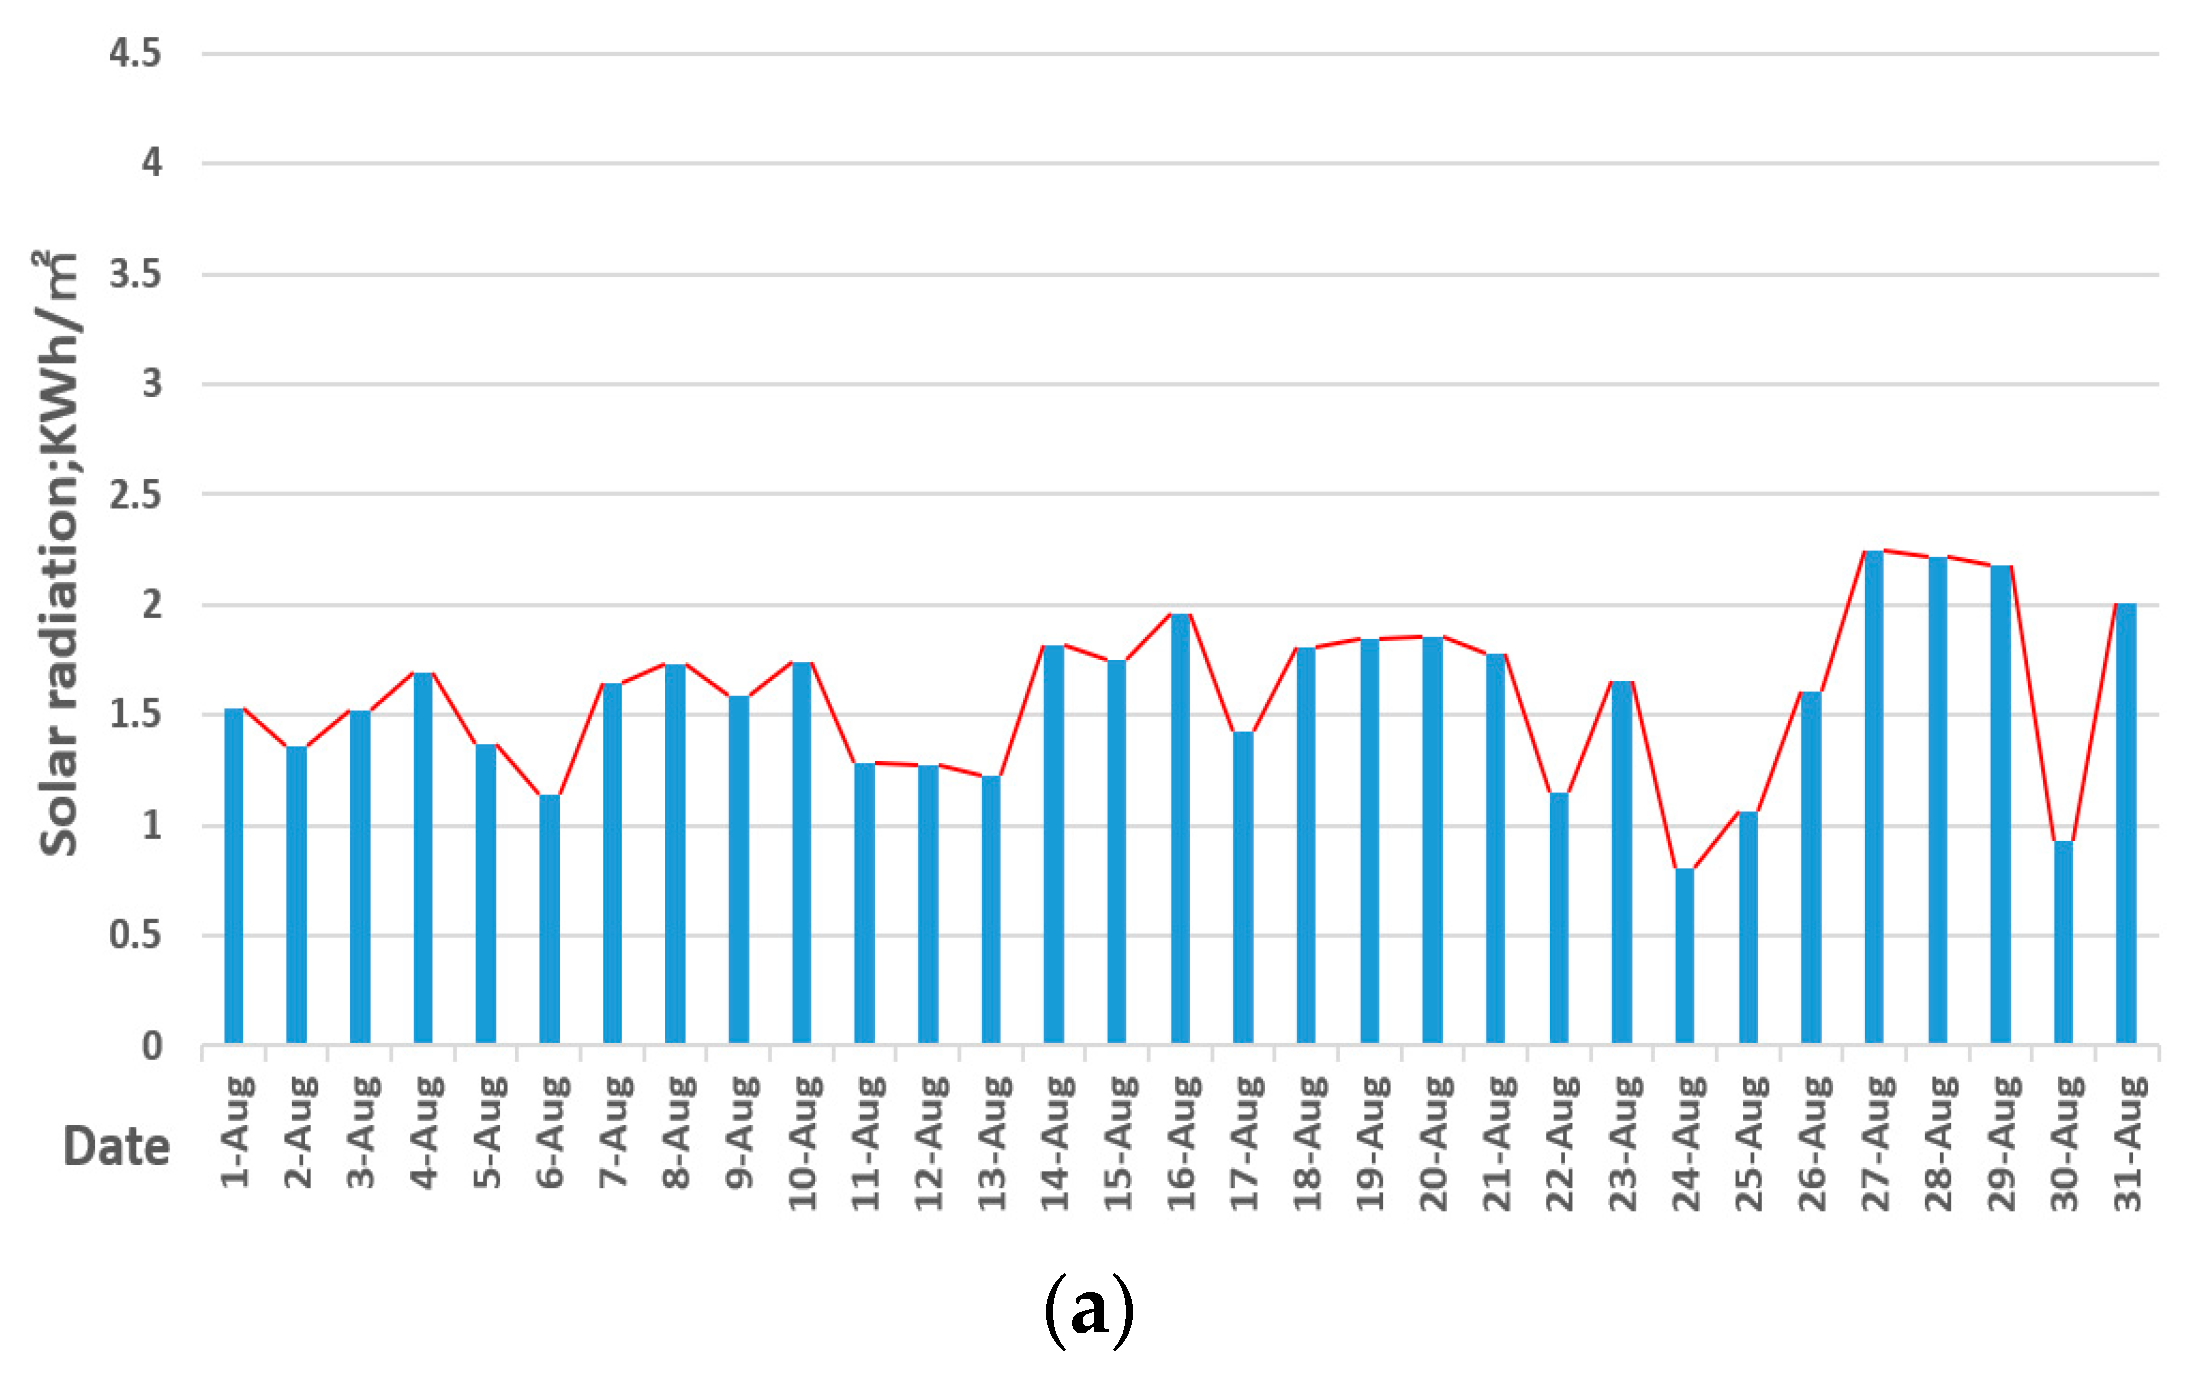
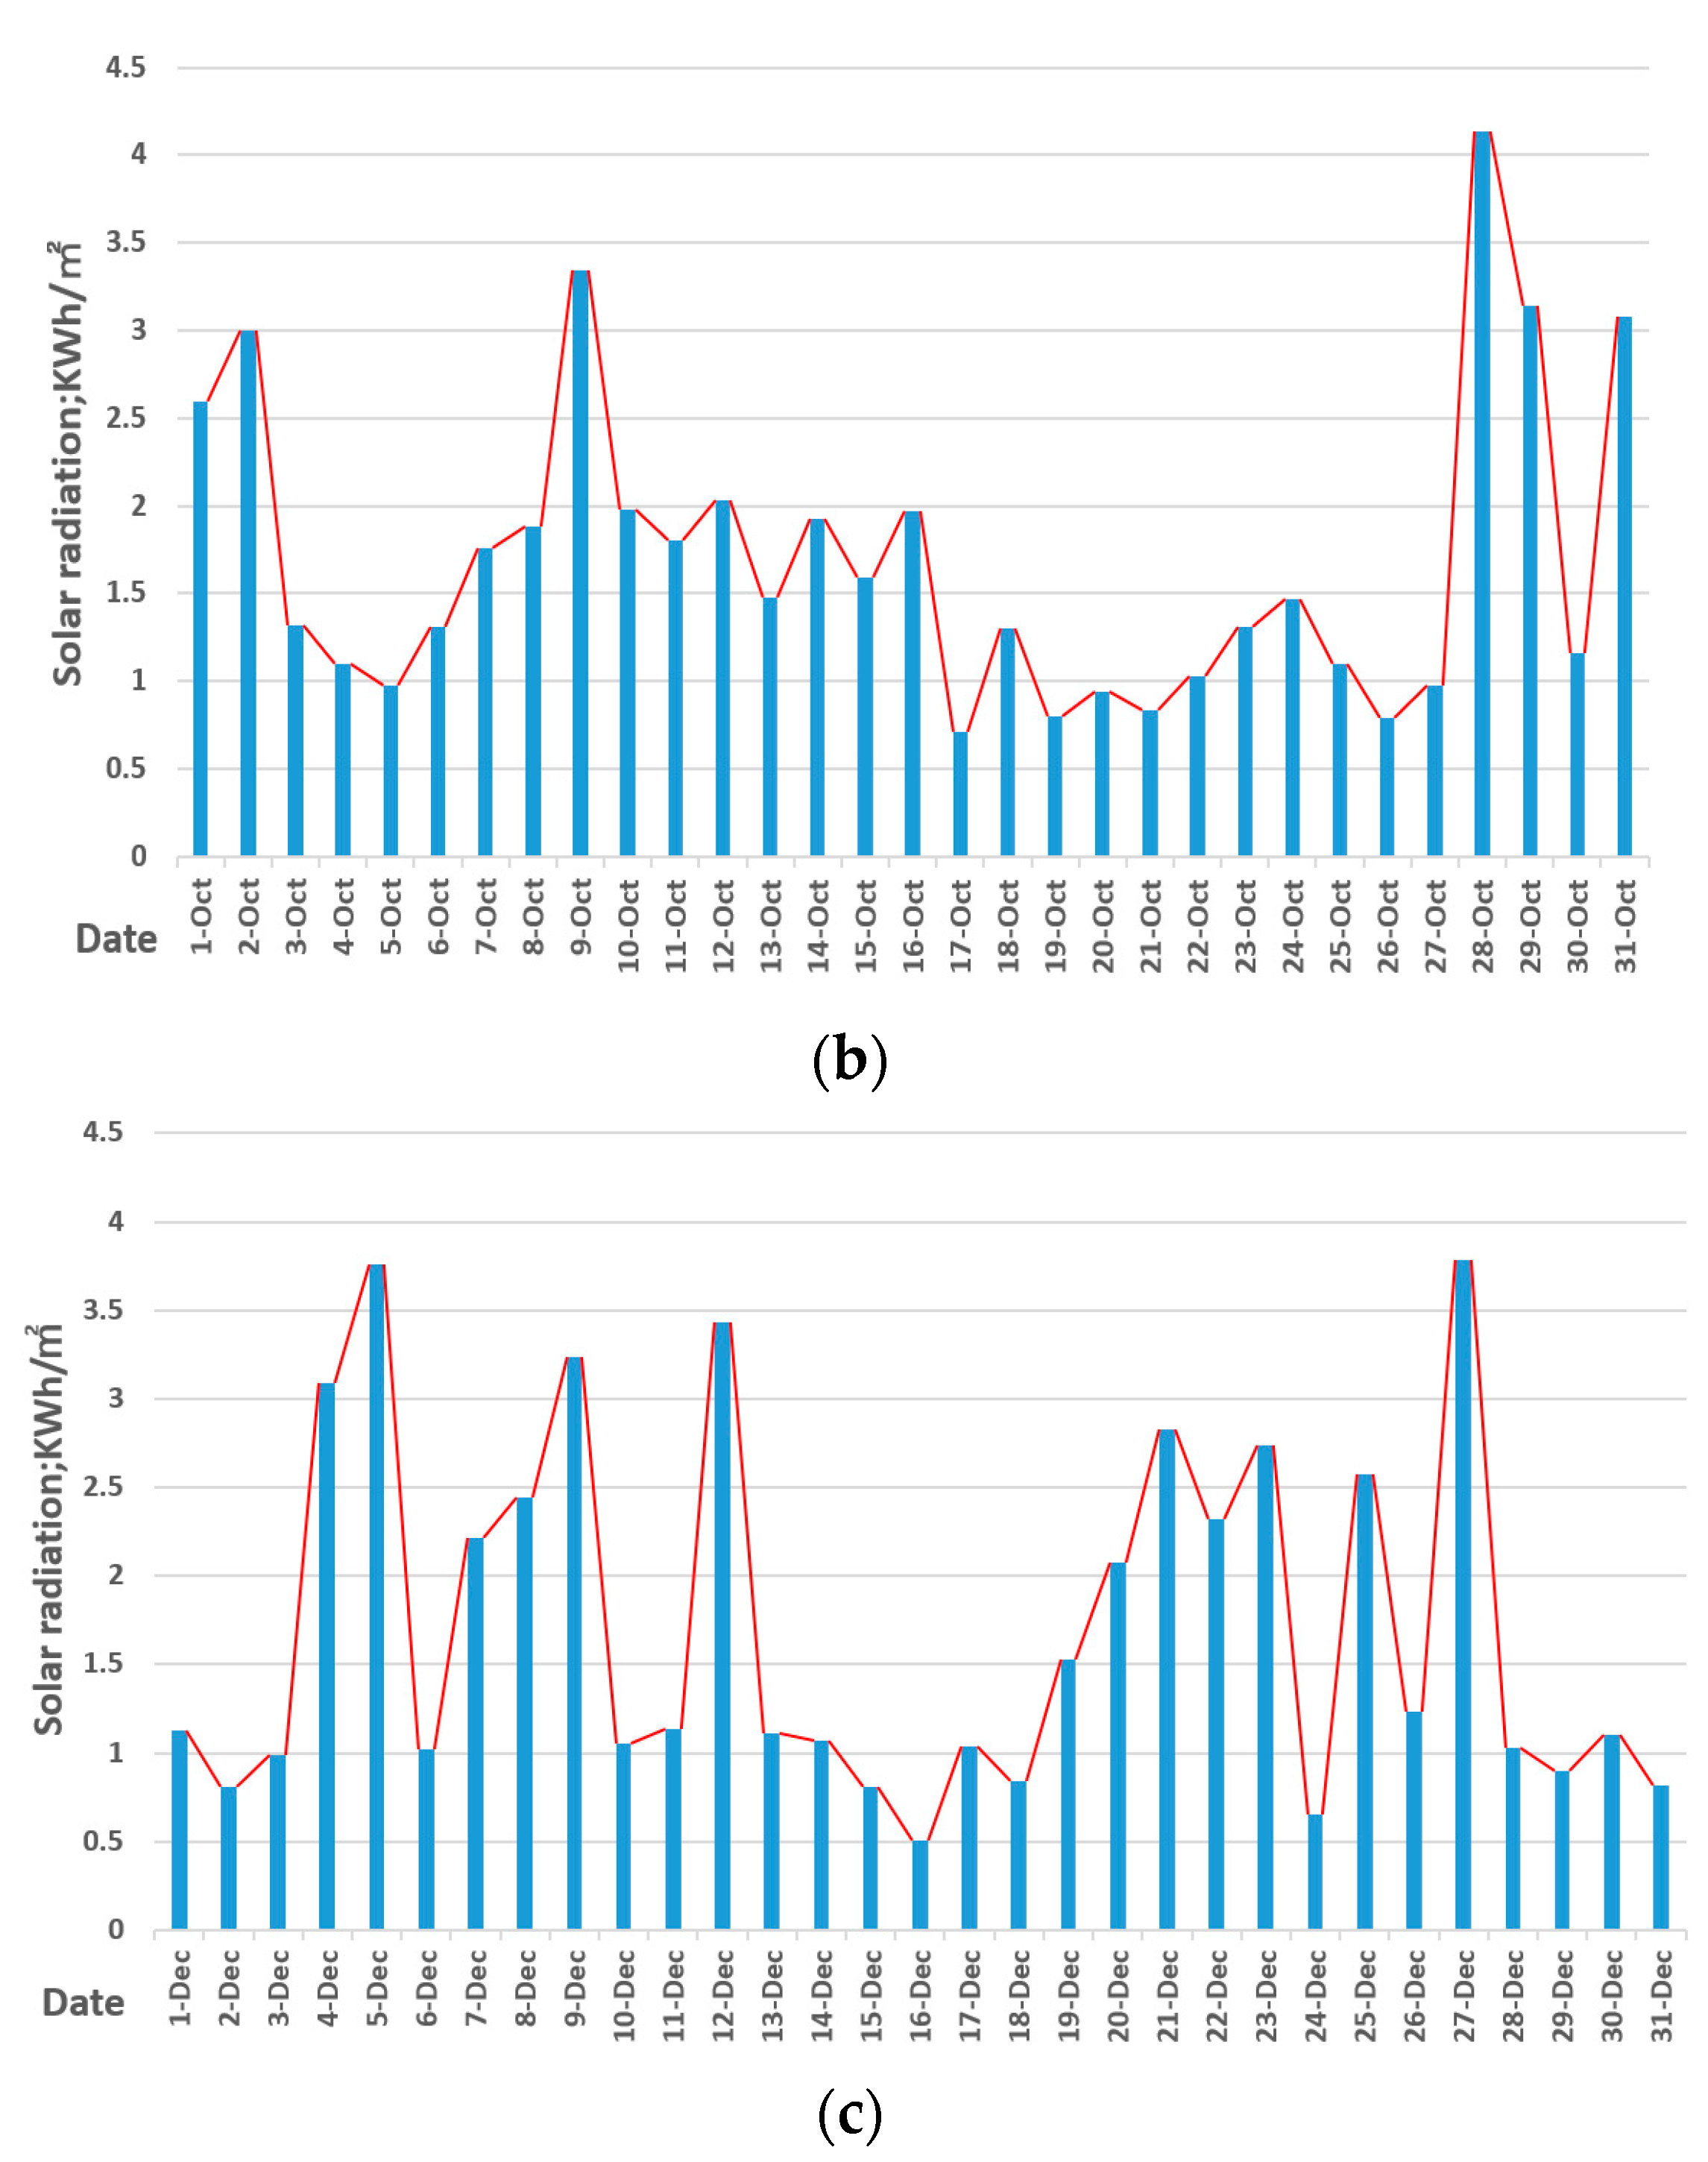
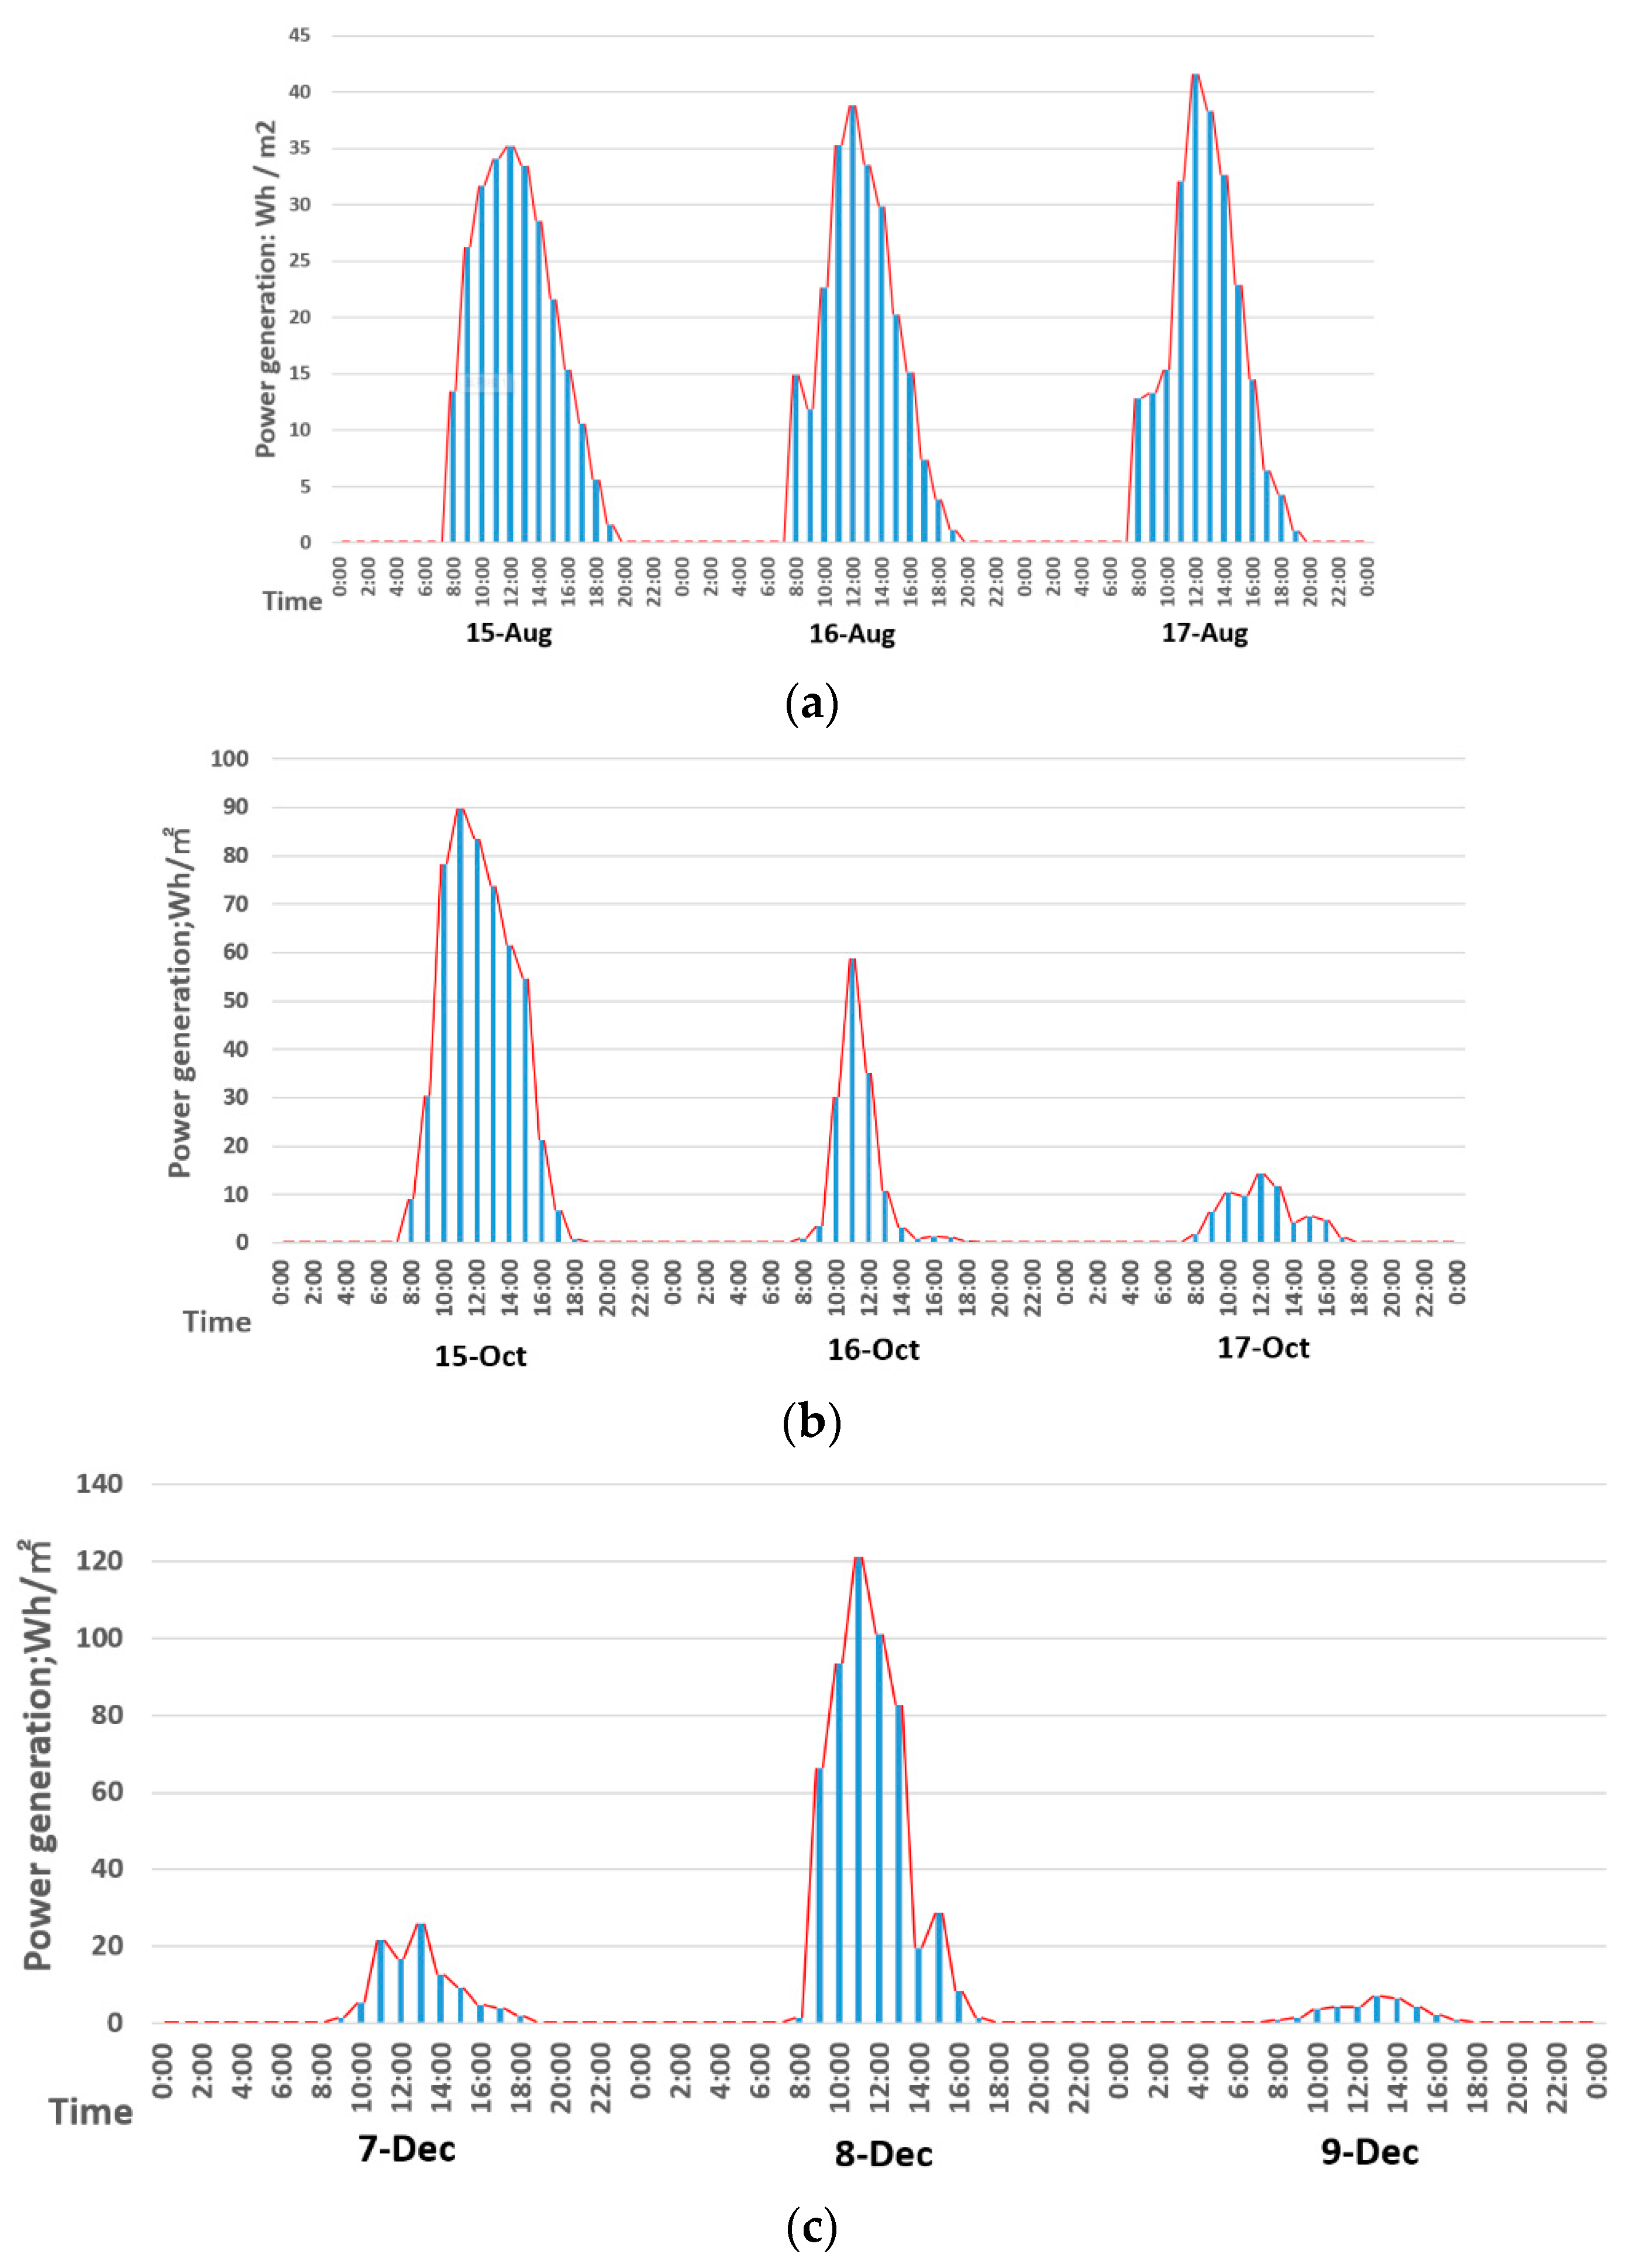
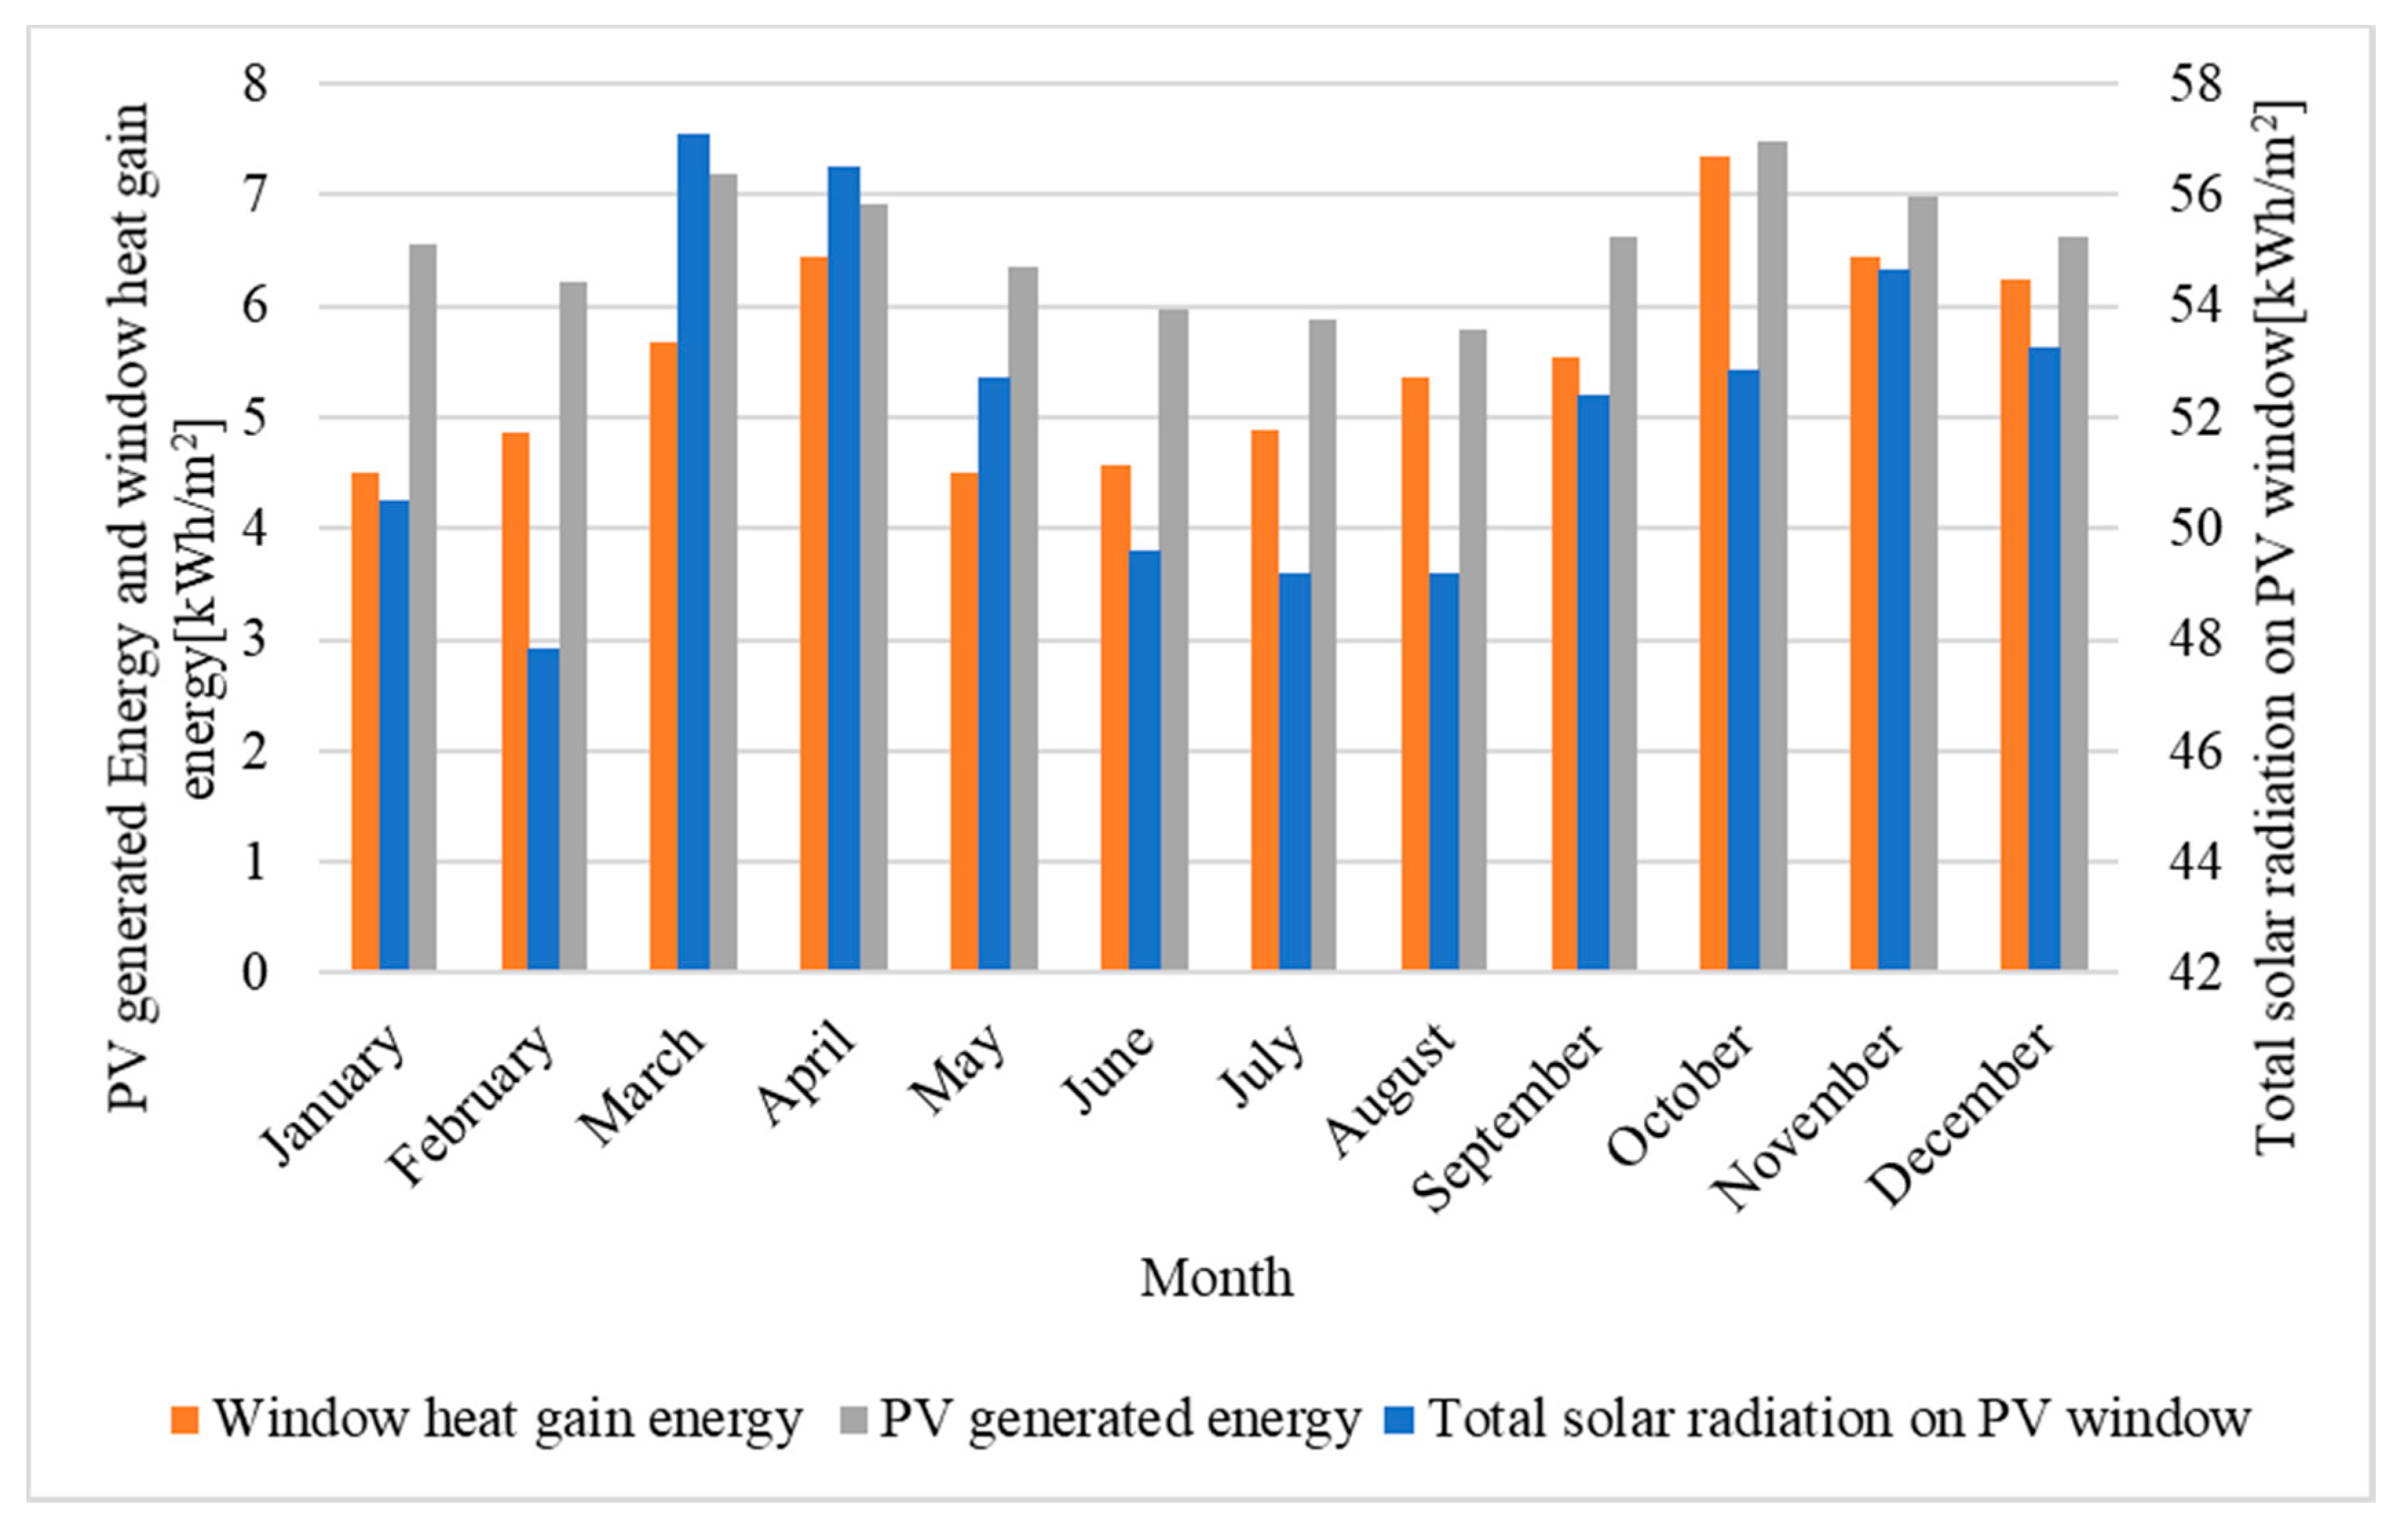
In terms of electrical performance, because the average irradiance on the south facade wall in autumn was much greater than the other two seasons, the electricity generation of PV window in autumn was the highest with 50 W/m2 among the three seasons. The average electricity efficiency was 14.4%, 13.63%, and 13.47% in summer, autumn, and winter, respectively. This indicates that the innovation designed C-Si PV windows could work normally across different seasons. For the further typical day analysis, it has the same trend.
(2)
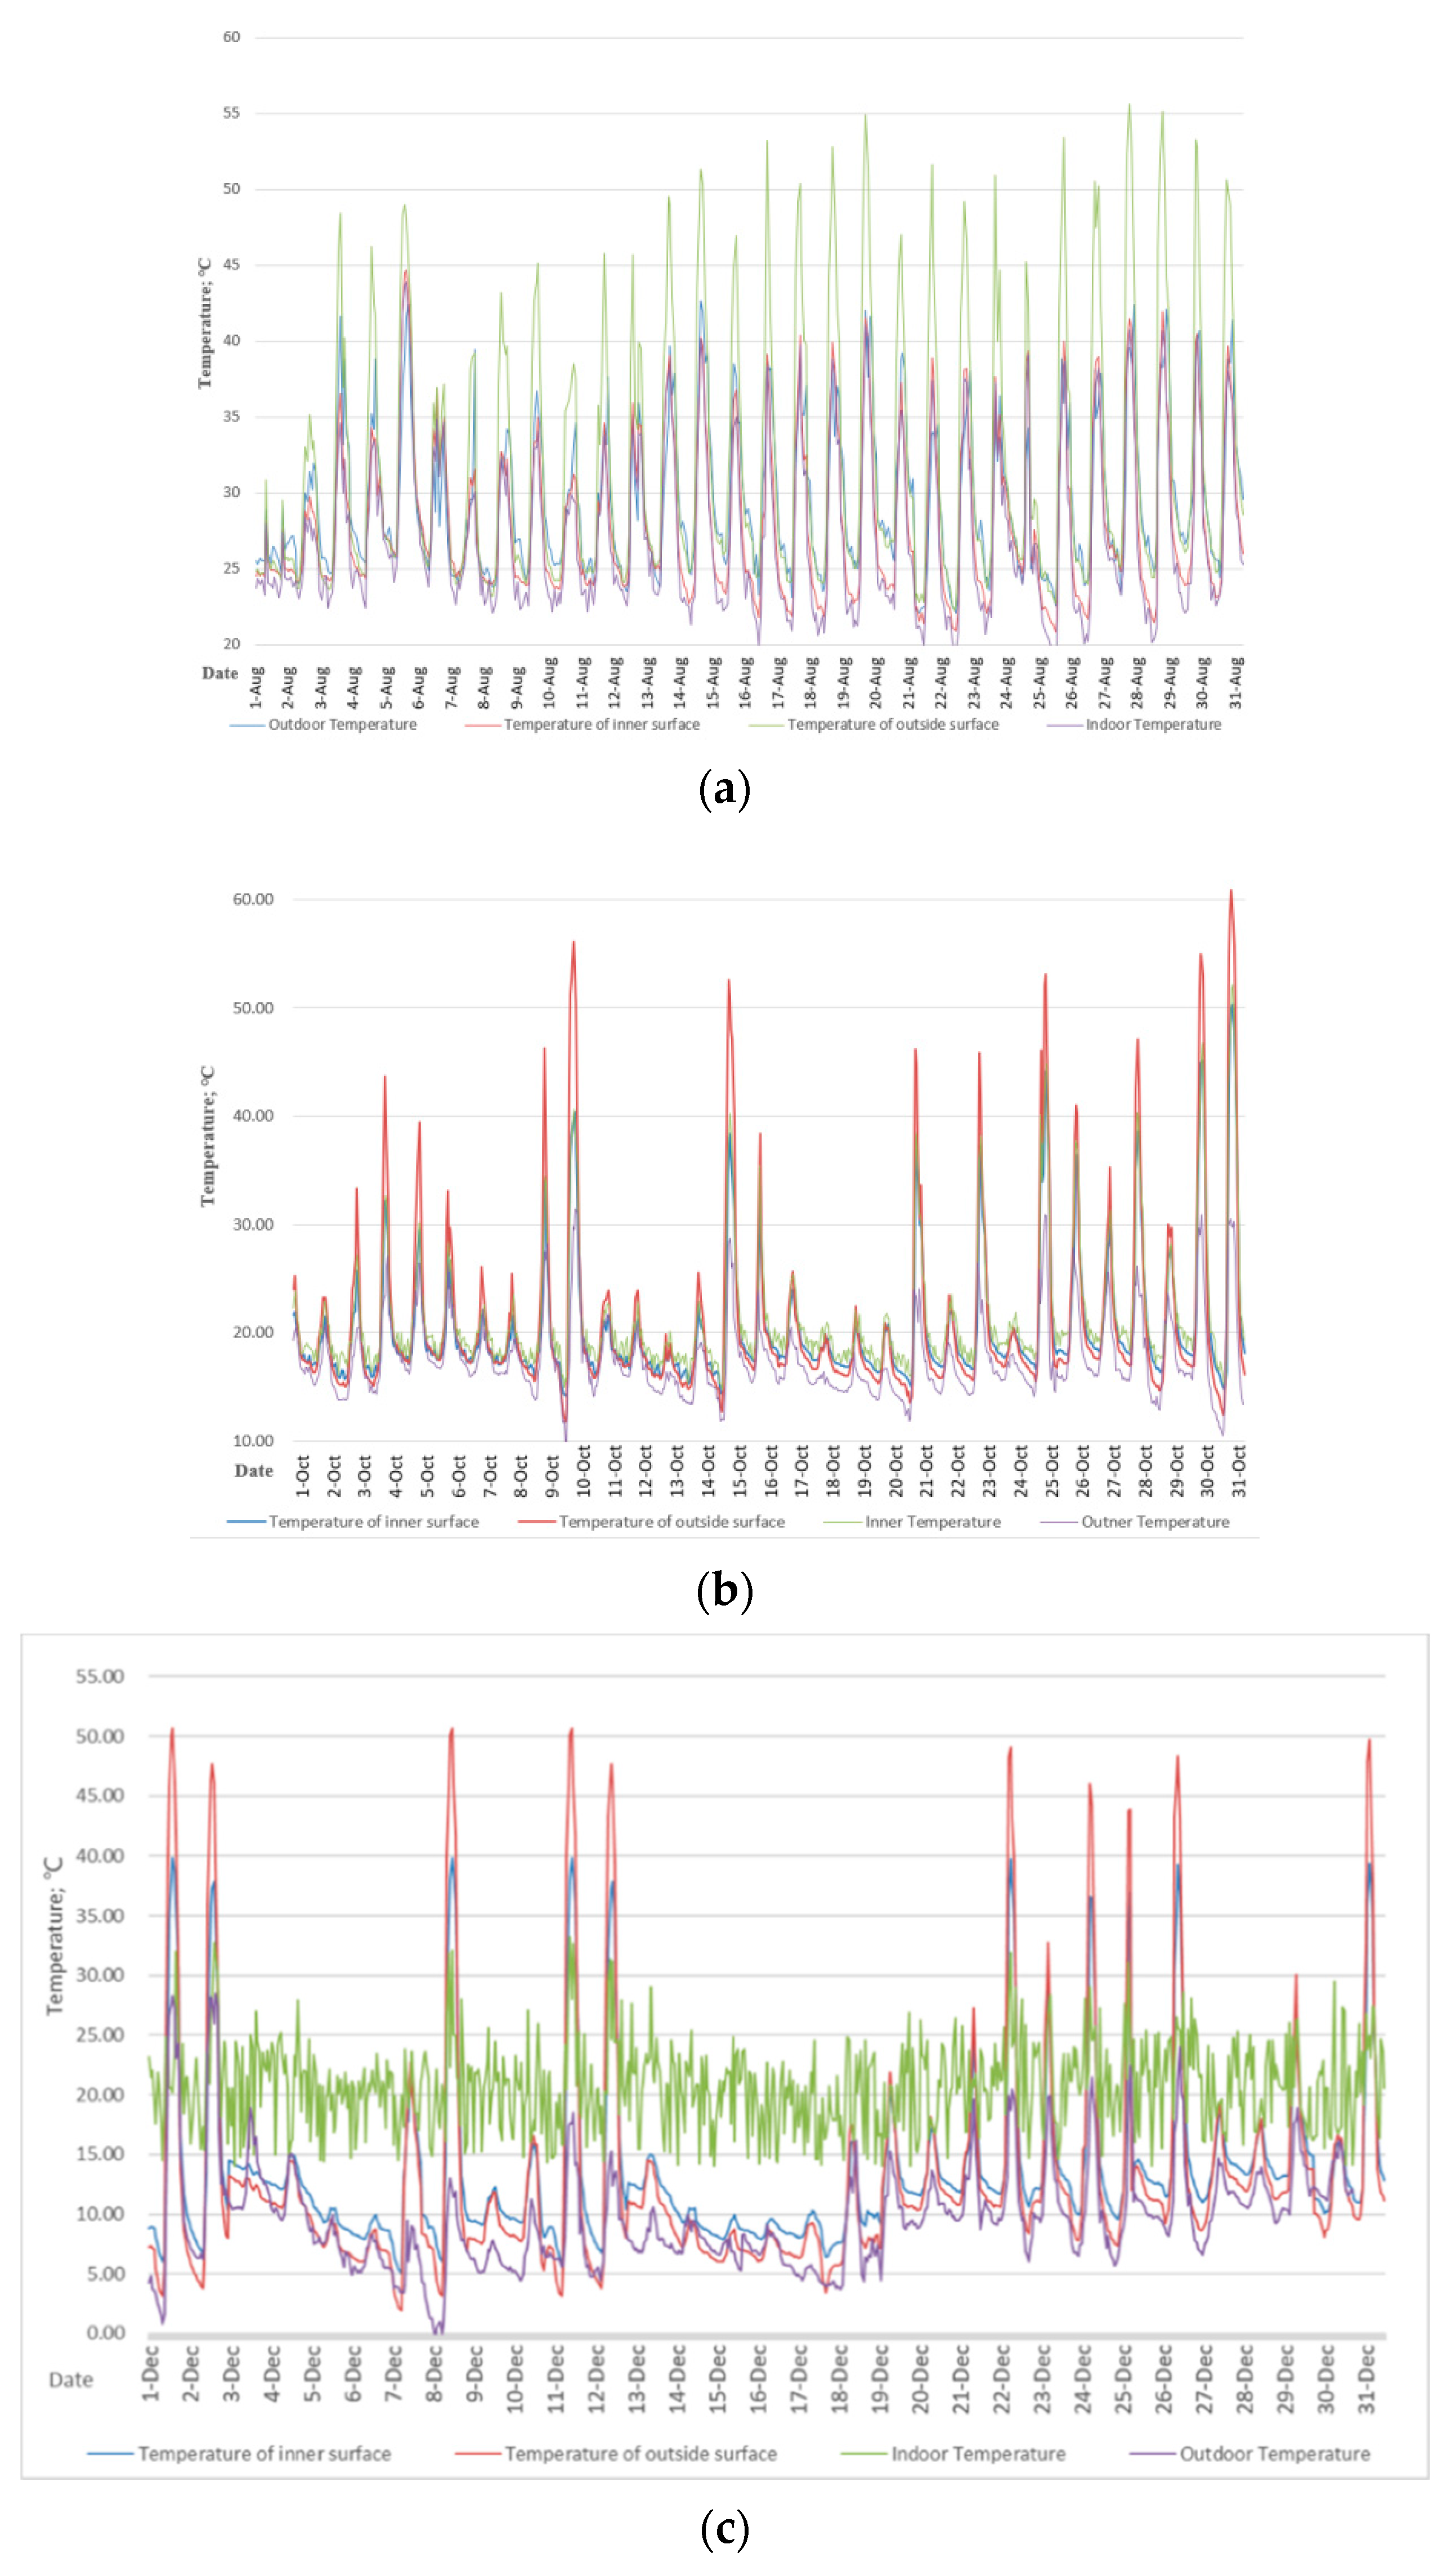
For the thermal performance analysis, the average heat daily flux density through PV window was up to 60 W/m2 due to the high outdoor ambient temperature in summer. In Autumn, the average heat gain of the PV window was 80 W/m2, which was significantly higher than that of the two seasons. Some measures could be considered such as shading and ventilation in order to reduce the building cooling load. In winter, the heat generation could be strengthened and reduce the building heating load.
(3)
Although the PV window blocks the daylighting partially, the daylighting requirement was still met on most of the days. Furthermore, the average of the UDI in summer was the highest up to 0.79, and the average illumination uniform among the all seasons may achieve a higher level. It indicates that the PV window can improve the indoor lighting environment of the BIPV building.

Author Contributions

Conceptualization, W.Z.; Data curation, W.W., H.T., M.C., Z.L. and J.L.; Methodology, W.W.; Project administration, L.X.; Writing—original draft, W.W.; Writing—review & editing, W.Z. All authors have read and agreed to the published version of the manuscript.

Funding

This research was funded by National Key Research and Development Program of China (No. 2016YFE0124500), Sichuan Science and Technology Program (2019YFH0184), Science & Technology Department Foundation of Chengdu City, China (2017-GH02-00006-HZ) and “the Fundamental Research Funds for the Central Universities.

Acknowledgments

It is supported by National Key Research and Development Program of China (No. 2016YFE0124500), Sichuan Science and Technology Program (2019YFH0184), Science & Technology Department Foundation of Chengdu City, China (2017-GH02-00006-HZ) and “the Fundamental Research Funds for the Central Universities”.

Conflicts of Interest

The authors declare no conflict of interest.

Nomenclature

Abbreviations
PVPhotovoltaic
C-SiCrystalline silicon PV cells
a-SiThin film PV cells
PVB-DSFDouble-layer photovoltaic shutters
SHGCThe fraction of incident solar radiation admitted through a window, both directly transmitted and absorbed and subsequently released inward
U valueHeat transfer coefficient
UDIThe useful daylight illuminance
Symbols
G d The solar radiation direct transferred into the room through the PV window, W/m2
GrThe radiation heat transfer, W/m2
GcThe conductive heat transfer, W/m2
ηThe PV window power generation efficiency, W/m2
PThe output of PV window, W
AwThe area of PV window, m2
ToThe outdoor ambient temperature, °C
TiThe indoor temperature, °C
CavThe average indoor daylighting coefficient on the working surface
DuniThe uniformity ratio of daylighting
CminThe minimum indoor lighting coefficient
tudThe useful daylighting time
tTThe total daytime, s

References

  1. U.S. Energy Information Administration. International Energy Outlook 2016—EIA. 2016. Available online: http://www.iea.org/etp/buildings/ (accessed on 15 May 2020).
  2. Myong, S.Y.; Jeon, S.W. Efficient outdoor performance of esthetic bifacial a-Si: H semi-transparent PV modules. Appl. Energy 2016, 164, 312–320. [Google Scholar] [CrossRef]
  3. Chen, M.; Zhang, W.; Xie, L.; Ni, Z.; Wei, Q.; Wang, W.; Tian, H. Experimental and numerical evaluation of the crystalline silicon PV window under the climatic conditions in southwest China. Energy 2019, 183, 584–598. [Google Scholar] [CrossRef]
  4. Yoon, J.H.; Shim, S.R.; An, Y.S.; Lee, K.H. An experimental study on the annual surface temperature characteristics of amorphous silicon BIPV window. Energy Build. 2013, 62, 166–175. [Google Scholar] [CrossRef]
  5. Song, J.H.; An, Y.S.; Kim, S.G.; Leea, S.J.; Yoonb, J.H.; Choung, Y.K. Power output analysis of transparent thin-film module in building integrated photovoltaic system (BIPV). Energy Build. 2008, 40, 2067–2075. [Google Scholar] [CrossRef]
  6. McCormick, P.G.; Suehrcke, H. The effect of intermittent solar radiation on the performance of PV systems. Sol. Energy 2018, 171, 667–674. [Google Scholar] [CrossRef]
  7. Park, K.E.; Kang, G.H.; Kim, H.I.; Yu, G.J.; Kim, J.T. Analysis of thermal and electrical performance of semi-transparent photovoltaic (PV) module. Energy 2010, 35, 2681–2687. [Google Scholar] [CrossRef]
  8. Li DH, W.; Lam TN, T.; Cheung, K.L. Energy and cost studies of semi-transparent photovoltaic skylight. Energy Convers. Manag. 2009, 50, 1981–1990. [Google Scholar]
  9. Wang, M.; Peng, J.; Li, N.; Lu, L.; Yang, H. Experimental study on thermal performance of semi-transparent PV window in winter in Hong Kong. Energy Procedia 2017, 105, 864–868. [Google Scholar] [CrossRef]
  10. Zhang, Y.; He, W.; Ji, J. CFD simulation analysis of thermal performance of photovoltaic double window. Build. Technol. 2009, 24, 48–51. [Google Scholar]
  11. Chen, H.; Cai, B.; Guo, J.; Wang, C.; Chen, F.; Yang, J. Air-cooled Photovoltaic Blinds with Automatic Sun Tracking System. Build. Energy Effic. 2017, 2, 29–34. [Google Scholar]
  12. Luo, Y.; Zhang, L.; Liu, Z.; Xie, L.; Wang, X.; Wu, J. Experimental study and performance evaluation of a PV-blind embedded double skin façade in winter season. Energy 2018, 165, 326–342. [Google Scholar] [CrossRef]
  13. Urraca, R.; Huld, T.; Lindfors, A.V.; Riiheläc, A.; Martinez-de-Pison, F.J.; Sanz-Garcia, A. Quantifying the amplified bias of PV system simulations due to uncertainties in solar radiation estimates. Sol. Energy 2018, 176, 663–677. [Google Scholar] [CrossRef] [Green Version]
  14. Lv, X. The Strategy of Energy Saving Design of Office Building Windows in Hot-Summer and Cold-Winter Area. Master’s Thesis, Hefei University of Technology, Hefei, China, 2010. [Google Scholar]
  15. Nie, J.; Weng, Z.; Liu, B.; Zhang, G.; Zhang, M.; Wei, S.; Chen, D. The Influence of Different Wavelength Light on the Characteristics of Flexible Solar Cell. Phys. Bull. 2015, 3, 118–121. [Google Scholar]
  16. Chow, T.T.; Li, C.; Lin, Z. Innovative solar windows for cooling-demand climate. Sol. Energy Mater. Sol. Cells 2010, 94, 212–220. [Google Scholar] [CrossRef]
  17. Marinoski, D.L.; Güths, S.; Pereira, F.O.R.; Lamberts, R. Improvement of a measurement system for solar heat gain through fenestrations. Energy Build. 2007, 39, 478–487. [Google Scholar] [CrossRef]
  18. Wang, M.; Peng, J.; Li, N.; Yang, H.; Wang, C.; Li, X.; Lu, T. Comparison of energy performance between PV double skin facades and PV insulating glass units. Appl. Energy 2017, 194, 148–160. [Google Scholar] [CrossRef]
  19. Fokaides, P.A.; Kalogirou, S.A. Application of infrared thermography for the determination of the overall heat transfer coefficient (U-Value) in building envelopes. Appl. Energy 2011, 88, 4358–4365. [Google Scholar] [CrossRef]
  20. Tina, G.M.; Gagliano, A. An improved multi-layer thermal model for photovoltaic modules. In Proceedings of the 2016 International Multidisciplinary Conference on Computer and Energy Science (SpliTech), Split, Croatia, 13–15 July 2016; pp. 1–6. [Google Scholar]
  21. Method of Daylighting Measurement; Standardization Administration of China: Beijing, China, 2017.
  22. Wei, W.; Kunpeng, L. An Introduction of New Daylighting Evaluation Criteria: A Replacement for Daylight Factor. China Illum. Eng. J. 2012, 2, 3. [Google Scholar]
  23. Nabil, A.; Mardaljevic, J. Useful daylight illuminances: A replacement for daylight factors. Energy Build. 2006, 38, 905–913. [Google Scholar] [CrossRef]
  24. Code for Thermal Design of Building (GB 50176-2016); China Architecture and Building Press: Beijing, China, 2016.
  25. Lu, L.; Law, K.M. Overall energy performance of semi-transparent single-glazed photovoltaic (PV) window for a typical office in Hong Kong. Renew. Energy 2013, 49, 250–254. [Google Scholar] [CrossRef]
  26. Methods of Daylighting Mersurements (GB/T 5699-2017); China Academy of Building Research: Beijing, China, 2017.
  27. Wang, W.; Zhang, W.; Xie, L.; Wu, Y.; Tian, H.; Zheng, L. Experimental Assessment of the Energy Performance of a Double-Skin Semi-Transparent PV Window in the Hot-Summer and Cold-Winter Zone of China. Energies 2018, 11, 1700. [Google Scholar] [CrossRef] [Green Version]
  28. Manual for Outdoor PV Test SYSTEM. 2018. Available online: http://www.ei41.com/Home/JSZC_Search? openPartTypeName=jishuzhichi_chanpinziliao (accessed on 15 March 2018).
  29. National Standard of the People’s Republic of China. GB 50736-2012: Design Code for Heating Ventilation and Air Conditioning of Civil Buildings; China Architecture and Building Press: Beijing, China, 2012. [Google Scholar]
  30. Standard for Daylighting Design of Buildings (GB/T 50033-2013); Ministry of Housing and Urban-Rural Development of the People’s Republic of China and General Administration of Quality Supervision, Inspection and Quarantine of the People’s Republic of China: Beijing, China, 2013.
  31. Gagliano, A.; Aneli, S.; Nocera, F. Analysis of the performance of a building solar thermal facade (BSTF) for domestic hot water production. Renew. Energy 2019, 142, 511–526. [Google Scholar] [CrossRef]
  32. Tina, G.M.; Gagliano, A.; Nocera, F.; Patania, F. Photovoltaic glazing: Analysis of thermal behavior and indoor comfort. Energy Procedia 2013, 42, 367–376. [Google Scholar] [CrossRef] [Green Version]
Figure 1. Window integrated with different types of PV cell materials (a). C-Si, (b). a-Si (c). concentrator PV (CPV)).
Energies 13 05684 g001
Figure 2. The energy flow of PV windows.
Energies 13 05684 g002
Figure 3. The structure of the double-skin C-Si PV window.
Energies 13 05684 g003
Figure 4. Experiment test rig.
Energies 13 05684 g004
Figure 5. The experimental test rig.
Energies 13 05684 g005aEnergies 13 05684 g005b
Figure 6. The schematic diagram of the test system.
Energies 13 05684 g006
Figure 7. The solar radiation upon south façade ((a). August; (b). October; (c). December).
Energies 13 05684 g007aEnergies 13 05684 g007b
Figure 8. The power generation of C-Si PV window ((a). August; (b). October; (c). December).
Energies 13 05684 g008aEnergies 13 05684 g008b
Figure 9. The electrical conversion efficiency of C-Si PV window ((a). August; (b). October; (c). December).
Energies 13 05684 g009
Figure 10. The solar radiation in typical days ((a). August; (b). October; (c). December).
Energies 13 05684 g010
Figure 11. Power generation of PV window in typical days ((a). August; (b). October; (c). December).
Energies 13 05684 g011
Figure 12. The electrical conversion efficiency of C-Si PV window in typical days ((a). August; (b). October; (c). December).
Energies 13 05684 g012
Figure 13. Surface temperature of C-Si PV window ((a). August; (b). October; (c). December).
Energies 13 05684 g013
Figure 14. Outdoor temperature from June to December.
Energies 13 05684 g014
Figure 15. The windows heat gains of C-Si PV window ((a). August; (b). October; (c). December).
Energies 13 05684 g015
Figure 16. The test statistics of U value and solar heat gain coefficient (SHGC).
Energies 13 05684 g016
Figure 17. The daylight illumination of C-Si PV window ((a). August; (b). October; (c). December).
Energies 13 05684 g017aEnergies 13 05684 g017b
Figure 18. The daylight illumination of C-Si PV window ((a). August; (b). October; (c). December).
Energies 13 05684 g018aEnergies 13 05684 g018b
Figure 19. The daylighting uniform of test room ((a). August; (b). October; (c). December).
Energies 13 05684 g019aEnergies 13 05684 g019b
Figure 20. The thermal and electrical performance of PV window.
Energies 13 05684 g020
Figure 21. PV module application potential in different cities in the world (a) Energy generation (b) window heat gain.
Energies 13 05684 g021aEnergies 13 05684 g021b
Table 1. Parameters of Semi-transparent PV (STPV) window.
a. The Properties of Double-Skin C-Si STPV Window
Layer/Propertythickness (mm)
Conventional glass6
Air gap9
PV module2
Coverage ratio of the PV window80%
b. The Parameters of C-Si Component
Size (mm)156.2 × 156.2
Efficiency (%)18.8
P max under STC (W)4.62
U oc under STC (V)0.641
I sc under STC (A)9.025
c. The Parameters of Glazing
Size (mm)156.2 × 156.2
SHGC0.72
U value ( W / ( m 2 · k ))2.83
Visible transmittance 0.723
Table 2. The key instruments.
EquipmentManufactureFunctionAccuracy/Sensitivity
Outdoor multi-channel PVCETCPV testing0 W–10 kW
PyranometerJianTongtechTesting the solar radiation 0~1800 W/m2; ±3%
Weather stationJianTongtechWeather condition recorderTemperature: ±0.5 °C, humidity: 0.1%, ±2%; atmospheric pressure: 1 mbar; wind rate: 0.1 m/s; wind direction: ±5%
T-type ThermocouplesJianTongtechTemperature test −20 °C–100 °C; 0.1 °C; ±0.5 °C
Conductive heat flux metersJianTongtech Conductive heat flux test−2000 W/m2–2000 W/m2; 5%
Radiant heat flux sensorJianTongtechRadiant heat flux test−2000 W/m2–2000 W/m2; DC5V; 0.3 μm–50 μm; ±5%
Light meterJianTongtechIlluminance measurement0–100,000 lux; 1 lux; ±4%
Multi-channel data recorderJianTongtechData collectorThe minimum resolutions are 1 μV and 0.1 °C
Table 3. Maximum illumination of the test room.
SpringSummerAutumnWinter
Maximum illumination of the test room; lx1500120016002500
Publisher’s Note: MDPI stays neutral with regard to jurisdictional claims in published maps and institutional affiliations.

