Article

Hydrodynamics of Two-Phase Gas-Very Viscous Liquid Flow in Heat Exchange Conditions

by
Krystian Czernek
* and
Stanisław Witczak
Department of Process Engineering, Faculty of Mechanical Engineering, Opole University of Technology, ul. Prószkowska 76, 45-758 Opole, Poland
*
Author to whom correspondence should be addressed.
Energies 2020, 13(21), 5709; https://doi.org/10.3390/en13215709
Submission received: 14 September 2020 / Revised: 22 October 2020 / Accepted: 29 October 2020 / Published: 31 October 2020
(This article belongs to the Section D1: Advanced Energy Materials)

Abstract

:
This paper presents the results of analyses of the impact of heat transfer conditions on the hydrodynamics of downward co-current annular flow in vertical tubes of very viscous liquid and gas. The research was conducted within the range of gas velocities of 0–30.0 m/s and liquid velocities of 0.001–0.254 m/s, while the viscosity was in the unprecedented range of 0.046–3.5 Pas. The research demonstrates that the volume and nature of the liquid waves with various amplitudes and frequencies arising on the surface of the film are relative to the flow rate and viscosity of the gas phase. At the same time, we found that, under the condition of liquid cooling, an increase in viscosity resulted in the formation of a smooth interface whereas, under the conditions where the liquid is heated at the end of the channel section, a greater number of capillary waves were formed. This research resulted in the development of new dependencies which take into account the influence of selected thermal and flow parameters (including mass fraction) on the values of volumes specific to very viscous liquid film flows. These dependencies improve the accuracy of calculation by 8–10% and are fully applicable to the description of the performance of an apparatus with a hydraulically generated liquid film.

Graphical Abstract

1. Introduction

The two-phase flow of a gas and a highly viscous liquid includes a wide range of phenomena, which have attracted interest in both industrial and academic circles. Therefore, when design and assessment are performed, it is necessary to comprehensively investigate the hydrodynamics of such flows with regard to the efficiency of important chemical, oil production and conventional/nuclear power system processes, among others. Very viscous liquid is assumed to denote a liquid whose dynamic viscosity coefficient at 20 °C exceeds the dynamic viscosity coefficient of water by over 100 times. As a consequence of the important role of determining the interfacial transfer of mass, momentum and energy between two phases, many creative studies have been conducted over the past few decades, in order to explore these mechanisms and to further develop constructive models with the purpose of predicting variations in two-phase gas-liquid flows. The constitutive models developed to date can be classified into several types. Those that are most commonly used in two-phase flows involve the development of empirical or semi-empirical correlations and models on the basis of physical mechanisms and/or the application of extensive experimental data. Such predictions may be relative to flow structures. Therefore, thorough knowledge of such parameters is a prerequisite for any two-phase flow analysis. For more information on this, see the papers by Hibiki and Ishii [1], Ozar et al. [2], Shen and Deng [3] and Shen and Hibiki [4]. The physical mechanisms related to this type of correlation usually include the effect of the flow channel geometry scale and the dependence of the model on the physicochemical properties of the fluid and their velocity (laminar or turbulent flow)—and, thus, flow patterns—on its hydrodynamics.
We note the scarcity of studies in the area related to the study of the dynamics of annular two-phase gas-very viscous liquid flow, particularly in conditions accompanied by heat exchange.
Padilla et al. [5] presented measurements of the total pressure drop and qualitative visual observation of two-phase flow structures for various refrigerants in the conditions of downwards flow through a vertical elbow with an internal diameter of 6.7 mm. Gabriel et al. [6] also reported the results of research in rectangular curved canals accompanying a rising two-phase flow. They aimed to determine the phase distribution under the conditions of wavy stratified flow. The research was based on observation in elbows followed by processing and evaluating the recorded images. Additionally, Pietrzak and Witczak [7] studied the hydrodynamics of two-phase gas–liquid flow and three-phase gas–liquid–liquid flow in U-pipe elbows. Their research included the observation of flow structure formation and determination of the volume share of individual phases. On the basis of the results of their experimental research, maps were developed for these types of flows and various methods were explored with the purpose of calculating the volume ratios of the phases. The tests were carried out in pipe elbows with the internal diameters of 0.016, 0.022 or 0.03 m and radius of curvature equal to 0.11, 0.154 or 0.21 m.
The most common design solution applied in process equipment involves a vertical system of channels. Hence, the largest proportion of reports in this area relate to this type of flow. The most important quantity that determines the conditions of heat and mass exchange is associated with the interfacial surface. To a large extent, it is relative to the structures formed that accompany the flow. Research concerned with their determination has been carried out, among others, by Ebrahimi-Mamaghani et al. [8], Liu et al. [9] and Hamidi et al. [10], in which the analysis involved heat transfer coefficients, as well as Smith et al. [11] and Shen et al. [12], who supplemented their analyses by determining the volume ratios of particular phases. Shen et al. [13] also carried out experiments involving vertical rectangular channels during the upward flow of two-phase water and air with the purpose of determining the volume ratios and flow velocities of the individual phases. Shen et al. [14] also investigated losses generated by two-phase air–water flow during upward two-phase flow in vertical rectangular channels under pressure. The value of the interfacial surface is also affected by the thickness of the liquid film flow. Studies in this area have been conducted by Ju et al. [15] and Liu et al. [16], who also verified the results of their experiments using numerical simulations; Liu et al. [9], however, studied the value of the interface between a two-phase upward flow.
In a variety of tubular reactors, the conditions of downward vertical gas-liquid two-phase flow occur just as commonly as the upwards flow. A majority of works have included research into the structures that accompany this type of flow. These include the work of Dang et al. [17], in which two-phase flow maps were developed as part of the research. Using a conductivity probe, they determined the phase volume ratios, interfacial surface, bubble velocity and the Sauter mean diameter in a 25.4 mm diameter pipe. The study by Gao et al. [18] reported research concerned with determining flow structures and determining their effect on the value of the heat transfer coefficient. In turn, Jiang and Bai [19] determined the effect of flow structures on the pressure loss value. Julia et al. [20] and Julia and Hibiki [21] determined the structures accompanying falling two-phase flow and developed maps of this flow that included a predictive model with regard to the range of their occurrence with considerable accuracy. Lee et al. [22] conducted research concerned with determining the effect of falling flow structures on the formation of the heat transfer coefficient in a channel heated from the outside. The works of Qiao et al. [23] and Xue et al. [24] involved research dealing with the determination of flow structures occurring during two-phase gas-liquid downward flow in vertical pipes and developed flow maps corresponding to their occurrence. The tests by Xue et al. [24], however, were carried out in pipes with an internal diameter of 25 mm and a length of 6 m. Studies considering the basic properties (i.e., existence and uniqueness of solutions) of mathematical models describing temperature-dependent flows through a bounded domain have been carried out by Baranovskii et al. [25] and Cimatti [26].
The literature review revealed that there have been very few papers concerning investigations on the hydrodynamics and heat transfer in high viscous liquid film. Empirical and theoretical calculation models have rarely been verified with the viscosity of liquid being over 0.1 Pas. Therefore, the application of existing models to high viscous liquid situations is risky and may give incorrect results during extrapolation. We can note that, despite the existence of many works and measuring techniques, not a single system has been designed and implemented to provide ways to conduct measurements of hydrodynamic quantities in the circumstance where the two-phase flow includes a gas and a very viscous dielectric liquid; therefore, this problem is the subject of the article.
The work describes the hydrodynamics accompanying the conditions of co-current, two-phase two-component gas–very viscous liquid downflow through vertical pipes, with a particular emphasis on annular flow parameters. Experimental studies elucidate the way in which the boundaries of the formation of various forms of annular flow could be determined and provide means for the measurement of quantities characteristic of liquid film flows. The study results allow for the determination of conditions for the formation of qualitatively different liquid films, description of the quantities characteristic of liquid film flow and development of relations applicable to describe hydrodynamic phenomena occurring under the conditions of annular flow involving gas and very viscous liquid.

2. Materials and Methods
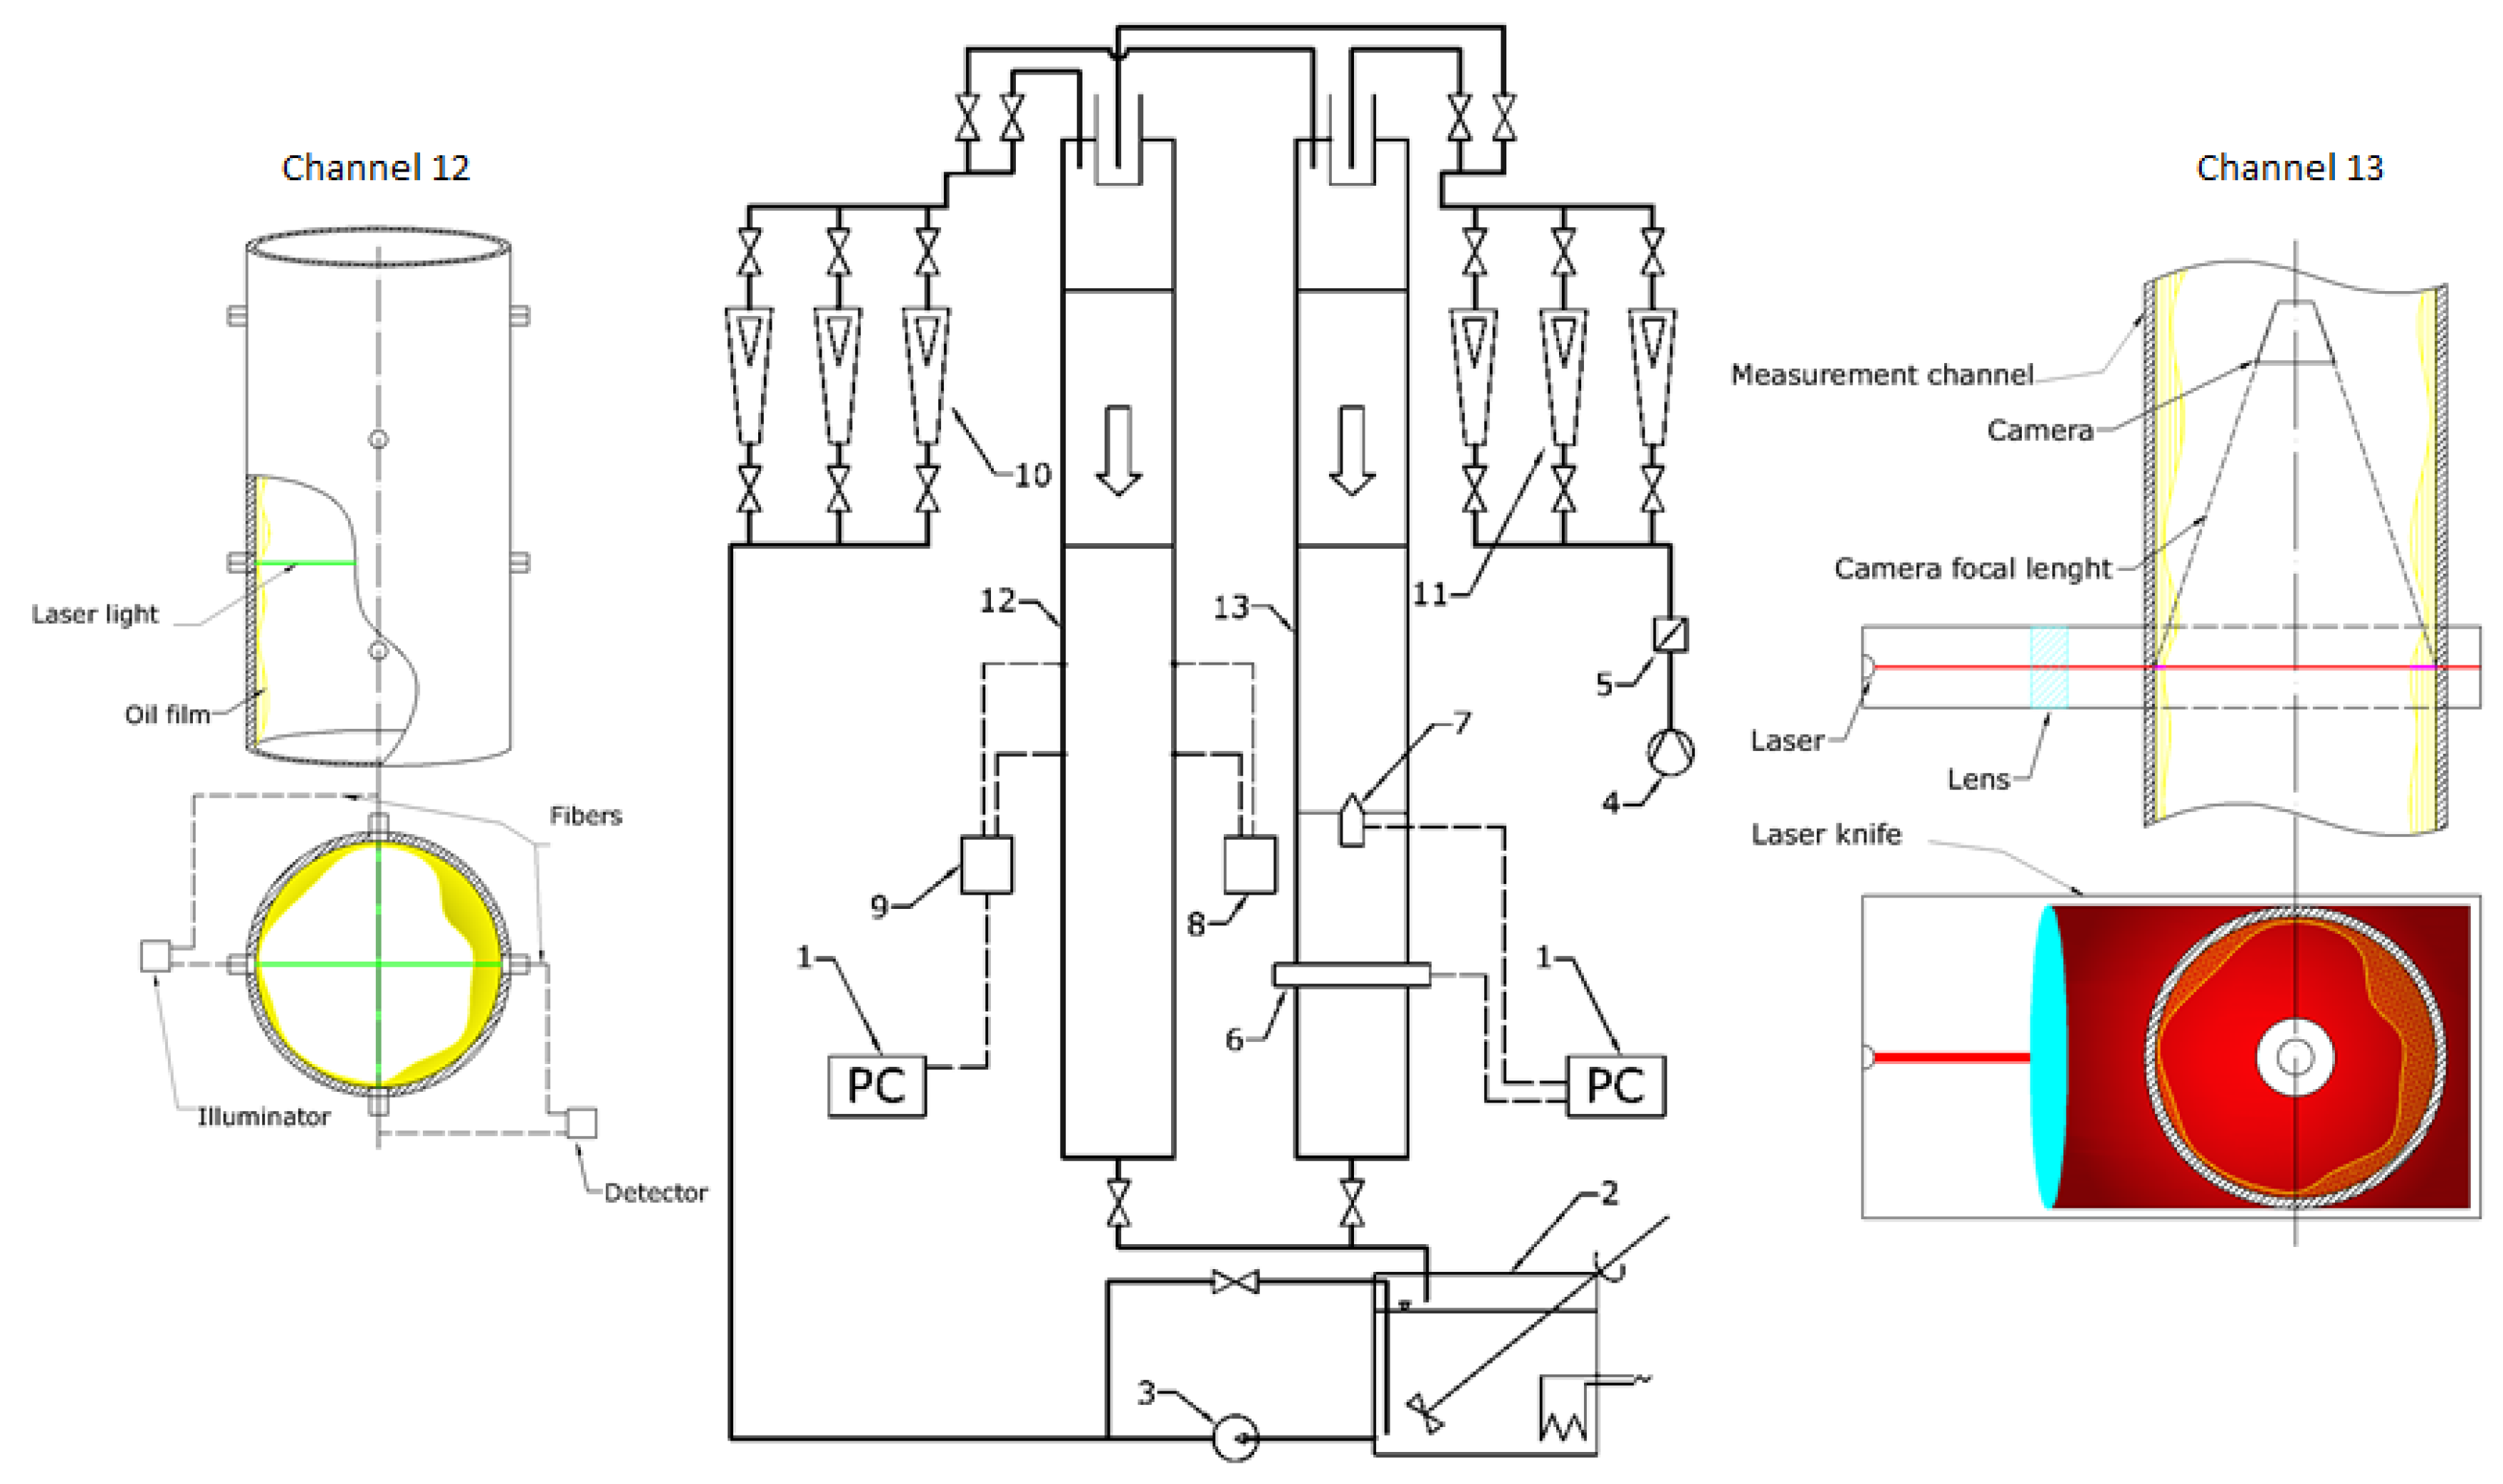
Experimental Setup

In order to determine the flow phenomena occurring during the downstream co-current annular flow, a test stand typical of this type of research was developed and built, enabling estimation of the hydrodynamics of the liquid film in adiabatic conditions and involving heat transfer (Figure 1).
The flow channels (12 and 13), with various diameters, were supplied with compressed air from a central pressurized system (4). The air flow was provided through a reducing valve (5), with flow rate regulated by means of a battery of rotameters (11). By means of the reducing valve, a constant gas pressure was maintained, which offered accurate measurement of its flow rate. Air was then routed to the supply system located at the inlet section of each channel, which was designed as a system with a central nozzle. The liquid was supplied from tank 2, in which approximately 80 liters of oil were stored at a time. The tank was equipped with an agitator, a thermostat and heaters (with a capacity of 8 kW). Before the inlet to the installation, the air temperature and pressure in the installation were measured which, combined with the use of a thermostat, guaranteed testing under adiabatic conditions.
The oil was pumped into the flow channel by means of a toothed pump (3), which was driven by a DC motor, providing the possibility of smooth regulation of the pump speed by varying the supply voltage, as well as the resulting regulation of the flow rates of oil. The oil was routed from the pump to the battery of oil rotameters (10), where the latter were applied to measure the flow rate of the components.
The fluid and gas flowrates were measured in separate circuits using Kobold and Rotameter flowmeters. The accuracies of the flowmeters were within the range of 1.4% to 4.5%.
Subsequently, the oil was reversed into the chamber in which the two-phase mixture was initially generated. When the scope of the study was considered, efforts were made to select the ranges of flow rate variations such that, in all the measuring channels used, both laminar and turbulent nature of the gas phase flow occurs along with the laminar flow of liquids. To do this, a decision was made that the air flow rate must in the range of 0–30 m/s, whereas the range of oil velocities ranged from 0.001 to 0.254 m/s.
In each case, the measuring channel (12, 13) consisted of two parts, a non-transparent section and a transparent one. In the non-transparent (start-up) section, the flow was conditioned upstream of the measurement section in the channel, which was equipped with an optoelectronic system (7–9) designed for measurement of the flow parameters. Channel 12 uses a linear measuring system—that is, a single-axis optical probe—to measure the quantities characterizing the hydrodynamics of the two-phase gas–very viscous liquid flow. Using optoelectronic sensors (8 and 9) coupled with a PC computer with a card applied for data recording and processing (1), the local thickness of the flowing liquid film was measured and the nature of their waving was determined. For this purpose, the so-called linear measuring system was employed.
Channel 13 uses a laser knife to measure these values. The optoelectronic set (7), in turn, serves as auxiliary equipment for measurement, as it applies the so-called light knife technique, which facilitated the assessment of the parameters characteristic of such flow over the entire cross-section of the channel. The mixture at the outlet of the non-transparent section of the measuring channel continued to flow into a transparent channel made of organic glass. Ball valves were installed in the initial section of the channel, playing the role of the so-called volumetric trap. As a result of cutting off the flow, the actual volume fractions of the phases could be measured. At the time when the flow into the measurement channel was cut off, the mixture was routed through a bypass channel, which was coupled with shut-off valves through a leverage system and provided the option of instantaneous closing the measurement channel and opening the by-pass channel and vice versa. This section was also applied to observe the emerging flow patterns, which could be recorded by using a video camera and a camera. Subsequently, the mixture was reversed into a separator tank (2), in which the phases were separated.
The applied measurement and control systems were selected in such a way that the experiments were carried out in a wide range of variations, in terms of film flow parameters, both for adiabatic flow conditions as well as for the case when the oil temperature varied over the length of the measuring channel. In the latter case, due to limitations in the gaging of optoelectronic measurement systems, the scope of the tests was limited to only a slight change in temperature (around 5 K).
The tests were carried out in channels with the internal diameters of 12.5, 22 and 30 mm for the system comprising a linear optoelectronic system and 40 mm for the case of the use of a laser knife to determine the effect of tube geometry on the flow hydrodynamics of the two-phase gas-very viscous liquid mixture. For all of the applied channels, our research involved the determination of the type of flow patterns formed in them whereas, in the case of pipes with diameters of 12.5 and 22 mm, the mean values of the volume fractions, thickness and other parameters characteristic of liquid films were also determined.
In addition, for the channel with a diameter of 22 mm, measurements with regard to local states related to the flow dynamics as well as mean states corresponding to the conditions resulting from varying viscosity of the liquid were additionally performed. For this purpose, an additional tube-in-tube measuring channel was developed and built. The inner tube with a diameter of 22 mm and a length of 1.5 m was made of glass at the millimeter scale, by means of which the characteristic changes in the flowing liquid film could be determined (by applying a digital camera and recording images). The outer tube was made of plexiglass and provided with stubs, through which a heating or cooling agent could be supplied into the space between the tubes. Water with adequate temperature was applied for this purpose. This provided an opportunity to assess the characteristics of changes in the flow pattern formed by the liquid film depending on the temperature of the liquid, which resulted in a change in its viscosity along the flow path.
The design of the tube-in-tube measuring channel provided an opportunity to perform testing on the heating and cooling of a two-phase mixture, which was formed by a system consisting of air and Itherm oil. As a result of the use of a transparent measuring system, it was possible to record and analyze the flow structures, while the applied volumetric trap could be applied to assess the ratio of the liquid phase and provided a means to assess the volume fractions of the phases. Additionally, in this case, the measuring channel contained a cut-off system installed along its entire length, which ensured that measurements of the mean value of the volume fraction of phases and the mean thickness of the liquid film could be performed.
The scope of the study included analysis of the effect of heat exchange conditions on the formation of flow patterns, mean values of volume fraction of phases and mean values of the liquid film thickness. They were carried out within the range of gas velocities of jg = 0–30.0 m/s and for liquid velocities of jl = 0.001–0.254 m/s. The temperature of the oil was varied throughout the tests in the range tl = 4.5–53.0 °C, which led to the obtained variations in the dynamic oil viscosity coefficient in the range of ηl = 0.046–3.5 Pas.
With the purpose of determining the effect of the variations in flow parameters and liquid parameters on the characteristics of co-current two-phase gas-very viscous liquid flow, research was carried out through the application of several measurement series, accounting for adequate variations of the flow rates of the gas and liquid phases. In addition, an assumption was made that the same flow parameters should be applied in the case of both cooling and heating of the two-phase flow. In order to determine the effect of viscosity changes on the investigated parameters, comparative tests were also carried out for adiabatic conditions in the same range of temperatures as in the conditions of the research with heat exchange.

3. Results and Discussion

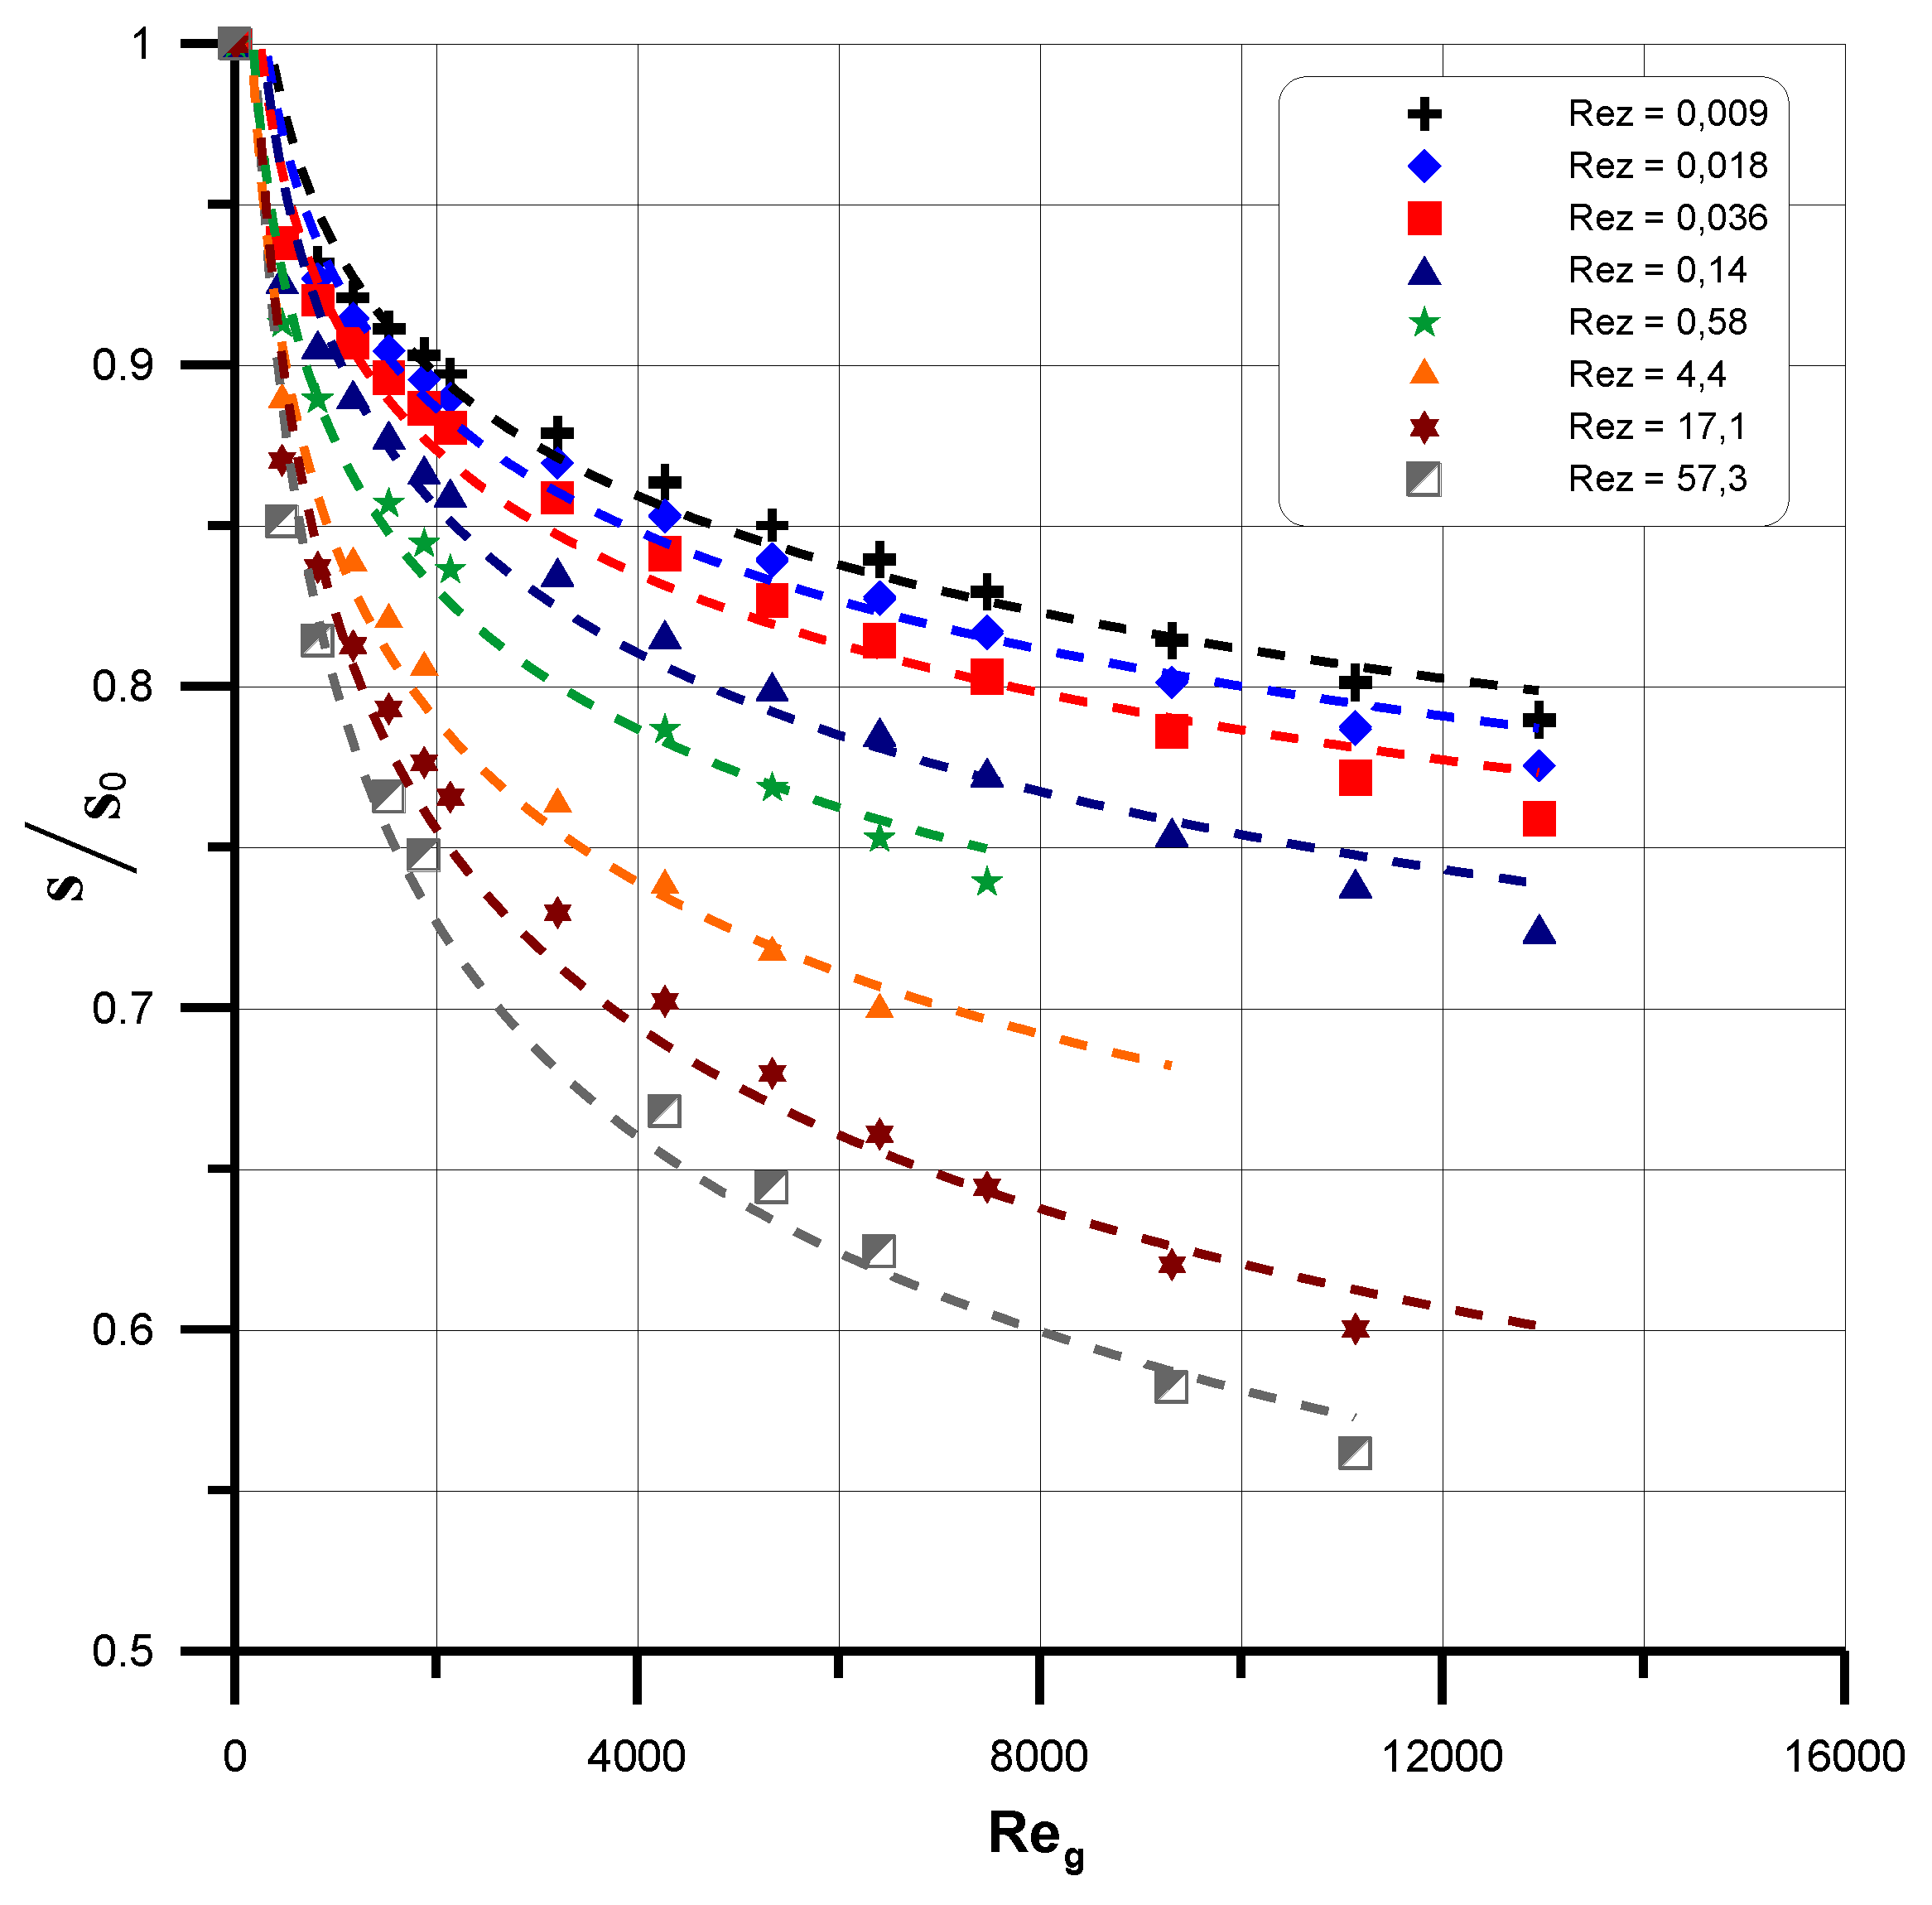
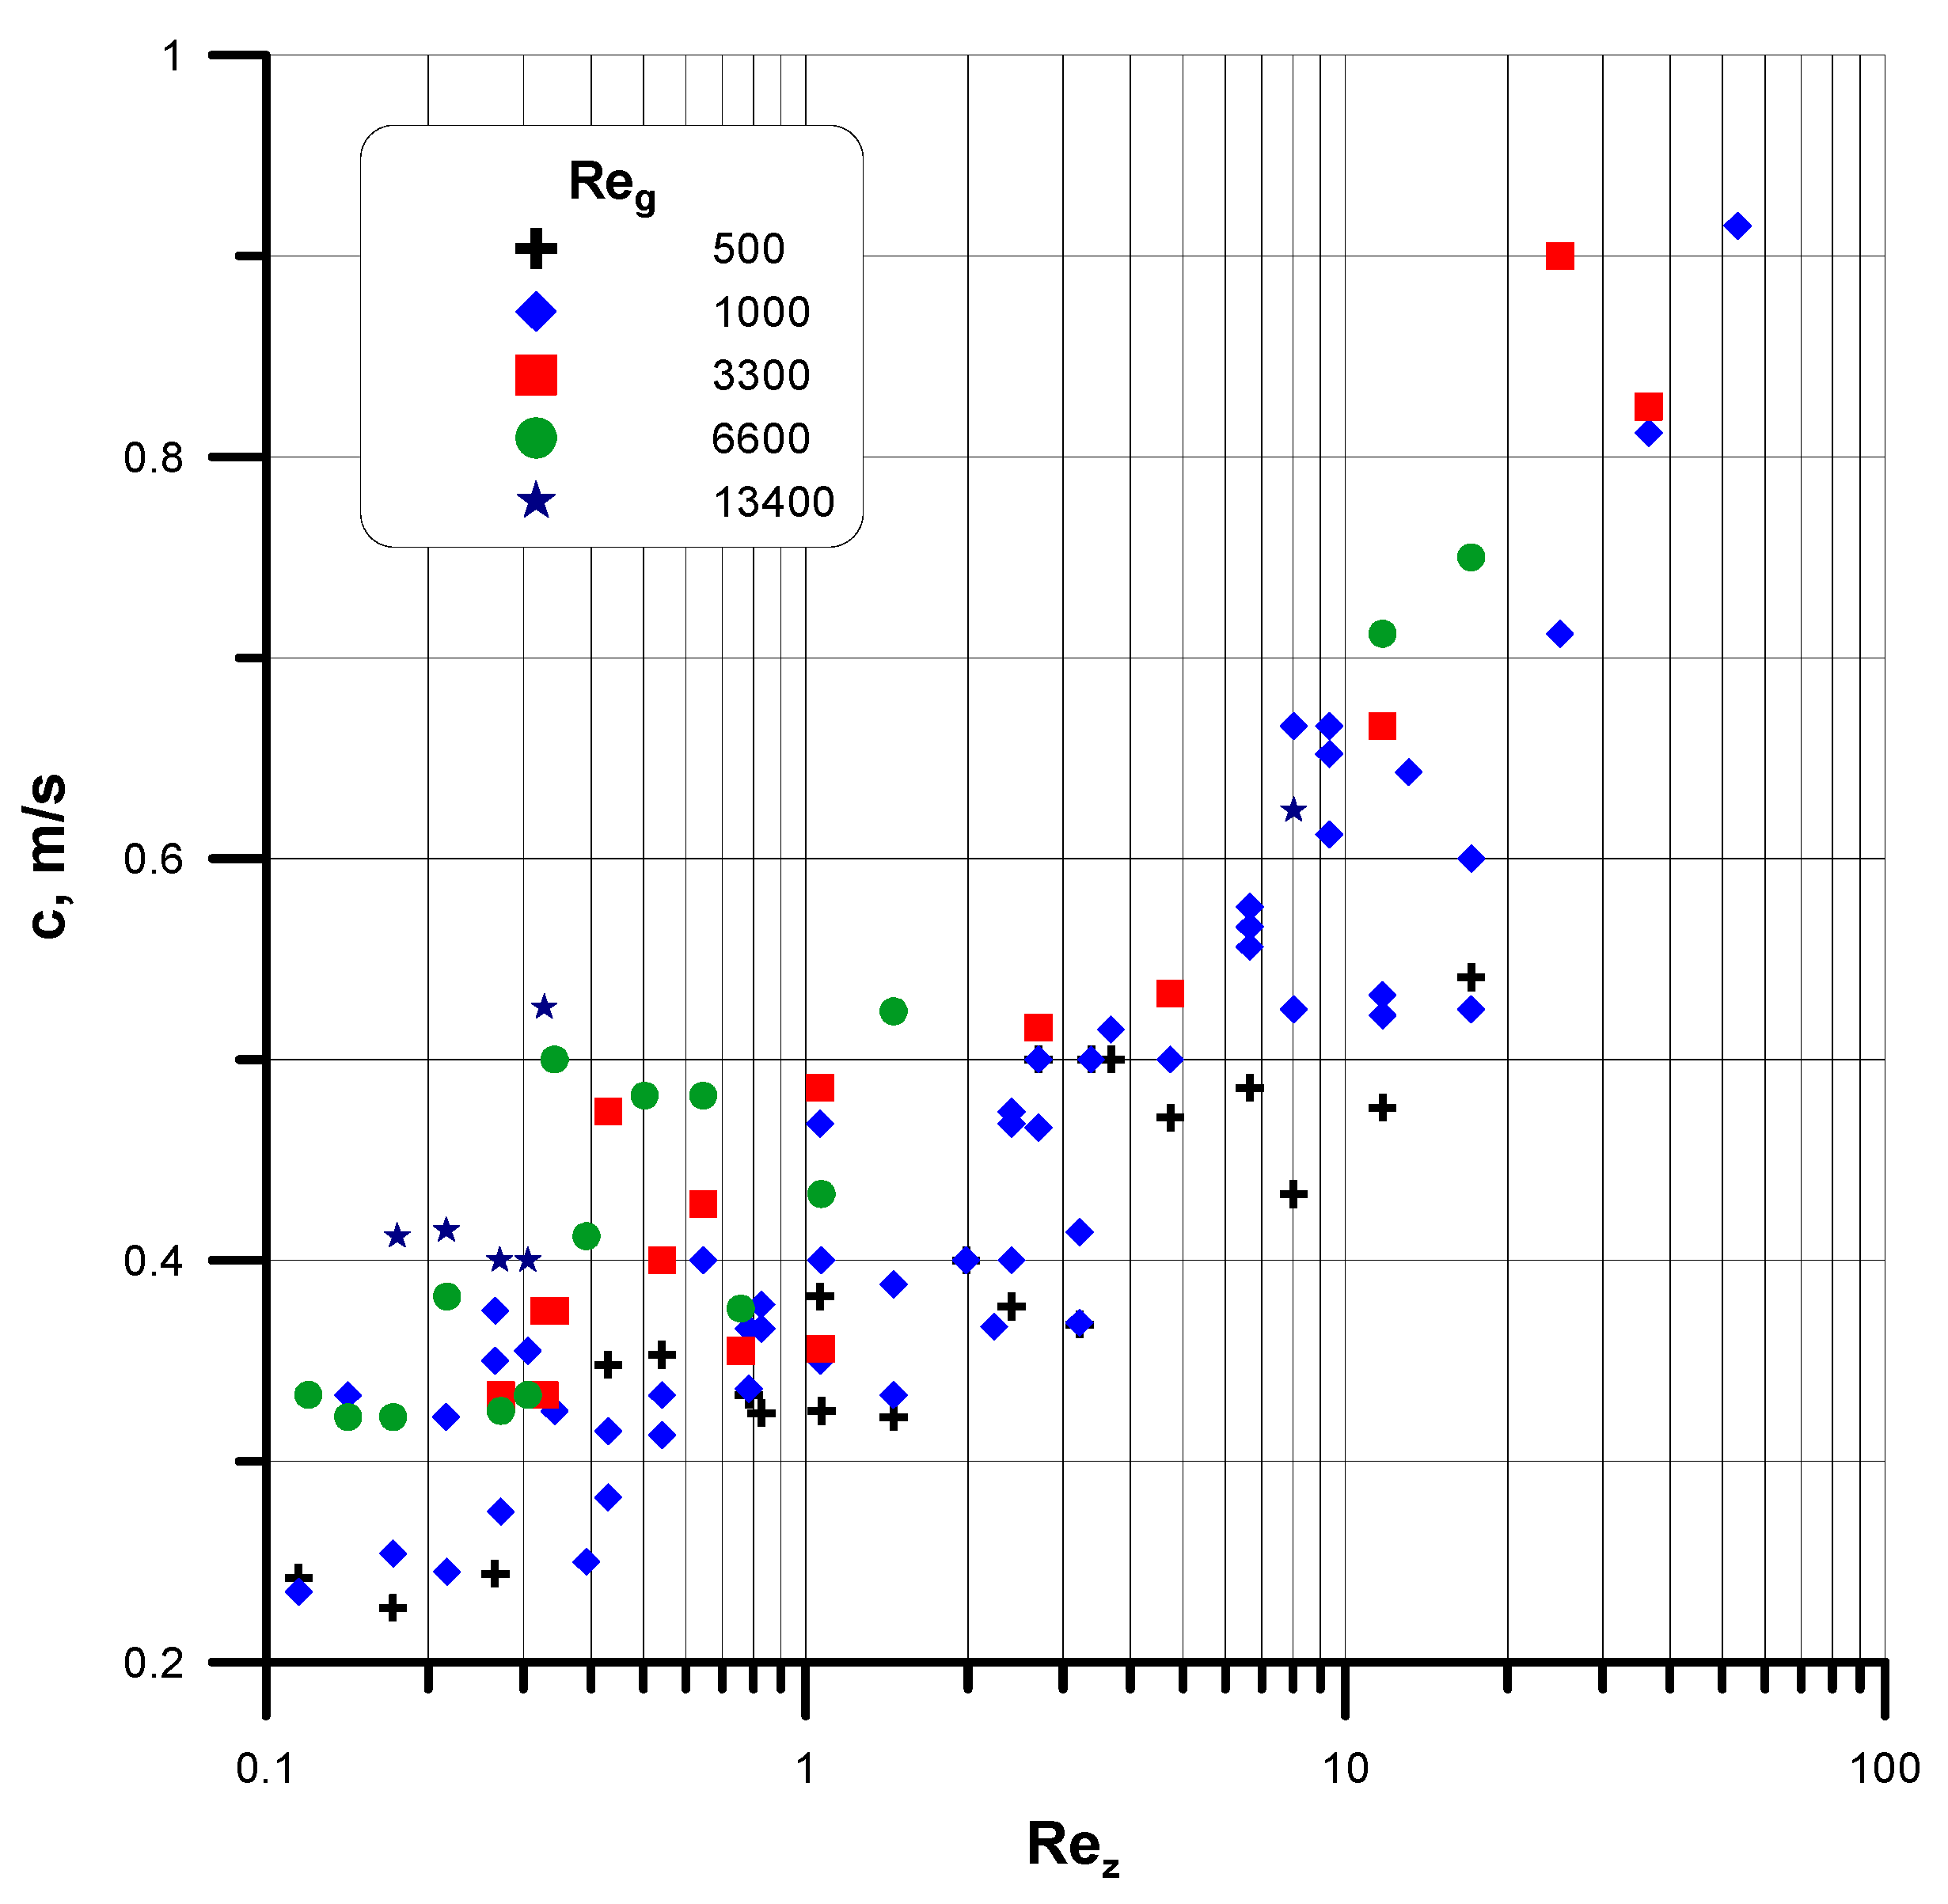
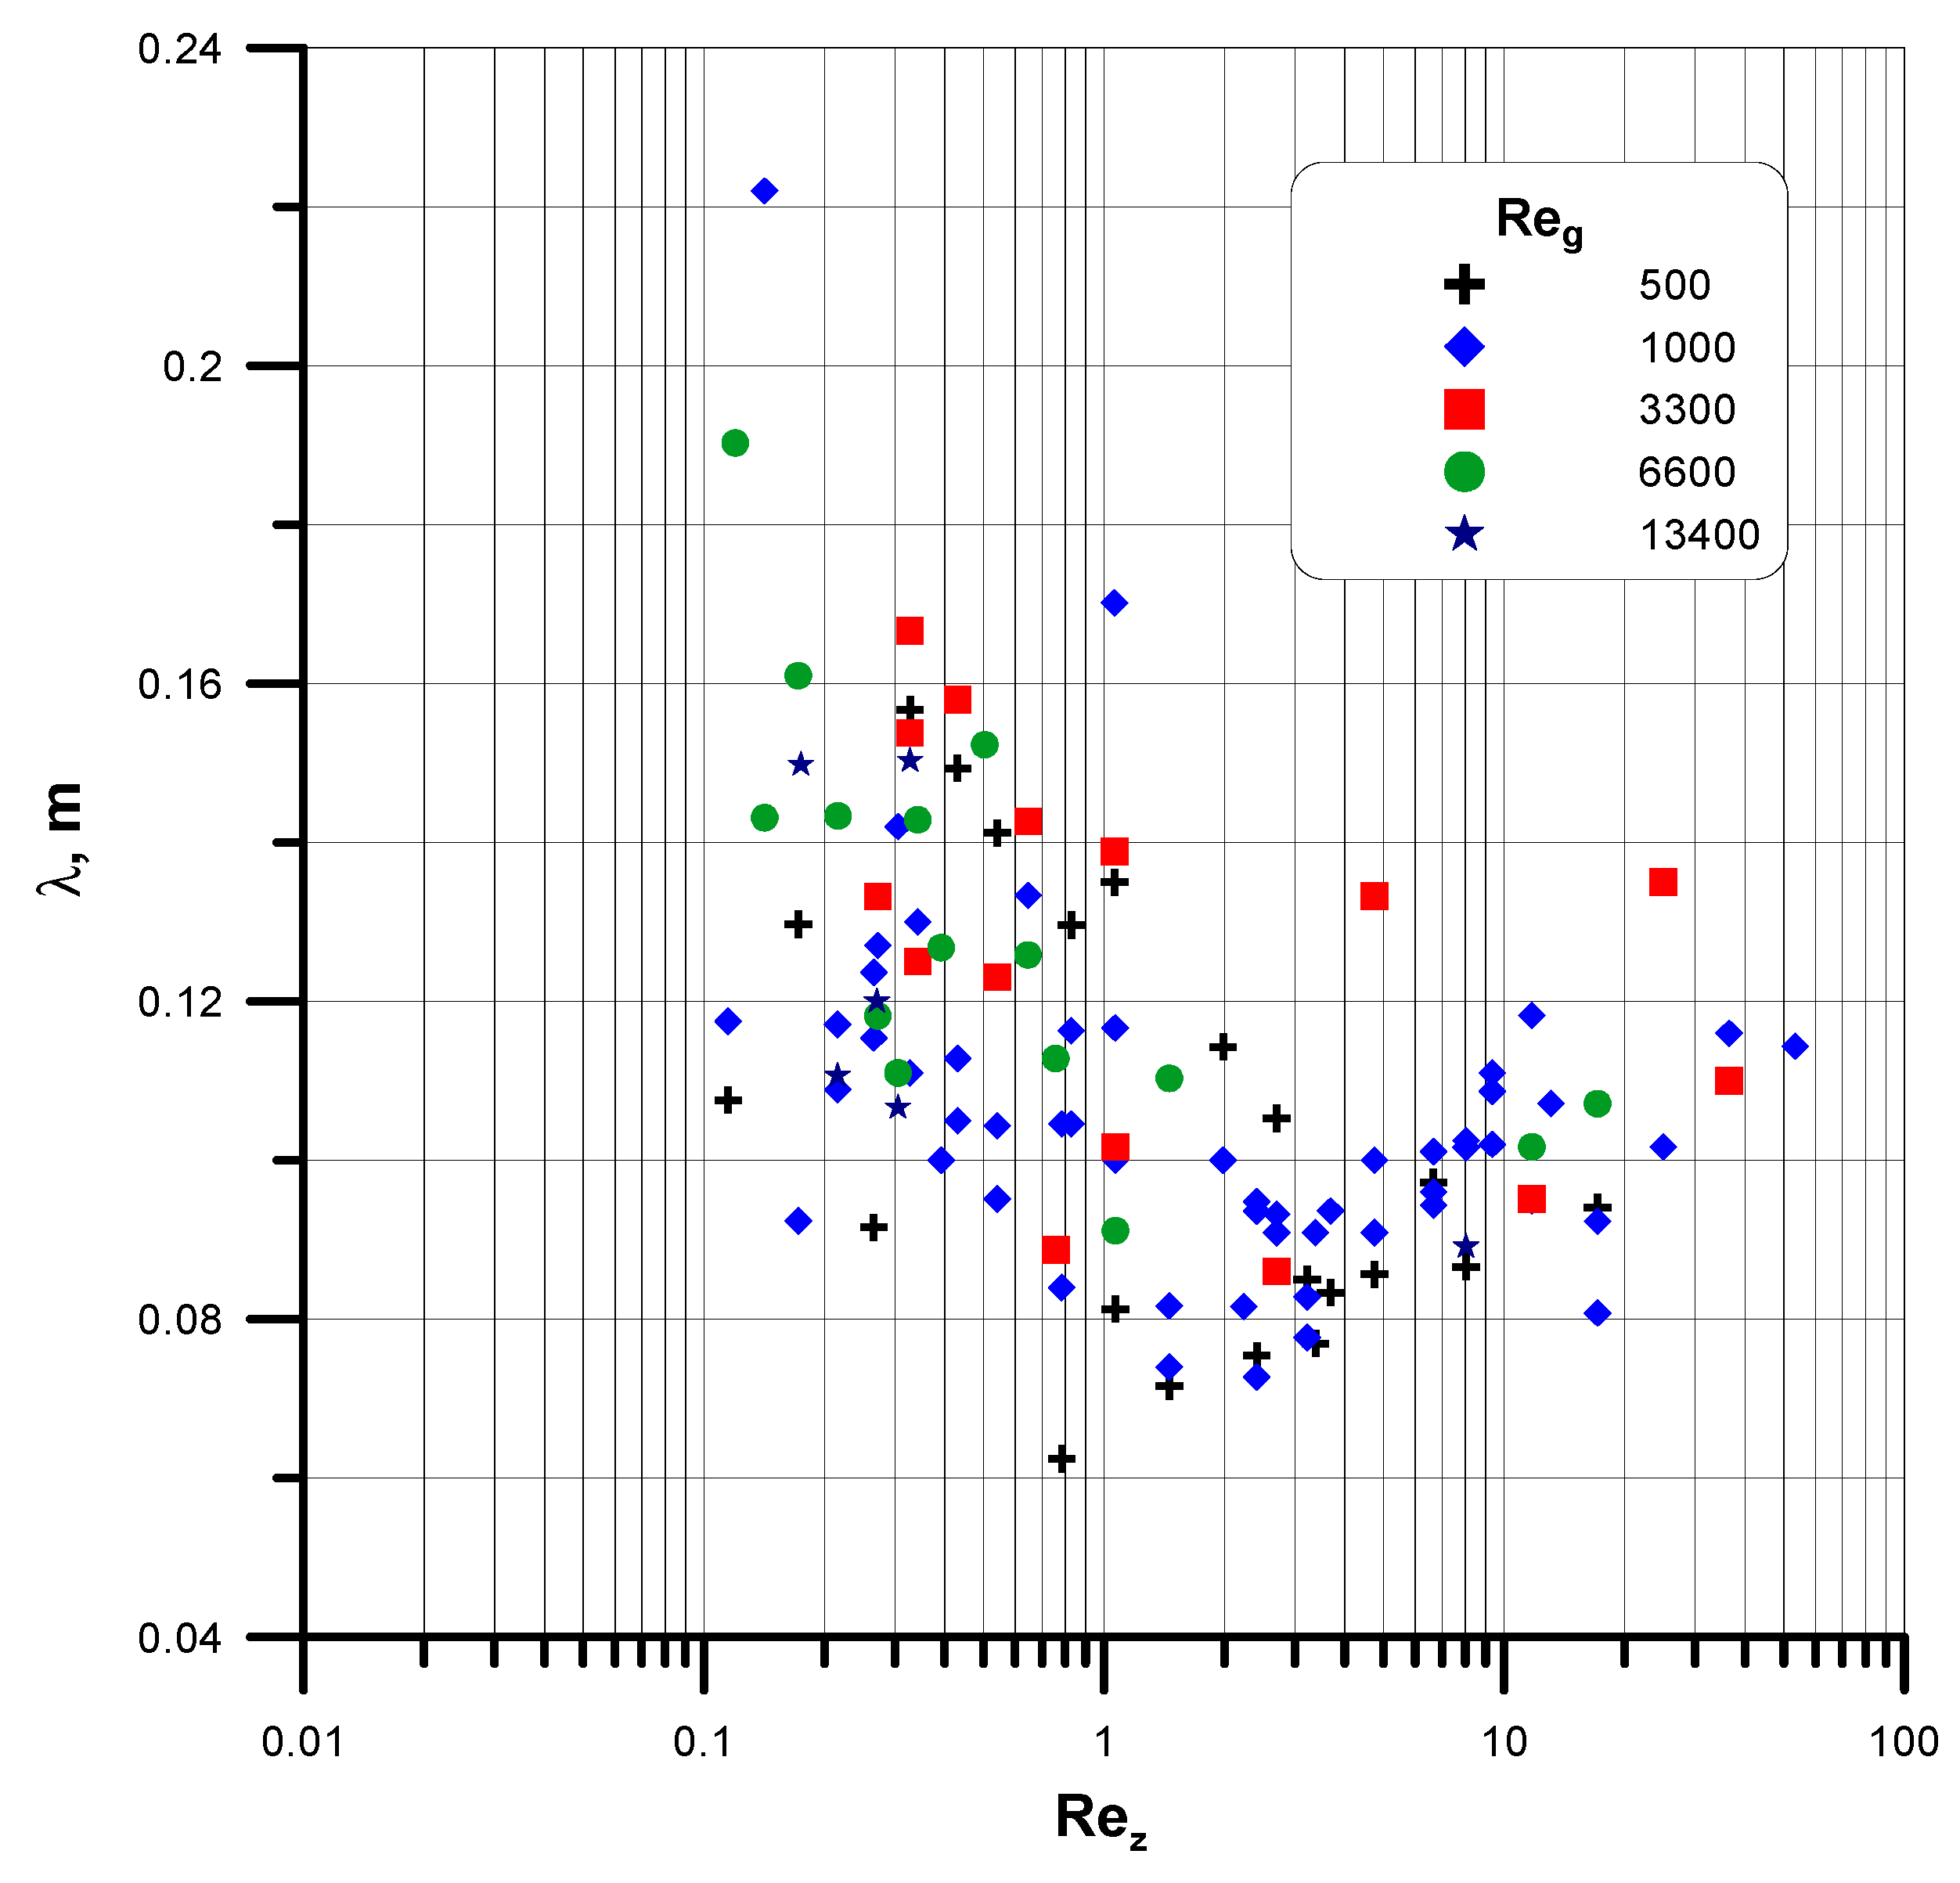
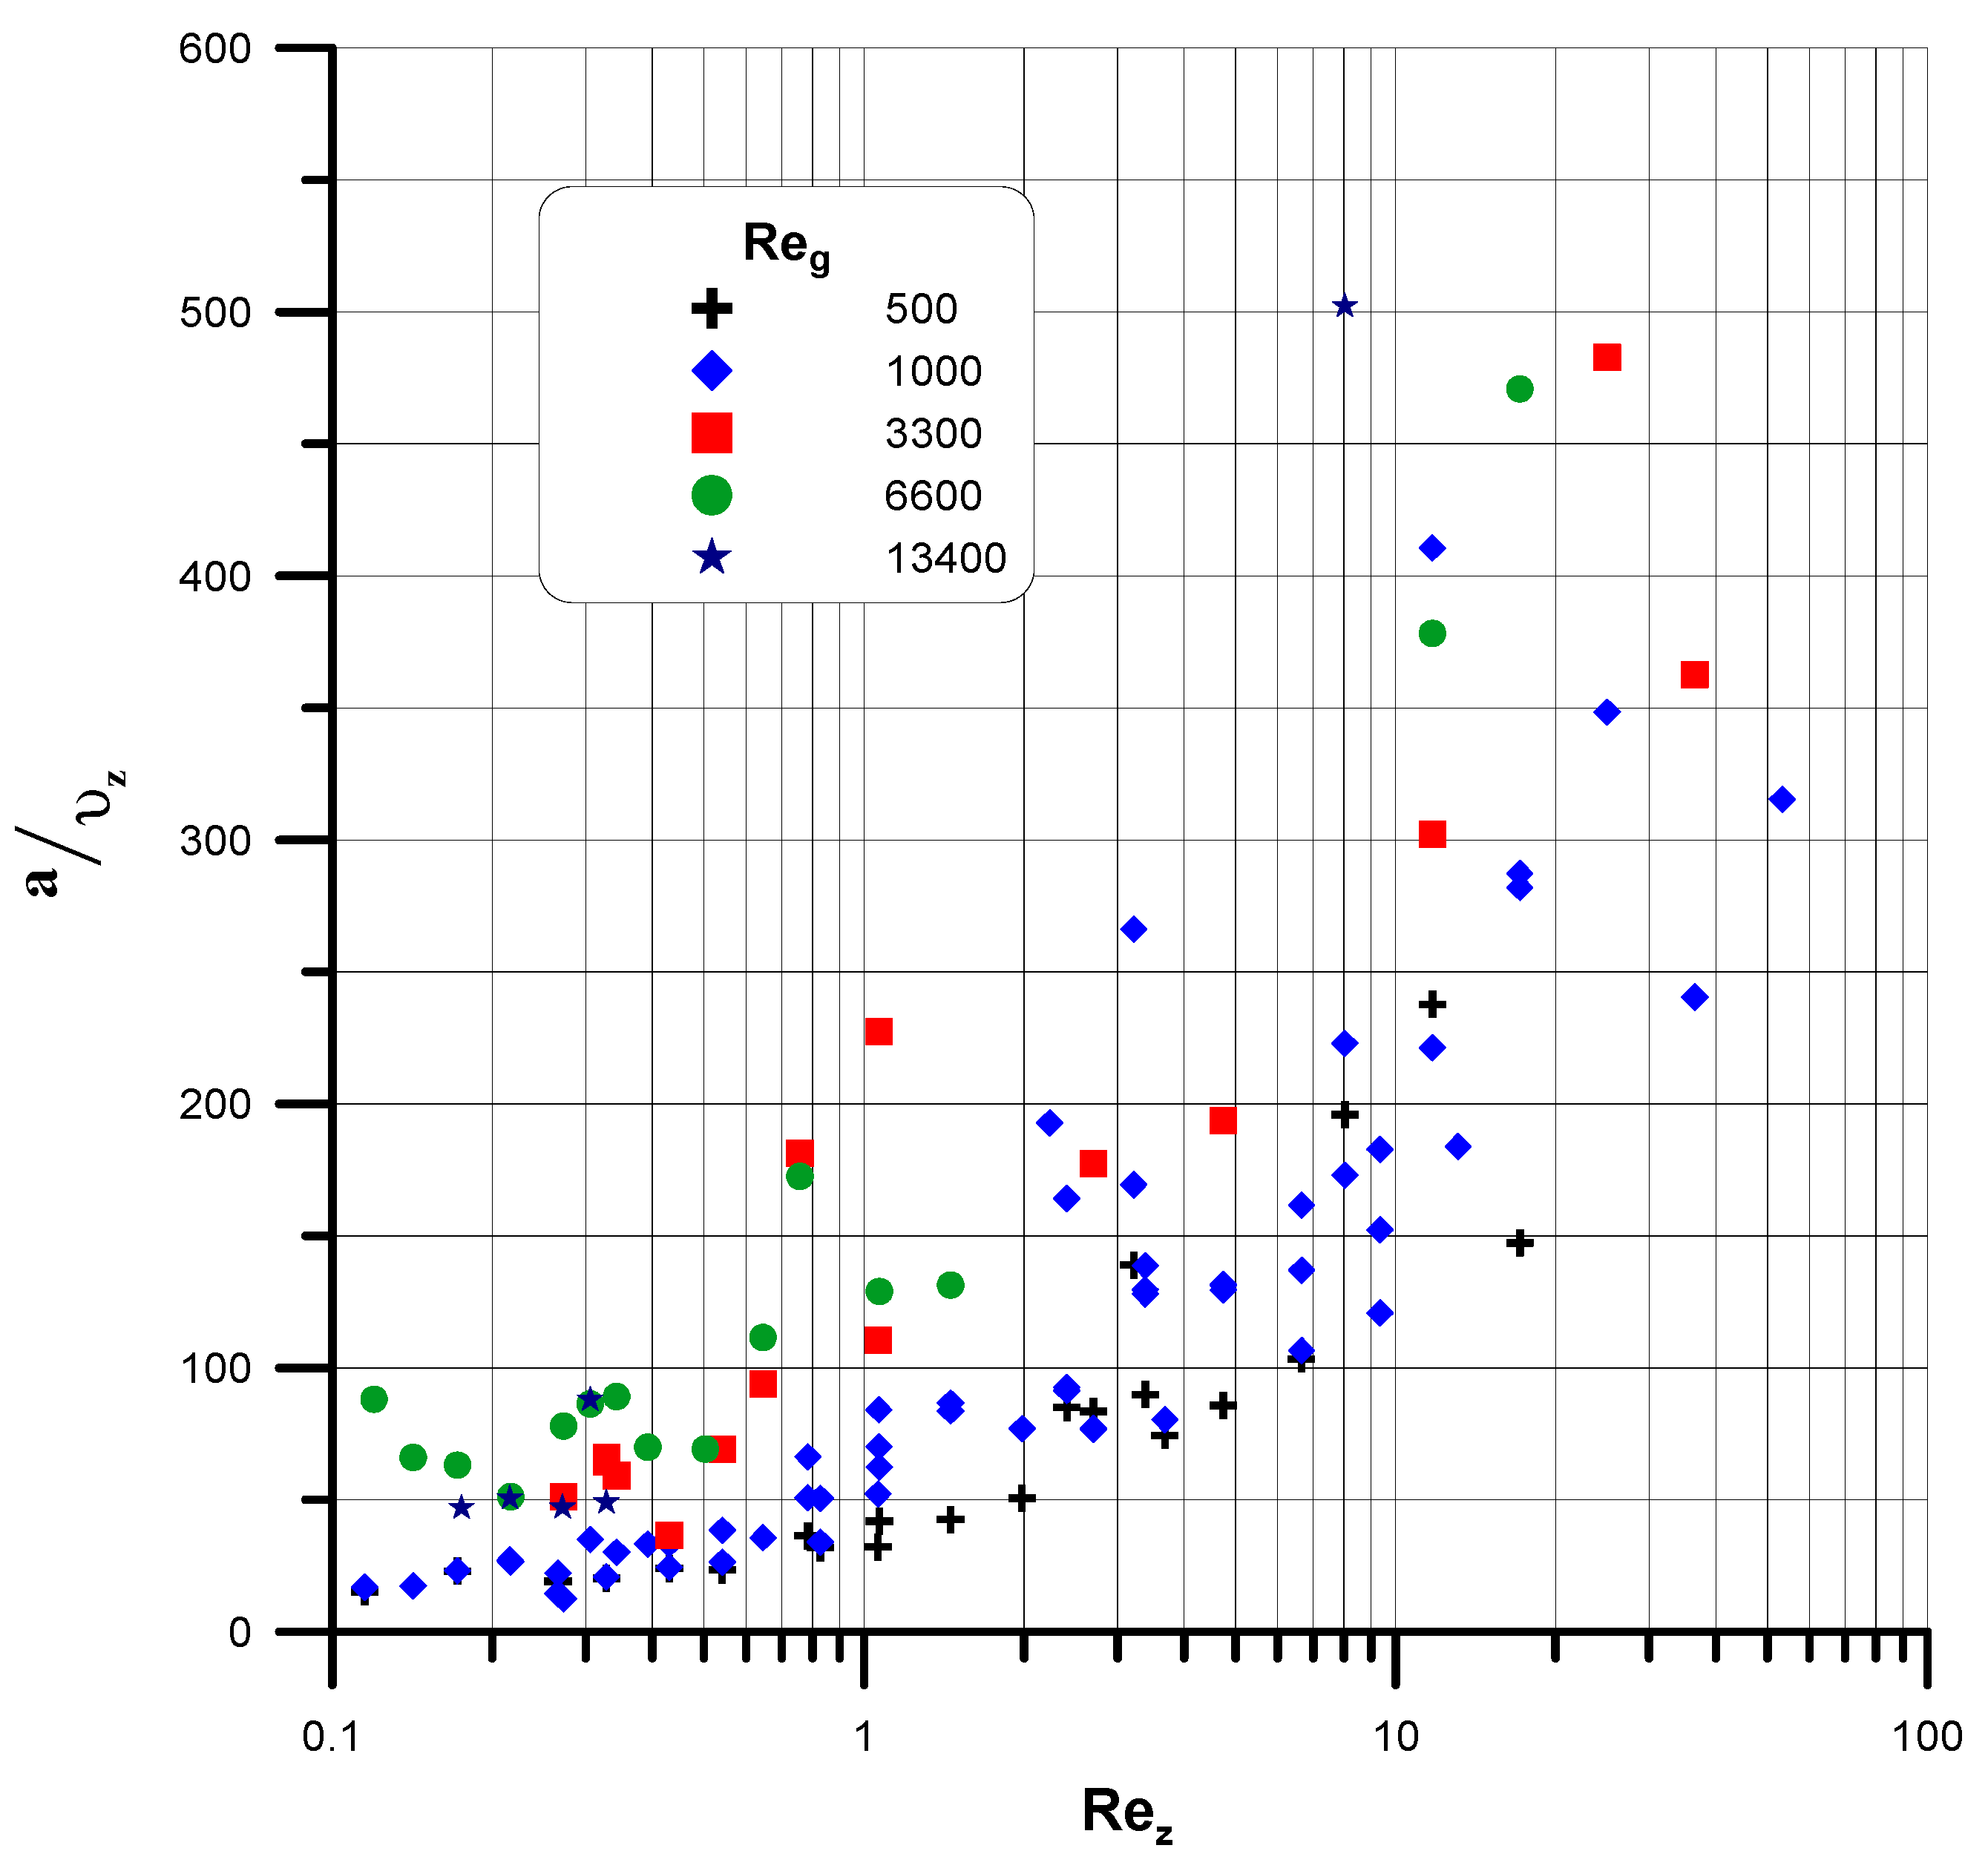
3.1. Liquid Film Thickness
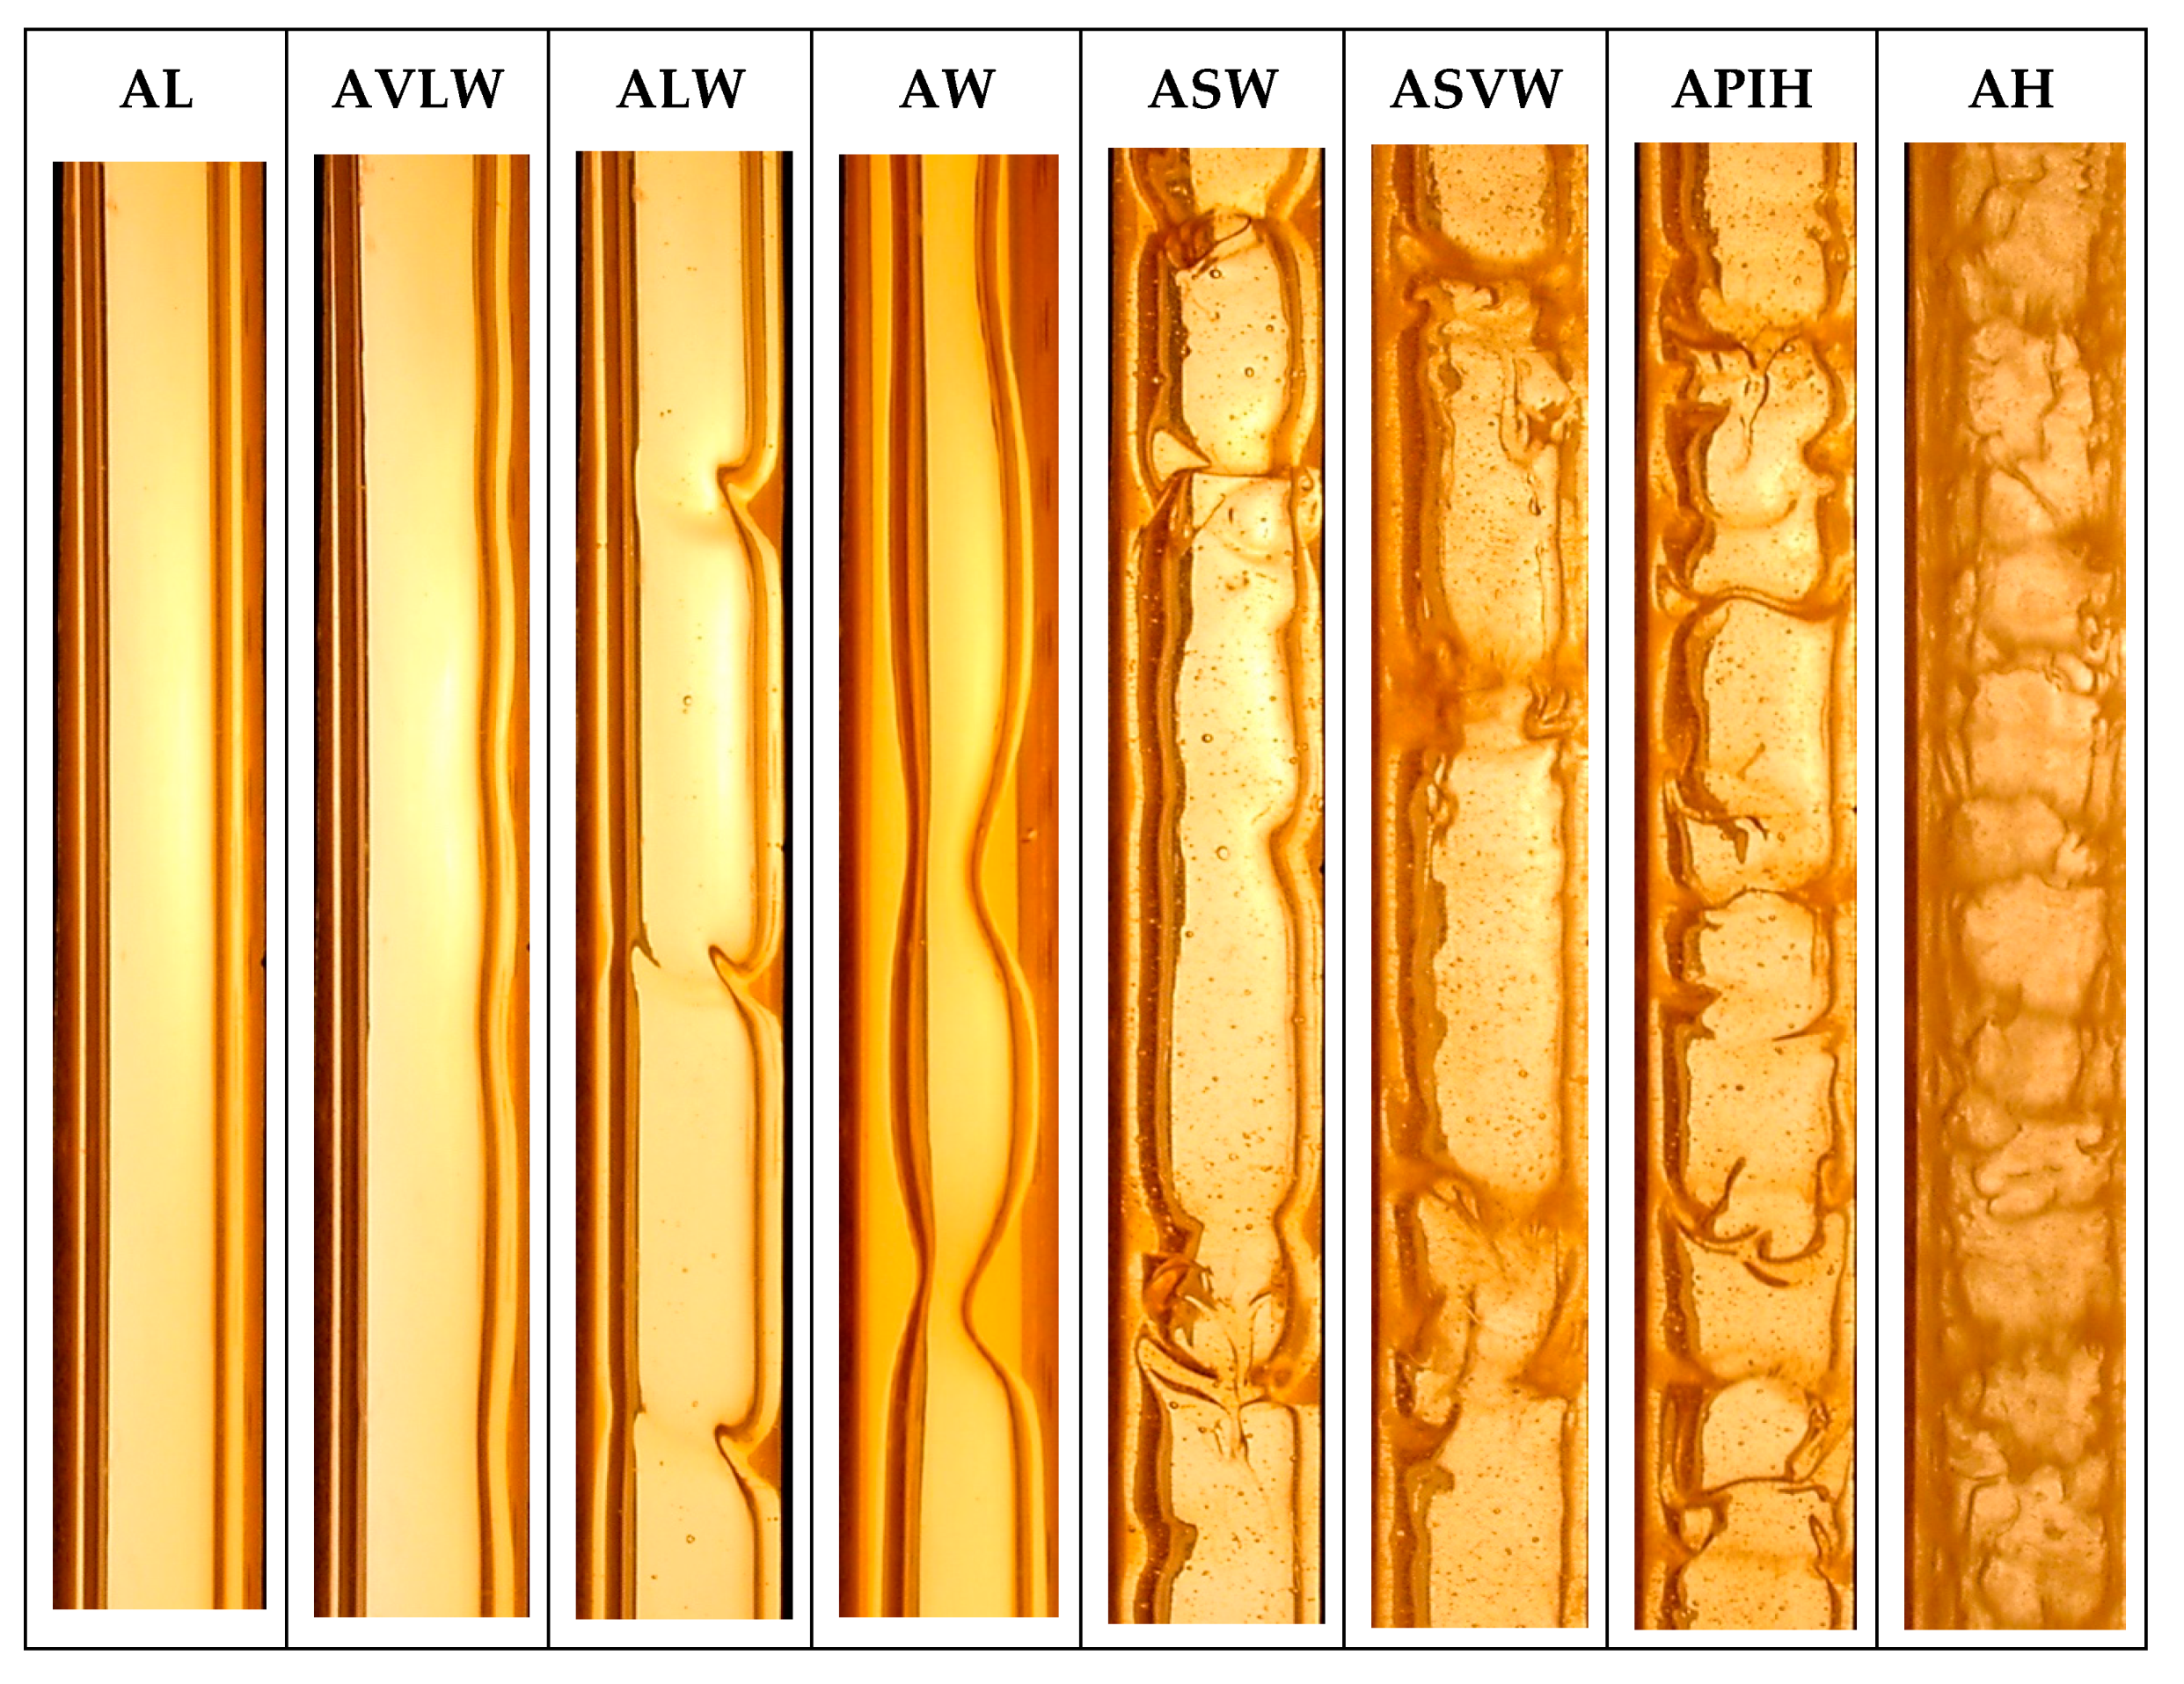
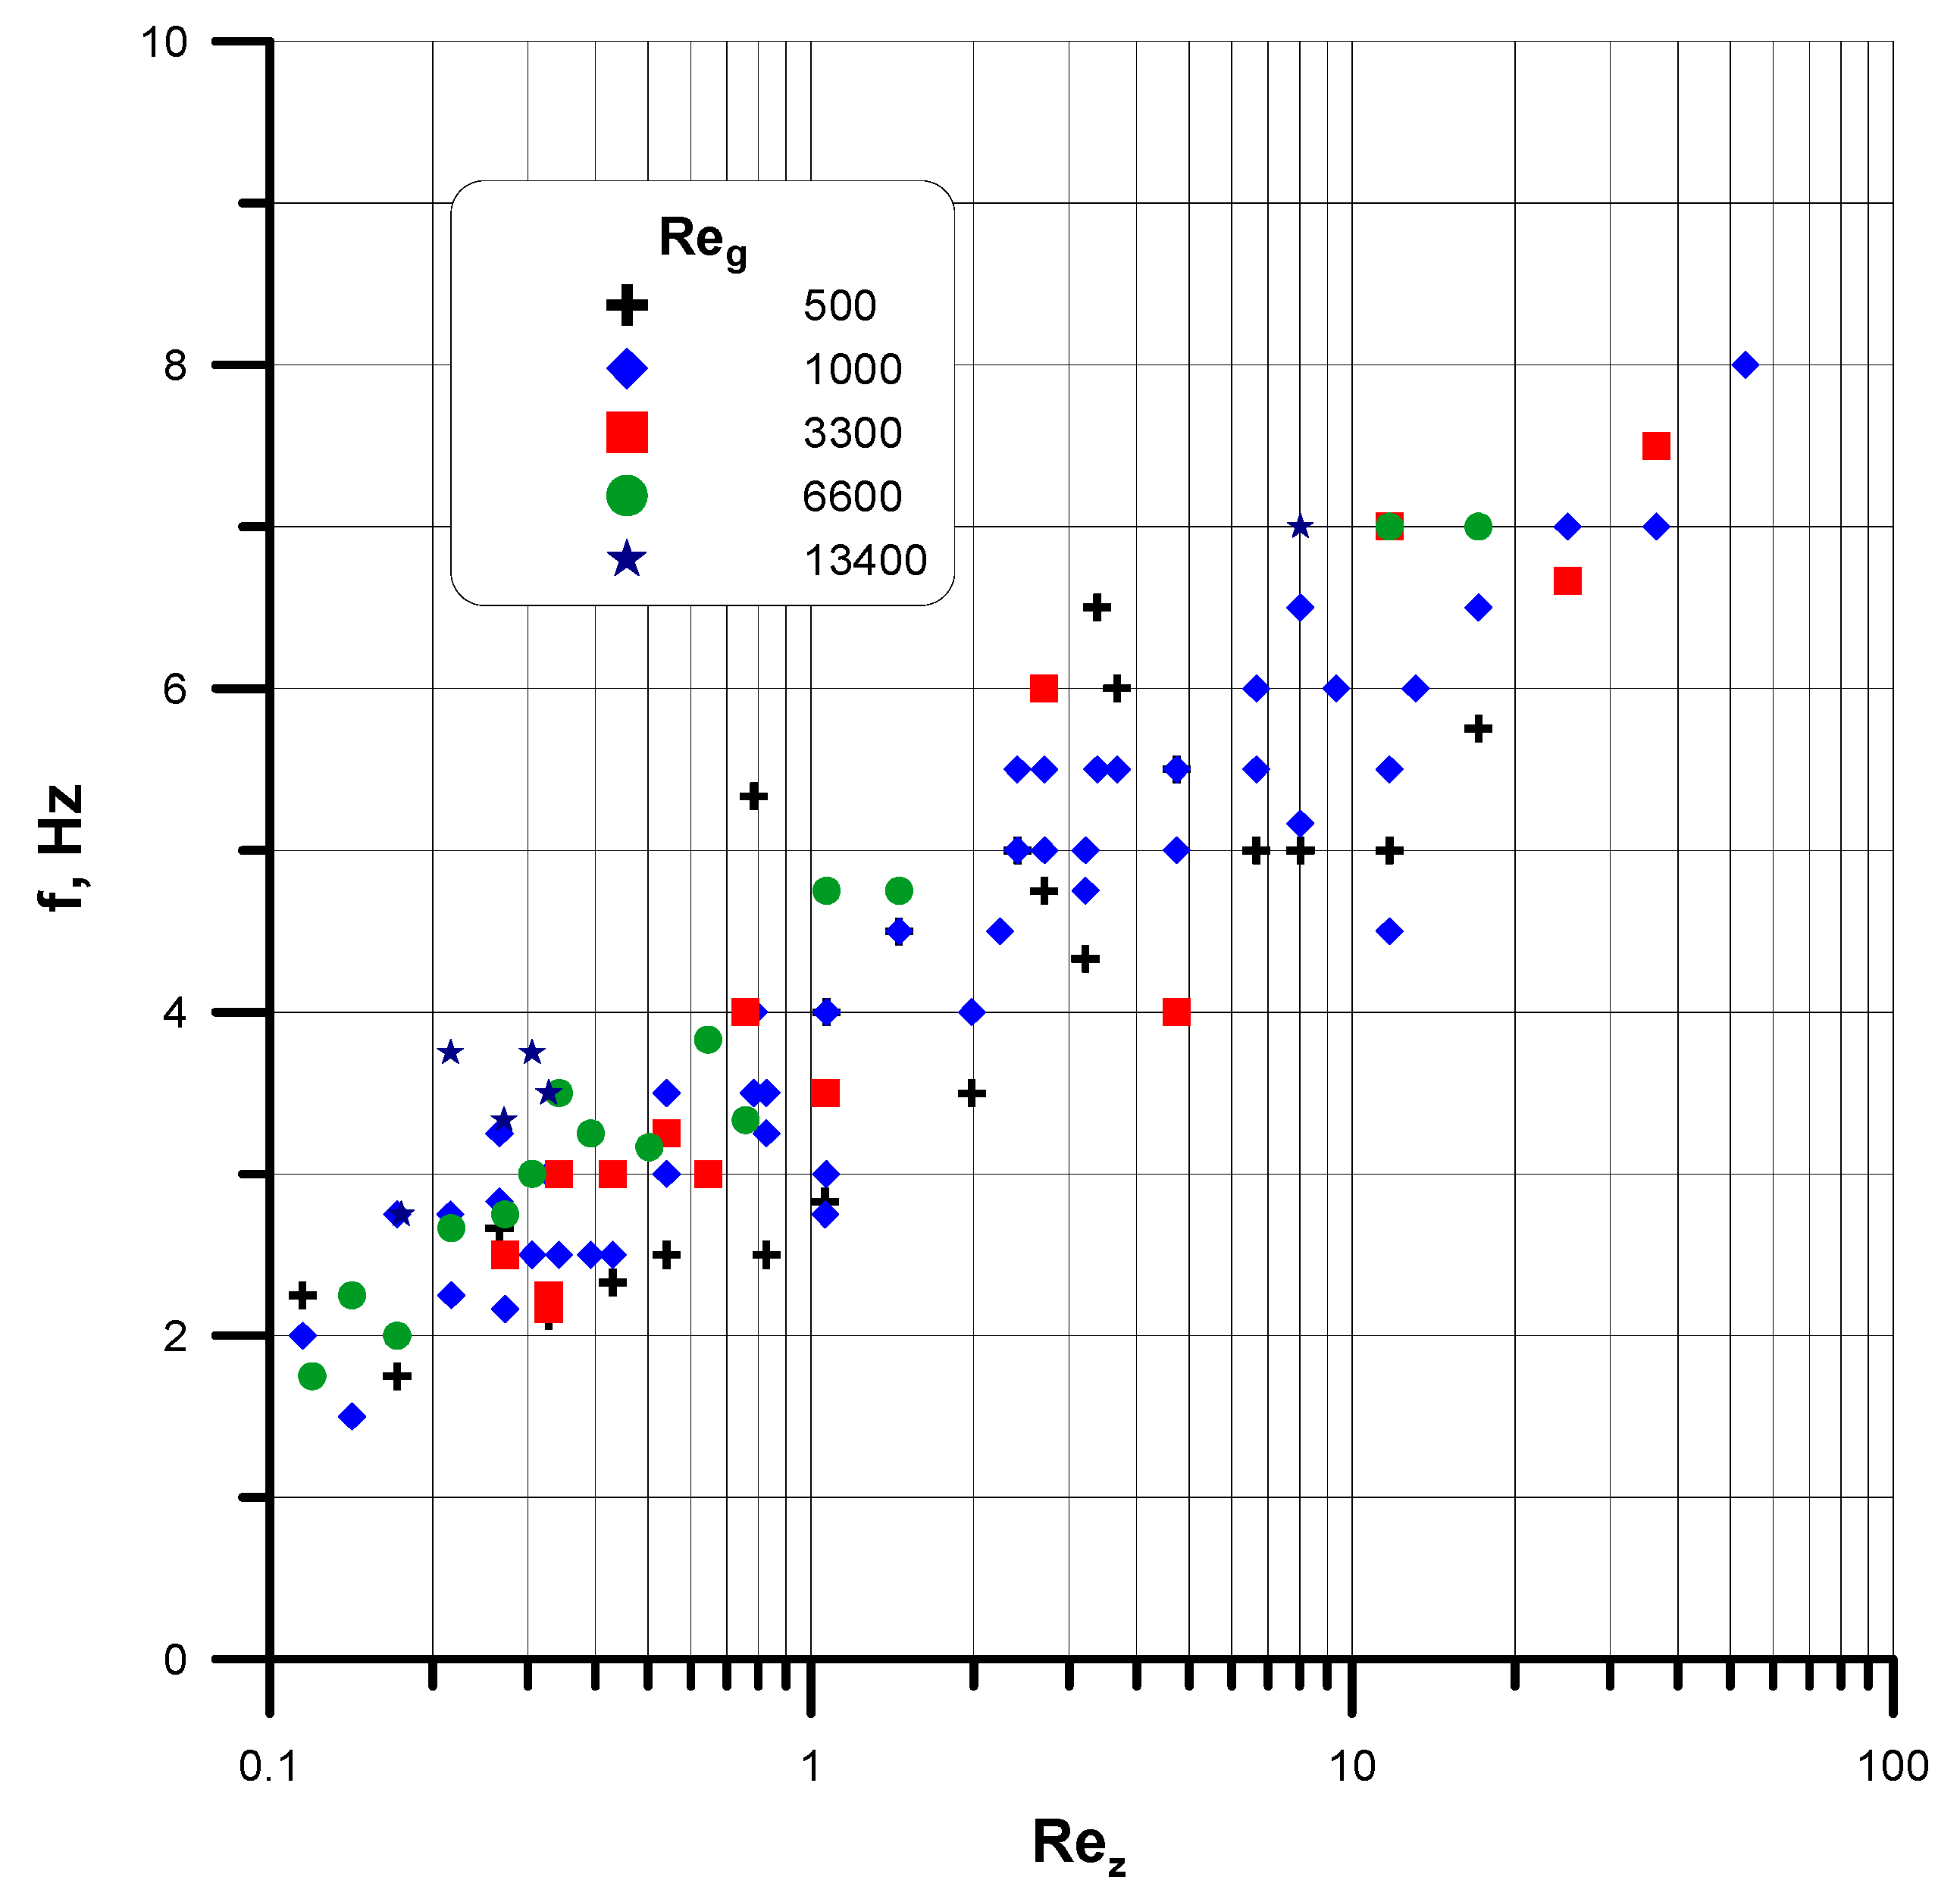
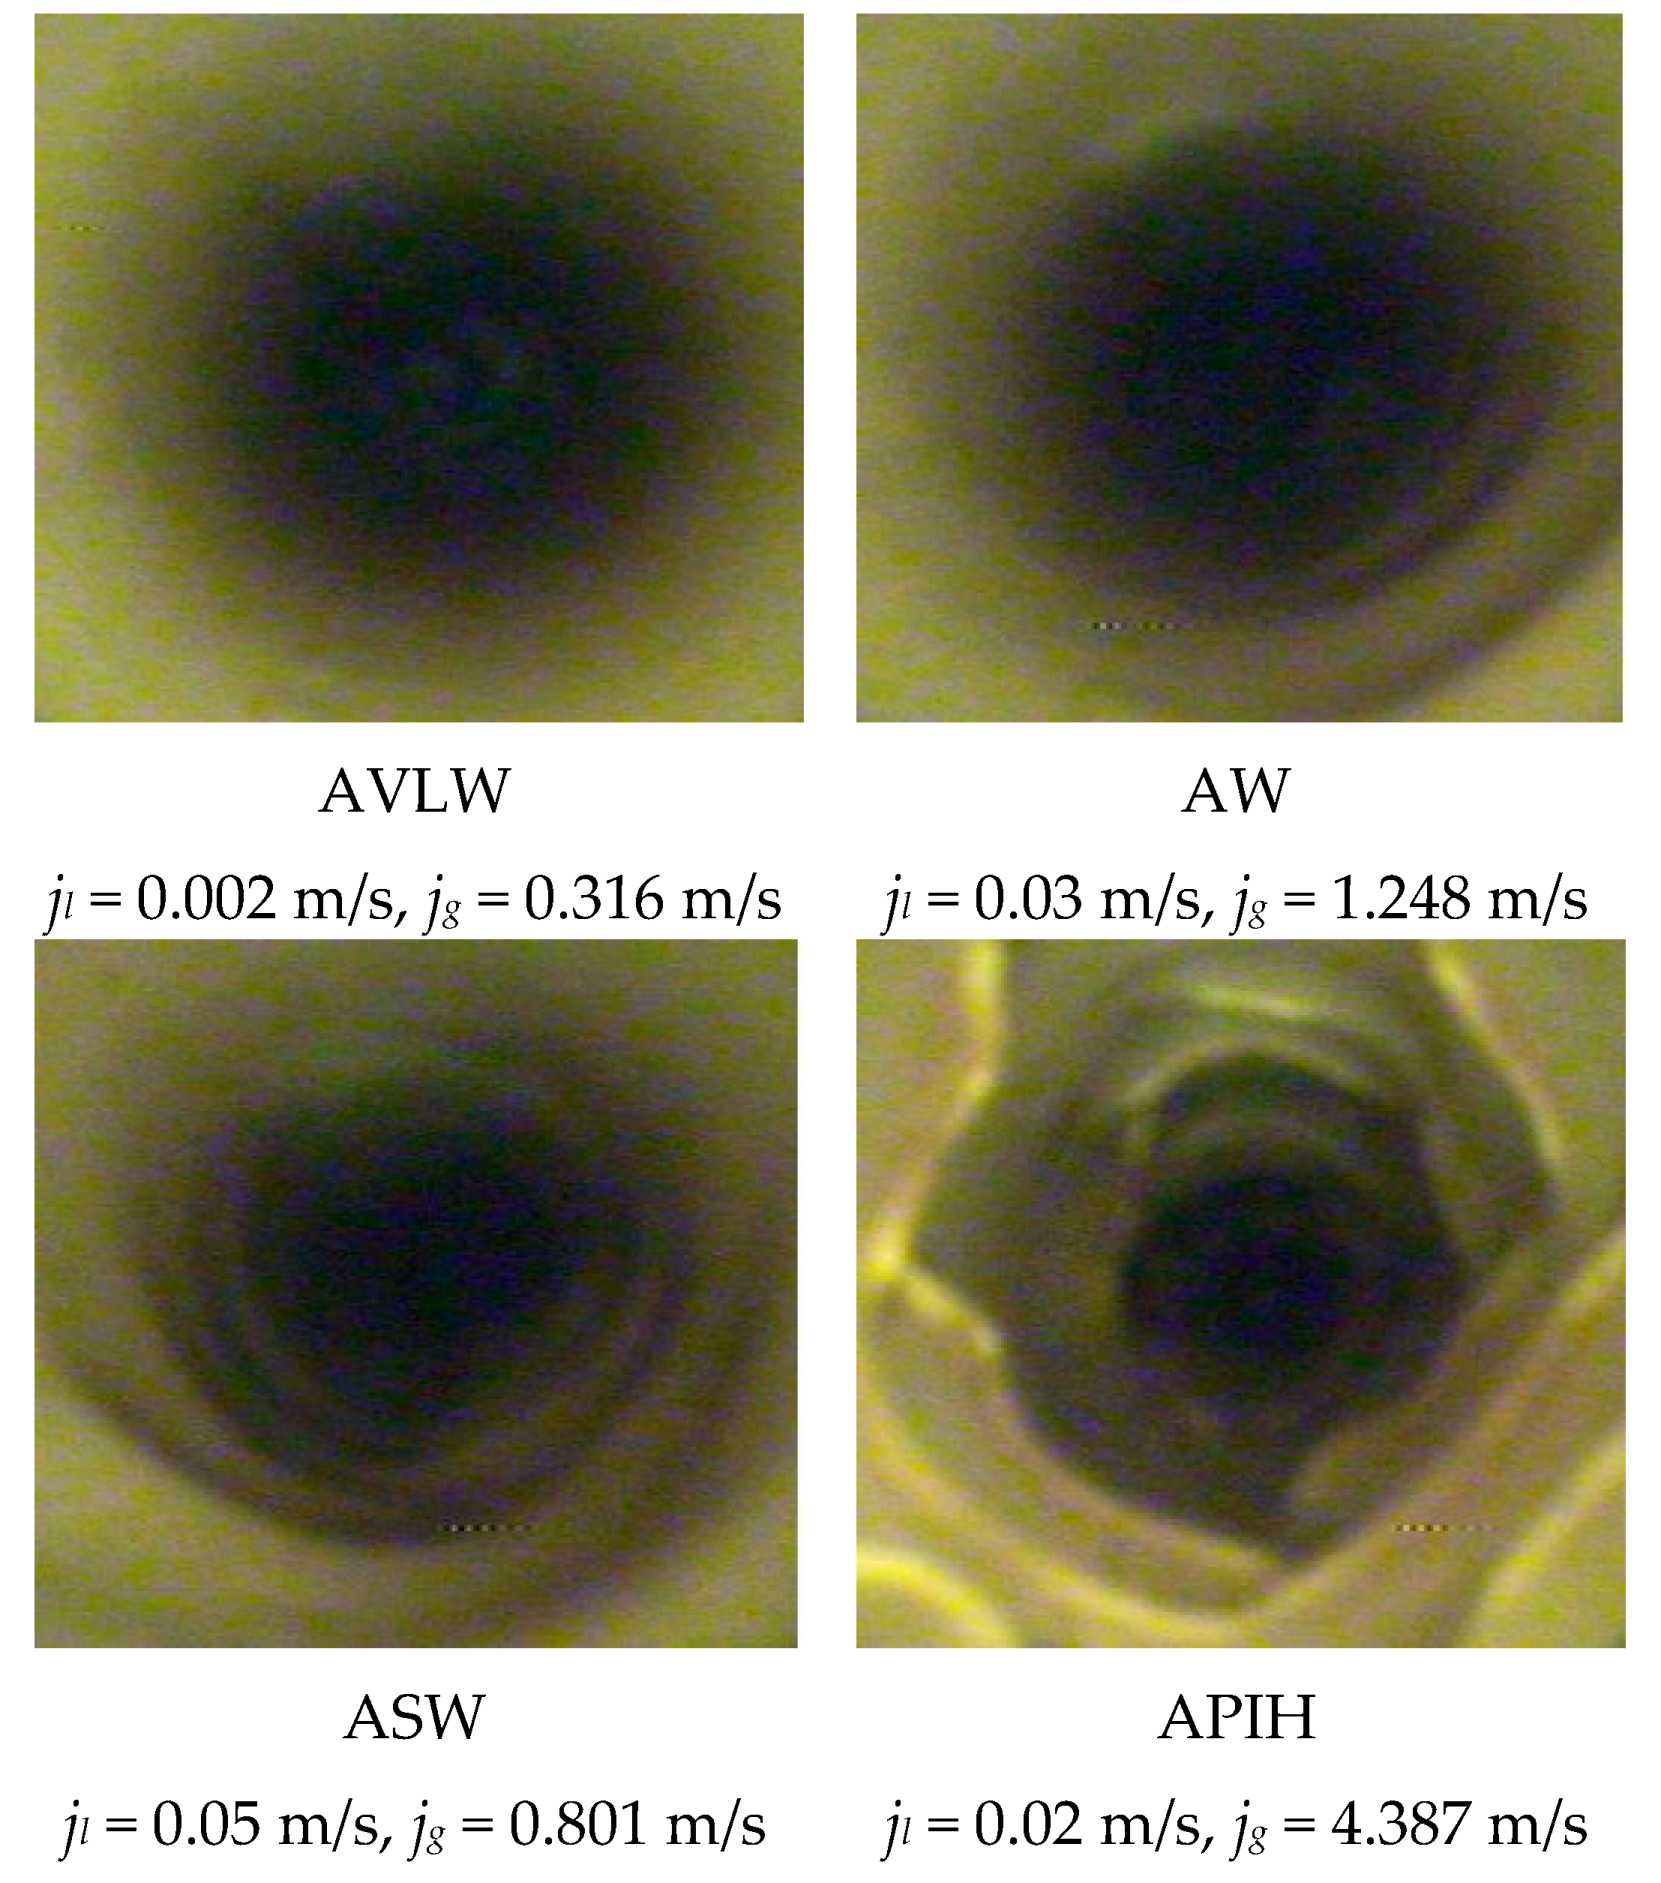
After the parameters of the phases, relative to the logarithmic mean of the inlet and outlet values, were stabilized for the general flow conditions with heat exchange (i.e., heating, cooling) and depending on the logarithmic mean of the inlet and outlet parameters, an attempt was made to express the mean film thickness of the liquid in a quantitative manner. The results derived from a comparison of the adiabatic state were helpful in this regard; that is, those that were the case for the pipe in which the parameters were determined in the same way (i.e., by using the volumetric trap method).
The quantitative description initially referred to the conditions of gravitational run-off; that is, by application of the conditions that are normally followed in the literature. The film thickness (s) resulting from the two-phase oil-air flow in such a case can be expressed in relation to its equivalent in the conditions of such runoff (so). Hence,
s s 0 = f ( Re g Re z ) .
Development of the relations for gravitational run-off formed the basis for determining the effect of the gas flow rates on variations in the thickness of the flowing liquid film during two-phase flow. The analytical interpretation of this relation confirmed the authors belief—that its characteristics largely depend on both parameters characterizing the dynamics of two-phase flow parameters (Rez, Reg). As a result, it was possible to develop this relation in the form of a function:
s s 0 = 1 1 + CRe z n 1 Re g n 2 ,
which, in the case of the decay of gas flow (i.e., for Reg = 0), leads to s = so, accompanied by the value of film thickness resulting from the expression found in the denominator of this function. Confirmation of the feasibility of the developed relation was based on its graphical interpretation, as confirmed by Figure 2 for examples of measurement data derived from experiments. A dashed line was used to determine the values resulting from Equation (3).
In relation to the gravitational run-off, the liquid film thickness recorded during the two-phase gas-liquid flow is always smaller, regardless of the conditions accompanying this type of flow in a channel. Undoubtedly, the presence of the core gas stream in the annular flow contributes to this, as the dynamics accompanying the formation of this pattern lead to the decrease of liquid film thickness in the two-phase gas–liquid flow.
Comparative and statistical calculations performed for this purpose led to a consequent quantitative description of the relations in Equation (2), in which the correlation is given by the equation:
s s 0 = 1 1 + 5.68 · 10 3 Re z 0.132 Re g 0.471
with the liquid film thickness, s0, which should be calculated from the relation:
s 0 ϑ z = 0.8252 Re z 0 , 516 ,    for   Re z < 2
s 0 ϑ z = 0.9335 Re z 0 , 334 ,    for   Re z > 2 ,
where ϑ z = ( η l 2 g ρ l 2 ) 1 / 3 , Re z = 4 Γ η l , Γ = m l π d and Re g = j g d ρ g η g .
Equation (3) is based on the experimental data presented, inter alia, in Figure 2, which shows the sample measurement series. Equations (4) and (5) describe the change in the thickness of the liquid film for its run-off in a vertical pipe. Their form is typical of this kind of flow.
A correlation of this equation was performed, with regard to both adiabatic conditions and the ones in which heat exchange occurs within the range of the viscosity coefficient equal to ηl = 0.046–3.5 Pas, which is in the range of the Reynolds number Rez. It was demonstrated, by the results of the comparative analysis, that the resulting equation could also be used to assess the liquid film thickness in pipes of various diameters, for which the measurements were performed (i.e., 12.5, 22 and 30 mm).
Considering the fact that the quantification of runoff conditions in actual systems is ambiguous—as has often been emphasized in the literature of the subject—further analysis relating to the assessment of film thickness focused on the development of a dependence that can be applied as a comprehensive analytical tool.

3.2. Flow Patterns

The possibility of the occurrences of various characteristics of annular flows was assessed in order to conduct a more detailed analysis involving them. After the initial tests were applied to determine the lower boundary corresponding to the formation of the annular flow, detailed research into this flow pattern was conducted.
The resulting diversity of annular flows registered during measurements is presented visually in Figure 3. The names applied in the description play purely qualitative roles and were applied to assess the characteristics of the forming liquid films.
As can be seen from the images, the liquid film flow characteristics were very diverse. For low velocity liquids and within relatively large ranges of gas velocities, the most common pattern involved the flow of a smooth film. The size and nature of the resulting waves of varying amplitude and frequency depend mainly on the flow and viscosity of the liquid and on the velocity of the gas phase. This is particularly evident in the case of very wavy (ASW) and strong wavy (AVSW) structures, where the classification is determined by the amplitude and frequency of oil wave displacement.
The results of the experiments clearly indicate that, in the heat exchange process carried out under the conditions of very viscous gas-liquid flow can provide very beneficial outcomes, as this type of flow leads to relatively thin, yet stable, liquid film formation over the entire length of the tube in the thin-film apparatus.
Determination of the model characterizing the hydrodynamics of the two-phase gas-very viscous liquid flow serves two basic purposes, for which the following was adopted:
  • an indication of the most likely mechanisms accompanying this flow, taking into account the range of their occurrence; and
  • verification of the possible method for direct evaluation of the parameters applied in the model and the calculation methods adopted for its solution, through comparing the results of calculations with the results of the experimental tests.
In both cases, quantitative description of the phenomena associated with this flow require the distinction of mechanisms resulting from the flow hydrodynamics. In particular, the description had to account for such parameters as:
  • liquid film thickness, s (both locally and in terms of averaged values);
  • parameters identifying the nature of wave patterns, in particular:
    amplitudes of the waves, a and their wavelength, λ,
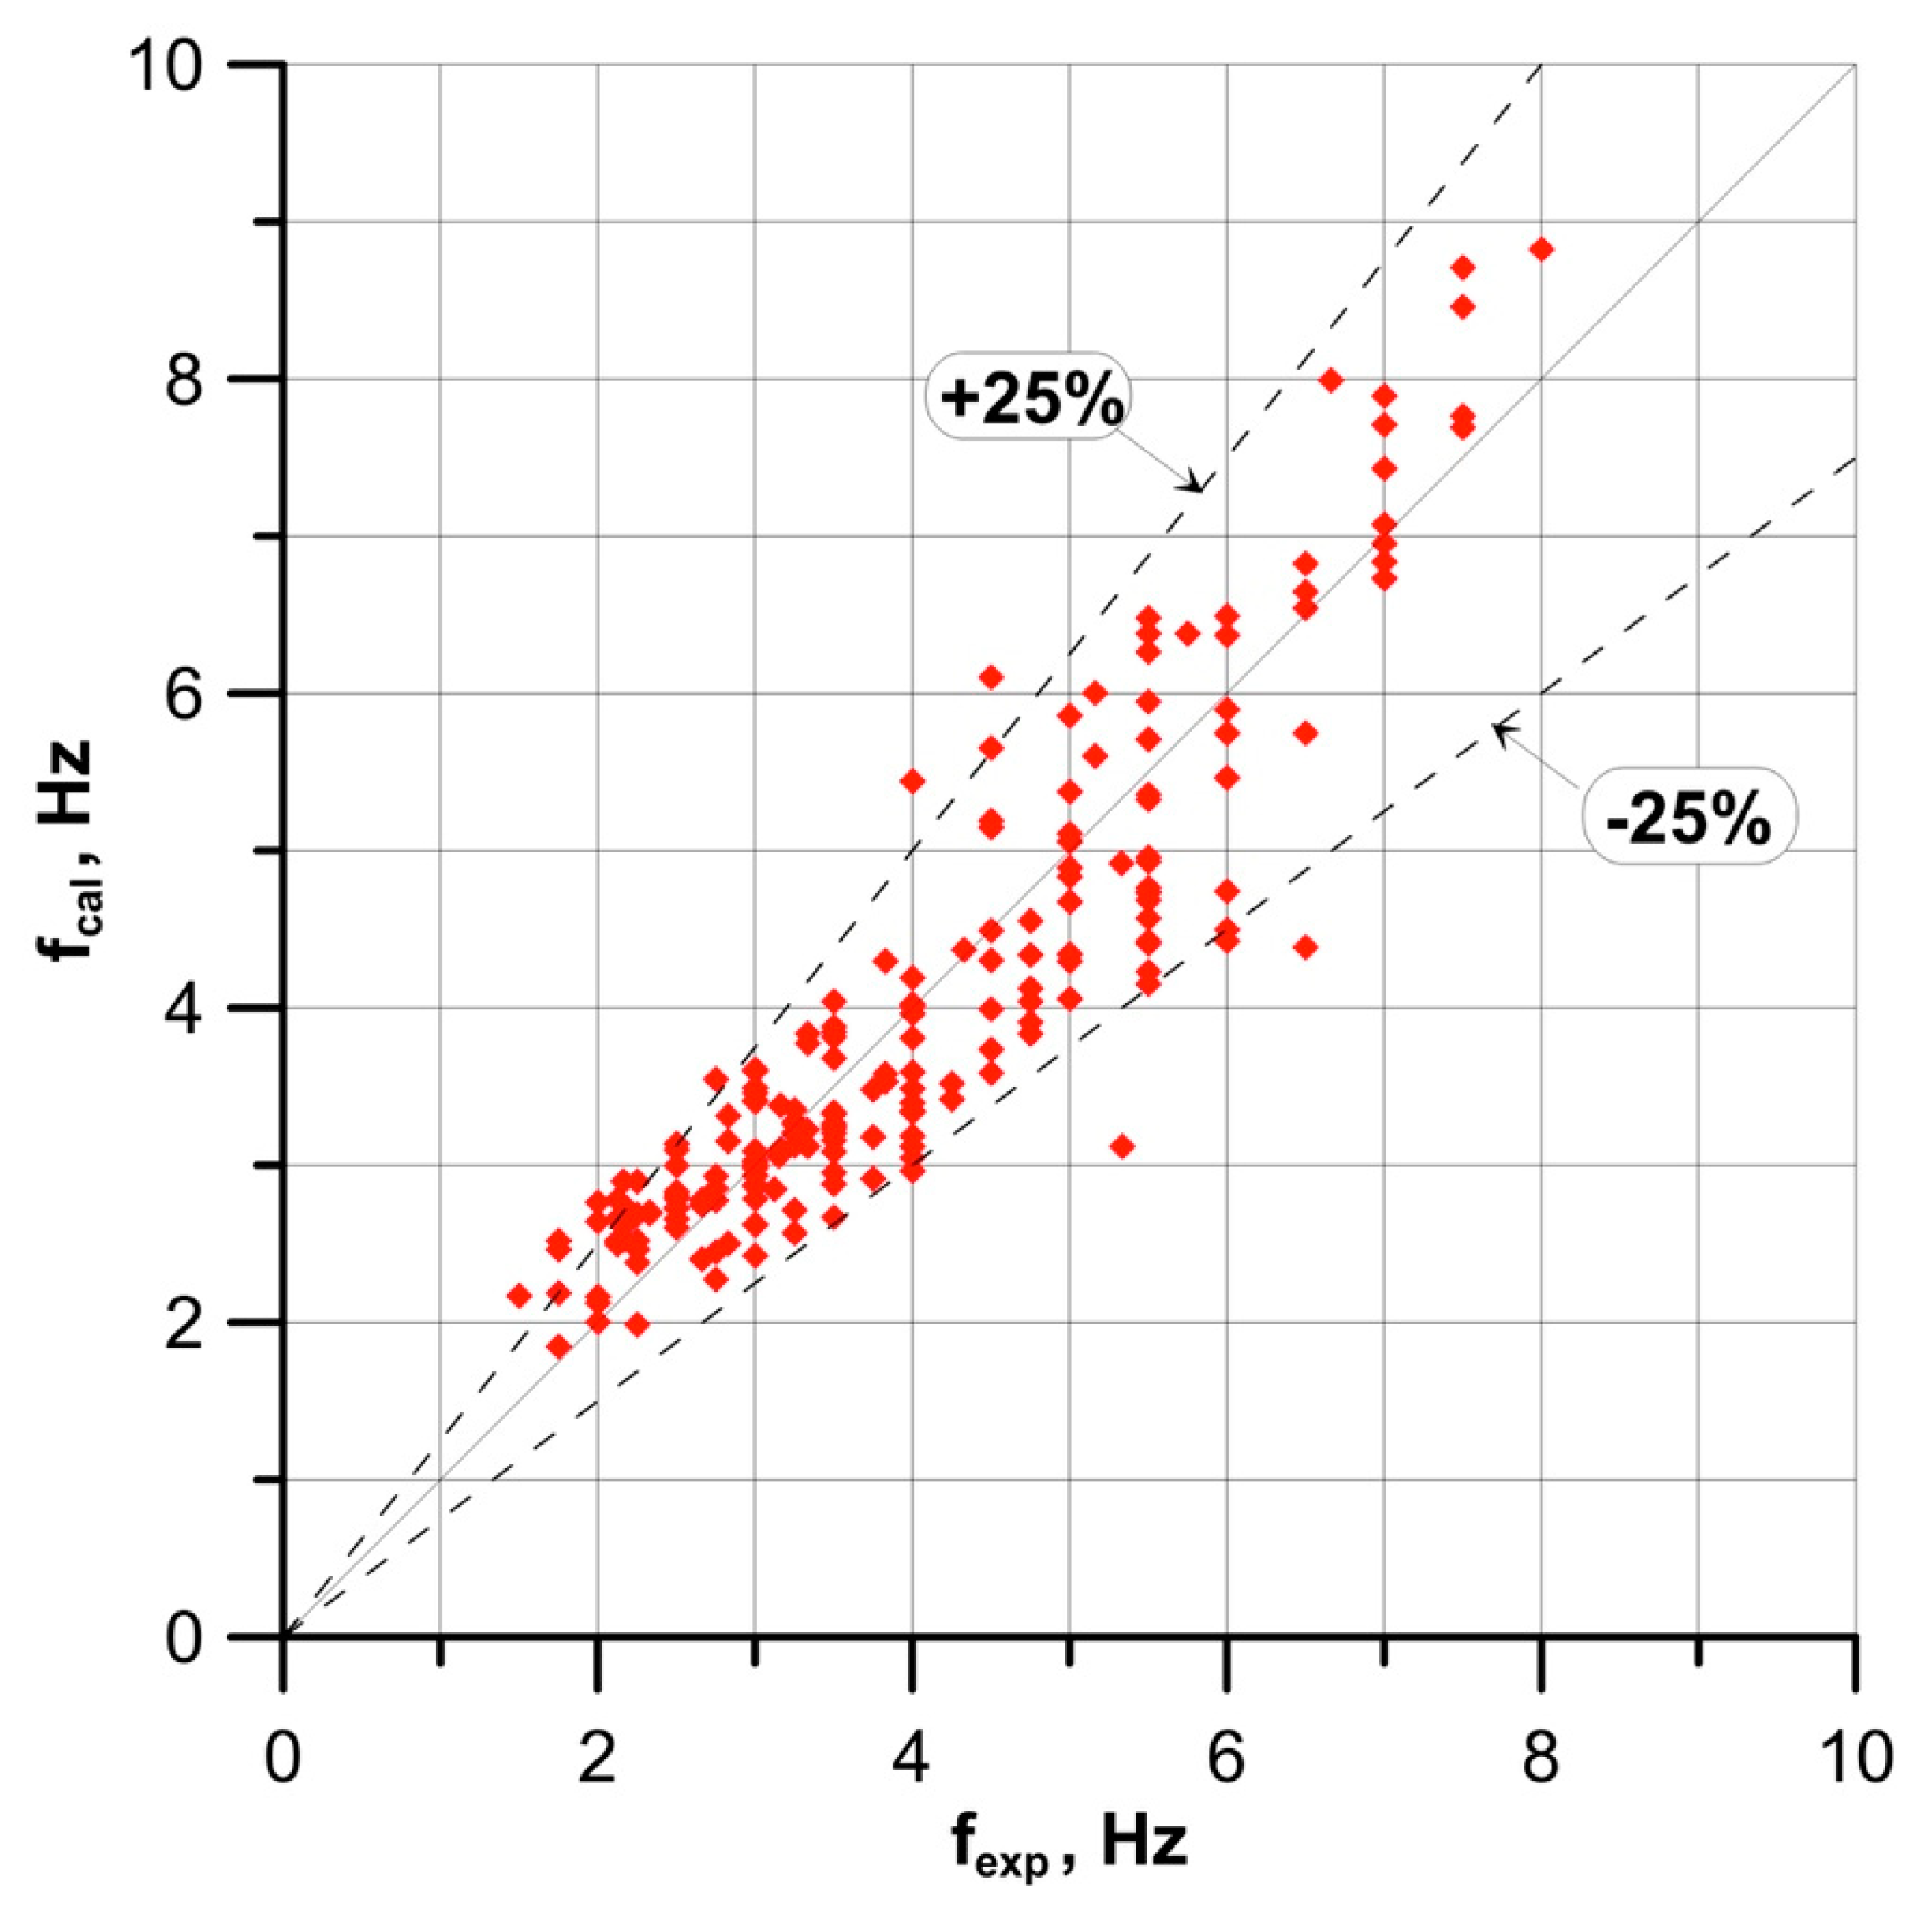
    frequencies of the occurrence of waves, f and the velocities of their propagation, c;
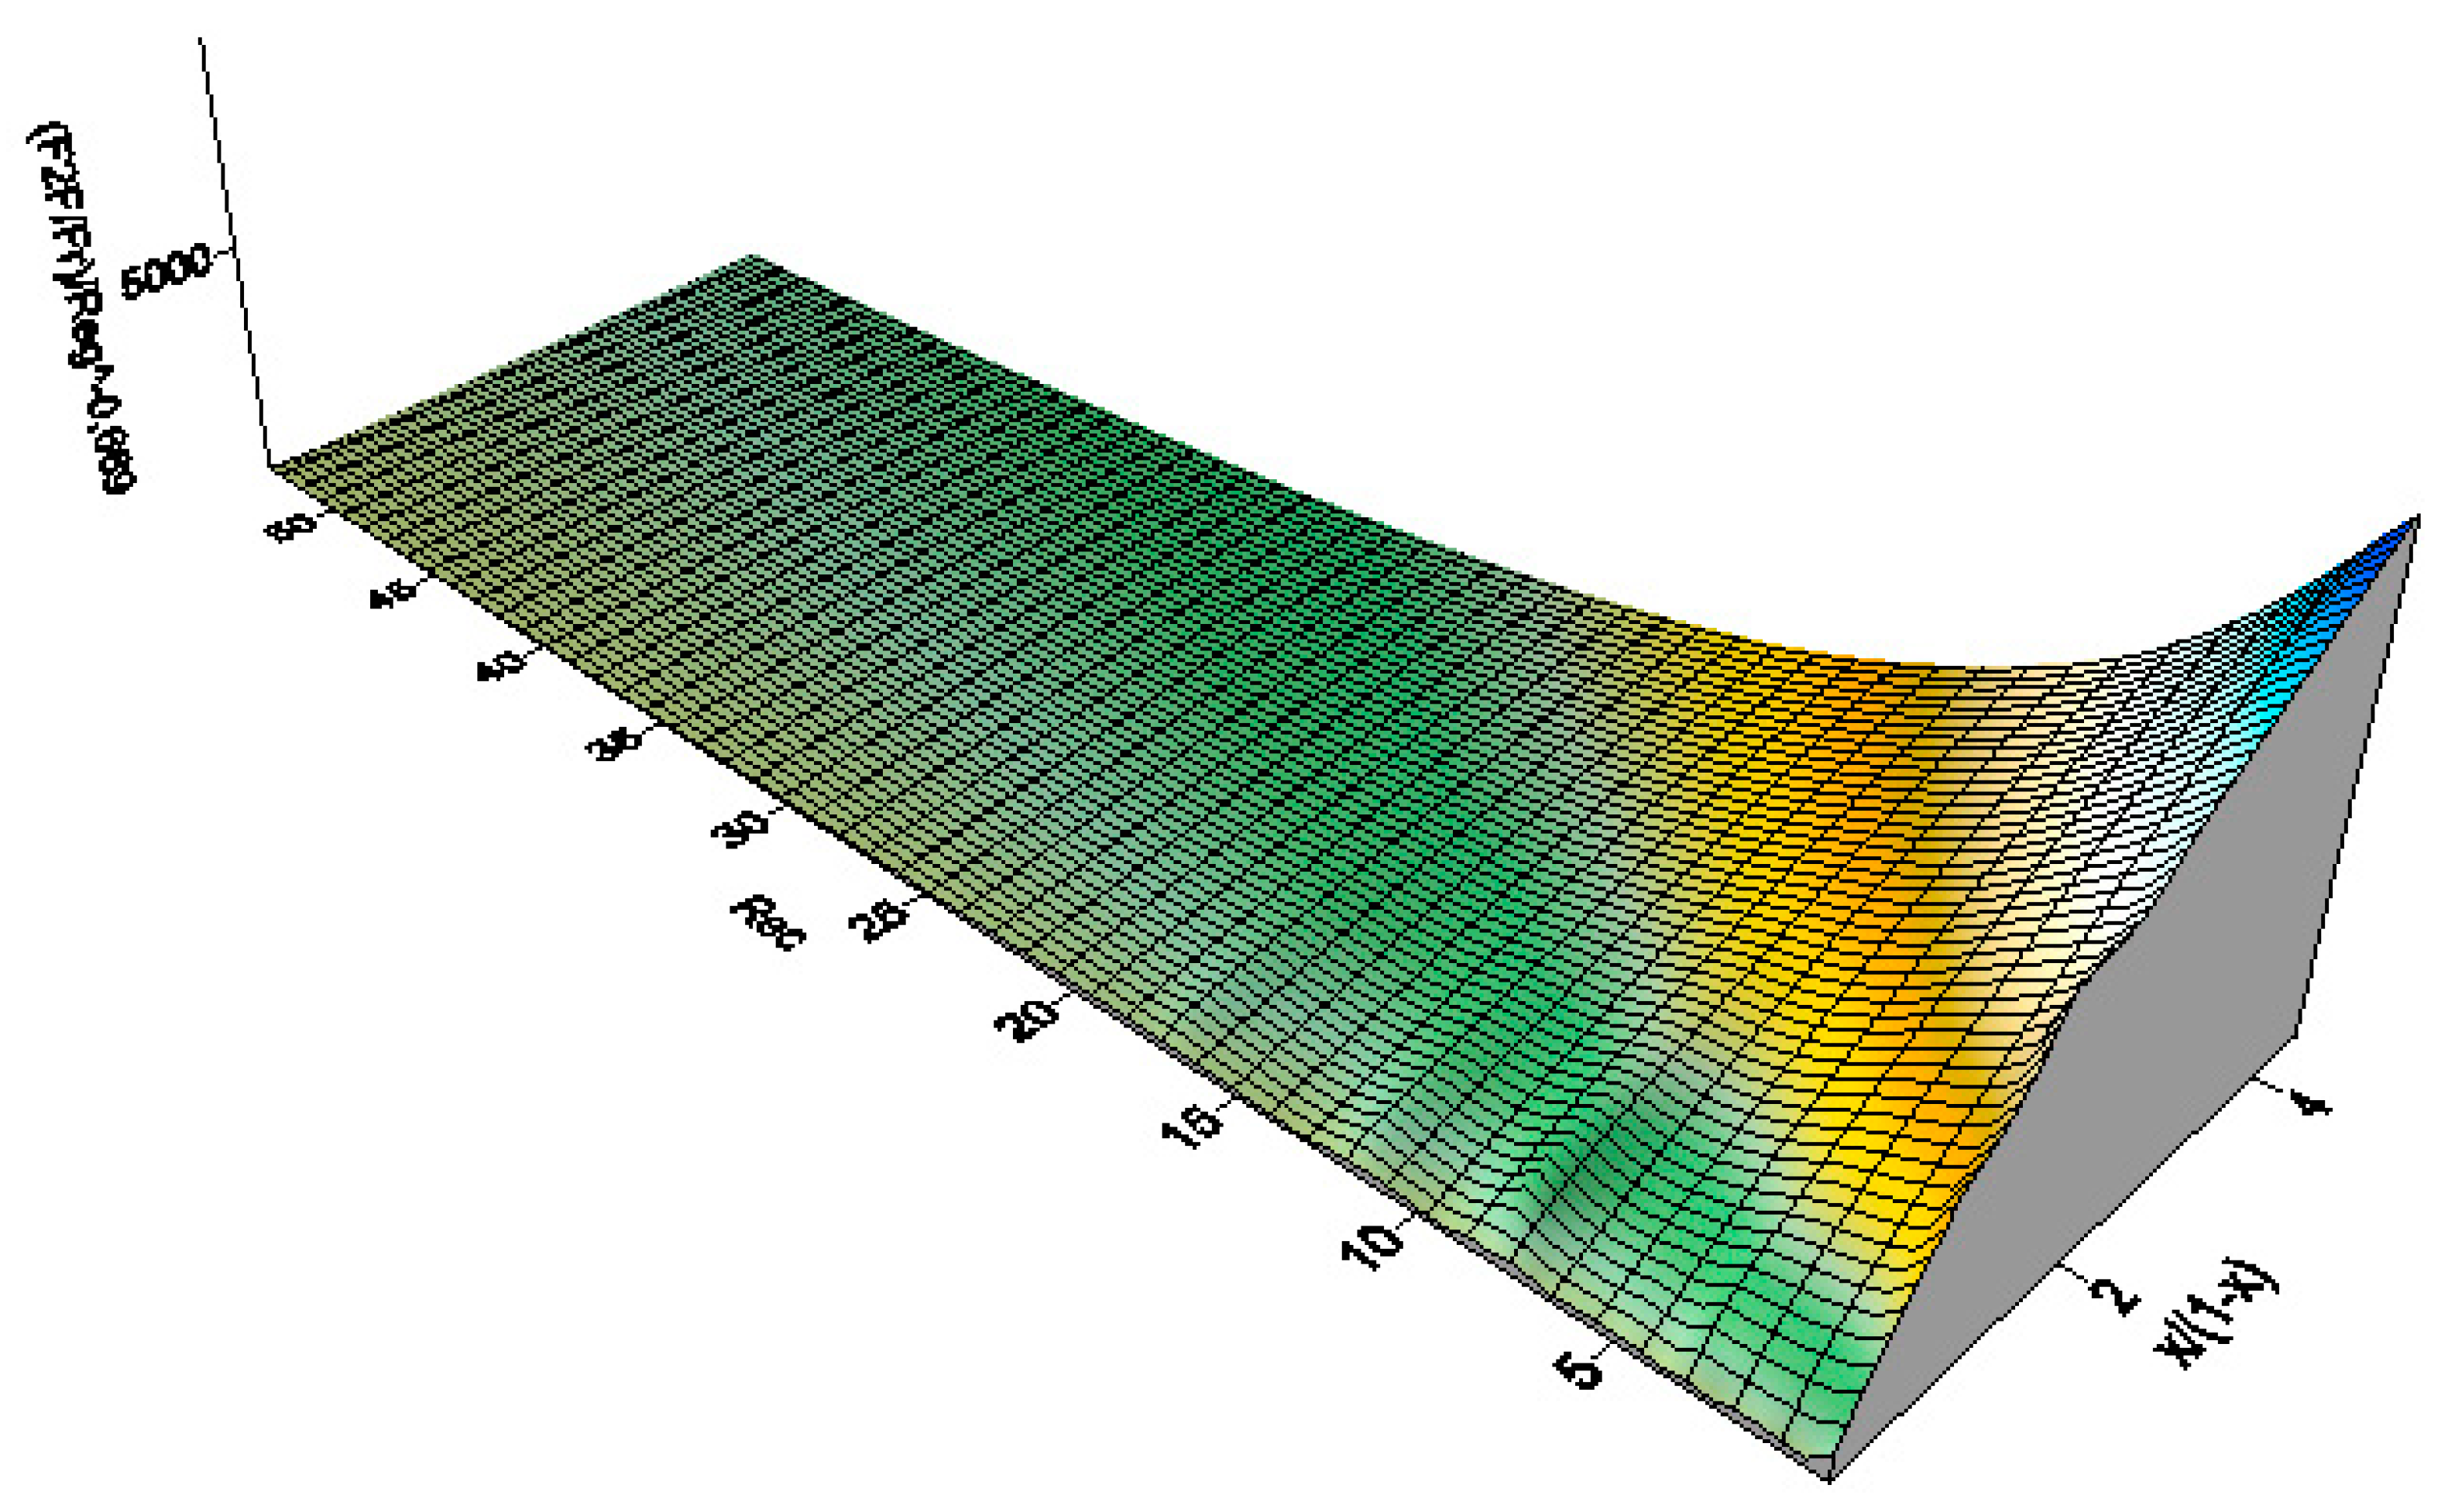
  • interfacial surfaces, F2F, in various conditions corresponding to the downstream flow of the liquid film.
All of these parameters (Figure 4) form the quantities that are identified and described in the study, contributing to a comprehensive description of the hydrodynamics of the investigated flow.
The calculation methods reported in the literature (Czernek [27] and Czernek et al. [28]) are based on the identification of very viscous parameters characteristic of gas–liquid flow, where the methods proposed for their determination were compared under similar conditions, noting that they relate to a much smaller range of variations in liquid viscosity (0.09–1.7 Pas). The rationale behind the selection of the present topic was associated with the fact that the reports in the literature regarding models applied to identify the hydrodynamics of downward annular gas-very viscous liquid flow involving a wide range of the variations in the dynamic viscosity coefficient are incomprehensive and scarce.
With the purpose of referring back to the model that provides reference for the current analysis in this respect, the list in Table 1 contains a summary of the methods employed for determining these parameters as characteristic of a two-phase, highly viscous gas-liquid annular flow.
On the basis of these assumptions and taking into account the results of the research available in the literature under the conditions of this flow—both for adiabatic states and for heat exchange—the development of an adequate model of the flow conditions was undertaken.
At the same time, an assumption was made to eliminate the cases that are difficult to unambiguously interpret (e.g., involving inter-phase slip) from analytical considerations, as well as disregarding quantities that provide difficulties, due to ambiguities in their assessment.
Following the assumptions made earlier, the general approach for the development of the flow model took into account the analytical methods applied for determination of the parameters of the annular two-phase flow characteristic for the induced two-phase gas-liquid flow using viscous liquids.
The issues resulting from the description of the quantitative characteristics of the two-phase gas-very viscous liquid annular flow were related to the manner in which such hydrodynamic parameters were determined in a specific case of the investigated flow, taking into account the following:
  • liquid film thickness, as the value identified both for local and averaged states;
  • characteristics of waves formed on the interfacial surface, which are possible to represent by means of such liquid film parameters as: frequency and amplitude of waves on the film surface, their length and velocity of displacement along the interface; and
  • mean surface of the interface between gas-viscous liquid flows, as identified for all observed forms of annular oil-air two-phase flow.
A detailed qualitative and quantitative analysis of the research material was carried out with the purpose of determining these parameters, for which we applied compensatory calculus resulting in the development of detailed model equations describing these parameters.

3.3. New Equations for Liquid Films

With regard to the liquid film thickness (s), two alternative relations were developed, namely:
  • One that is relative to the mass fraction of the gas phase (x = gg/gT) and the characteristics of the gas and liquid flow (Reg, Rel), as related to an equivalent linear dimension (ϑz):
    s ϑ z = 54 ( x 1 x ) 0.325 Re l 0.539 Re g 0.484 ,
    in which case, the correlation coefficient is equal to r = 0.98 and the mean standard deviation is δ = 0.18; and
  • one that is relative to the Lockhart-Martinelli parameter (Xtt), as well as the gas and liquid viscosities (ηg, ηl), in the form of the equation:
    s ϑ z = 158.2 X tt 0.208 ( η l η g ) 0.551 ,
    where X tt = ( x 1 x ) 0.9 ( ρ g ρ l ) 0.5 ( η l η g ) 0.1 ; in which case, the correlation coefficient is equal to r = 0.92 and the mean standard deviation is δ = 0.21.
In both cases, as a result of taking into account the mass fractions of the gas and liquid phases (x and 1-x, respectively), these equations are stated in relation to the mass balance of a two-phase gas-liquid flow, which provides a more representative approach to modeling thermal and flow phenomena, compared to that based on the volume fraction.
Both relations are characterized by a high level of consistency, compared with results gained experimentally; hence, they can be recommended for application in the description of all kinds of phenomena occurring in the two-phase gas-very viscous liquid flow, related to both momentum transfer processes and heat and mass exchange.
In order to indicate the interfacial surface conditions accompanying various flow parameters and liquid properties, Figure 5 was developed to present examples of results of the experiment obtained by application of the optoelectronic system.
In the figure, the thickness of the liquid film is marked as a function of time. The corresponding distributions of the values are also marked. The variations in the wavy flow characteristics corresponding to various flow parameters and liquid properties provide the basis for the assessment and calculation of quantities such as the wave frequency, their velocity and length, as well as amplitude value.
Determination of the values listed above was unambiguous in the presence of sine waves or waves whose shape was close to a sine. However, within the range accompanied by the simultaneous occurrence of sine waves and superimposed capillary waves and rolling waves, these values were taken for the so-called equivalent sine wave. At this point, we should note that, in the majority of cases, we observed the simultaneous occurrence of various types of superimposed waves and, in the range of the annular hydraulic flow, there were also short transverse waves with an irregular shape. This undoubtedly occurred as a consequence of the considerable interaction of the gas phase on the surface of the liquid film, leading to an increase in its turbulence.
A number of experiments were carried out with the purpose of determining the effect of the flow of individual phases on the value of quantities characterizing the liquid film waves for different values of the Reynolds number for liquid and gas phases (i.e., Rez and Reg), examples of which are presented in Figure 6, Figure 7, Figure 8 and Figure 9.
The distribution of points in Figure 6 clearly indicates that, along with an increase of the value of the number Rez combined with a constant value (i.e., Reg = const), the wave frequency increased.
An identical relation was found regarding the effect of these parameters on the velocity of wave displacement, as illustrated in Figure 7. Throughout the study, it was found that the relative velocity of waves in relation to the mean velocity of the liquid film considerably decreased with an increase in the value of the Reynolds number Rez. The reason for this is undoubtedly associated with the turbulence of the liquid film and, thus, the decay of the regular pattern of waves. The decrease in the equivalent wavelength λ with an increase in Rez for various Reg is illustrated in Figure 8. However, in this case, the results did not demonstrate a clear effect of the gas flow rate on the value of the wavelength.
Subsequently, we found unique characteristics (Figure 9) represented by the effect of Rez and Reg on the decreased value of wave amplitude, as defined in terms of the mean range of the formation of qualitatively different waves. The distribution of points in the figure demonstrates that an increase in Rez, accompanied by a constant value of Reg, was responsible for an increase in the reduced range of the amplitude. The increase in the gas flow rate, as incurred by Reg coupled with a constant value of Rez, brings about the same effect.
Analysis of the effect of the ratio of gas and liquid velocities to the quantities characterizing the characteristics of the liquid film waves demonstrated that this parameter significantly affects the value of the velocity of wave displacement on the liquid film surface, as well as the frequencies and amplitudes of the waves. However, the results did not indicate the influence of this relation on the wavelength.
Our research and analysis also involved the analysis of literature data, which offered the basis for the development of correlations applicable to the calculation of specific quantities, namely:
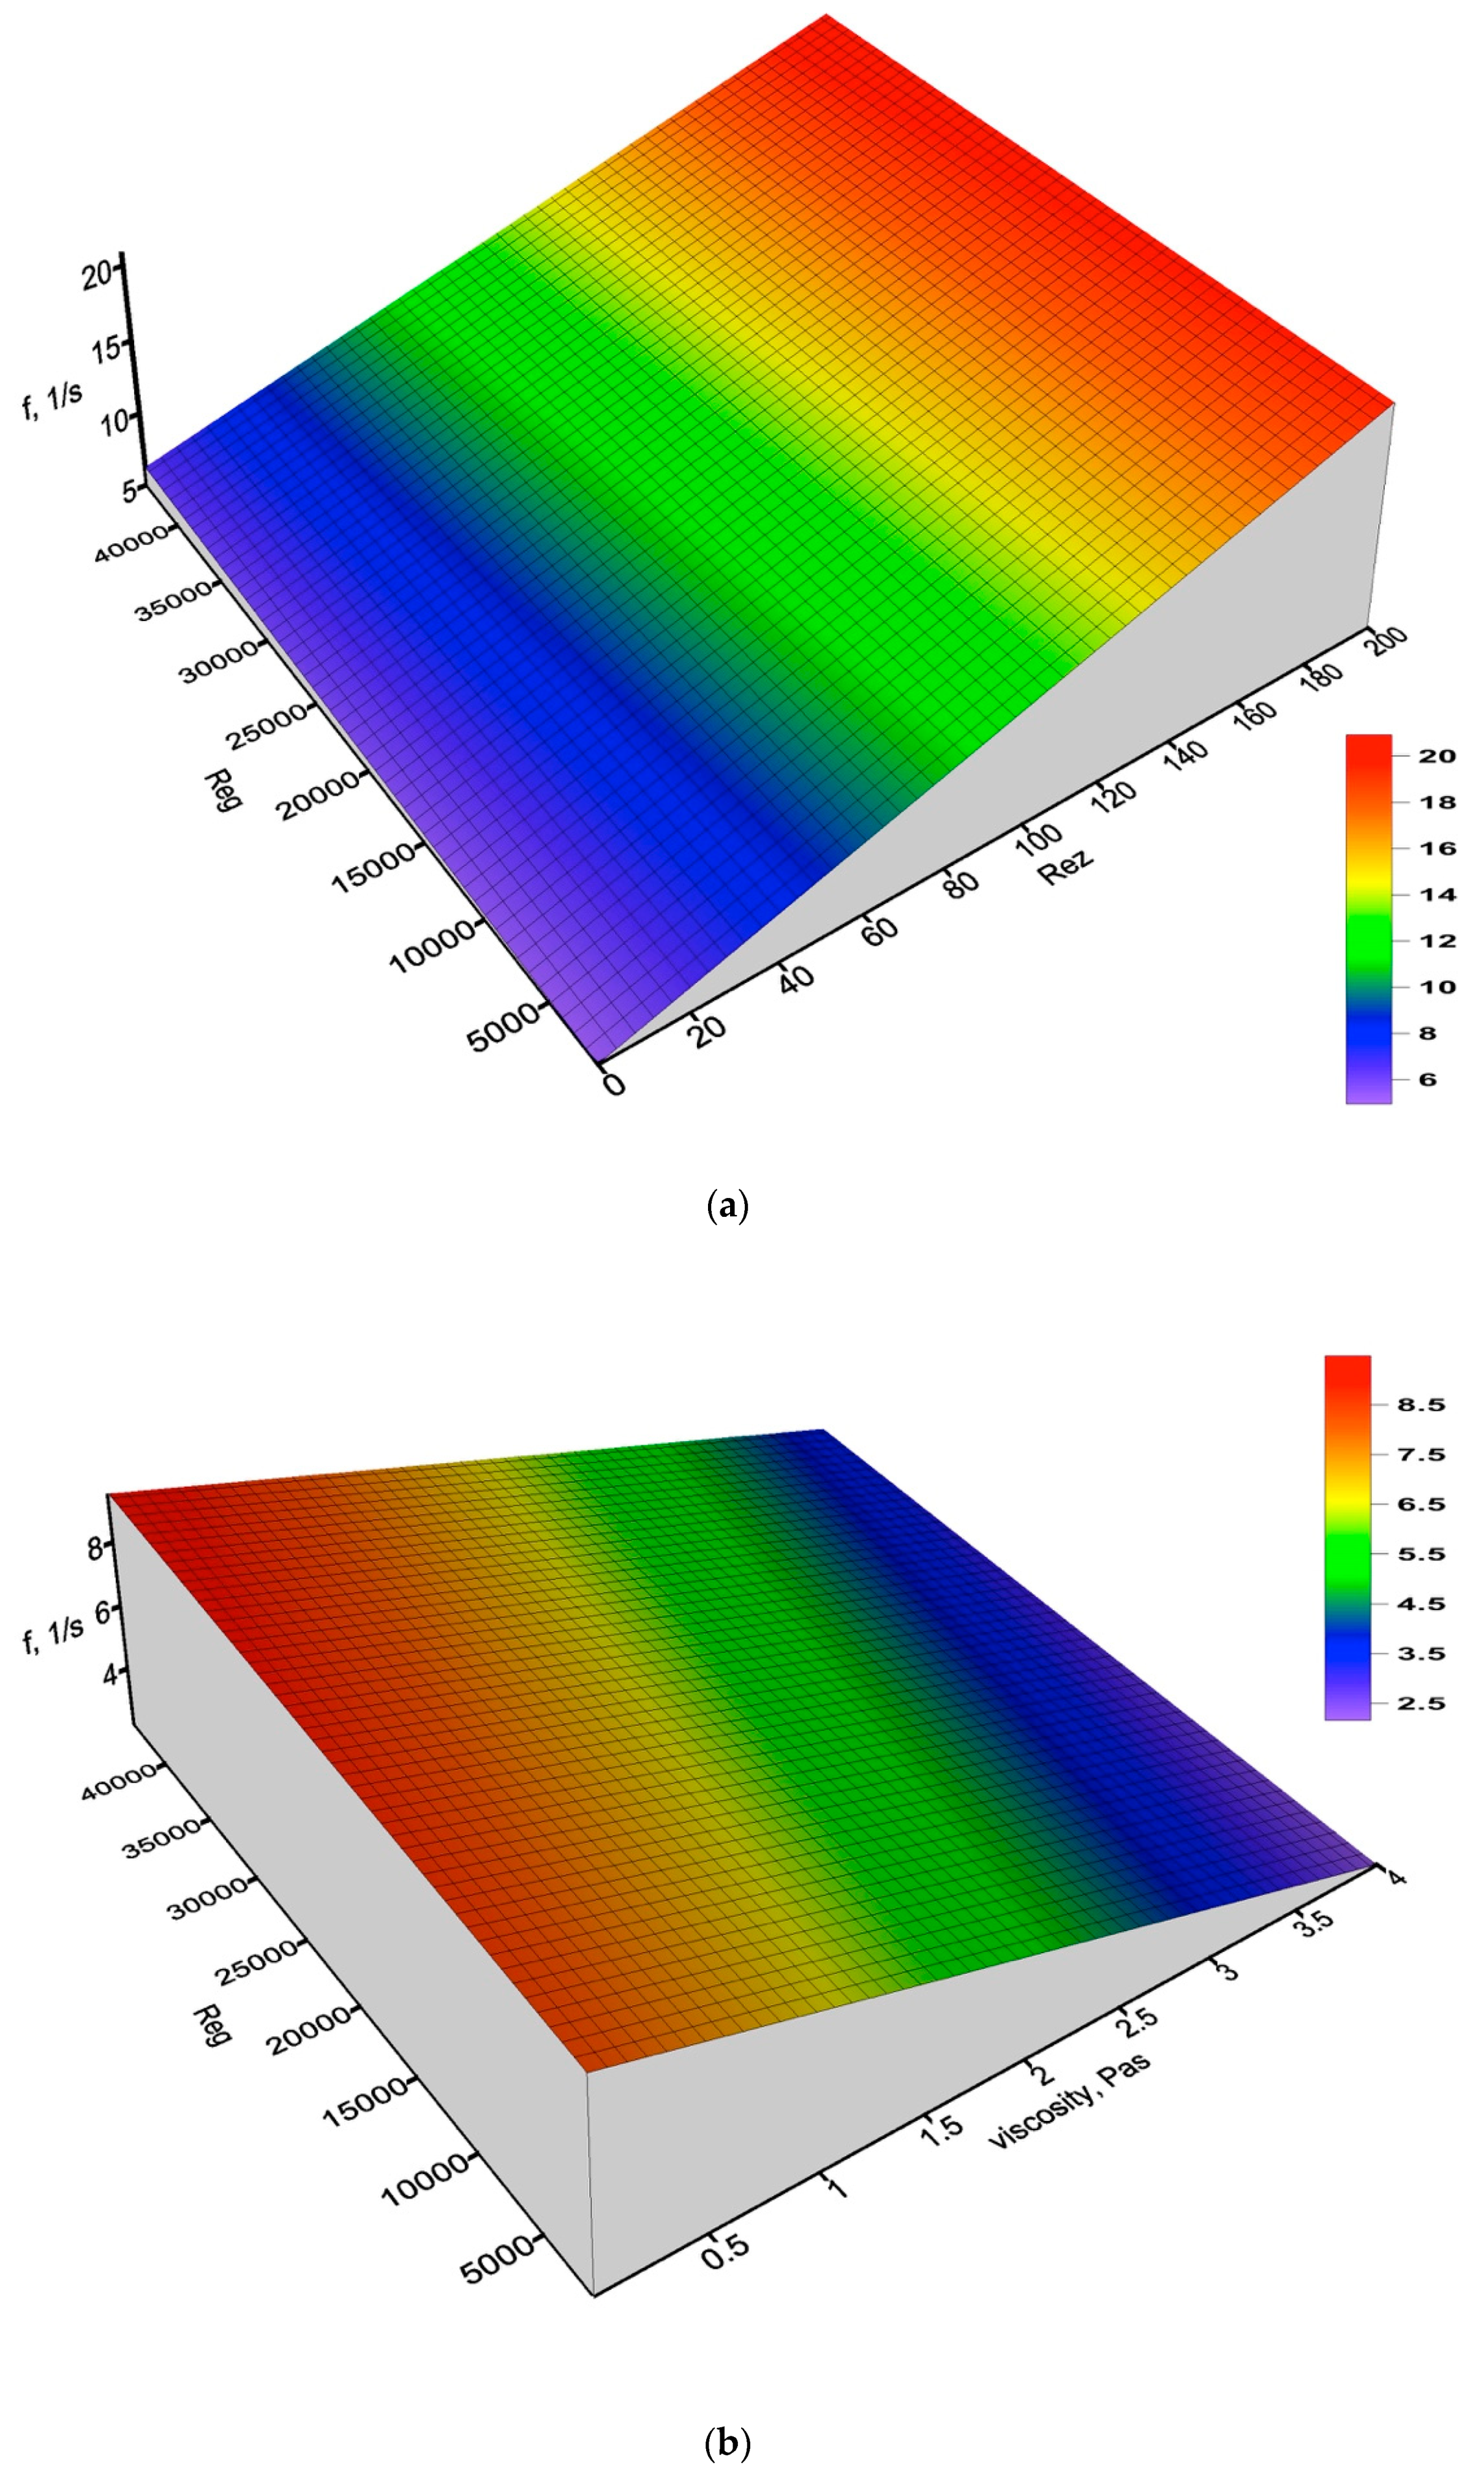
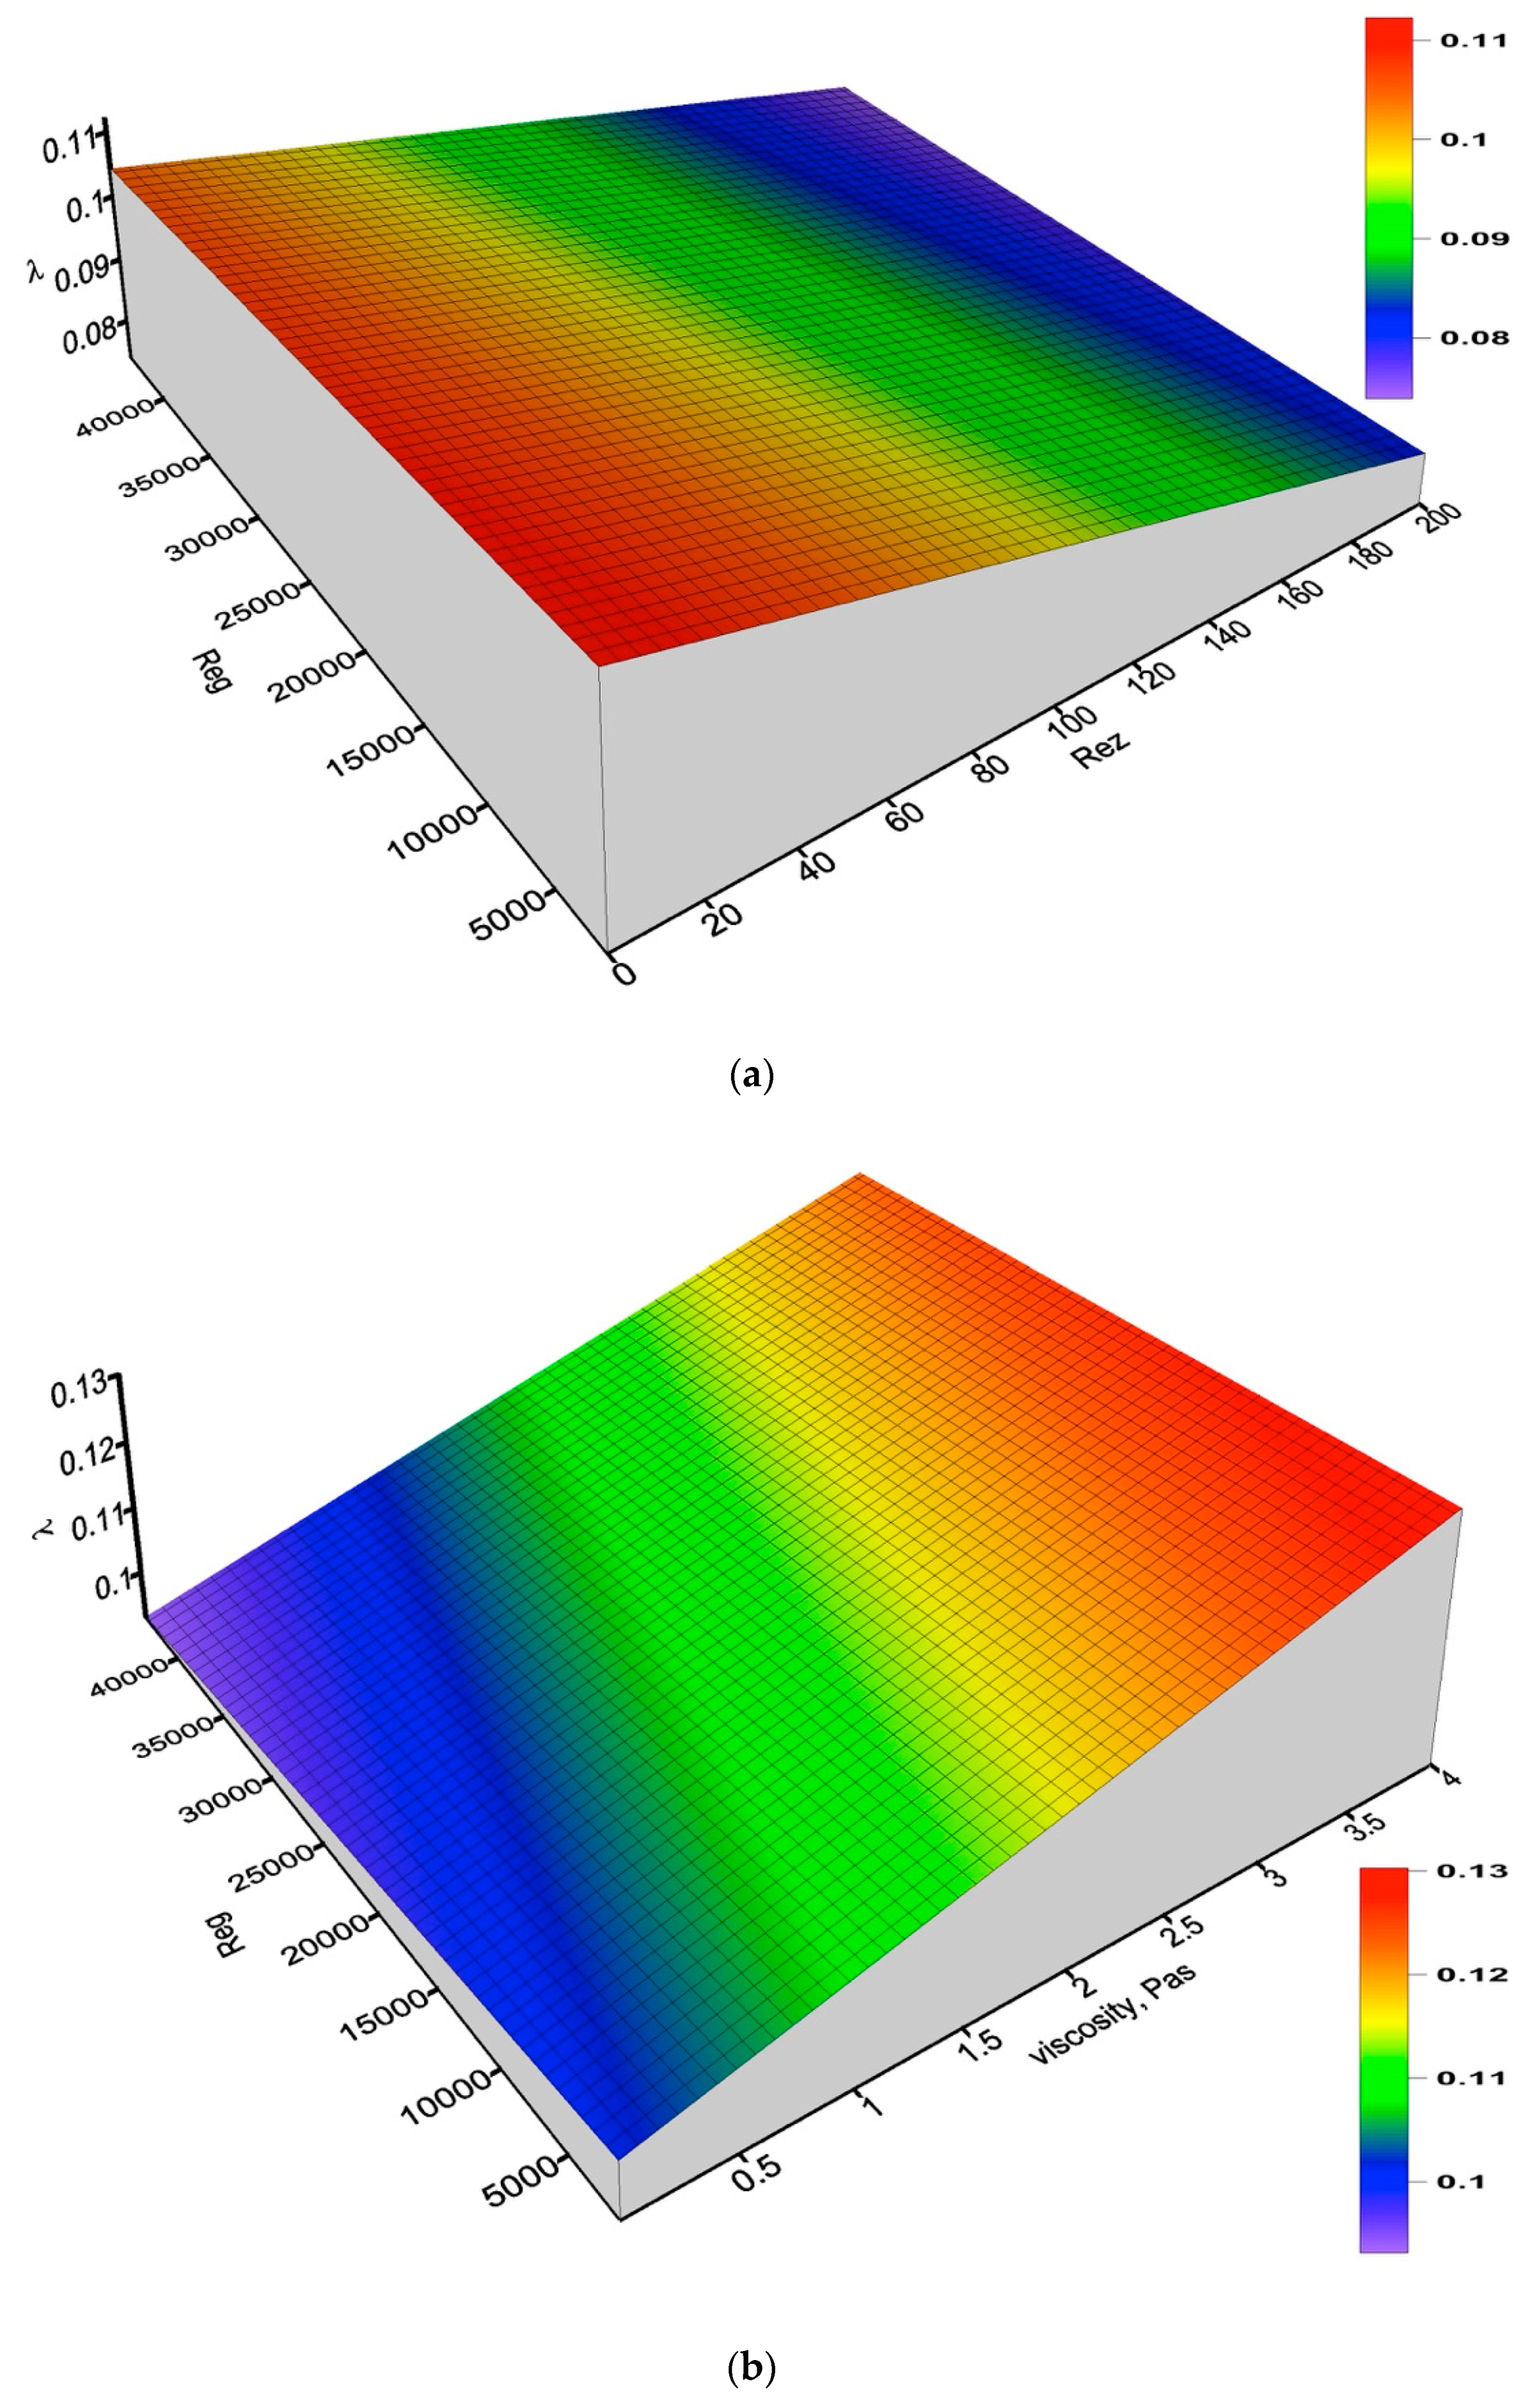
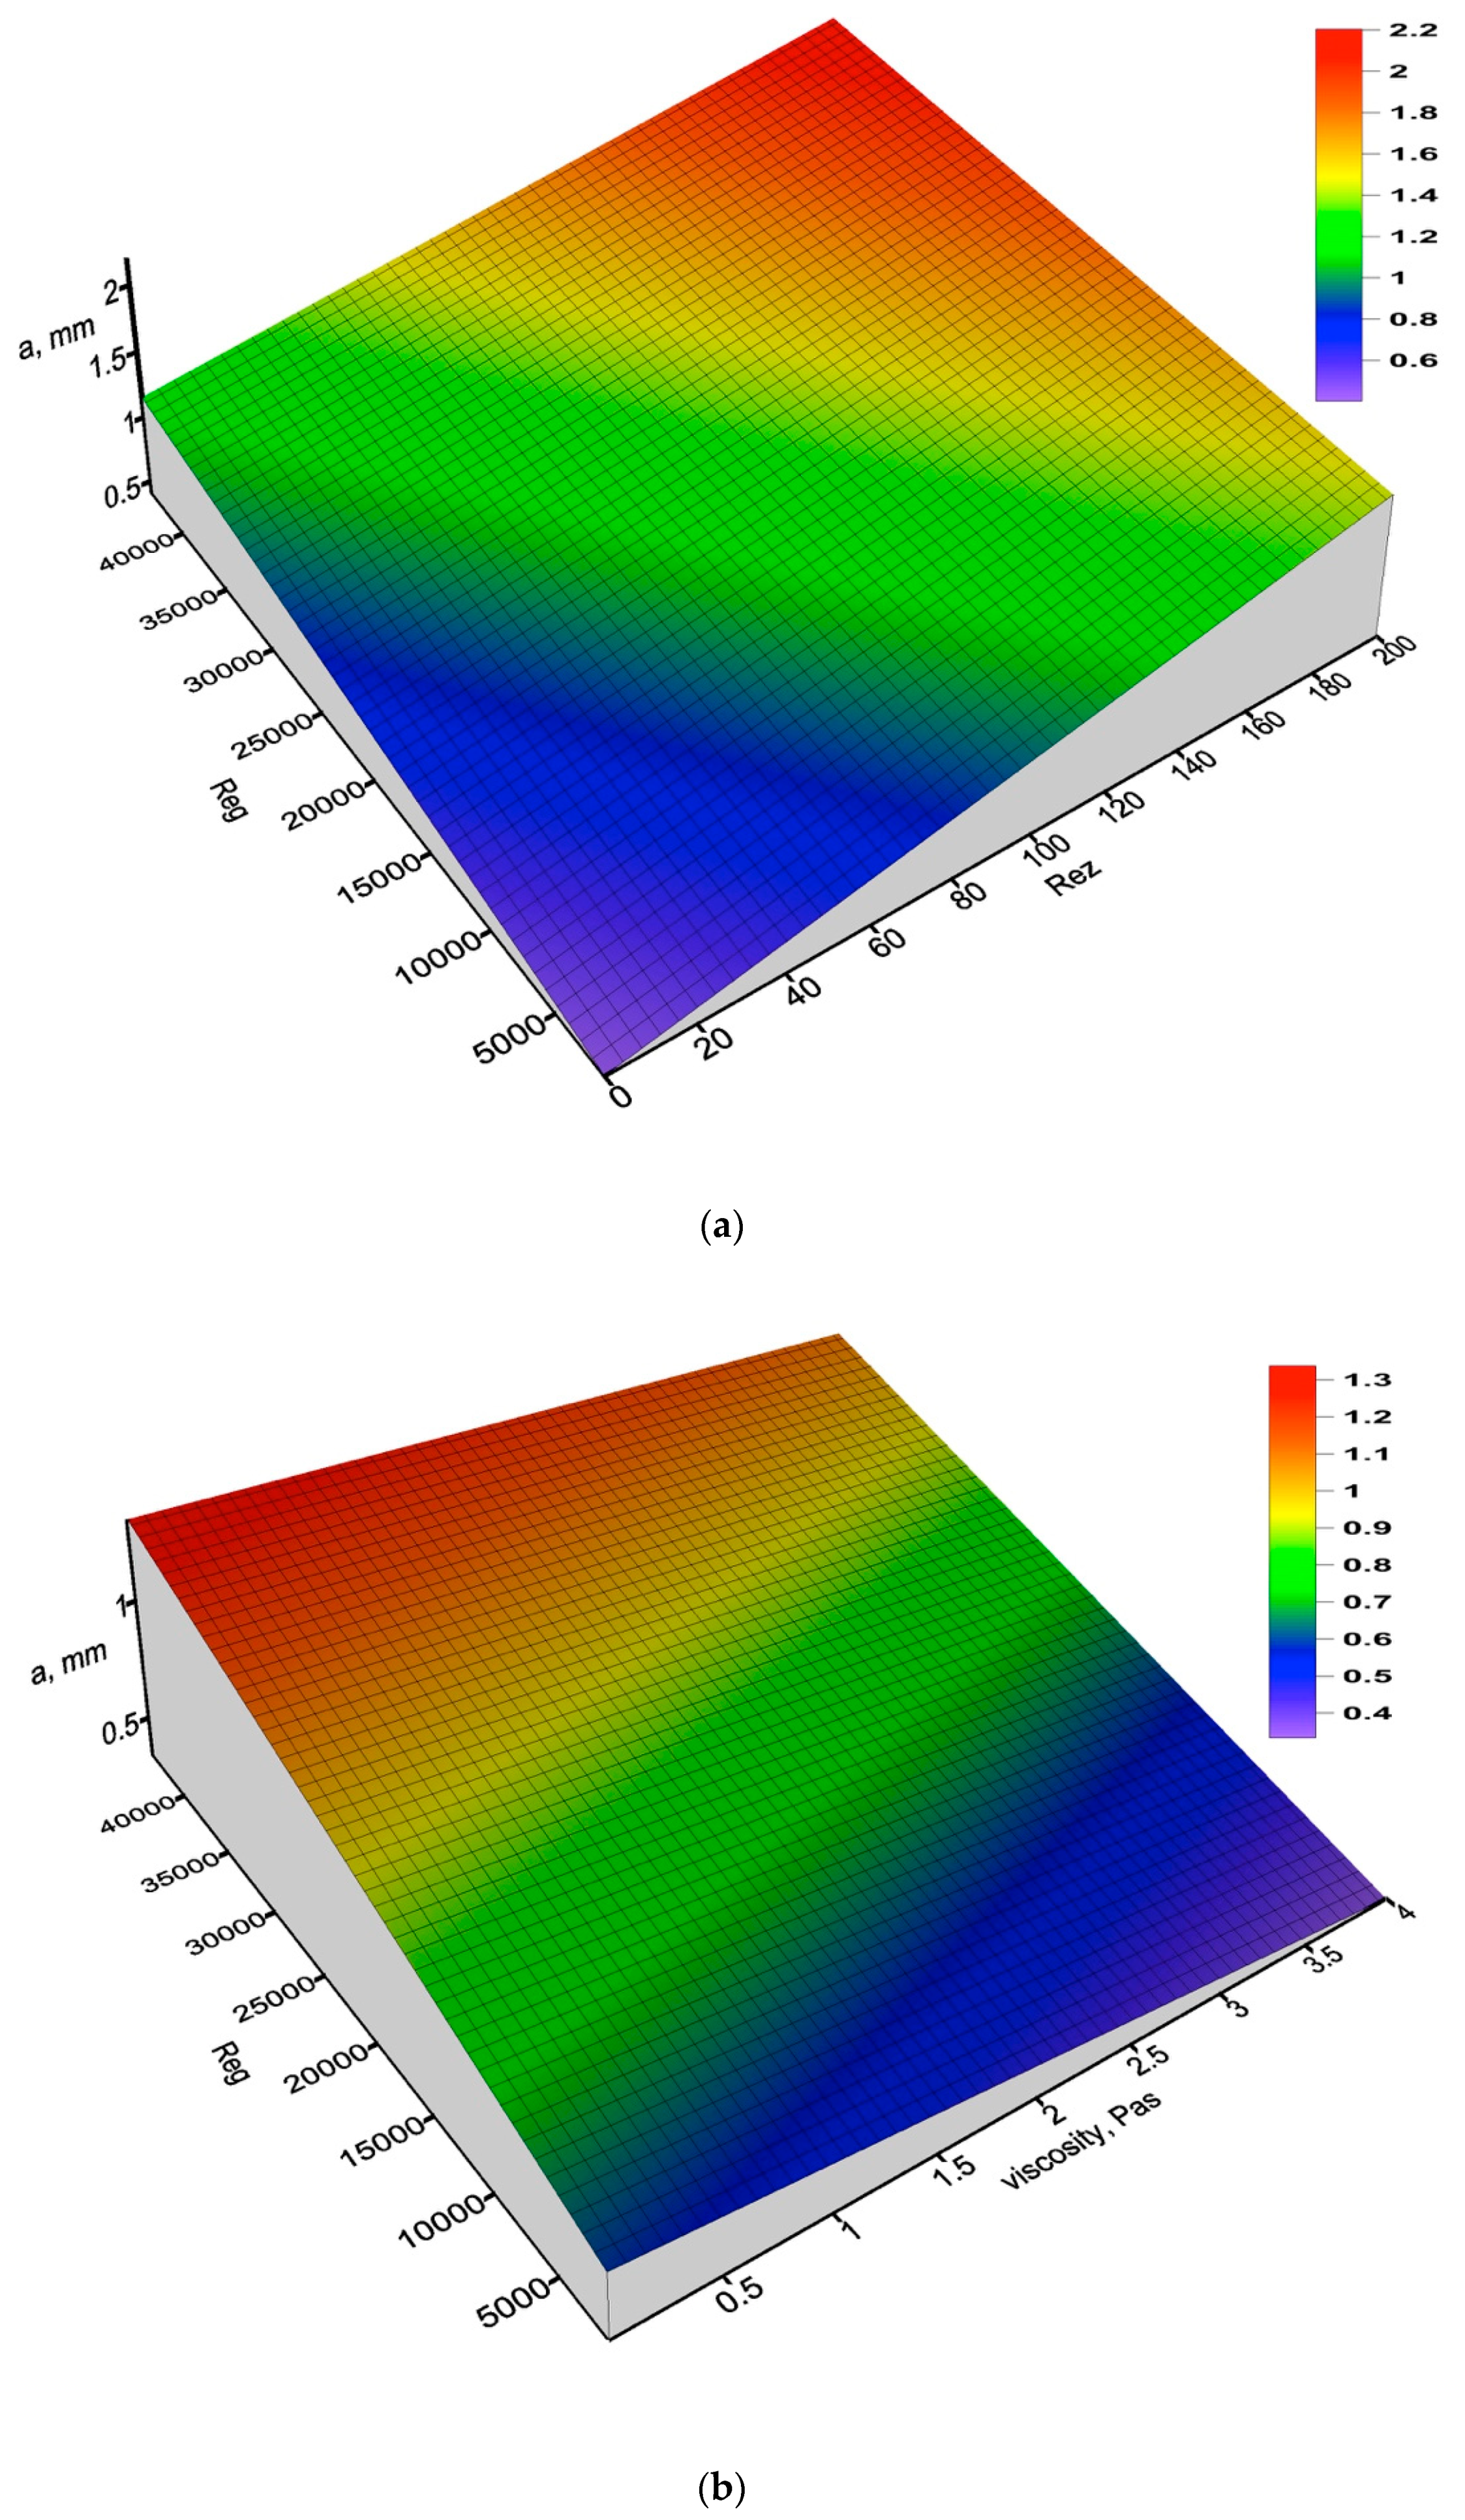
  • the wave frequency, f:
    f ϑ z j l = 5.43 ( x 1 x ) 0.345 Re g 0.221 Re l 0.442
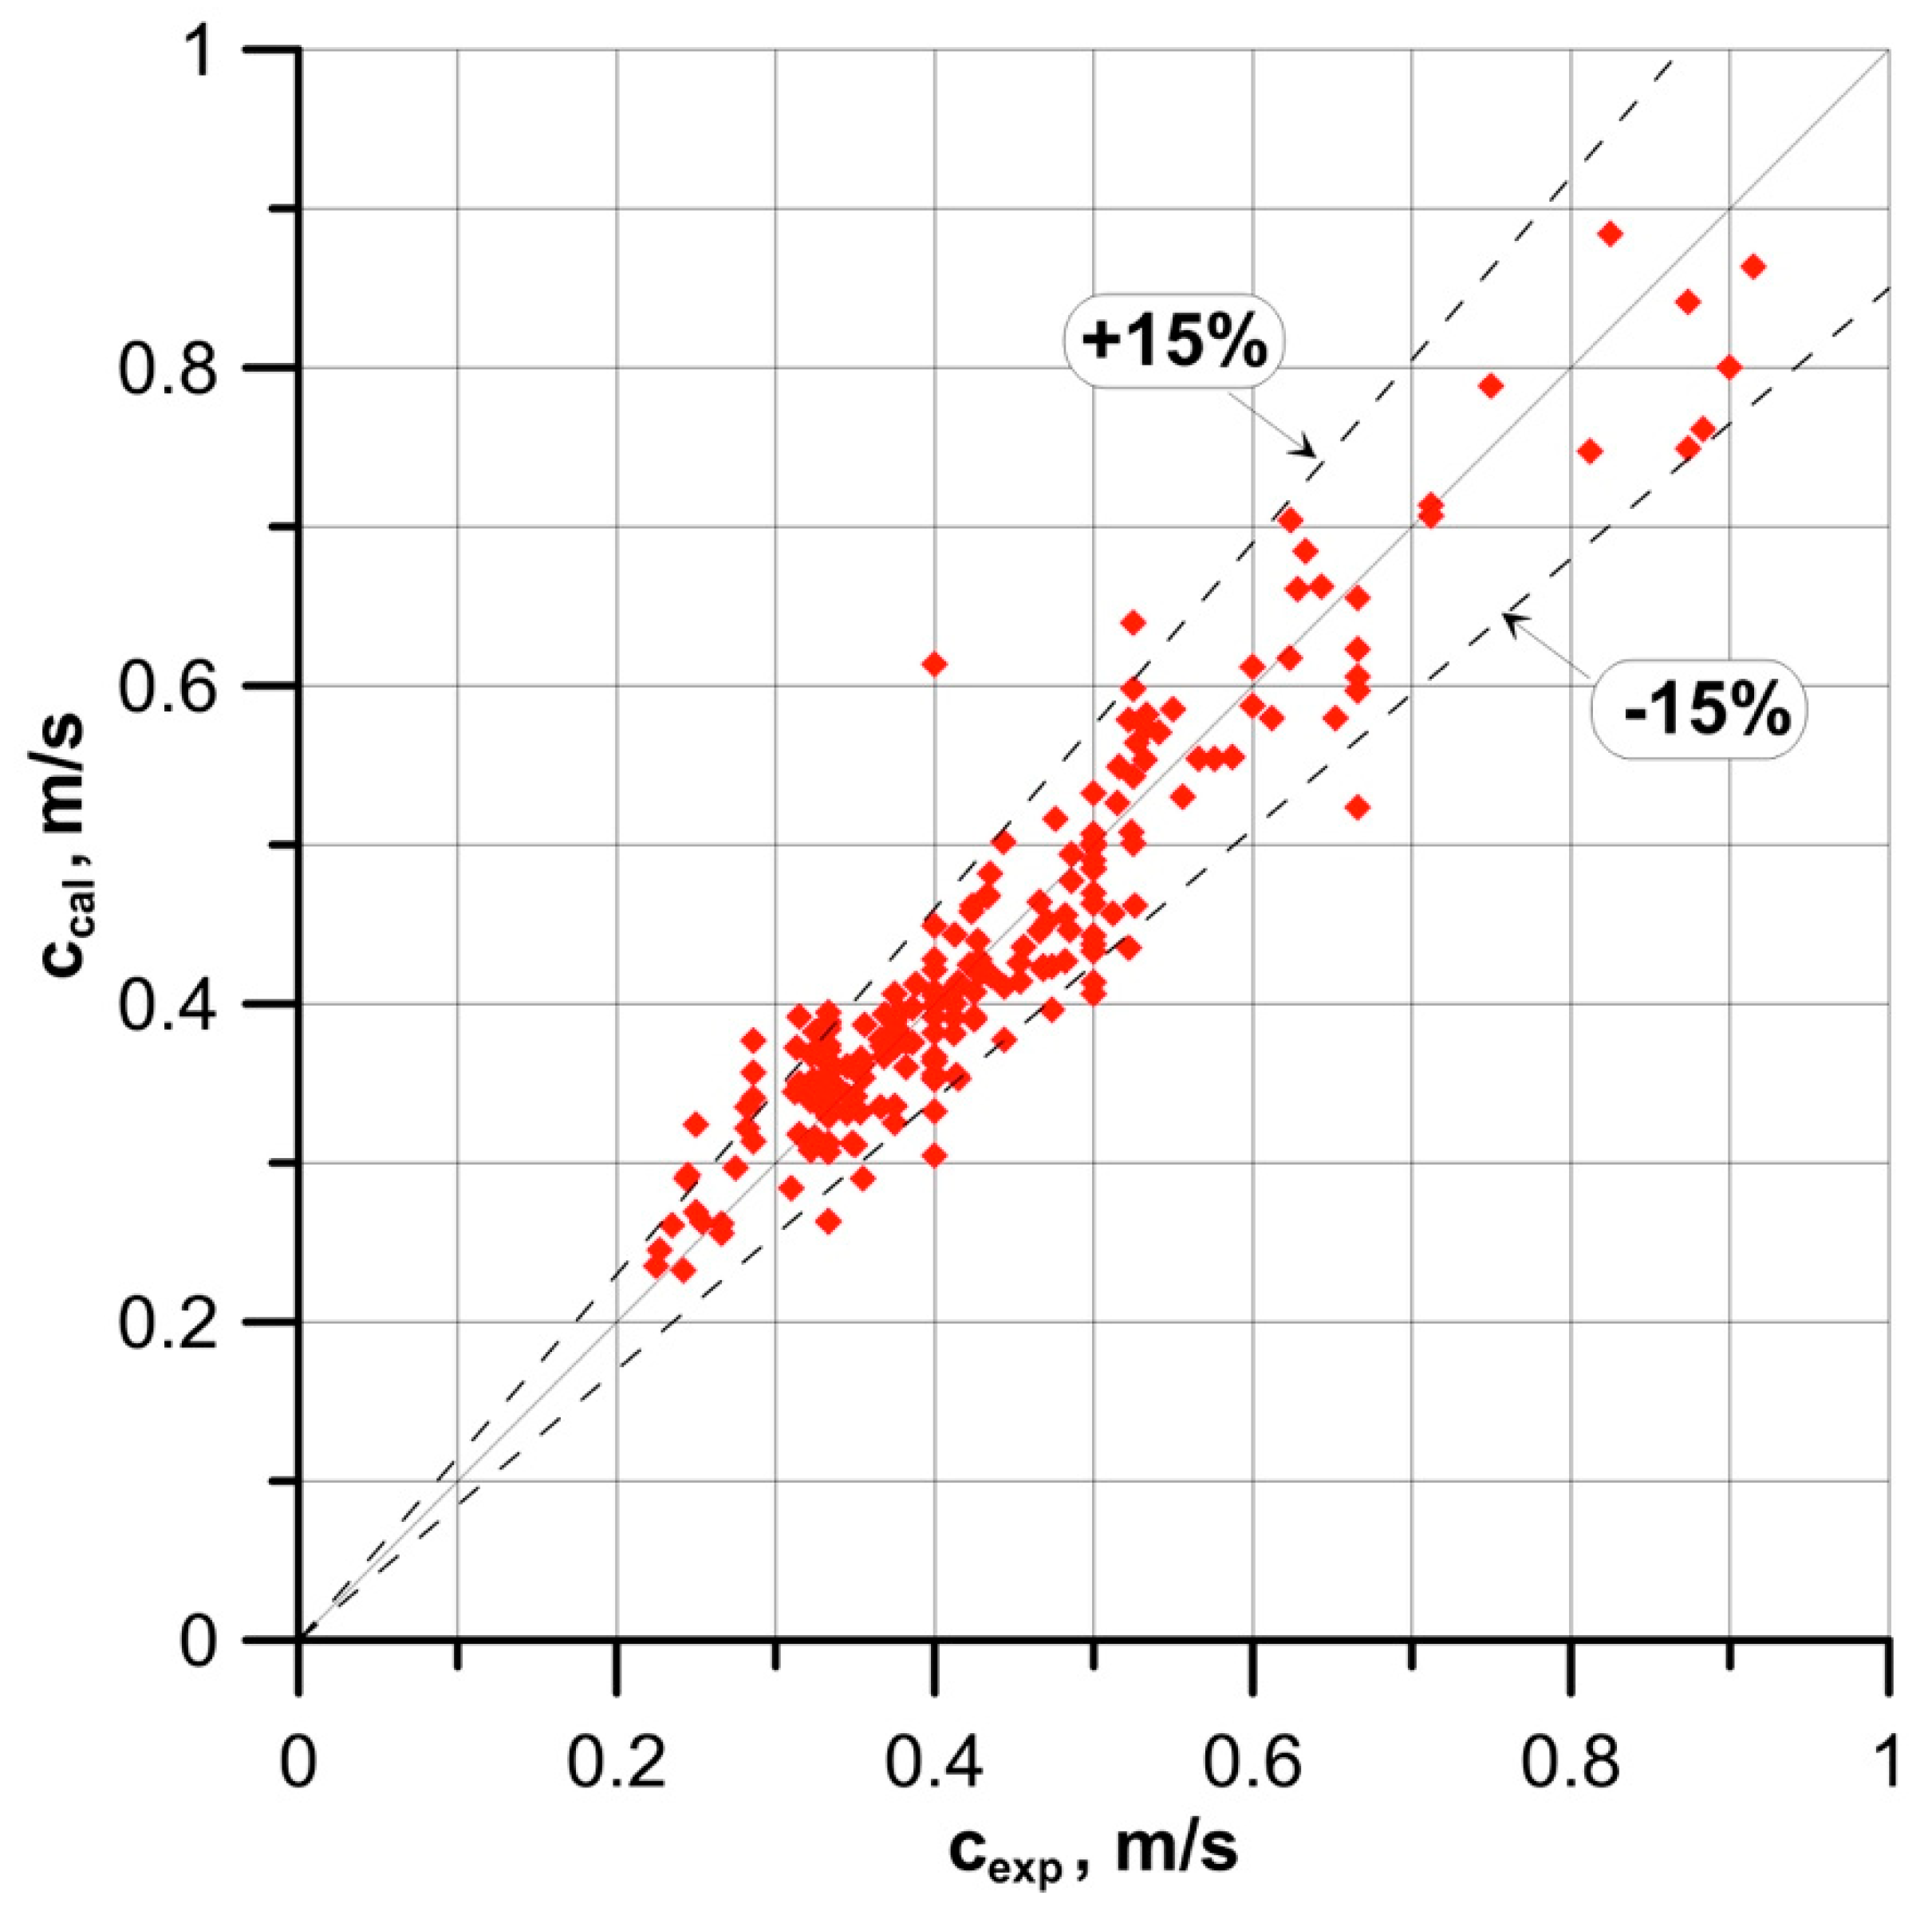
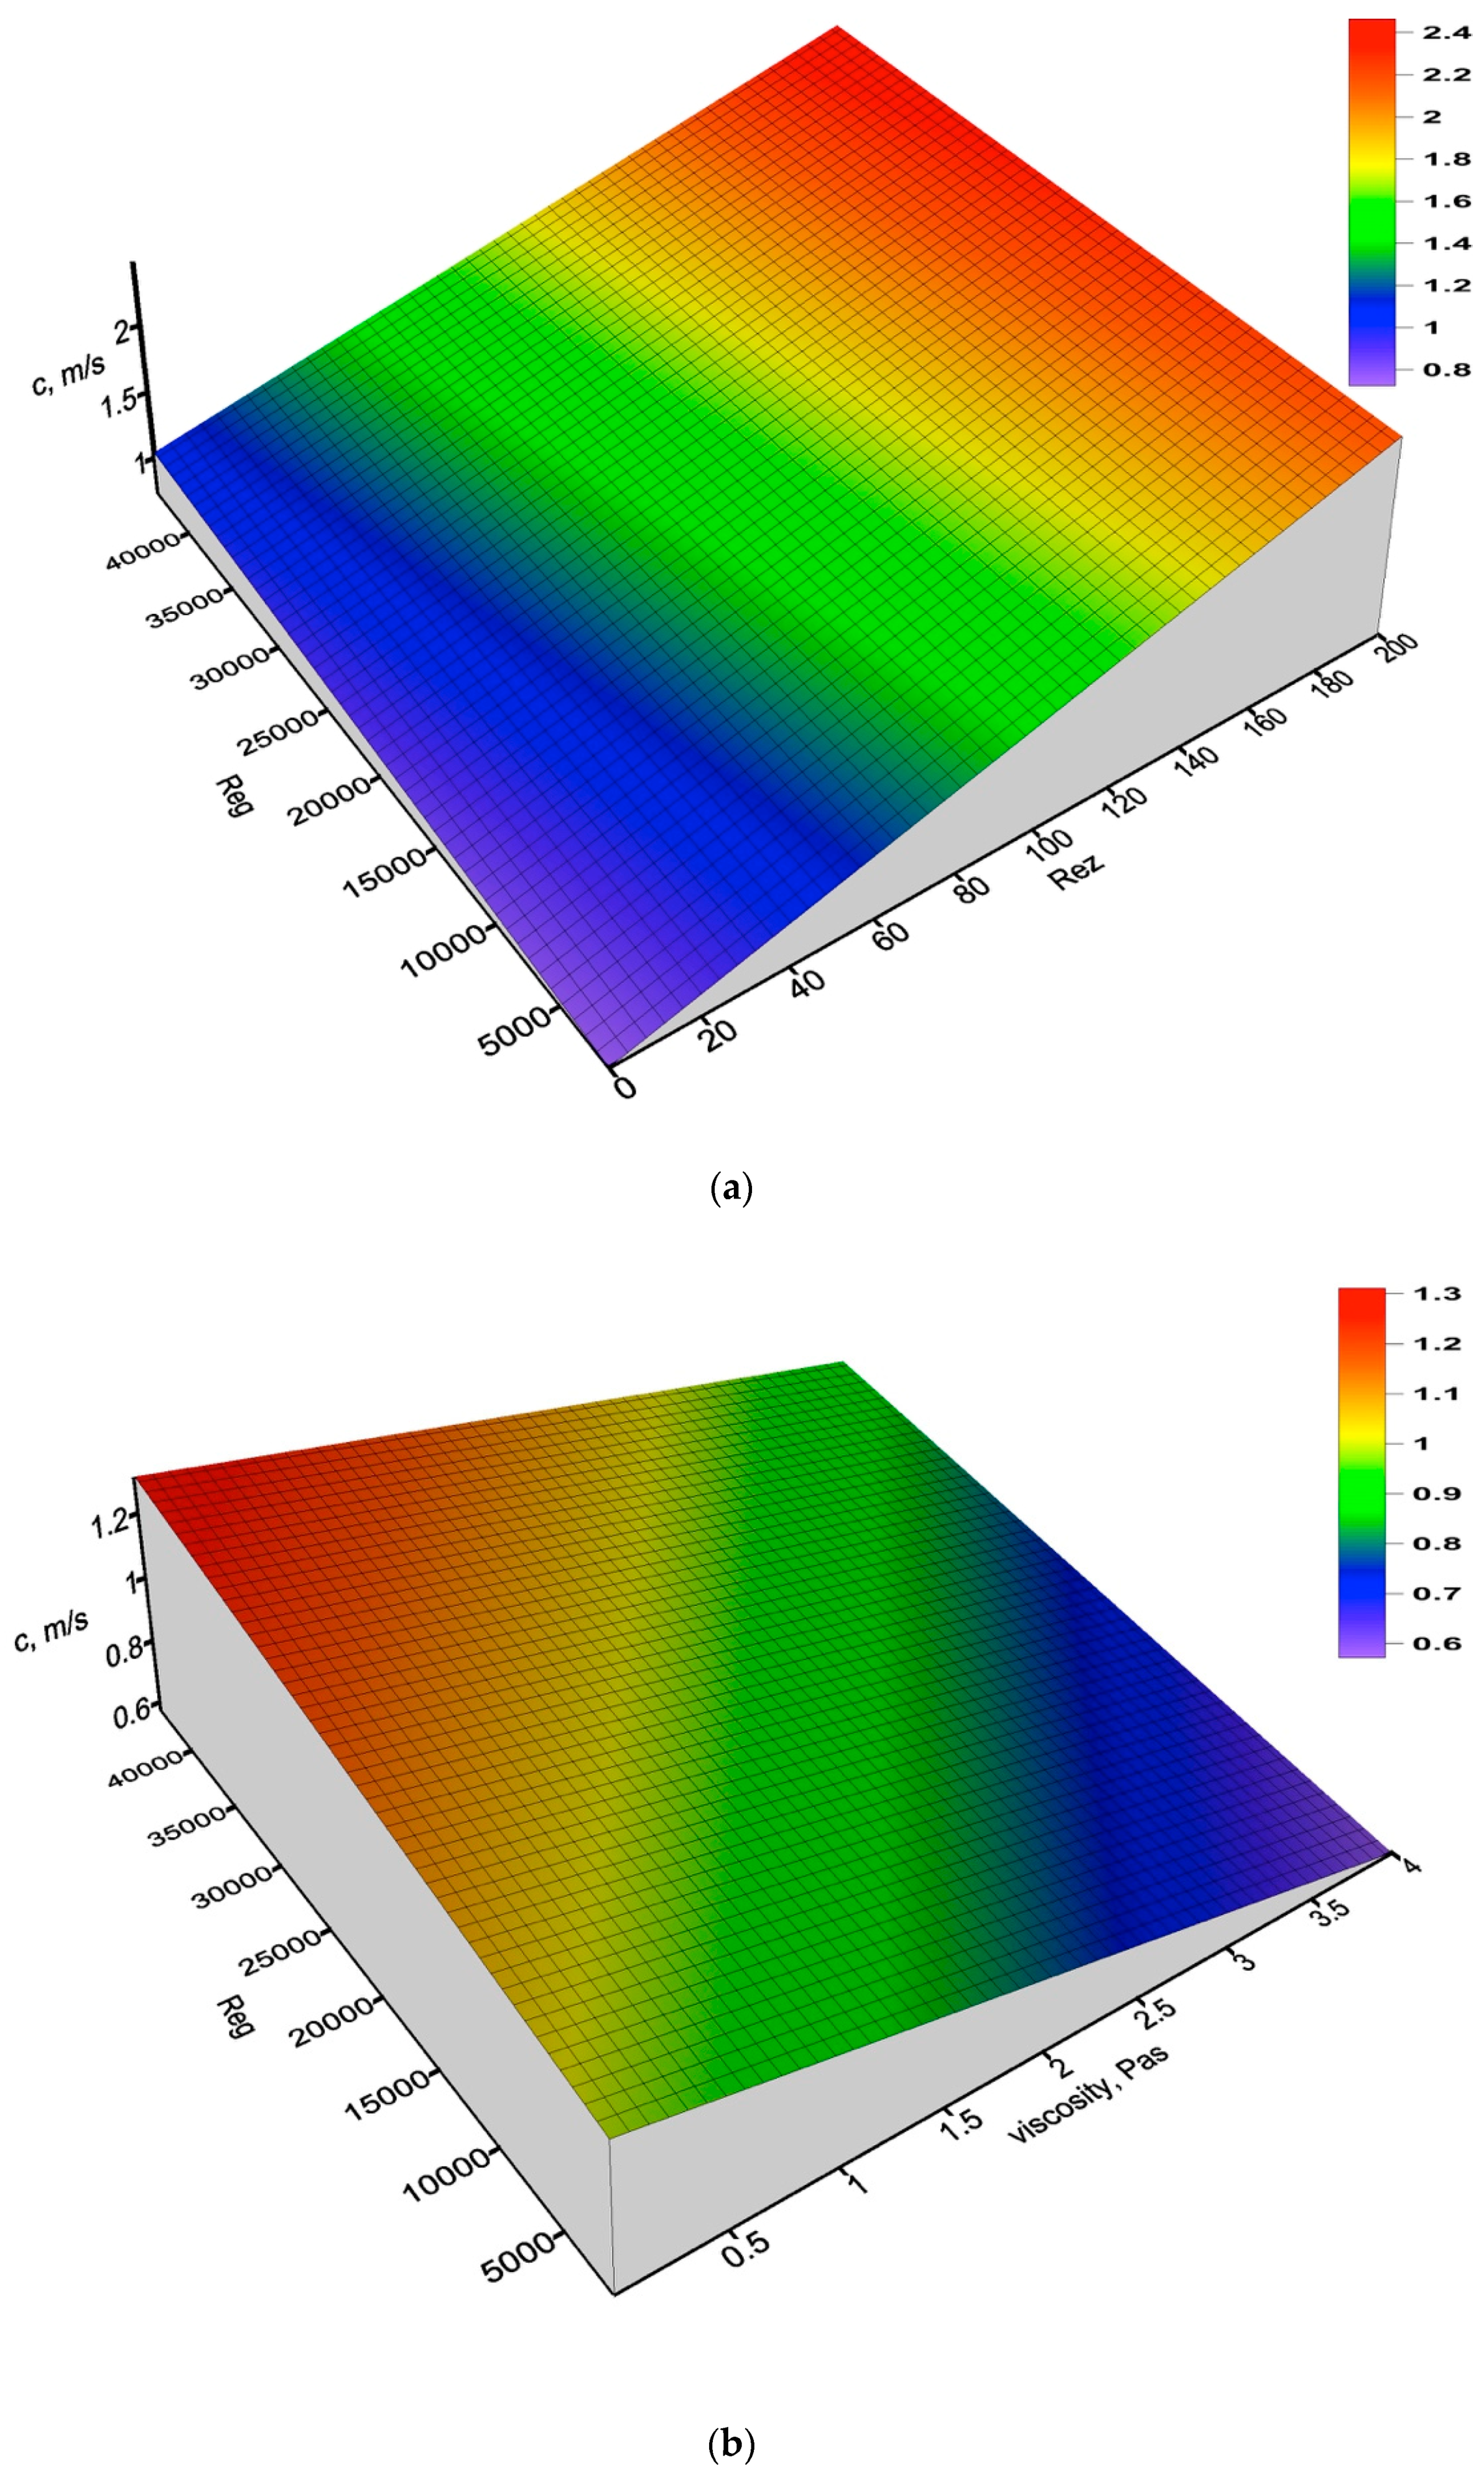
  • the velocity of wave displacement, c:
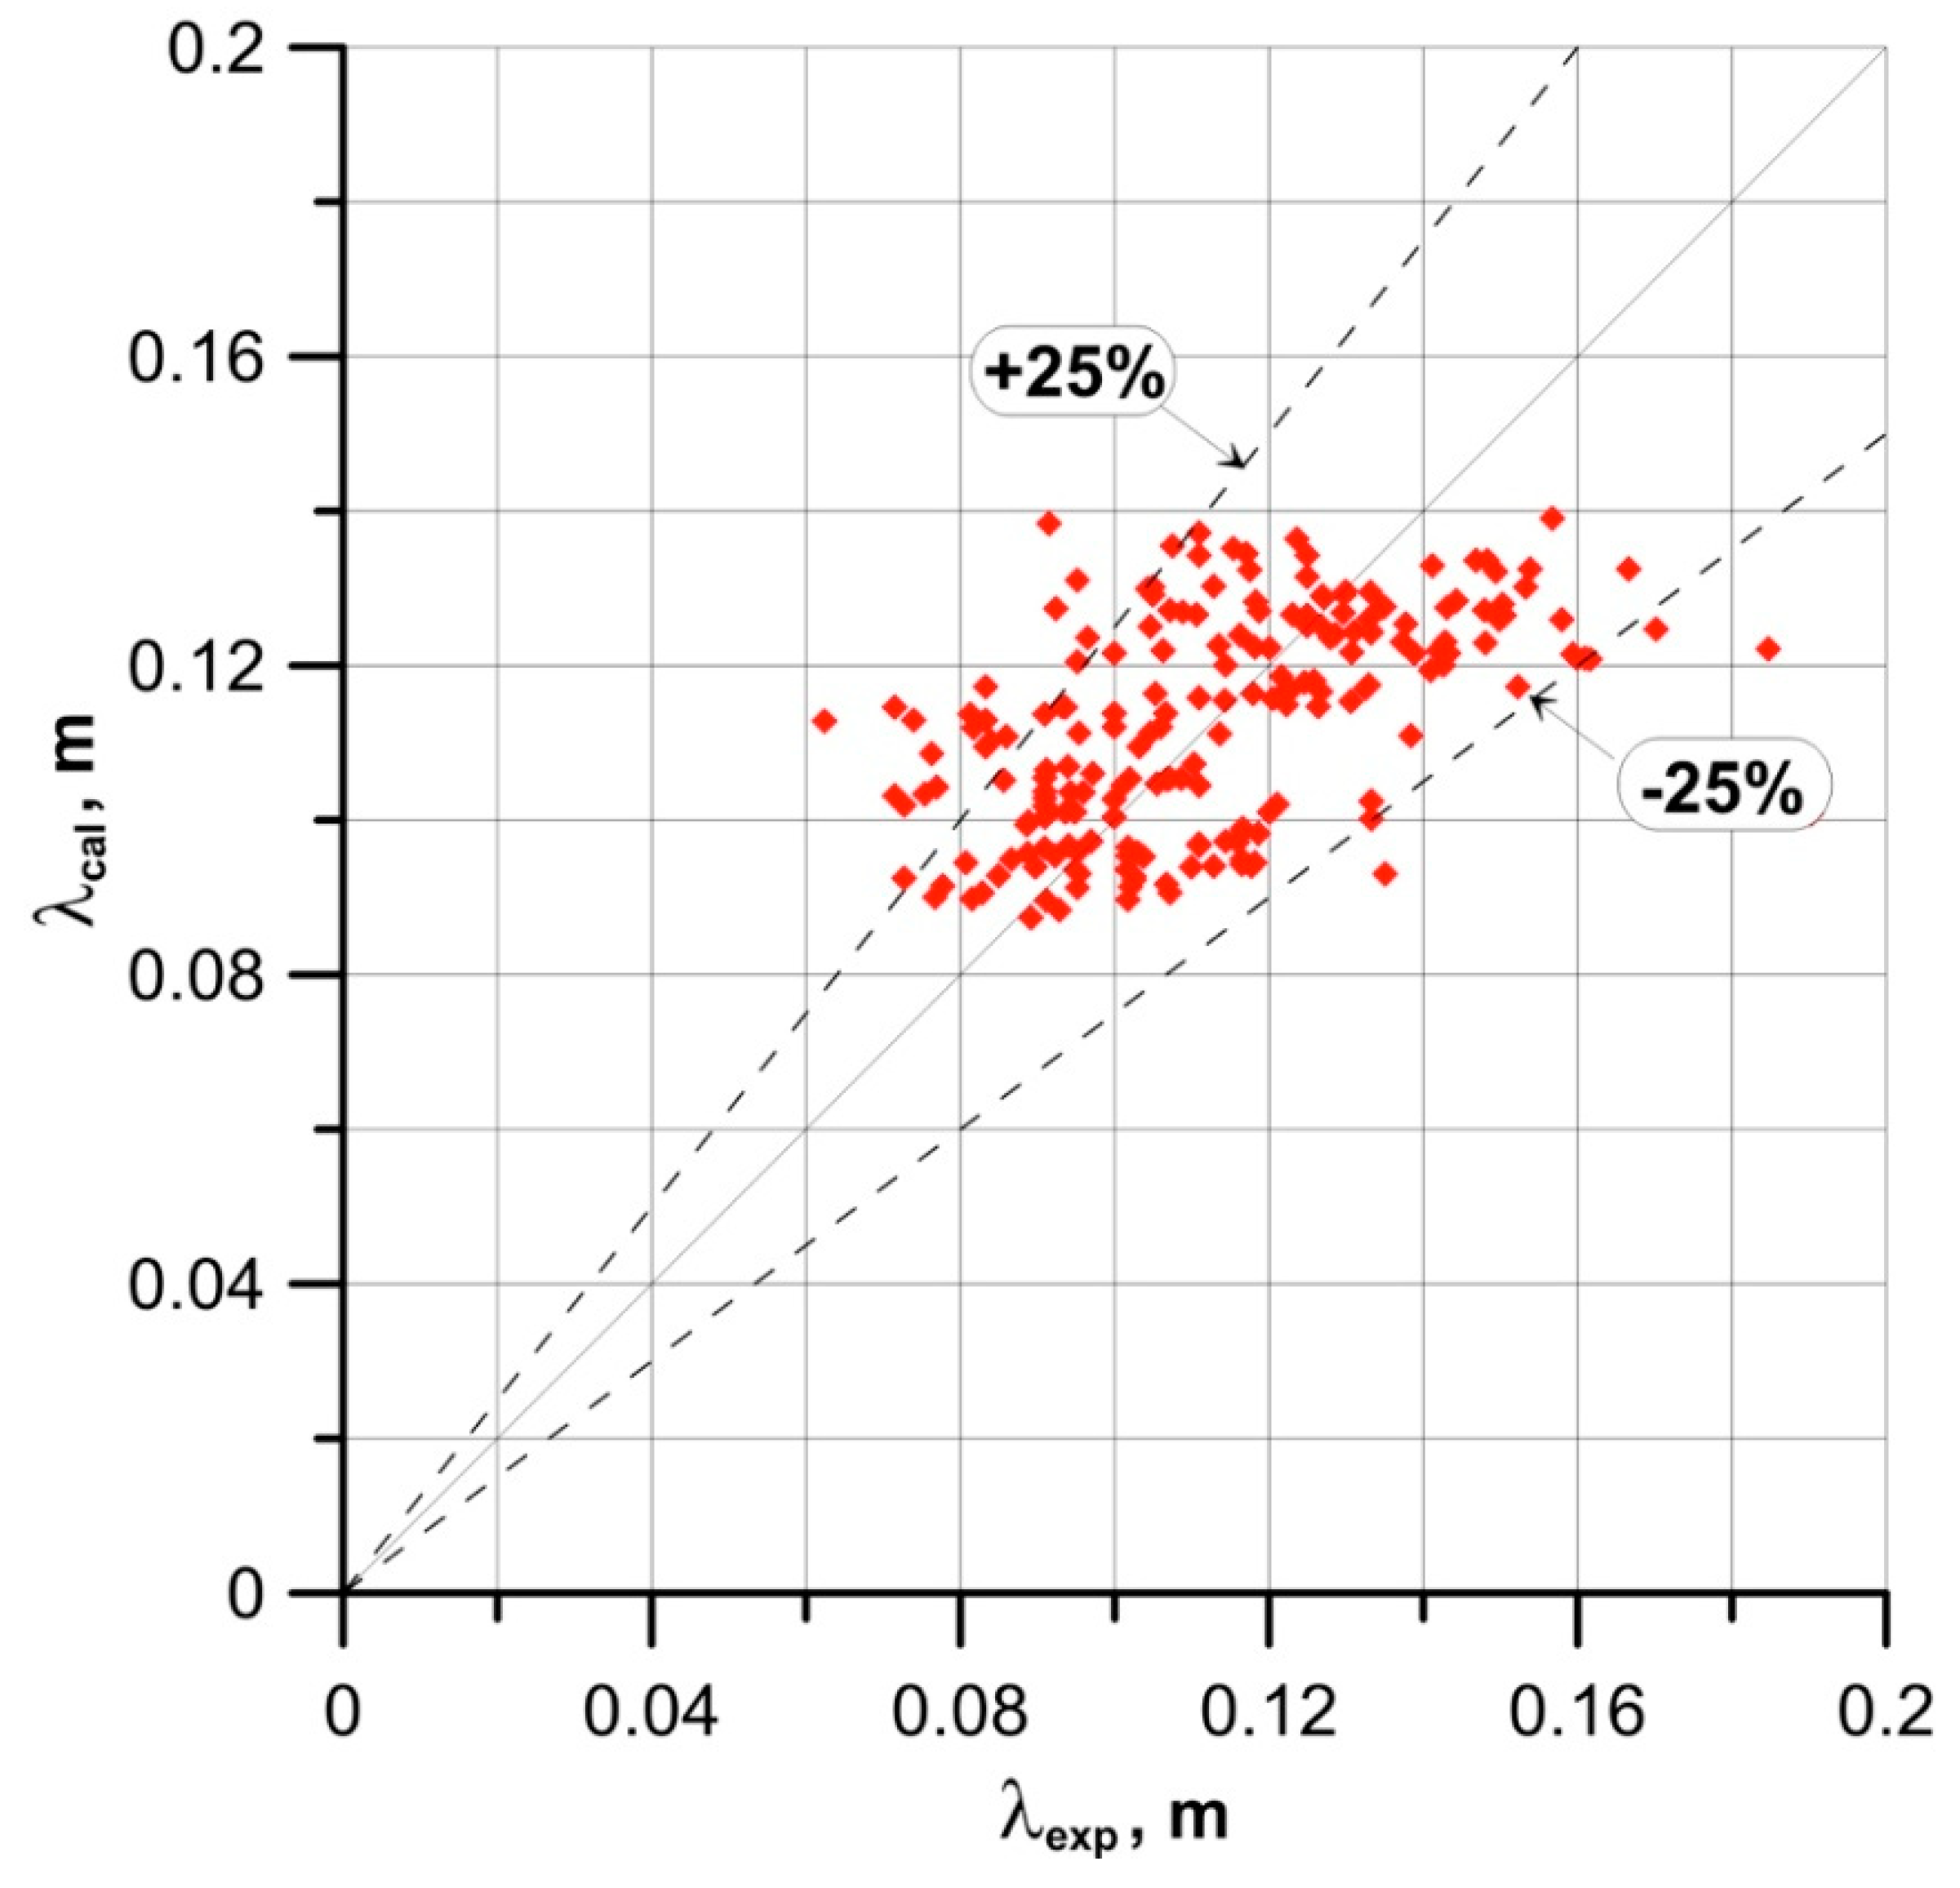
    c j l = 0.348 ( x 1 x ) 0.541 Re g 0.225 Re l 0.053
  • the wavelength, λ:
    λ ϑ z = 4.93 × 10 3 ( x 1 x ) 0.504 Re g 0.471 Re l 0.526
  • the wave amplitude, a:
    a ϑ z = 10.3 · 10 3 ( x 1 x ) 0.232 R e g 0.421 R e l 0.757
    in which: ϑ z = ( η l 2 g ˇ ρ l 2 ) 1 / 3 , x = g g g T = g g g g + g l , Re g = g T xD η g and Re l = g T ( 1 x ) D η l .
Equations (12)–(17) are part of the scientific novelty of the paper. They are the result of additional extensive tests, especially when the dynamic coefficient of viscosity was changed by twice as much. They include, from a functional point of view, practically all parameters characteristic of the two-phase gas–liquid flow conditions (as determined experimentally), including the mass fraction (x) and the Lockhart–Martinelli parameter for both adiabatic and diabatic conditions. They are in agreement with the test results. The modular notation of these equations facilitates their generality which, from the application point of view, makes it easier to use them in essentially all process and design applications.
In comparison to the model described in Table 1, Equations (12)–(17) were verified using a much wider range of variability in the two-phase gas–liquid flow parameters, which is particularly feasible for the twice greater variations in the dynamics of the viscosity coefficient (3.5 Pas). In addition, the relations (12)–(17) of the very viscous liquid flow dynamics—which are part of the description of the ring flow dynamics—are characterized by much higher accuracy (8–10%), compared to the model proposed earlier (Equations (7)–(10) in the work of Czernek [27] and Czernek et al. [28]. They can be fully recommended for use in design work and the analysis of any apparatus with a hydraulically generated liquid layer, as their execution was the subject of this hydrodynamic analysis.
The values of quantities applied to determine the accuracy of the developed relations are summarized in Table 2.
The statistical quantities in the table above apply to the following values:
  • mean relative error
    MRE = 1 N k = 1 N Y i , cal Y i , exp Y i , exp 100 % ,
  • mean absolute error
    MAE = 1 N k = 1 N | Y i , cal Y i , exp Y i , exp | 100 % ,
  • mean standard deviation
    MSD = ( 1 N k = 1 N ( Y i , cal Y i , exp Y i , exp MRE ) 2 ) 0.5 100 % .
With the purpose of illustrating the range of the variability of parameters described by these equations, Figure 10, Figure 11, Figure 12 and Figure 13 presented a comparison between the results derived from calculations with the experimental data. When we take into account the comparison of the measured and calculated values of individual quantities and the corresponding results of the statistical calculations found in Table 2, we can state that the newly developed equations are characterized by a very high level of accuracy. As we can conclude from the results, more than 90% of the experimental points are within the range of ±25% of the mean relative error, which is a major achievement in calculating the analyzed quantities measured during two-phase gas-liquid flow.
The considerable level of the conformity between the results of the calculations and experimental data encouraged the authors to undertake a study into how the variations in viscosity along the flow path affect individual values. The results of these calculations are presented in Figure 14, Figure 15, Figure 16 and Figure 17, which provide a graphical interpretation of Equations (14)–(17). According to the authors, their placement in the paper allows for qualitative assessment of the influence of selected quantities on the characteristic parameters of the wavy liquid film at the flow with the gaseous phase.
These results were confirmed by the results of the experiments. As a result of the application of a transparent measurement channel, changes in the wavy characteristics of the interfacial surface resulting from the changes in the physicochemical properties were identified along the flow path, as exemplified in Figure 18. It can be clearly seen that the decrease in the viscosity caused by heating the channel led to a decrease in the frequency of the occurrence of waves of their velocity and amplitude and an increase in their length.
The distribution of waves in the channel cross-section was assessed on the basis of the registration of images captured by an optical endoscope. Examples of images of the interfacial surface are presented in Figure 19.
Bearing in mind that the interfacial surface forms one of the most important quantities that determine the conditions of heat and mass exchange during two-phase gas–liquid flow, an attempt was made to determine it. For this purpose, on the basis of the obtained waveforms of variations in the liquid film thickness as a function of time, the state of development of this surface was determined by numerical calculations. In such a case, this value was affected by the film thickness and not only by the conditions of the wave characteristics; hence, the search for a relation that can be applied for the description of the interface and which focuses on demonstrating the variations of the interface (F2F), in relation to the surface characteristic for a liquid film thickness equal to zero (i.e., the internal surface of the channel Fp).
In addition, as was done with regard to the liquid film thickness, determination of the interfacial surface during two-phase gas–liquid flow was applied using two alternative relations, namely:
  • for adiabatic conditions
    F 2 F F p = 47.3 ( β 1 β ) 0.636 Re g 0.683 Re z 0.109
  • relative to the mass volume fraction—a case that is beneficial for conditions accompanied by heat exchange:
    F 2 F F p = 2.85 × 10 3 ( x 1 x ) 0.627 R e g 0.669 R e l 0.111
Comparison of the calculated values based on (21) and (22) with the results of measurement demonstrated that 85% of points were located within ±15% of the relative error (in both cases, the correlation coefficient was above 0.95). This is demonstrated for the relation in (22) by the graph in Figure 20 to provide an example.
Hence, we can conclude that the relations can be adequately applied for the description of interfacial surface, which occurs in the conditions of downstream co-current gas—very viscous liquid flow in vertical pipes.
To provide a complement to these results, Figure 21 shows the results of the calculation involving the distribution of interfacial surface which arise out of the spatial representation of Equation (22) in the following co-ordinate system ( F 2 F F p ) Re g = f ( x 1 x ; Re l ) .
We note that the important parameters affecting the increase in the development of interfacial surface include the mass fraction of the gas phase and the resulting Reynolds number of the liquid.

4. Conclusions

In this paper, our measurement results, obtained through the various applications of the measuring system, demonstrate the capabilities of research concerned with identifying the structures of downward gas-liquid two-phase flow and precise determination of the thickness of liquid films with varying degrees of interfacial surface wave characteristics:
  • The research was conducted in an unprecedented range of liquid viscosity of 0.046–3.5 Pas.
  • The research demonstrated that the applied methodology for measuring the identification of liquid film parameters in a two-phase gas–liquid flow can be successfully applied to assessment of the interface between the length of pipes of a given apparatus, which plays an important role for the implementation of many operations related to the use of film apparatus in heat and mass transfer processes.
  • It was found that the nature of the liquid film in two-phase air–oil flow can be very diverse. The size and nature of the resulting waves of varying amplitude and frequency depend on both the flux and viscosity of the liquid and the velocity of the gas phase.
  • The designed original measuring system is also fully feasible for testing the level of interference of liquid films by determining the velocity, length and amplitude of the waves formed.
  • The research resulted in the development of new dependencies that take into account the influence of selected thermal and flow parameters (including mass fraction) on the values of volumes that are specific for very viscous liquid film flows.
  • The dependencies developed as a result of examining the effect of these parameters on the quantities characteristic of flowing liquid films can be fully applied for defining the operation of apparatuses with hydraulically generated liquid films.
  • These dependencies improved the accuracy of calculation by 8–10%.
  • The new apparatus system outlined in the paper provides the best opportunities to conduct research in the field of testing the dynamics of films of oil liquids and other dielectric liquids with a high degree of monochromatic radiation absorption.
Due to the non-invasive measuring technique applied to measure the characteristic quantities of the liquid films formed, the measuring system with optical probes is very good for diagnosing the operations of devices in which such flows are utilized.

Author Contributions

Conceptualization, K.C. and S.W.; methodology, K.C. and S.W.; software, K.C. and S.W.; validation, K.C. and S.W.; formal analysis, K.C. and S.W.; investigation, K.C. and S.W.; resources, K.C. and S.W.; data curation, K.C. and S.W.; writing-original draft preparation, K.C. and S.W.; writing-review and editing, K.C. and S.W.; visualization, K.C. and S.W.; supervision, K.C. and S.W.; project administration, K.C. and S.W.; funding acquisition, K.C. and S.W. All authors have read and agreed to the published version of the manuscript.

Funding

This research was funded by Opole University of Technology grant number [NBS-8/19].

Conflicts of Interest

The authors declare no conflict of interest.

Nomenclature

Fsurface, m2
ReReynolds number
WeWeber number
Xparameter of Lockhart-Martinelli
aamplitude of wave, m
cvelocity of wave, m/s
ddiameter, m
ffrequency of wave, 1/s
gmass flux, kg/(m2s)
ğgravitational acceleration, m/s2
jvelocities, m/s
sliquid film thickness, m
ttemperature, deg
xmass fraction, -
Γwetting rate, kg/(ms)
βvolume fraction, -
ηviscosity, Pas
ϑzequivalent linear dimension, m
λlength of wave, m
ρdensity, kg/m3
Subscripts and superscripts
0superficial values,
2Ftwo-phase flow,
ggas,
lliquid,
ogravity flow liquids,
ppipe internal surface area,
Ttotal flow
zequivalent values for liquids.

References

  1. Hibiki, T.; Ishii, M. Interfacial area concentration in steady fully-developed bubbly flow. Int. J. Heat Mass Transf. 2001, 44, 3443–3461. [Google Scholar] [CrossRef]
  2. Ozar, B.; Dixit, A.; Chen, S.W.; Hibiki, T.; Ishii, M. Interfacial area concentration in gas–liquid bubbly to churn-turbulent flow regime. Int. J. Heat Fluid Flow 2012, 38, 168–179. [Google Scholar] [CrossRef]
  3. Shen, X.; Deng, B. Development of interfacial area concentration correlations for small and large bubbles in gas-liquid two-phase flows. Int. J. Multiph. Flow 2016, 87, 136–155. [Google Scholar] [CrossRef]
  4. Shen, X.; Hibiki, T. Interfacial area concentration in gas–liquid bubbly to churn flow regimes in large diameter pipes. Int. J. Heat Fluid Flow 2015, 54, 107–118. [Google Scholar] [CrossRef]
  5. Padilla, M.; Revellin, R.; Wallet, J.; Bonjour, J. Flow regime visualization and pressure drops of HFO-1234yf, R-134a and R-410A during downward two-phase flow in vertical return bends. Int. J. Heat Fluid Flow 2013, 40, 116–134. [Google Scholar] [CrossRef]
  6. Gabriel, S.; Schulenberg, T.; Albrecht, G.; Heiler, W.; Miassoedov, A.; Kaiser, F.; Wetzel, T. Optical void measurement method for stratified wavy two phase flows. Exp. Therm. Fluid Sci. 2018, 97, 341–350. [Google Scholar] [CrossRef]
  7. Pietrzak, M.; Witczak, S. Flow patterns and void fractions of phases during gas–liquid two-phase and gas–liquid–liquid three-phase flow in U-bends. Int. J. Heat Fluid Flow 2013, 44, 700–710. [Google Scholar] [CrossRef]
  8. Ebrahimi-Mamaghani, A.; Sotudeh-Gharebagh, R.; Zarghami, R.; Mostoufi, N. Dynamics of two-phase flow in vertical pipes. J. Fluids Struct. 2019, 87, 150–173. [Google Scholar] [CrossRef]
  9. Liu, H.; Pan, L.-M.; Hibiki, T.; Zhou, W.; Ren, Q.-Y.; Li, S.-S. One-dimensional interfacial area transport for bubbly two-phase flow in vertical 5×5 rod bundle. Int. J. Heat Fluid Flow 2018, 72, 257–273. [Google Scholar] [CrossRef]
  10. Hamidi, M.J.; Karimi, H.; Boostani, M. Flow patterns and heat transfer of oil-water two-phase upward flow in vertical pipe. Int. J. Therm. Sci. 2018, 127, 173–180. [Google Scholar] [CrossRef]
  11. Smith, T.R.; Schlegel, J.P.; Hibiki, T.; Ishii, M. Two-phase flow structure in large diameter pipes. Int. J. Heat Fluid Flow 2012, 33, 156–167. [Google Scholar] [CrossRef]
  12. Shen, X.; Schlegel, J.P.; Hibiki, T.; Nakamura, H. Some characteristics of gas–liquid two-phase flow in vertical large-diameter channels. Nucl. Eng. Des. 2018, 333, 87–98. [Google Scholar] [CrossRef]
  13. Shen, X.; Sun, H.; Deng, B.; Hibiki, T.; Nakamura, H. Experimental study on interfacial area transport of two-phase bubbly flow in a vertical large-diameter square duct. Int. J. Heat Fluid Flow 2017, 67, 168–184. [Google Scholar] [CrossRef]
  14. Shen, X.; Hibiki, T.; Ono, T.; Sato, K.; Mishima, K. One-dimensional interfacial area transport of vertical upward bubbly flow in narrow rectangular channel. Int. J. Heat Fluid Flow 2012, 36, 72–82. [Google Scholar] [CrossRef]
  15. Ju, P.; Yang, X.; Schlegel, J.P.; Liu, Y.; Hibiki, T.; Ishii, M. Average liquid film thickness of annular air-water two-phase flow in 8×8 rod bundle. Int. J. Heat Fluid Flow 2018, 73, 63–73. [Google Scholar] [CrossRef]
  16. Liu, Y.; Cui, J.; Li, W.Z. A two-phase, two-component model for vertical upward gas–liquid annular flow. Int. J. Heat Fluid Flow 2011, 32, 796–804. [Google Scholar] [CrossRef]
  17. Dang, Z.; Wang, G.; Ju, P.; Yang, X.; Bean, R.; Ishii, M.; Bajorek, S.; Bernard, M. Experimental study of interfacial characteristics of vertical upward air-water two-phase flow in 25.4 mm ID round pipe. Int. J. Heat Mass Transf. 2017, 108, 1825–1838. [Google Scholar] [CrossRef]
  18. Gao, Y.; Cui, Y.; Xu, B.; Sun, B.; Zhao, X.; Li, H.; Chen, L. Two phase flow heat transfer analysis at different flow patterns in the wellbore. Appl. Therm. Eng. 2017, 117, 544–552. [Google Scholar] [CrossRef]
  19. Jiang, C.; Bai, B.F. Flow patterns and pressure drop of downward two-phase flow in a capsule-type plate heat exchanger. Exp. Therm. Fluid Sci. 2019, 103, 347–354. [Google Scholar] [CrossRef]
  20. Julia, J.E.; Ozar, B.; Jeong, J.-J.; Hibiki, T.; Ishii, M. Flow regime development analysis in adiabatic upward two-phase flow in a vertical annulus. Int. J. Heat Fluid Flow 2011, 32, 164–175. [Google Scholar] [CrossRef]
  21. Juliá, J.E.; Hibiki, T. Flow regime transition criteria for two-phase flow in a vertical annulus. Int. J. Heat Fluid Flow 2011, 32, 993–1004. [Google Scholar] [CrossRef]
  22. Lee, J.; O’Neill, L.E.; Lee, S.; Mudawar, I. Experimental and computational investigation on two-phase flow and heat transfer of highly subcooled flow boiling in vertical upflow. Int. J. Heat Mass Transf. 2019, 136, 1199–1216. [Google Scholar] [CrossRef]
  23. Qiao, S.; Mena, D.; Kim, S. Inlet effects on vertical-downward air–water two-phase flow. Nucl. Eng. Des. 2017, 312, 375–388. [Google Scholar] [CrossRef]
  24. Xue, Y.; Li, H.; Hao, C.; Yao, C. Investigation on the void fraction of gas–liquid two-phase flows in vertically-downward pipes. Int. Commun. Heat Mass Transf. 2016, 77, 1–8. [Google Scholar] [CrossRef]
  25. Baranovskii, E.S.; Domnich, A.A. Model of a Nonuniformly Heated Viscous Flow through a Bounded Domain. Differ. Equations 2020, 56, 304–314. [Google Scholar] [CrossRef]
  26. Cimatti, G. The Poiseuille Flow in a Pipe with Temperature Dependent Viscosity and Prescribed Flow Rate. J. Math. Fluid Mech. 2009, 11, 415–427. [Google Scholar] [CrossRef]
  27. Czernek, K. Hydrodynamic Aspects of Thin-Film Apparatus Design for Very Viscous Liquids; Oficyna Wydawnicza Politechniki Opolskiej: Opole, Poland, 2013; ISBN 8364056158. [Google Scholar]
  28. Czernek, K.; Filipczak, G.; Witczak, S. Annular Flow Study upon Two Phase Air-Very Viscous Liquid Flow. In Proceedings of the 5th International Conference on Transport Phenomena in Multiphase Systems, HEAT, Bialystok, Poland, 20 June–3 July 2008; pp. 271–276. [Google Scholar]
Figure 1. Test stand diagram: 1, PC; 2, oil tank with mixer and heater; 3, oil pump; 4, air compressor; 5, pressure reducing valve; 6, laser knife; 7, camera; 8, laser illumination; 9, light detector; 10, set of oil rotameters; 11, set of air rotameters; 12, measurement channel comprising laser illumination; 13, measurement channel comprising laser knife.
Energies 13 05709 g001
Figure 2. Graphical illustration of Equation (2) describing the effect of gas flow rate on liquid film thickness during two-phase flow and film thickness in the case of gravitational run-off.
Energies 13 05709 g002
Figure 3. Flow patterns accompanying downward co-current gas–very viscous liquid flow. AL, smooth film; AVLW, film with very light waves; ALW, film with light waves; AW, wavy film; ASW, very wavy film; AVSW, strong wavy film; APIH, transient hydraulic flow; AH, hydraulic film.
Energies 13 05709 g003
Figure 4. Determination of quantities characterizing wavy flow of the liquid film.
Energies 13 05709 g004
Figure 5. Results of studies and calculations of the condition of liquid film thickness and its distribution. (a), liquid film thickness for Reg = 456; (b), distribution thickness for Reg = 456; (c), liquid film thickness for Reg = 12766; (d), distribution thickness for Reg = 12766.
Energies 13 05709 g005
Figure 6. Results of experiments and calculations of wave frequency f = f(Rez, Reg) accompanying annular gas–very viscous liquid flow.
Energies 13 05709 g006
Figure 7. Results of experiments and calculations of wave velocity c = f(Rez, Reg) accompanying annular gas-very viscous liquid flow.
Energies 13 05709 g007
Figure 8. Results of experiments and calculations of dependencies between wavelength λ = f(Rez, Reg) accompanying annular gas-very viscous liquid flow.
Energies 13 05709 g008
Figure 9. Results of experiments and calculations of dependencies between the mean reduced value of the wave amplitude a/ϑz = f(Rez, Reg) accompanying annular gas-very viscous liquid flow.
Energies 13 05709 g009
Figure 10. Comparison of measured and calculated values of wave frequency accompanying two-phase gas-very viscous liquid flow for relation (14).
Energies 13 05709 g010
Figure 11. Comparison of measured and calculated values of wave velocity accompanying two-phase gas-very viscous liquid flow for relation (15).
Energies 13 05709 g011
Figure 12. Comparison of measured and calculated values of wave length accompanying two-phase gas-very viscous liquid flow for relation (16).
Energies 13 05709 g012
Figure 13. Comparison of measured and calculated values of wave amplitude accompanying two-phase gas-very viscous liquid flow for relation (17).
Energies 13 05709 g013
Figure 14. Results of calculations of wave frequency accompanying two-phase gas-very viscous liquid flow for relation (14). (a) depending on Rez value; (b) depending on the viscosity value.
Energies 13 05709 g014
Figure 15. Results of calculations of wave velocity accompanying two-phase gas-very viscous liquid flow for relation (15). (a) depending on Rez value; (b) depending on the viscosity value.
Energies 13 05709 g015
Figure 16. Results of calculations of wavelength accompanying two-phase gas-very viscous liquid flow for relation (16). (a) depending on Rez value; (b) depending on the viscosity value.
Energies 13 05709 g016
Figure 17. Results of calculations of wave amplitude accompanying two-phase gas-very viscous liquid flow for relation (17). (a) depending on Rez value; (b) depending on the viscosity value.
Energies 13 05709 g017
Figure 18. Changes in the wavy characteristics of interfacial surface resulting from the variations in liquid properties accompanying its heating for jl = 0.014 m/s, and ηl = 0.37–0.90 Pas. (a) jg = 0.8 m/s; (b) jg = 1.12 m/s; (c) jg = 1.55 m/s.
Energies 13 05709 g018
Figure 19. Effect of flow parameters on wave formation in oil film with the viscosity of 0.335 Pas.
Energies 13 05709 g019
Figure 20. Comparison of variations in the relative value of interfacial surface in relation to internal surface area of the pipe, measured and calculated on the basis of (22).
Energies 13 05709 g020
Figure 21. Representation of calculated interfacial surface based on Equation (22).
Energies 13 05709 g021
Table 1. Reference methods applied for calculation of parameters of two-phase gas–very viscous liquid flow [27,28].
No.Parameter and EquationEquation No.
1.Film thickness, s(6)
s s 0 = 1 1 + 5.68 · 10 3 Re z 0.132 Re g 0.471
2.Wave frequency, f(7)
f ϑ z w l = 0.9177 ( β 1 β ) 0.344 Re g 0.272 Re z 0.429
3.Wave velocity, c(8)
c w l = 141.1 ( β 1 β ) 0.848 Re g 0.725 Re z 0.112
4.Wave intervals, λ(9)
λ ϑ z = 65.23 We z 0.373 ( Re z 1 + Re g ) 0.029
5.Wave amplitude, a(10)
a ϑ z = 0.0222 ( β 1 β ) 0.476 Re g 0.109 Re z 0.744
6.Surface of inter-phase boundary development(11)
F 2 F F p = 46.73 ( β 1 β ) 0.635 Re g 0.679 Re z 0.108
Table 2. Statistical quantities characterizing parameters of liquid film wave formation.
EquationCorrelation Coefficient (r)Values of Statistical Data (%)
MREMAEMSD
(14)0.9866−0.9512.315.4
(15)0.98560.367.910.4
(16)0.9344−1.0814.618.6
(17)0.9559−0.8118.624.1
Publisher’s Note: MDPI stays neutral with regard to jurisdictional claims in published maps and institutional affiliations.

