Article

Cooling Panel with Integrated PCM Layer: A Verified Simulation Study

by
Renars Millers
1,*,
Aleksandrs Korjakins
2,
Arturs Lešinskis
1 and
Anatolijs Borodinecs
1
1
Institute of Heat, Gas and Water Technology, Riga Technical University, Kalku street 1, Riga LV-1658, Latvia
2
Institute of Materials and Structures, Riga Technical University, Kalku Street 1, Riga LV-1658, Latvia
*
Author to whom correspondence should be addressed.
Energies 2020, 13(21), 5715; https://doi.org/10.3390/en13215715
Submission received: 23 August 2020 / Revised: 5 October 2020 / Accepted: 22 October 2020 / Published: 2 November 2020
(This article belongs to the Special Issue CFD Simulation in Energy Efficiency and Building Energy Saving)

Abstract

:
The focus of this research paper is to develop a verified simulation model for a cooling panel with integrated phase-change materials (PCMs)—a stainless steel panel filled with PCM and integrated hydronic piping circuit. This solution is targeted for passive cooling of residential buildings in Baltic Sea region that experience overheating for most of the year due to highly insulated building envelopes and extensive glazing—a phenomena for nearly zero energy buildings (NZEBs). This approach aims to maintain comfortable indoor temperature all year round by passive means—free-cooling, adiabatic (evaporative) cooling or limited mechanical cooling. The simulations are performed with IDA ICE 4.8 and the measurements for simulation model verification are collected from a test chamber. The results show that reasonable agreement can be reached for simulated and experimentally measured data.

1. Introduction

For the last few decades, the need for cooling of indoor premises has risen in Central European as well as Northern European climates. This phenomena is caused by highly insulated building envelopes (especially with lightweight structures [1]), higher thermal comfort levels required by occupants, and the climate change and thermal island effect in larger cities [2,3,4,5]. Another reason for overheating in buildings is the use of large glazed surfaces that in some cases are required to achieve optimal daylight levels [6,7]. According to the estimations this trend will continue. It is reflected by the fact that the worldwide final energy consumption for cooling has more than tripled from 1990 to 2016 and according to estimations the energy consumed by cooling equipment will triple again by 2050 [8]. Particularly large increases in cooling energy growth have been observed in the residential sector. Currently, mechanical cooling is responsible for approximately 20% of total energy consumption in buildings in Europe [8].
Numerous studies have shown that the use of PCMs in principle can reduce overheating risk or in some cases eliminate the need for mechanical cooling at all. The use of PCM storage and thermally activated building structures (TABS) in combination with passive cooling techniques such as nocturnal radiant cooling, adiabatic cooling, and night cooling can hold the potential for limiting the energy consumption of cooling systems [9,10].
One of the solutions is to install PCMs in building structures for passive application without thermal activation (no integrated circuit). In this case, the PCM is recharged by using night ventilation; however, in most cases this approach does not reach the full potential of the thermal storage. Due to limited area of contact and limited heat transfer coefficients the PCM fails to solidify [11,12,13]. Nevertheless, other studies have reported that it is possible to achieve significant 73% energy saving if night ventilation and mechanical cooling combined with PCM-impregnated gypsum boards are operated with a proper control strategy. However, the same research team also indicated that if proper control strategy is not adapted, the cooling energy consumption can even increase when applying PCMs [14]. Further attempts have been carried out to integrate PCMs in external parts of façades to accumulate heating energy with Fresnel lens as a passive heating system for NZEB, but this approach requires further research [15].
Another commonly applied method is the use of PCMto air heat exchanger that can be integrated in a hybrid ventilation and heating/cooling system. In this case, the problem of full solidification and melting can be overcome due to greatly increased heat transfer coefficients between the air and the PCM material as well as the heat transfer area by choosing a proper thickness of air passages and PCM layers [16,17,18]. These types of systems mainly rely on recharging the PCM overnight. Thus, the PCM storage shall have the thermal capacity to store the cooling energy for a full day. The required PCM storage can be of a significant size for warm climates; for instance, some authors have reported that 700 kg PCM storage for a 100 m² residence is necessary to achieve the optimal indoor climate [19]. Moreover, it has been reported that in order to undergo full solidification of the PCM storage, the air flow rates in the heat exchangers have to be greatly increased. This can cause high fan energy consumption.
The third commonly adapted method is to use TABS or cooling units with integrated PCMs such as ceiling panels with PCM layers or slabs with capsulated PCMs. The aforementioned units are usually thermally activated with a hydronic circuit, and cooling energy is supplied from a central cooling plant. There has also been an effort to use a PCM slurry as a heat transfer media that is pumped through a cooling panel. In this case, the slurry consists of water and microencapsulated PCM particles [20]. However, the most common application is to use a hydronic circuit that is in direct contact with encapsulated PCM or immersed in raw PCM.
A team from Switzerland [21] published a paper regarding a thermally activated PCM panel that consists of a 50 mm layer of microencapsulated PCM mixed with gypsum and with integrated capillary circuit. In addition, aluminum fins were used to increase the thermal conductivity of the layer. The reached thermal storage capacity of the investigated panel was 0.3 kWh/m².
Furthermore, a team in Germany [22,23] developed and tested two types of ceiling panels with a microencapsulated PCM layer above the hydronic circuit as the first type of cooling panel, and below the hydronic circuit as the second type of cooling panel. The measured passive cooling powers were from 8 W to 17 W per square meter of ceiling area for globe temperatures from 24 °C to 27 °C. The phase change temperature for the investigated PCM was between 22 °C and 24 °C.
A similar approach was tried by a Latvian research team [24,25] that performed an extensive numerical analysis using computational fluid dynamics (CFD) modeling for steel panels with raw PCM. The estimated thermal storage capacity for the panel was 0.59 kWh/m² panel area and the phase change temperature was around 23 °C. The team modeled a room for 3 scenarios:
  • Room without PCM panels;
  • Room with passive PCM panels;
  • Room with active PCM panels.
The team concluded that using thermally active PCM panels, the maximum temperature for the analyzed period in the room can be nearly 7 °C lower if compared with a room with no PCM panels. It was also concluded that only 66% of the thermal storage capacity was used.
The studied thermally activated cooling panel is designed to operate with high cooling water temperatures in order to utilize evaporative cooling equipment (cooling tower). Adiabatic (evaporative) cooling technology can be particularly effective in Baltic Sea region due to low annual wet bulb temperatures in major cities in this region (Table 1).
However, there is a lack of reliable methods to dynamically simulate thermally activated structures with integrated PCM materials. CFD simulation tools can be successfully applied to solve this problem but CFD simulations can be very labor intensive and require extensive computing power if it is necessary to simulate many rooms for an extended period of time (a whole year energy analyses).

Goals and Objectives

This study focuses on the development and verification of a simulation model for a cooling panel with integrated PCM—a stainless steel container filled with PCM and an integrated hydronic circuit. This model could further be used for faster, simpler, more accurate energy modeling and heating ventilation and air conditioning HVAC system sizing.
There are three main objectives of this study:
  • To perform a series of experiments with PCM panels in a test chamber;
  • To develop a validated simulation model of the PCM panel using IDA ICE 4.8 [27,28] and measurements from the test chamber;
  • To perform a simulation case study using the validated simulation model of the PCM panel and compare it with the results from other similar studies.

2. Materials and Methods

During the research activities phase a test chamber was built in order to validate an IDA ICE simulation model for two cases:
  • A base case with no cooling panel and no phase change materials present in the test chamber;
  • A case with a PCM cooling panel with integrated hydronic circuit and a cooling water flow.
The cooling panel is filled with RUBITHERM© RT22HC phase change material. This particular material has a peak latent energy of phase change at around 22–23 °C; however, the full temperature range where the phase change takes place is between 14 and 29 °C.
After the development of a simulation model and validation against results from the test chamber, the performance of the simulation model was compared with results from another similar simulation study done by a different research team with different simulation tools [24].

2.1. Test Chamber

To carry out laboratory tests, an experimental chamber was constructed for this experiment (Figure 1). The internal dimensions of the chamber are 1.93 × 0.79 × 1.52 m (L × W × H). The chamber was constructed of the following materials:
  • side walls of the chamber (arranged from inside to outside):
    wood chip board (12 mm);
    wooden studs with mineral wool insulation (100 mm);
    plywood board (12 mm);
  • front and back walls of the chamber (arranged from inside to outside):
    plywood board (12 mm);
    wooden studs with mineral wool insulation (100 mm);
    plywood board (12 mm);
  • roof of the chamber (arranged from inside to outside):
    plywood board (12 mm);
    expanded polystyrene insulation (50 mm)
    gypsum board (13 mm)
  • floor of the chamber (arranged from inside to outside):
    gypsum board (13 mm);
    expanded polystyrene insulation (50 mm);
    plywood board (12 mm);
  • glazed door:
    U value for the glazing 1.1 W/m2K;
    U value for the frame 3.0 W/m2K (37% of door area).
However, the envelope of the chamber is not homogenous and contains thermal bridges; thus, the heat loss coefficient could not be calculated with reasonable precision and had to be measured.
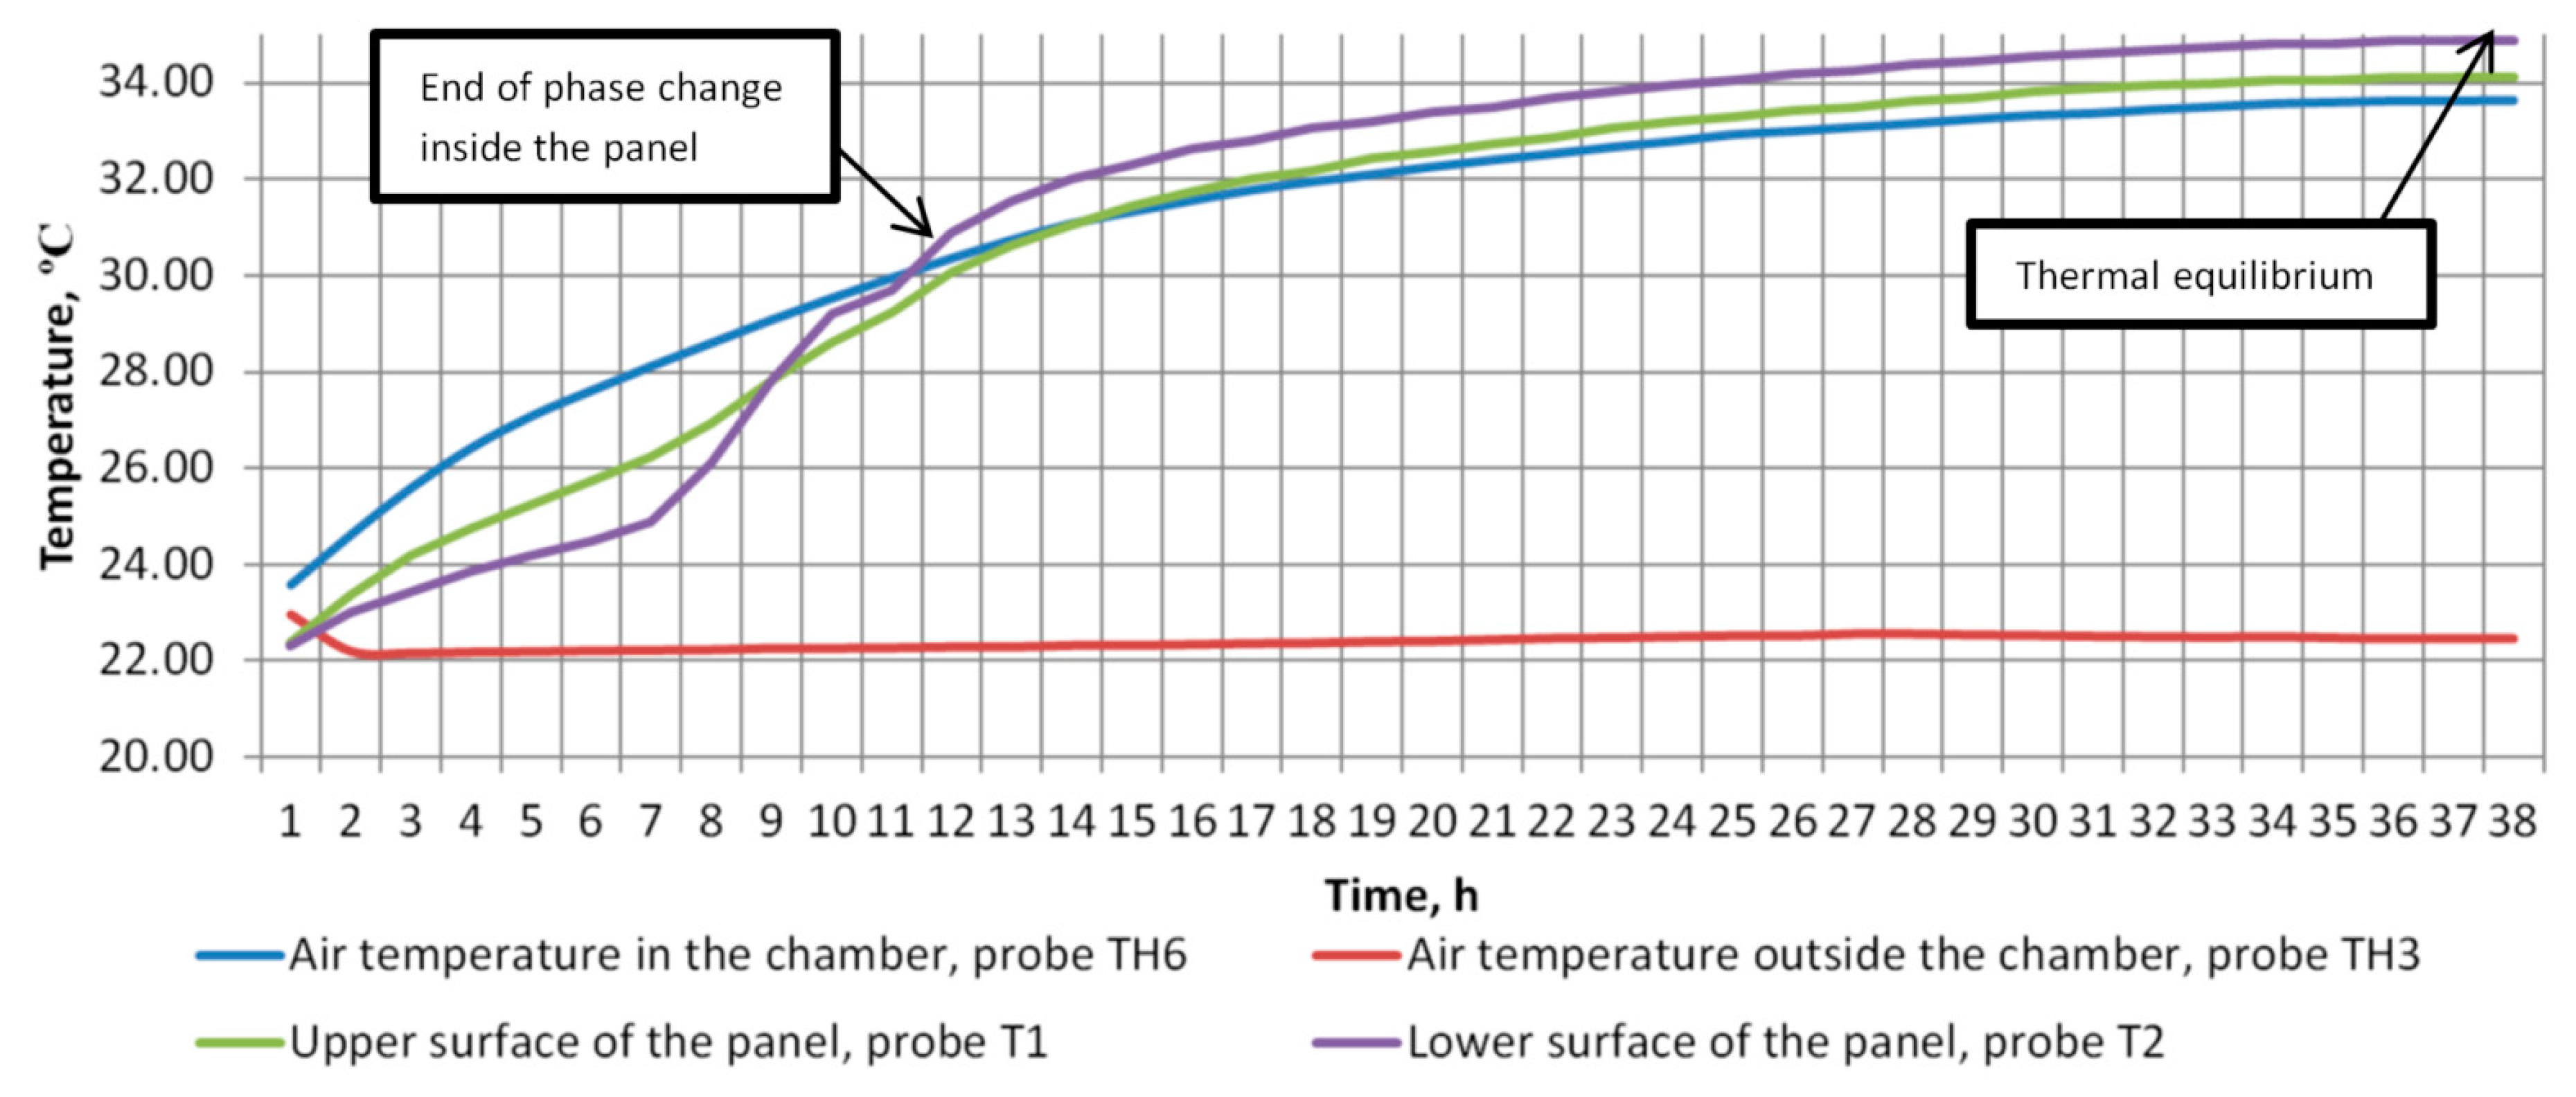
The heat loss coefficient was indirectly measured by inserting a heat source with a known heating capacity of 90.1 W inside the chamber, and the temperatures inside and outside of the chamber were measured. When a thermal equilibrium was reached (Figure 2) the heat loss coefficient (W/K) of the chamber was calculated using the temperature difference between the inside and outside of the chamber and the power of the heat source (refer to Equation (1)). The calculated heat loss coefficient of the chamber was Ht = 8.06 W/K.
H t = P h ( T c T s )
where:
  • Ht—Heat loss coefficient, W/K
  • Ph—Power of the heat source, W
  • Tc—Temperature inside the chamber, K
  • Ts—Temperature of the surrounding environment, K
The chamber was equipped with 8 temperature/humidity (See Figure 1) probes at various locations of the chamber:
  • T1—Surface temperature sensor on the upper face of the panel;
  • T2—Surface temperature sensor on the lower face of the panel;
  • TH3—Air temperature and humidity sensor outside the chamber;
  • T4—Surface temperature sensor for the supply pipe of the panel;
  • T5—Surface temperature sensor for the return pipe of the panel;
  • TH6—Air temperature and humidity sensor in the middle part of the chamber;
  • TH7—Air temperature and humidity sensor in the lower part of the chamber;
  • TH8—Air temperature and humidity sensor in the upper part of the chamber.
The accuracy for temperature sensors were ±0.5 °C in range from −30 °C to 90 °C, the accuracy for humidity sensors were ±2% in range from 5% to 95%.

2.2. The Cooling Panel

The cooling panel consists of a stainless-steel container with internal hydronic circuit (Figure 3). 80% of panel volume was filled with RUBITHERM© RT22HC phase change material. According to technical properties given by the manufacturer, the heat storage capacity of the PCM is 190 kJ/kg in the temperature range from 14 to 29 °C, which in theory would give the panel a heat storage capacity of around 1.48 kWh/m2 panel area. However, the operational temperature range of the panel will usually be from 19 to 24 °C. That gives a useful heat storage capacity of the PCM only 140 kJ/kg and the heat storage capacity of the panel 1.09 kWh/m2 panel area. At the beginning of each experiment, the PCM can be considered at a solid state (below the temperature of peak partial phase-change enthalpy).
Since the used commercial PCM brand is a mixture of different phase change materials, the phase change does not happen at one constant temperature but rather at a certain temperature range (described in the previous paragraph).
It is important to note that, during the measurement of Ht value, the upper and lower surfaces had a different temperature trend (Figure 2). This can be explained by the fact that the panel is only 80% filled with PCM. In the lower surface, the PCM has a direct contact with the panel wall; however, in the upper part of the panel there is an air gap between the steel wall and the PCM that reduces heat transfer. The small temperature differences between chamber temperature, upper surface, and lower surface temperatures after thermal equilibrium is reached can be attributed to measurement error, thermal stratification, and local effects due to the sensor placement.

2.3. Simulated Heat Gains

A heat source was introduced to simulate the performance of the cooling panel. The heat source was turned on and off with timers for 15 min cycles. The hourly average heat gains are visualized in Figure 4. To avoid a direct radiant heat transfer from heat sources to the cooling panel, the heat source was covered with a cardboard box (Figure 5). During experiments, the temperature of internal surfaces and the surfaces of the heat source was measured. Using the Stefan–Boltzmann law for net radiation heat loss (see Equation (2)) it was estimated that around 20% of heat exchange is radiant. It was assumed that the remaining 80% is convective heat exchange—this was later accounted for in the simulation model.
q = ε · δ · ( T h 4 T c 4 ) · A
where:
  • q—Radiant heat transfer, W
  • ε—Emissivity
  • δ—Stefan–Boltzmann constant (5.670373×10⁻⁸ W/m2 K4)
  • Th—Emitting body absolute temperature, K
  • Tc—Surroundings absolute temperature, K
  • A—Area of the emitting body, m2

2.4. Simulation Model for Validation

A simulation model of the experimental system (test chamber and the surrounding room) was developed in IDA ICE 4.8. IDA ICE is a commercial dynamic simulation tool that has been validated according to most industry standards:
  • ANSI/ASHRAE Standard 140-2004;
  • CEN Standards EN 15255-2007 and EN 15265-2007;
  • CEN Standard EN 13791;
  • International Energy Agency SHC Task 34;
  • Technical Memorandum 33 (TM 33).
IDA ICE is used to create multi-zone equation-based simulators using models written in Modelica [29] and Neutral Model Format (NMF) [30]. IDA ICE uses a variable timestep solver that automatically adjusts simulation timesteps, optimizing accuracy and speed [28].
The geometrical dimensions and envelope parameters in the simulation were modeled as close as reasonably possible to the actual chamber. The measured heat loss coefficient Ht was used to finetune envelope U values of the simulated test chamber. During the simulation runs, the temperature of the surrounding environment in the simulation model was kept the same as the measured surrounding room temperature during the experiments. Only the radiant heat exchange between the surroundings and the chamber could not be precisely modeled because the surface temperatures and the short and long wave radiation sources (windows) were not measured during the experiments. Similarly, the cooling water temperature was also controlled according to the measured values.
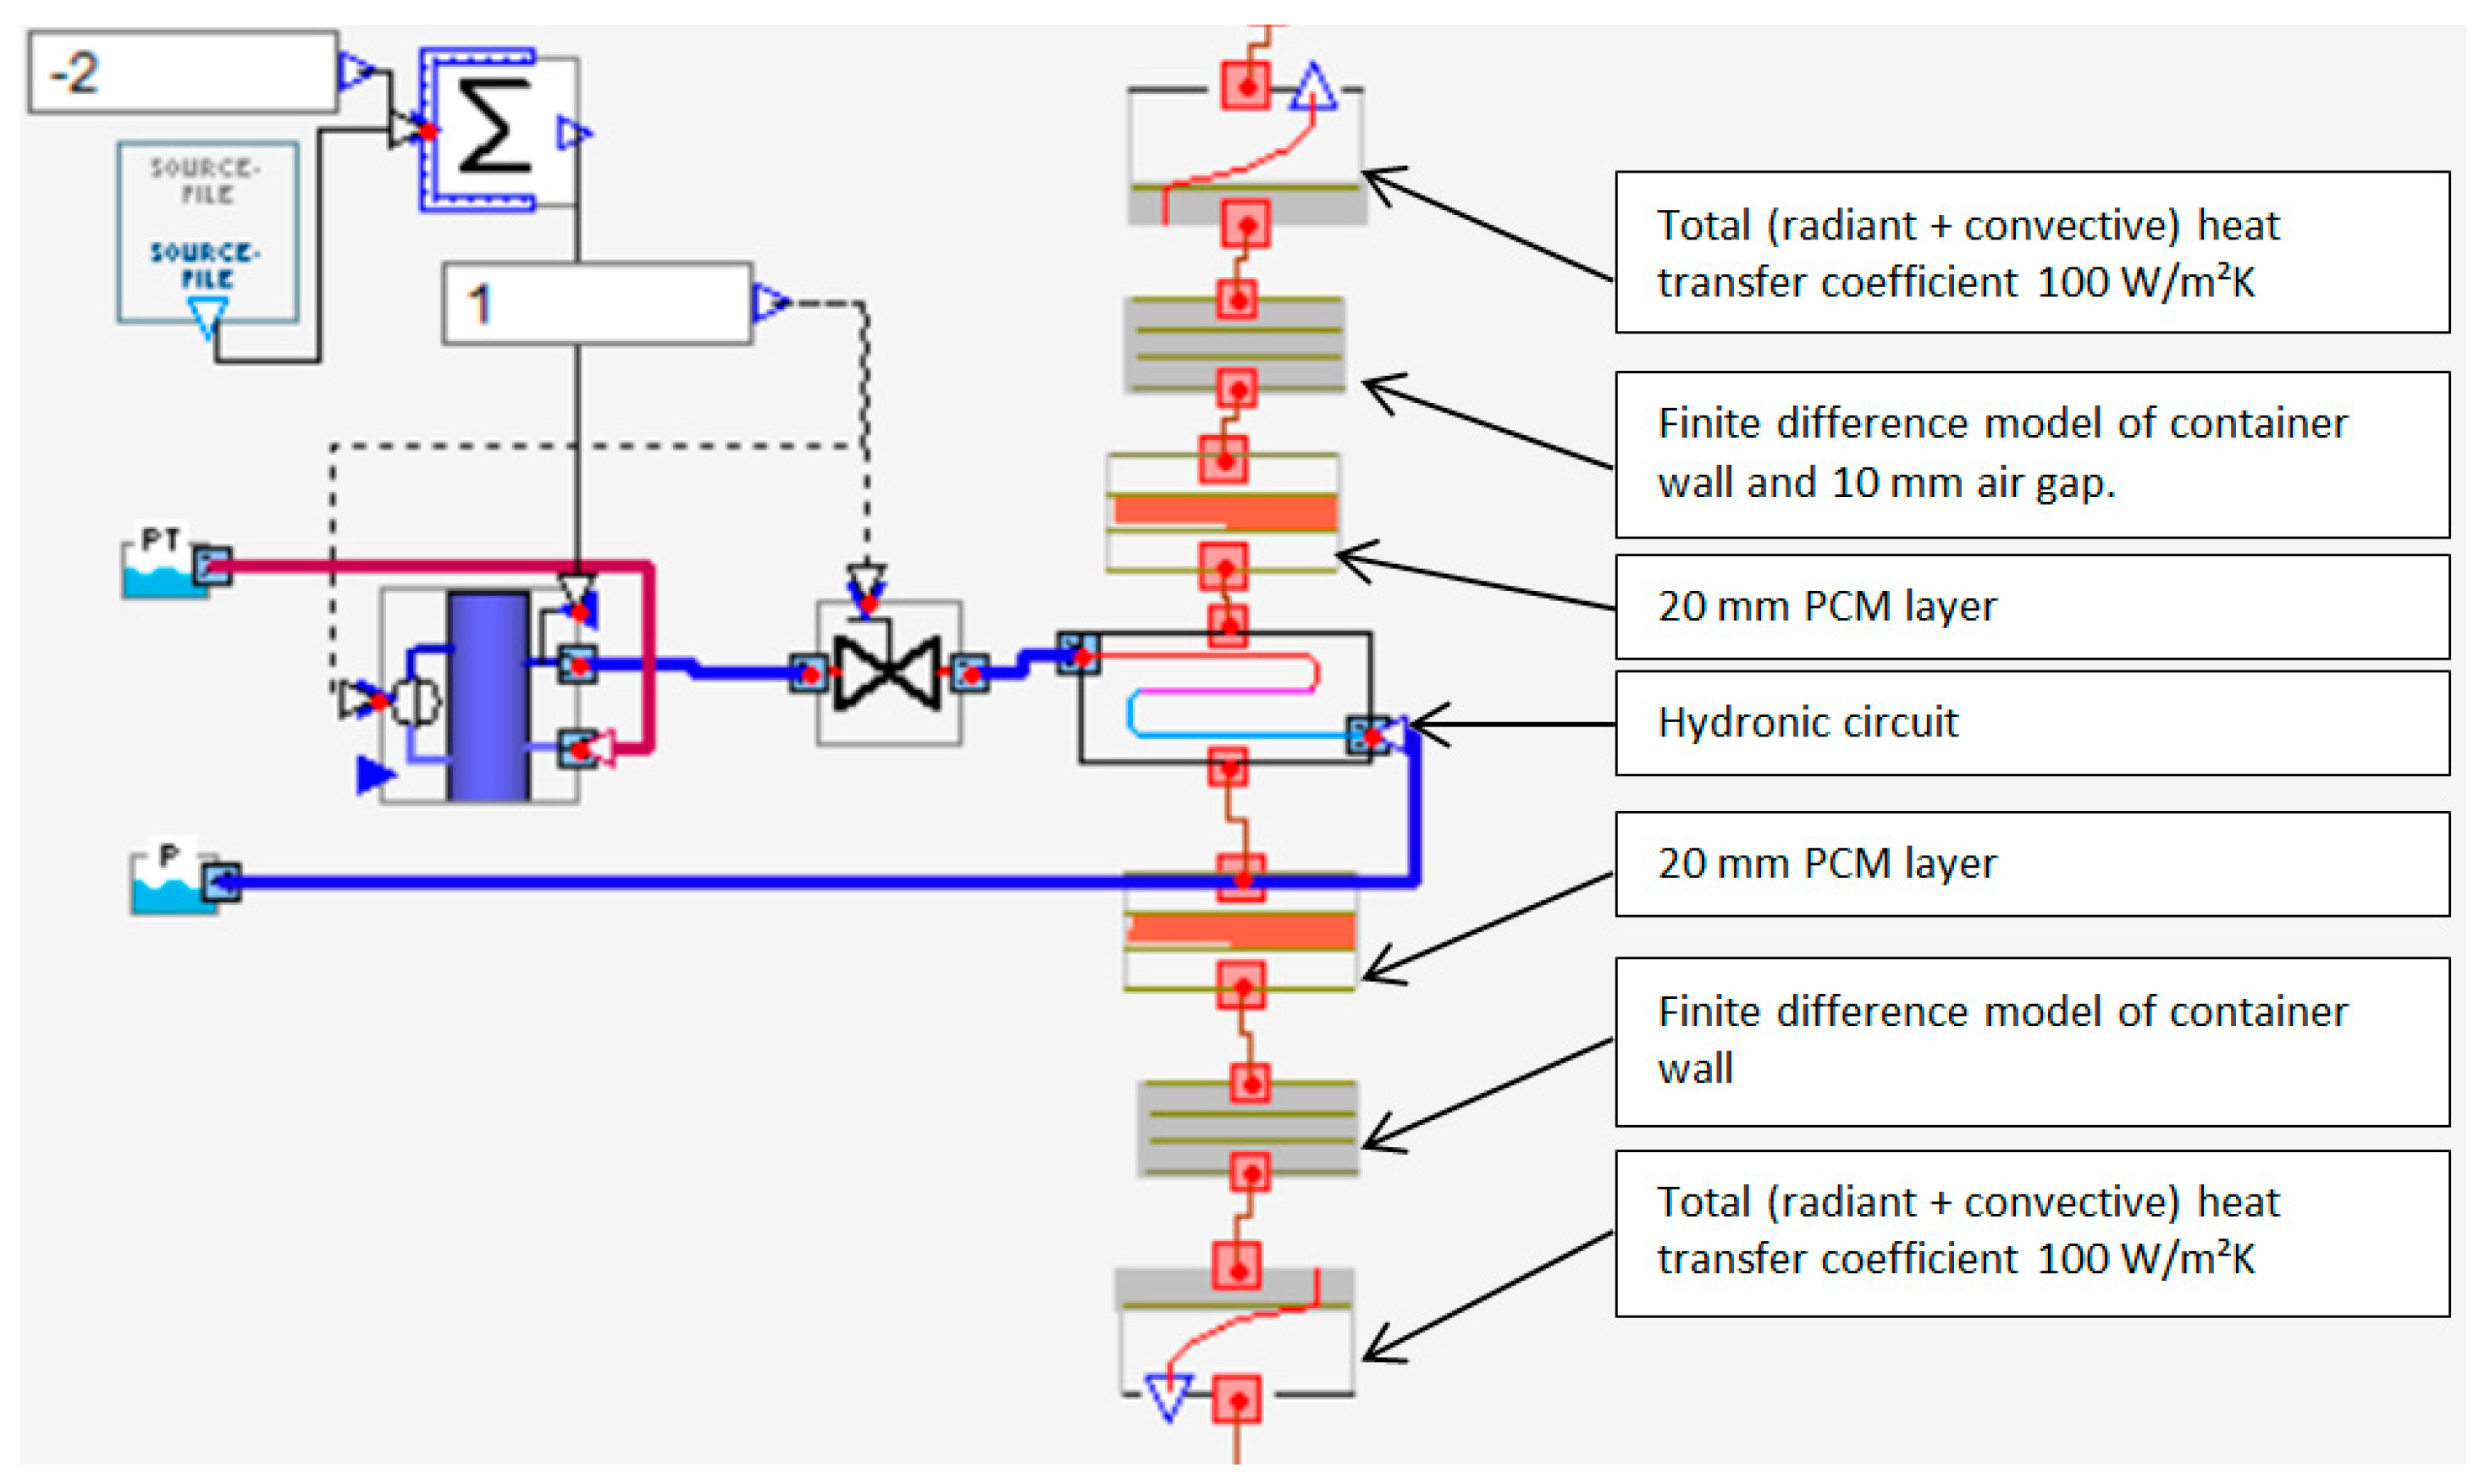
The cooling panel was modeled as a hydronic circuit thermally connected to PCM layers and container wall which was then exposed to the simulated zone with combined radiant and convective heat transfer coefficients. Graphical representation of the PCM panel simulation model can be observed in Figure 6.
The combined radiant and convective heat transfer coefficients were adjusted during the model validation to 100 W/m2K—a relatively high value for natural convection; however, these coefficients did not significantly influence heat transfer from the hydronic circuit because it is mostly dependent on the relatively low heat conductivity of the PCM material (λ = 0.2 W/mK). Furthermore, the area of the lower face of the panel was increased from 0.5 m2 to 0.65 m2 in order to account for the full surface area of the panel including the small side walls.
Container lower wall and upper wall with fixed air layer were modeled with a finite difference model [30,31] of multi-layer components with 4 cells for each layer.
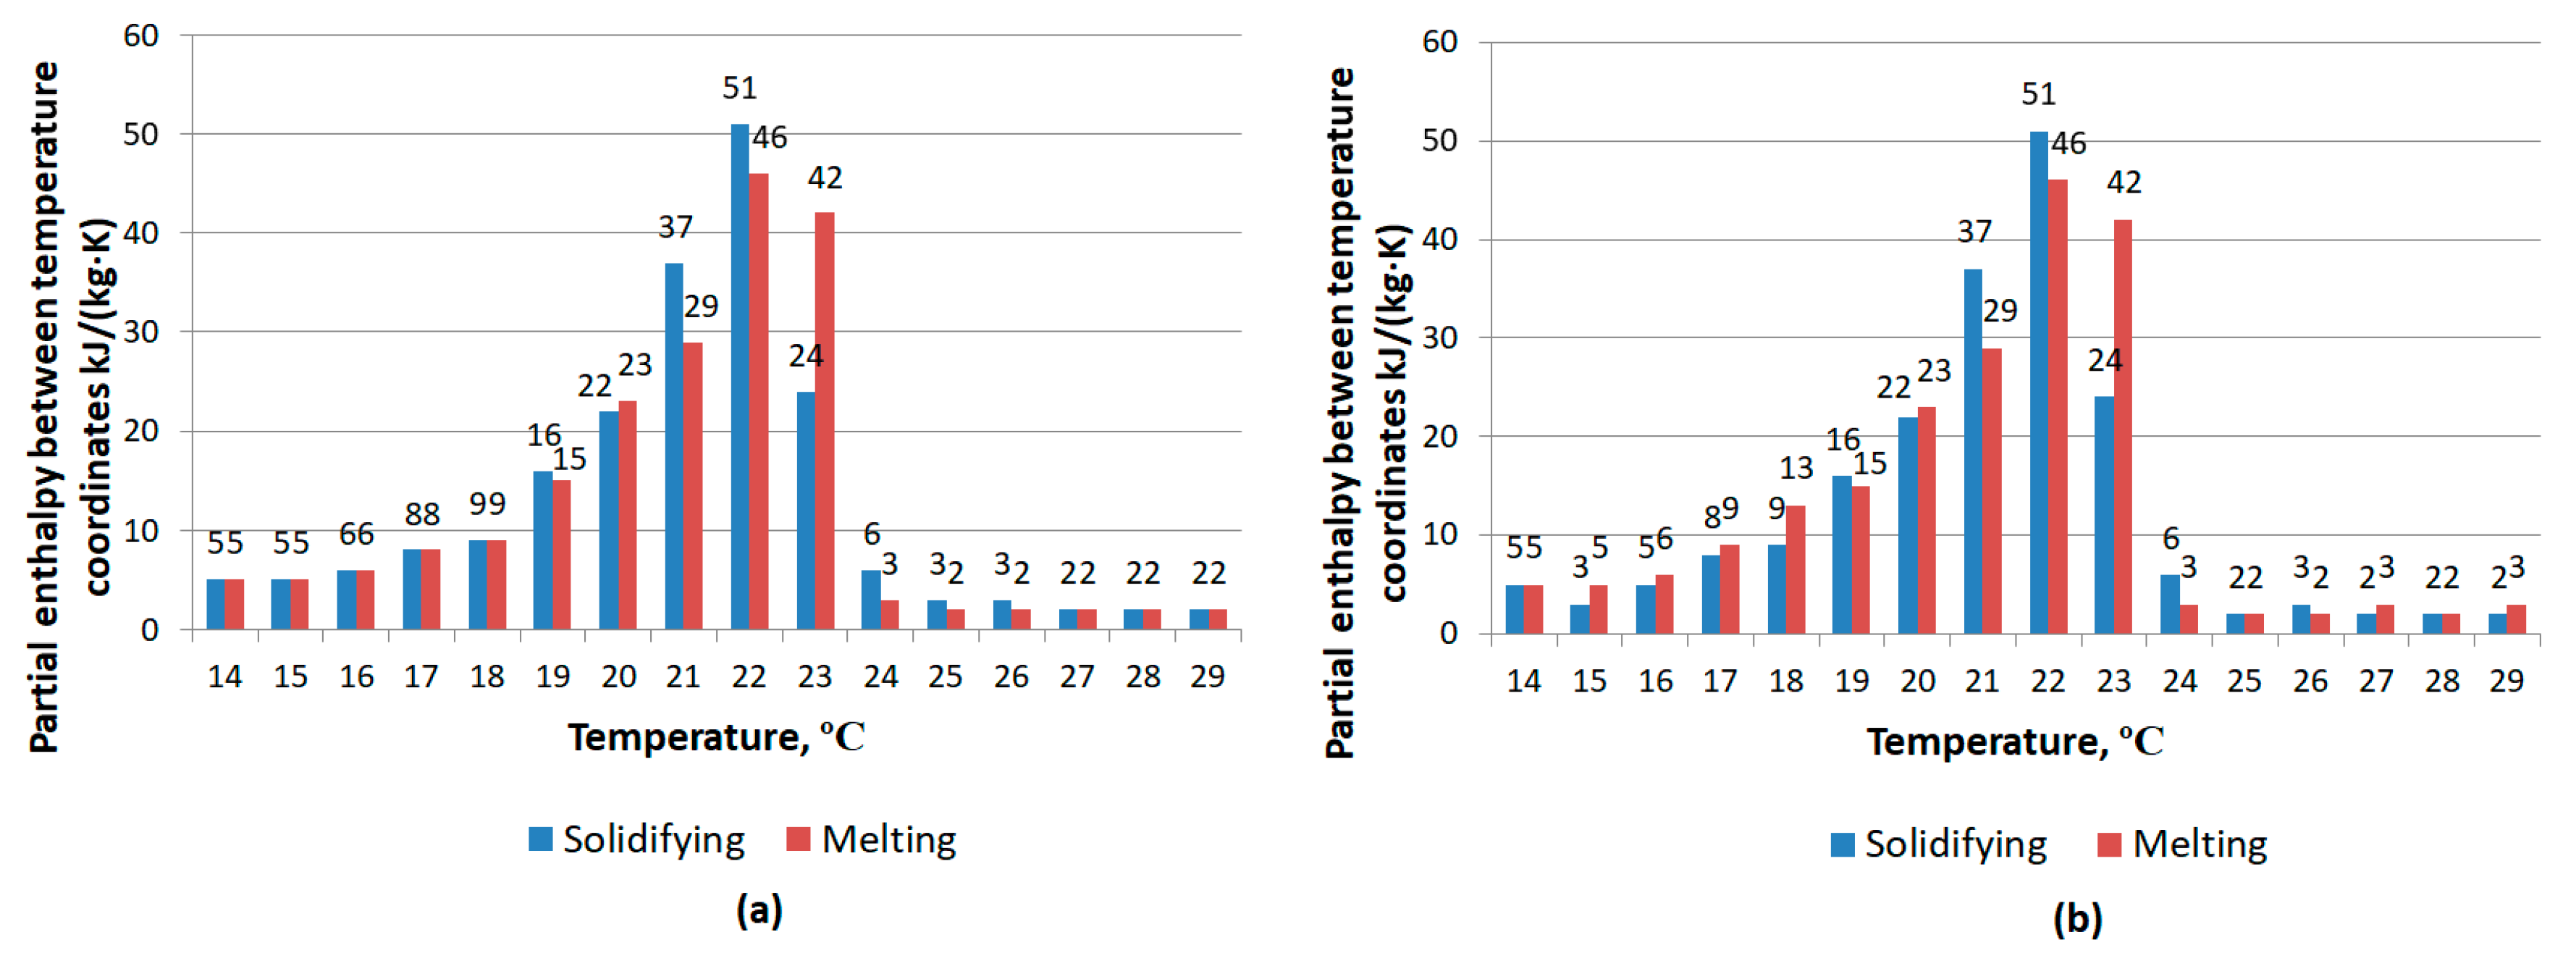
The PCM layer was modeled with a mathematical model of different temperature–enthalpy relations during melting and solidification to consider the effect of hysteresis (refer to Appendix A for full description of the PCM mathematical model written in NMF). The model consists of 16 partial material enthalpies between temperature coordinates for a temperature range from 14 to 29 °C, which is consistent with thermal properties of RUBITHERM© RT22HC phase change material. Partial enthalpy measurement data given by the manufacturer [32] has a measurement inconsistency because the total phase change enthalpy over the phase change range (14 to 29 °C) is different for melting (208 kJ/kg·K) and solidification (197 kJ/kg·K). The partial enthalpies used for the simulation model were slightly adjusted to have the same phase change enthalpy for both melting and solidification. The measured data provided by the manufacturer and the corrected data used for the simulation model can be observed in Figure 7.
The heat conductivity of the PCM material was assumed to be constant (λ = 0.2 W/mK) for both liquid and solid state. Potential internal buoyancy flows in the liquid PCM were not modeled or accounted for.
The hydronic circuit in the model was approximated as a layer that delivers cooling energy to PCM material based on a heat transfer coefficient and temperature difference. Heat transfer coefficient fluid to PCM material was calculated with the help of U-NORM 2012-2 software (developed by Gunnar Anderlind).
U-NORM is an interface for the DAVID-32 program [33] that uses a finite difference model to calculate heat flow and temperature distribution for two- and three-dimensional cases based on energy balance.
The calculation procedure and the pipe circuit approximation to a layer was done according to the methodology described in EN 15377-1. U-NORM software was used to calculate the extra thermal resistance between supply water temperature and the average temperature of conduction layer—the Rt value. The calculated heat transfer coefficient is 1/Rt = 11.8 W/m2K.

2.5. Simulation Model for Performance Modelling

In order to model the PCM cooling panel performance for more realistic cooling application, it was decided to replicate a simulation model set-up from the previous study [24] in order to compare results (Figure 8 and Figure 9). This particular study was chosen because of a very similar type of PCM cooling panel used and the same PCM material. A simulation model with equivalent input data was generated in IDA ICE. Input data regarding room envelope is shown in Table 2.
The previous CFD study considered the simulation setup a two-dimensional problem and simulated it as a two-dimensional simulation model that does not consider the thermal properties of the walls on both sides. In theory this CFD model represents an infinitely long room.
In order to replicate this assumption in the IDA ICE model, the thermal effect (thermal mass) generated by the side walls had to be minimized. It was assumed that if the area of the side walls was made relatively small compared with the area of rest of the surfaces (external wall, window, back wall, ceiling, and floor) the effect generated by the presence of these walls in the simulation model would be negligible and a room with dimensions 6.00 × 3.00 × 60.00 m (W × H × L) was used for simulations in the IDA ICE.

3. Results and Discussion

3.1. Verification of the Simulation Model

3.1.1. Simulation Model without a PCM Cooling Panel

After adjusting the heat loss coefficient of the test chamber envelope according to the measured value a simulation was run for 7 consecutive days and compared with the measurement data from the same time period. The simulated period was split into 453 timesteps by IDA ICE solver that on average gives a length of around 22 min for one timestep. In reality, the timestep is adjusted since IDA ICE uses a variable timestep solver. In total, 2334 iterations were required to find a solution for all timesteps.
The temperature in the surrounding room in the simulation was kept exactly the same as measured. The simulated temperature inside the chamber corresponded relatively well with measurements—the maximum deviation between the measured value and the simulated value was less than 1 °C. It is nearly within the uncertainty on the measurement (±0.5 °C). One of the possible explanations for the discrepancy that arose can be the fact that the room where the experiment took place had significant glazing, and due to the technical limitations the radiant temperature and the radiation from the glazed surfaces was not measured and, therefore, could not be accounted for in the simulation model. This would also explain why the first two days the measured and simulated data correspond almost perfectly, but the following days start to drift apart (Figure 10), because during the experiment the first two days were mostly cloudy and the following days were mostly sunny.
Measured and simulated values over the investigated period had a relatively high Pearson correlation coefficient of 0.98 and relatively low root mean square error (RMSE) of 0.53 ºC. Additionally, it is visible in Figure 11 that the error produced by the IDA ICE model is slightly correlated with chamber temperature; however, the correlation is relatively weak (R2 = 0.181).

3.1.2. Simulation Model with a PCM Cooling Panel and Cooling Water Connection

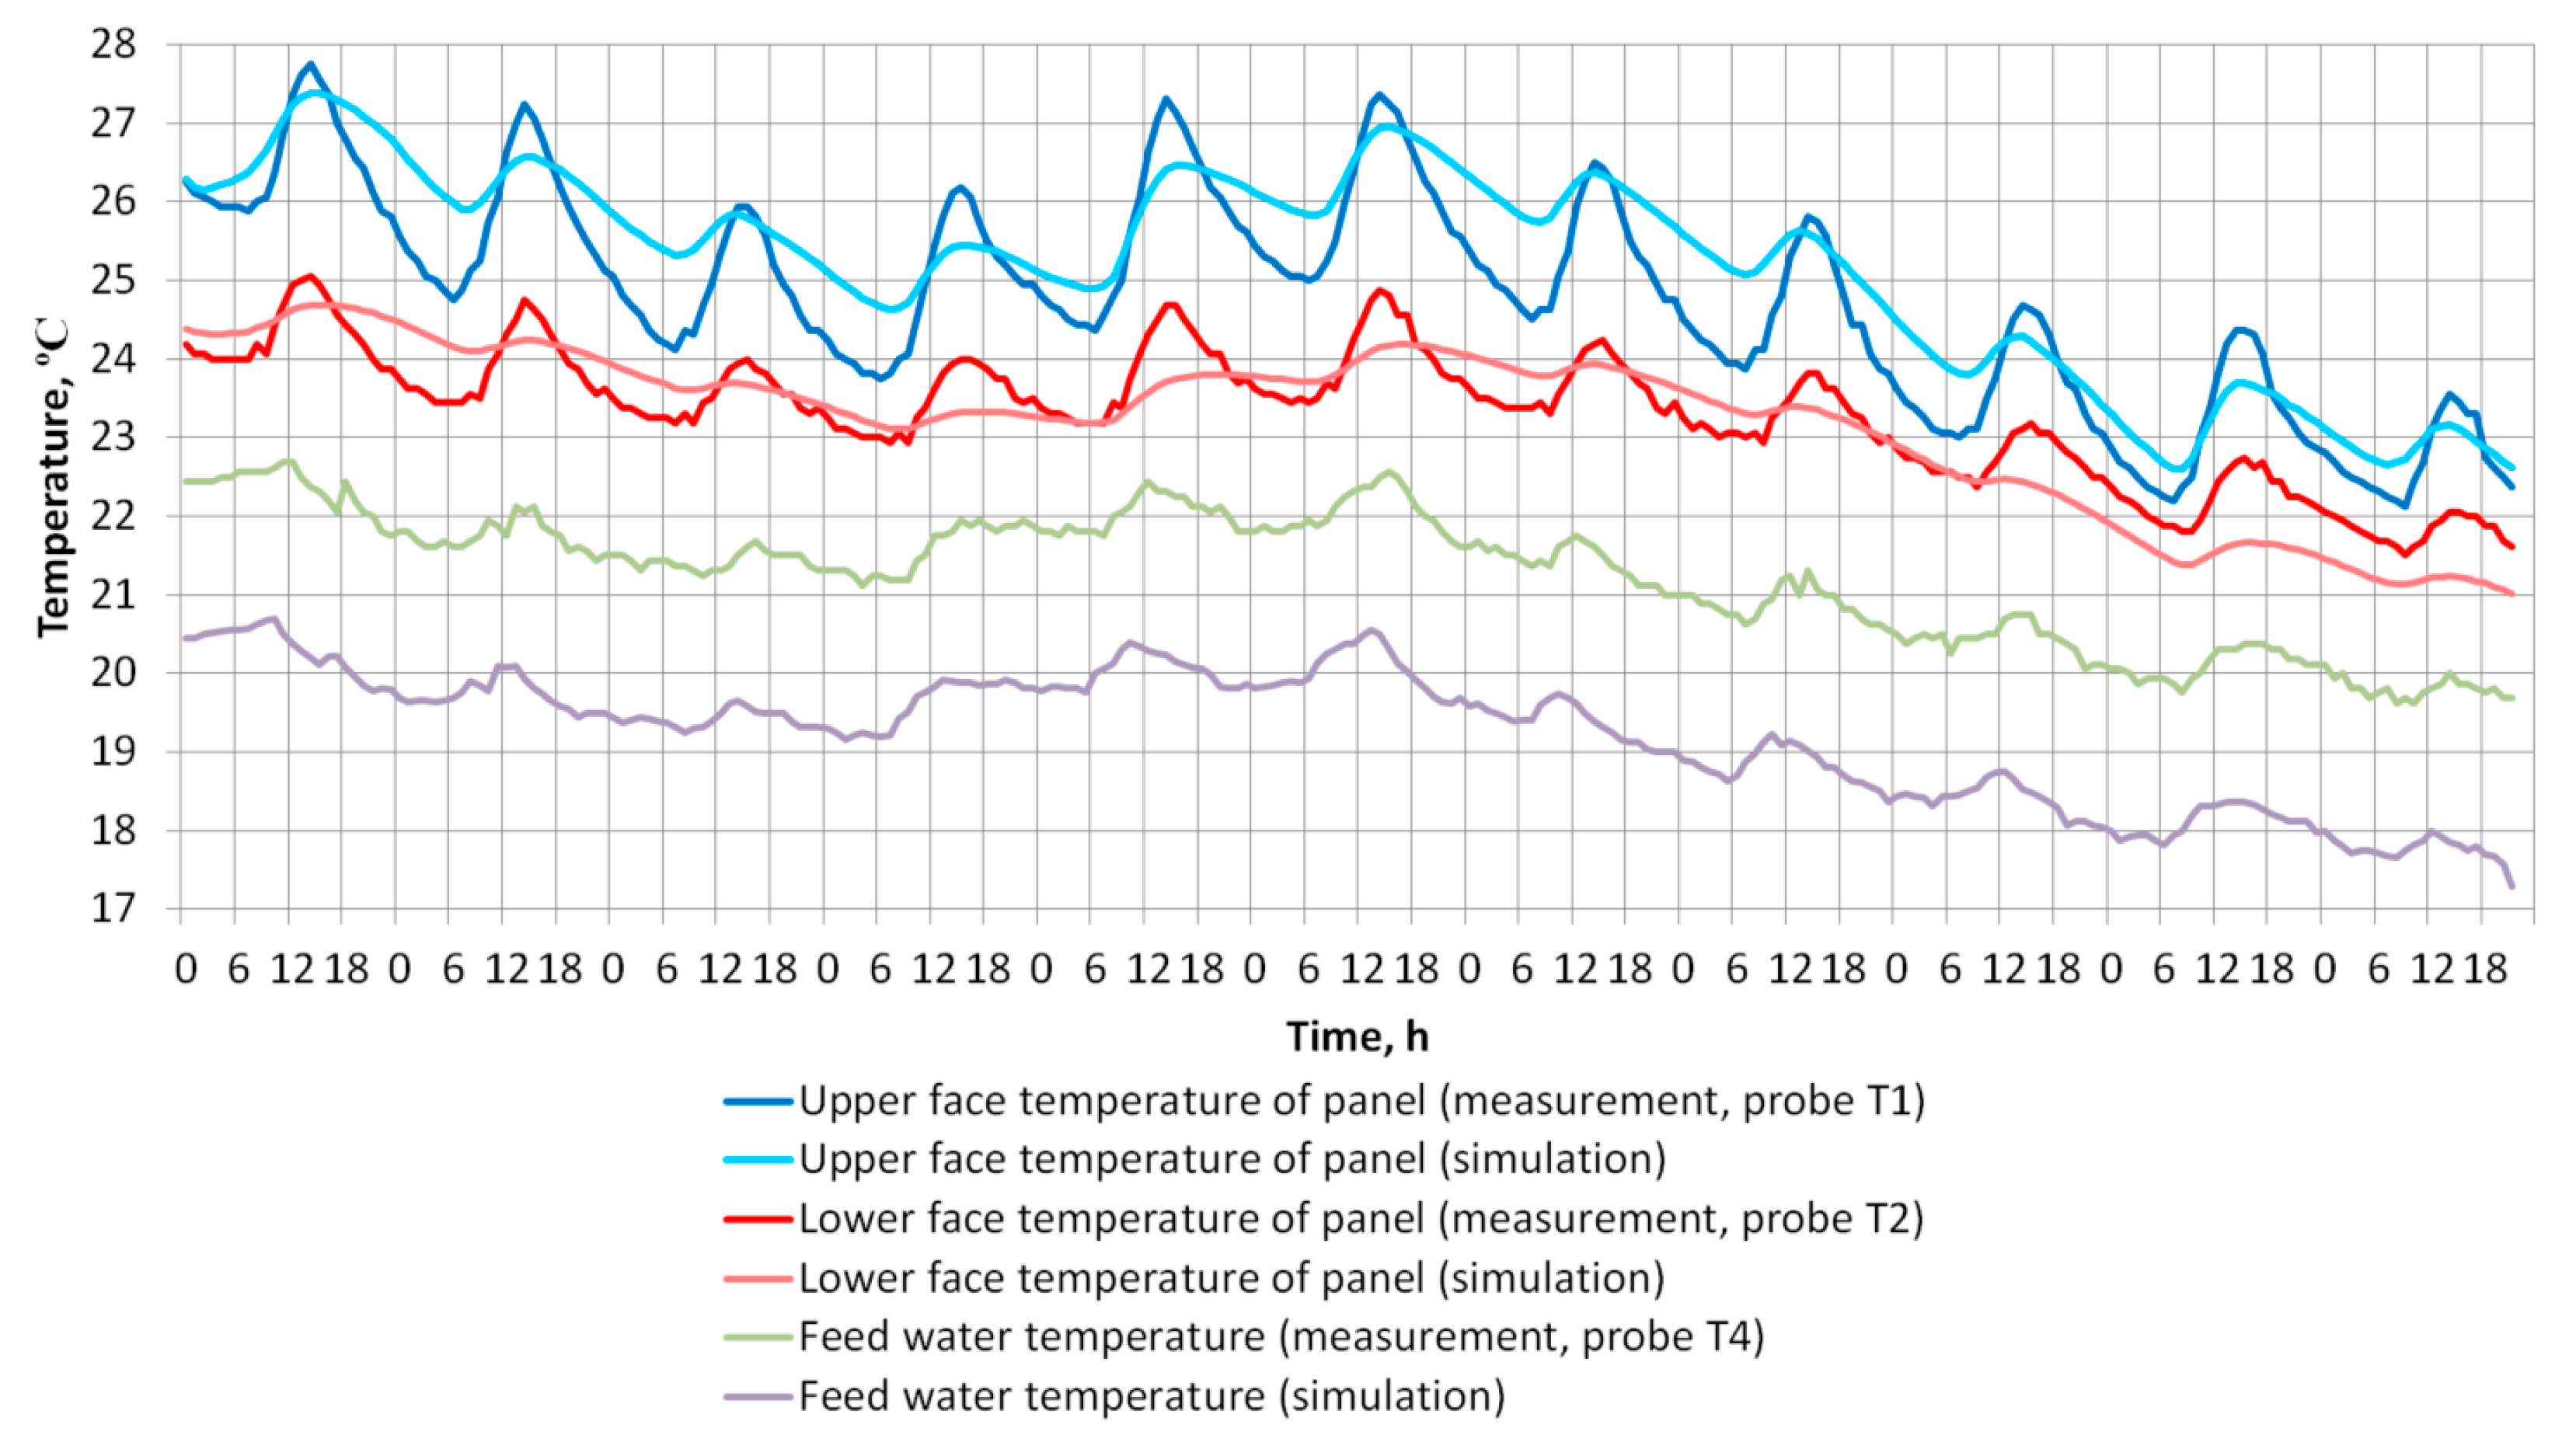
After making sure that the test chamber envelope model had a reasonable agreement between the simulated and measured values by fine-tuning the chamber Ht value according to measurements, the PCM panel could be simulated. An 11-day period was chosen for the simulation (Figure 12 and Figure 13).
The simulated period was split into 687 timesteps by IDA ICE solver that on average gives a length of around 23 min for one timestep. In reality, the timestep is adjusted since IDA ICE uses a variable timestep solver. In total, 3323 iteration were required to find a solution for all timesteps. With the introduction of a PCM cooling panel, the difference between the simulated and measured values increased to a maximum of 2 °C and the RMSE increased to 1.01 °C—this disagreement can partly be explained with the uncertainty of the temperature sensors and the fact that radiant heat exchange between the test chamber and surrounding room was not properly modeled. However, the simulation model always shows a higher temperature than actually measured in the test chamber—a phenomena reported also in the previous study performed by a team from Austria [34]. Thus, in a practical application, the error would give an advantage rather than a disadvantage. However, when average temperatures over the 11-day period were compared the agreement between the measured and simulated data was better—the average temperature in the simulation was 26.4 versus 25.2 °C for the measured data, which gives a discrepancy of 1.2 °C.
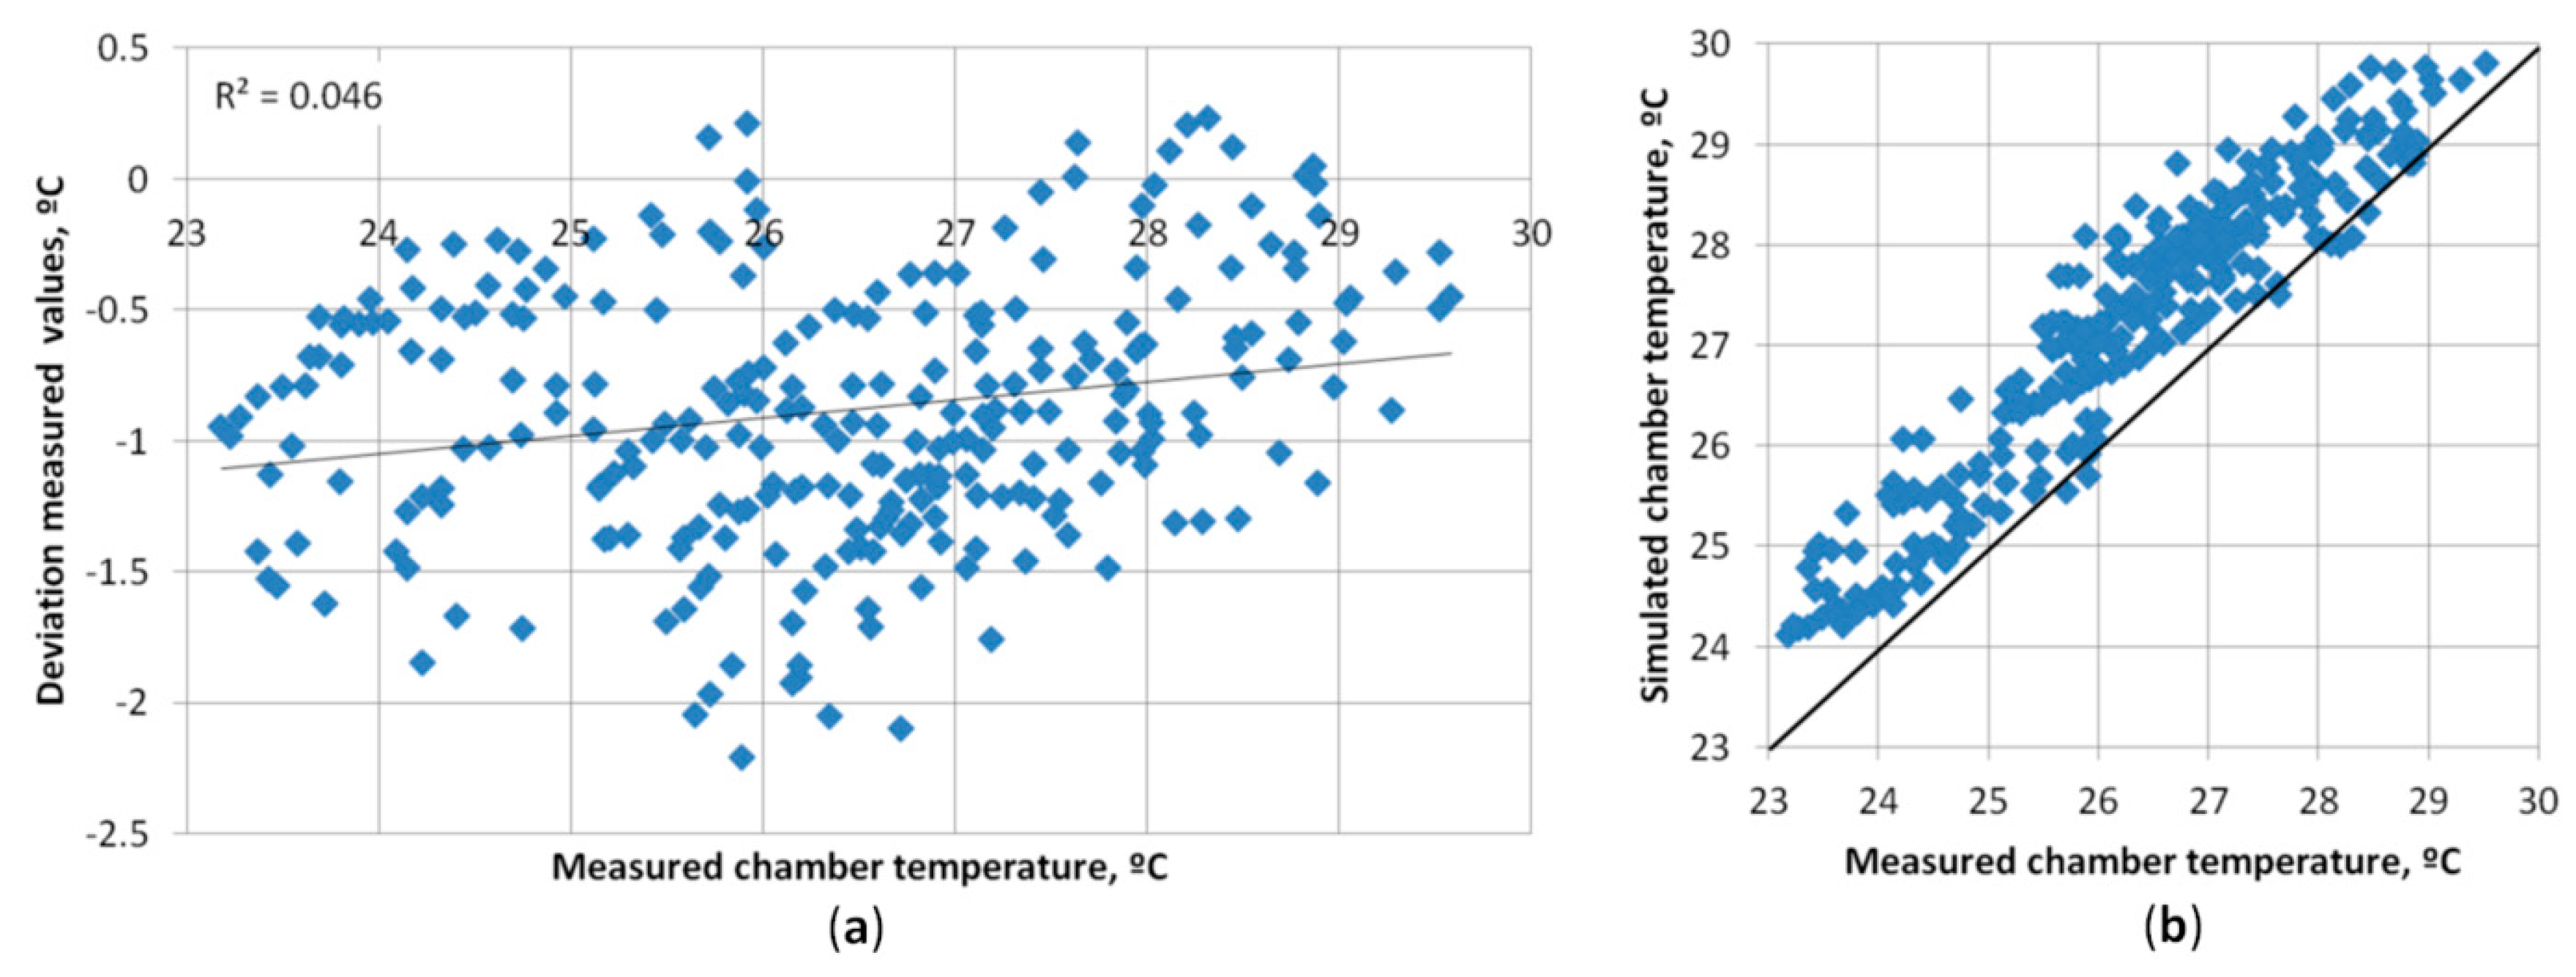
Measured and simulated values over the investigated period had a relatively high Pearson correlation coefficient of 0.95. Additionally, it is visible in Figure 14 that the error produced by the IDA ICE model is practically not correlated with chamber temperature (R2 = 0.046).
The maximum panel surface temperature deviation from the measured values was around 1 °C (Figure 12). Nevertheless, the average temperatures over the simulated period had a much better agreement. The average simulated upper panel surface temperature was 25.2 °C and the measured lower panel surface temperature was 24.8 °C, giving a 0.4 °C difference. The average simulated lower panel surface temperature was 23.2 °C and the measured lower panel surface temperature was 23.3 °C, giving a 0.1 °C difference. It can be concluded that the simulation model can replicate temperature swings, but the accuracy increases if average temperatures over longer periods of time are compared.
In general, the agreement between simulated and measured values (maximum deviation of 2.0 °C and RMSE of 1.01 °C) is relatively good if compared to similar studies where simulation results of a dynamic simulation software are compared to measured values.
A team from Austria did a validation study [34] for four different dynamic simulation tools including IDA ICE and compared the results to measured values. The maximum deviation ranged from ~3.5 °C to ~4.7 °C and RMSE ranged from ~0.5 °C to ~2.5 °C for a yearly simulation done with different simulation tools.
Furthermore, a team from Italy conducted a similar study using IDA ICE [35] with two test chambers and a passive PCM thermal storage. When the measured values were compared to simulated values for an eight-day period, the RMSE for the chamber with no PCM storage was 2.50 °C and the RMSE for a chamber with a PCM storage was 1.83 °C.

3.2. Performance Modelling—Comparative Case

Results from both simulations provided very similar results (Figure 15) The maximum room temperature for the case with no cooling panels reached in the CFD simulation was 40.8 vs. 41.8 °C temperature in the IDA ICE simulation. In the case with thermally activated PCM panels, the maximum temperatures reached was 30.4 °C in the CFD simulation and 33.0 °C in the IDA ICE simulation.
When comparing average temperature over the simulated period the agreement between both studies was better. Average temperature for the case with no PCM cooling panels was 32.1 °C for the CFD simulation and 31.5 °C for IDA ICE simulation (0.6 °C difference). In the case with the active PCM cooling panels, the average temperature for the CFD simulation was 25.2 °C, and 24.5 °C for the IDA ICE simulation (0.7 °C difference). The RMSE when IDA ICE simulation was compared to CFD is 1.13 °C for the case with no PCM panel and 1.31 °C for the case with thermally active PCM panel.
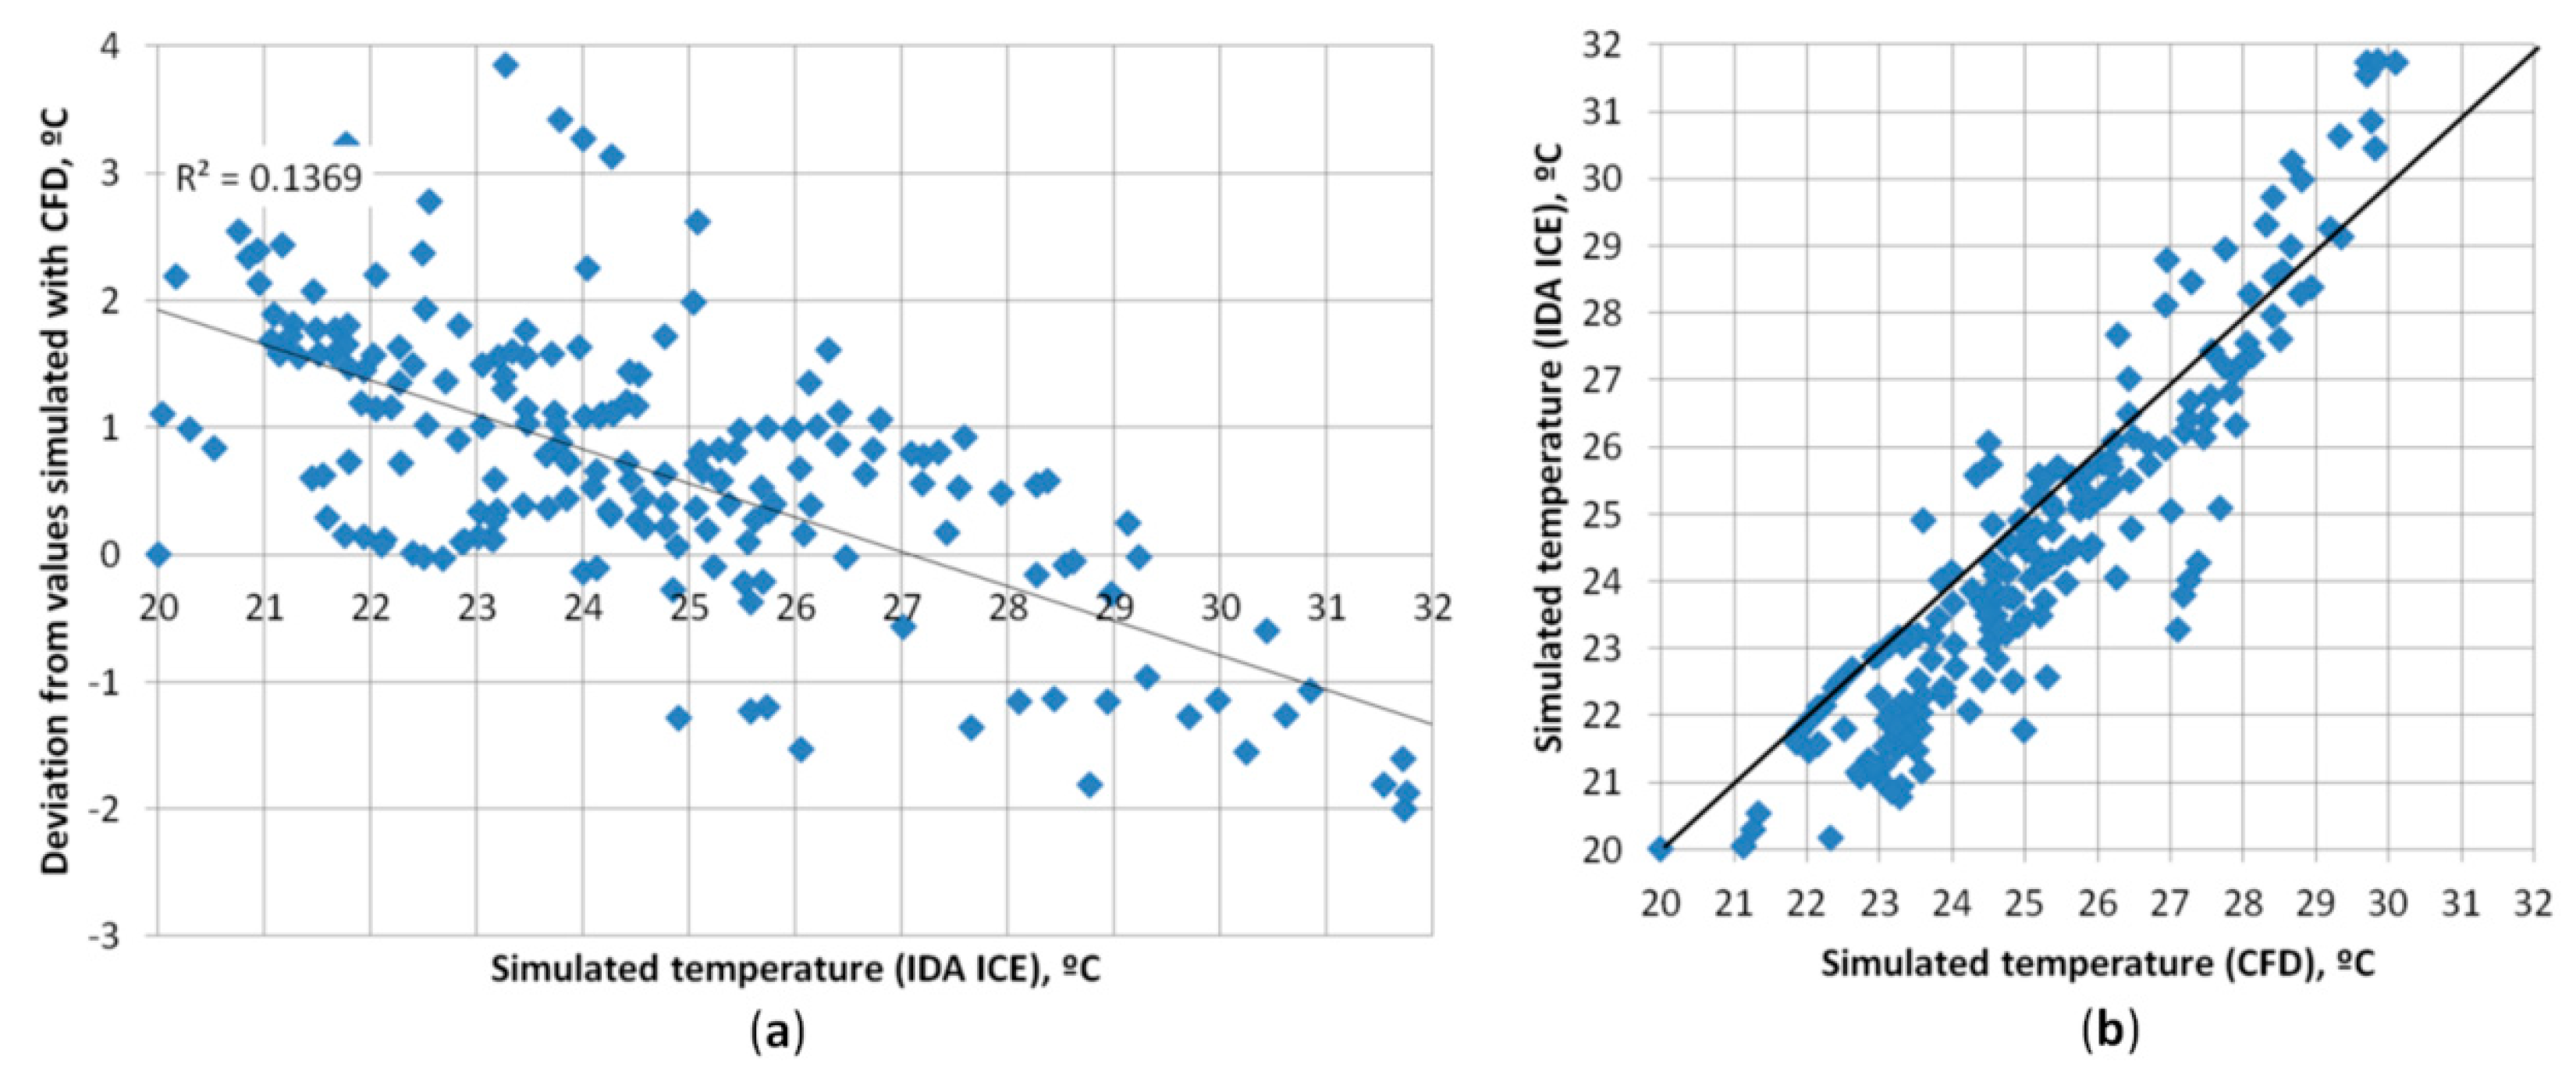
Furthermore, in Figure 15 and Figure 16, it can be observed that, if compared with the CFD simulation, the IDA ICE simulator overestimates room temperature for higher temperature periods (daytime) and underestimates room temperature for cooler periods (nights). It can be concluded that IDA ICE and the CFD simulation demonstrate slightly different predictions regarding the magnitude of the temperature swings but gives better agreement regarding average temperatures.
Furthermore, in a previous study [34] it was observed that overestimation of peak temperatures is a common phenomenon for various dynamic simulation tools. The reached agreement between CFD simulation and dynamic simulation in IDA ICE is similar as reported in other studies [34].
The difference of simulated results in IDA ICE and CFD for average temperatures is very small (less than 1 °C) and it can be considered negligible for annual energy simulations. However, the disagreement for peak values can reach approximately 2.5 °C, but in this case the simulation model is slightly overestimating the peak temperature so the model can be used reliably also for peak load calculations.
The developed simulation model is less accurate than the CFD simulation model; however, currently CFD simulations require significant computing power that limits their practical application for large scale simulation studies (cooling capacity and energy calculation for whole building) in construction industry. On the other hand, dynamic simulation tools allow us to perform these tasks relatively fast but with loss of accuracy. For comparison using a standard computer, the 192-h long CFD simulation case for the other team [24,25] required around 150 h to compute (even for a simplified two-dimensional case) the same simulation case with IDA ICE and similar computer took around 45 s.

4. Conclusions

In this research, a series of simulation studies and experimental tests were performed to gain a better understanding of the performance of a thermally activated PCM cooling panel.
The IDA ICE model for the cooling panel was validated against experimentally measured data in a test chamber. The simulation model predicted the temperature in the test chamber with a cooling panel with a reasonable precision—up to 2 °C error for temperature swings and 1.2 °C error for average temperatures. The Pearson correlation coefficient for simulated and measured data was 0.95 and the RMSE was 1.01 °C, which is similar to the results that were reported in other studies [34,35].
The performance of the PCM cooling panel was also compared with results from another study done with CFD [25] with a very similar PCM cooling panel. The agreement for both simulations were mostly within 2 °C (except two temperature peaks) for temperature swings and 0.7 °C for average temperature over the simulated period. It can be concluded that the performance of the PCM cooling panels can be predicted with reasonable precision by using CFD dynamic simulation tools as well as dynamic simulation tools. The loss of accuracy using IDA ICE simulator for annual energy simulation is insignificant, the inaccuracy for calculation of temperature peaks is higher, but in all cases the simulation model was overestimating these temperature peaks rather than underestimating, so the simulation model can give reliable results also for peak cooling load calculations.
The use of dynamic simulation tools for simulation PCM storage rather than CFD would allow us to perform practical calculation on a larger (whole building) scale orders of magnitude faster and less labor-intensively. Application of fast and reliable calculation methods are essential in order to properly design such systems, as well as to perform financial feasibility studies [36].
The proposed PCM cooling panel can significantly improve thermal conditions during overheating events—in the simulated case, by up to 9 °C.
Although the precision of the simulation model is reasonable and sufficient for practical application, it is far from perfect. Further experiments are required for further simulation model validation, perhaps with larger scale and more isolated conditions that may be better accounted for in a simulation model.
Moreover, more precise measurements that would not be affected by local effects like radiant heat exchange, convection air flows and similar affects are required.
In addition, further studies are necessary to investigate the effect of local buoyancy flows inside the PCM during its liquid state.

Author Contributions

Conceptualization, R.M. and A.B.; methodology, R.M.; software, R.M.; validation, R.M. and A.L.; formal analysis, R.M.; investigation, R.M.; resources, A.B. and A.K.; data curation, A.B.; writing—original draft preparation, R.M.; writing—review and editing, A.L. and A.B.; visualization, R.M.; supervision, A.B. and A.L.; project administration, A.B and A.K.; funding acquisition, A.K. All authors have read and agreed to the published version of the manuscript.

Funding

This research was funded by European Regional Development Fund, project Nr.1.1.1.1/16/A/007.

Acknowledgments

The financial support of the European Regional Development Fund project Nr.1.1.1.1/16/A/007 “A New Concept for Sustainable and Nearly Zero-Energy Buildings” is acknowledged.

Conflicts of Interest

The authors declare no conflict of interest.

Appendix A

The PCM mathematical model used in the simulation study is described in this appendix. The mathematical model is written in NMF [30] (programing language used by IDA ICE) and has previously been validated by a team from Italy [35]. This model was written in 2015 by Lars Eriksson, a member of EQUA Simulation AB. The model is one dimensional and describes the PCM as one layer that is connected to the system with thermal links (transmitting temperature and heat flux). The temperature of the material for liquid and solid state is calculated using heat capacity, density, and thermal resistance for liquid and solid state. The temperature of the material during solidification and melting is calculated using thermal resistance, density, and partial enthalpy coordinates. During melting phase, thermal resistance, and density of a solid is used, and during solidification phase, thermal resistance and density of a liquid is used; however, for this phase change material these values are the same for both phases. During reversing (switching from melting to solidifying) specific heat of 2000 J/kg·K (parameter C0) is assumed. The NMF code is written below:
EQUATIONS
/* Compute heat capacity, resistance, and temperature as a function of enthalpy for current Mode*/
IF NINT(Mode) = −2 THEN /* solid phase */
CUsed: = cpSol;
RUsed: = RSol;
T: = (H-Hm[1])/cpSol + TH[1];
ELSE_IF NINT(Mode) = 2 THEN/* liquid phase */
CUsed: = cpLiq;
RUsed: = RLiq;
T: = (H-Hm[N])/cpLiq + TH[N];
ELSE_IF NINT(Mode) = −1 THEN/* solidifying phase */
RUsed: = R0;
T: = TCfind (H, HS, TH, N, cpSol, CUsed);
ELSE_IF NINT(Mode) = 1 THEN/* melting phase */
RUsed: = R0;
T: = TCfind (H, HM, TH, N, cpLiq, CUsed);
ELSE/* NINT(Mode) = 0 */ /* reversing during melting/solidifying phase */
CUsed: = c0;
RUsed: = R0;
T: = if H < = Hm[1] then
(H-Hm[1])/cpSol + TH[1]
else_if H > = Hm[N] then
(H-Hm[N])/cpLiq + TH[N]
else
max(TLeft, min((H-HLeft)/c0 + TLeft, TRight))
end_if;
END_IF;
/* Compute heat and enthalpy */
Q: = Qa + Qb;
H’ = Q/M;
Qa = A*(Tpa-T)/RUsed;
Qb = A*(Tpb-T)/RUsed;
/* Compute Mode */
IF NINT(Mode) = −2 THEN
IF Q < 0 THEN
Mode: = −2;
ELSE_IF H > HS[1] THEN
Mode: = 1;
ELSE
Mode: = −2;
END_IF;
ELSE_IF NINT(Mode) = 2 THEN
IF Q > 0 THEN
Mode: = 2;
ELSE_IF H < HM[N] THEN
Mode: = −1;
ELSE
Mode: = 2;
END_IF;
ELSE_IF NINT(Mode) = −1 THEN
IF Q > 0 THEN
Mode: = 0;
call findHT(H, T, c0, HM, TH, dHdTmelt, N, HRight, TRight,−1);
HLeft: = H;
TLeft: = T;
ELSE_IF H < HS[1] THEN
Mode: = −2;
ELSE
Mode: = −1;
END_IF;
ELSE_IF NINT(Mode) == 1 THEN
IF Q < 0 THEN
Mode: = 0;
call findHT(H, T, c0, HS, TH, dHdTsolid, N, HLeft, TLeft, 1);
HRight: = H;
TRight: = T;
ELSE_IF H > HM[N] THEN
Mode: = 2;
ELSE
Mode: = 1;
END_IF;
ELSE/* NINT(Mode) = 0 */
IF Q < 0 THEN
IF H < HLeft THEN
Mode: = −1;
ELSE
Mode: = 0;
END_IF;
ELSE
IF H > HRight THEN
Mode: = 1;
ELSE
Mode: = 0;
END_IF;
END_IF;
END_IF;
LINKS
/* typ  name   variables */
TQ   Term_a    Tpa, POS_IN Qa;
TQ    Term_b    Tpb, POS_IN Qb;
VARIABLES
/* type  name role  def  min   max  description */
Enthalpy  H  OUT 0.0   -BIG   BIG  “Layer enthalpy”
Temp  Tpa  OUT 27.3  ABS_ZERO BIG  “Temperature at surface A”
Temp  Tpb  OUT 24.2  ABS_ZERO BIG  “Temperature at surface B”
Temp  T  LOC 0.0  ABS_ZERO BIG  “Temperature in layer”
HeatFlux  Qa  IN  −6  -BIG   BIG  “Influx at surface A”
HeatFlux  Qb  IN  −146  -BIG   BIG  “Influx at surface B”
HeatFlux  Q  LOC 1  −BIG   BIG  “Total heat flux into layer”
Temp  TLeft A_S  0.0  ABS_ZERO BIG  “Left temperature defining path during mode 0”
Enthalpy  HLeft A_S  0  −BIG   BIG  “Left enthalpy defining path during mode 0 (J/kg)”
Temp  TRight A_S  0.0  ABS_ZERO BIG  “Right temperature defining path during mode 0”
Enthalpy  HRight A_S  0  −BIG   BIG  “Right enthalpy defining path during mode 0 (J/kg)”
HeatCapM CUsed LOC 2.44E+07 SMALL  BIG  “Heat capacity in use (J/(kg K))”
HeatResA RUsed LOC 0.03  SMALL  BIG  “Resistance in use between side and node ((m2 K)/W)”
Generic  Mode A_S  −2  −2   2  “−2 = solid, 2 = liquid, 1 = melting, −1 = solidifying, 0 = reversing”
MODEL_PARAMETERS
/* type name role  def  min max  description */
Int  Nm1 CMP 9  2 BIGINT “Number of partial enthalpies (N-1)”
Int  N  SMP  10  3 BIGINT “Number of temperature coordinates”
PARAMETERS
/* type   name   role def  min   max description */
Area  A    S_P 5.3  SMALL  BIG “Wall area”
Length  l    S_P 0.01  SMALL  BIG “Layer thickness”
Density  rhoSol   S_P 1500  SMALL  BIG “Layer density (solid)”
HeatCapM cpSol   S_P 2000  SMALL  BIG “Layer specific heat (solid) (J/(kg K))”
HeatCondL lambdaSol  S_P 0.6  SMALL  BIG “Layer heat conductivity (solid) (W/(m K))”
Density  rholiq   S_P 1400  SMALL  BIG “Layer density (liquid)”*/
HeatCapM cpliq   S_P 2000  SMALL  BIG “Layer specific heat (liquid) (J/(kg K))”
HeatCondL lambdaliq  S_P 0.6  SMALL  BIG “Layer heat conductivity (liquid) W/(m K)”
HeatCapM c0    S_P 300  SMALL  BIG “Specific heat during reversing (c0 <= min(cpSol, cpliq)) (J/(kg K))”
Temp  TH[N]   S_P 20  ABS_ZERO BIG “Temperatures at which melting/solidifying enthalpies are computed”
HeatCapM dHdTmelt[Nm1] S_P 2000  SMALL  BIG “Partial enthalpies between temperature coordinates divided by temperature interval melting (J/(kg K))”
HeatCapM dHdTsolid[Nm1] S_P 2000  SMALL  BIG “Partial enthalpies between temperature coordinates divided by temperature interval solidifying (J/(kg K))”
/* derived parameters */
Enthalpy  HM[N]   C_P 2500  -BIG   BIG “Enthalpies at temperature coordinates melting (J/kg)”
Enthalpy  HS[N]   C_P 2500  -BIG   BIG “Enthalpies at temperature coordinates solidifying (J/kg)”
Mass  M    C_P 40  SMALL  BIG “Layer mass”
HeatResA RSol    C_P 0.03  SMALL  BIG “Resistance side <-> node (solid) ((m2 K)/W)”
HeatResA RLiq   C_P 0.03  SMALL  BIG “Resistance side <-> node (liquid) ((m2 K)/W)”
HeatResA R0    C_P 0.03  SMALL  BIG “Resistance side <-> node (sol+liq)((m2 K)/W)”
PARAMETER_PROCESSING
Nm1: = N-1;
/* HM[1] = HS[1], HM[N] = HS[N] */
HM[1]: = cpSol * TH[1];
HS[1]: = cpSol * TH[1];
FOR i = 1, Nm1
HM[i+1]: = HM[i] + dHdTmelt[i] *(TH[i+1]-TH[i]);
HS[i+1]: = HS[i] + dHdTsolid[i]*(TH[i+1]-TH[i]);
END_FOR;
IF abs(HM[N]-HS[N]) > 1e-3*cpSol THEN
CALL nmf_error(“Enthalpy change during melting and solidifying should agree (sum(dHdTmelt[i]*(TH[i+1] TH[i])) = sum(dHdTsolid[i]*(TH[i+1]-TH[i])))”);
END_IF;
RLiq: = 0.5 * l/lambdaLiq;
RSol: = 0.5 * l/lambdaSol;
R0: = l/(lambdaLiq+lambdaSol);
M: = rhoSol * l * A;
END_MODEL
© EQUA Simulation AB 2015–2020

References

  1. Sergeev, V.V.; Petrichenko, M.R.; Nemova, D.V.; Kotov, E.V.; Tarasova, D.S.; Nefedova, A.V.; Borodinecs, A.B. The building extension with energy efficiency light-weight building walls. Mag. Civ. Eng. 2018, 84, 67–74. [Google Scholar] [CrossRef]
  2. The BRE Centre for Resilience. Overheating in dwellings Guidance Document. 2016. Available online: https://www.bre.co.uk/filelibrary/Briefing%20papers/116885-Overheating-Guidance-v3.pdf (accessed on 24 October 2020).
  3. Aebischer, B.; Henderson, G.; Jakob, M.; Catenazzi, G. Impact of climate change on thermal comfort, heating and cooling energy demand in Europe. In Proceedings of the ECEEE 2007 Summer Study, La Colle sur Loup, France, 4–9 June 2007; pp. 859–870. [Google Scholar]
  4. Maivel, M.; Kurnitski, J.; Kalamees, T. Field survey of overheating problems in Estonian apartment buildings. Archit. Sci. Rev. 2015, 58, 1–10. [Google Scholar] [CrossRef]
  5. Gorshkov, A.S.; Vatin, N.I.; Rymkevich, P.P. Climate change and the thermal island effect in the million-plus city. Constr. Unique Build. Struct. 2020, 89, 8902. [Google Scholar] [CrossRef]
  6. De Luca, F.; Dogan, T.; Kurnitski, J. Methodology for determining fenestration ranges for daylight and energy efficiency in Estonia. In Proceedings of the Simulation Series, Delft, The Netherlands, 5–7 June 2018; Volume 50, pp. 47–54. [Google Scholar]
  7. Borodinecs, A.; Zemitis, J.; Geikins, A.; Bykova, I.; Nefedova, A.; Kupavykh, S. Energy-efficient construction in the climatic conditions of Latvia. Constr. Unique Build. Struct. 2018, 66, 41–48. [Google Scholar] [CrossRef]
  8. International Energy Agency. The Future of Cooling. Available online: https://www.oecd-ilibrary.org/energy/the-future-of-cooling_9789264301993-en (accessed on 24 October 2020).
  9. Saffari, M.; De Gracia, A.; Ushak, S.; Cabeza, L.F. Economic impact of integrating PCM as passive system in buildings using Fanger comfort model. Energy Build. 2016, 112, 159–172. [Google Scholar] [CrossRef] [Green Version]
  10. Zeinelabdein, R.; Omer, S.; Gan, G. Critical review of latent heat storage systems for free cooling in buildings. Renew. Sustain. Energy Rev. 2018, 82, 2843–2868. [Google Scholar] [CrossRef]
  11. Voelker, C.; Kornadt, O.; Ostry, M. Temperature reduction due to the application of phase change materials. Energy Build. 2008, 40, 937–944. [Google Scholar] [CrossRef] [Green Version]
  12. Arce, P.; Castellón, C.; Castell, A.; Cabeza, L.F. Use of microencapsulated PCM in buildings and the effect of adding awnings. Energy Build. 2012, 44, 88–93. [Google Scholar] [CrossRef]
  13. Evola, G.; Marletta, L.; Sicurella, F. A methodology for investigating the effectiveness of PCM wallboards for summer thermal comfort in buildings. Build. Environ. 2013, 59, 517–527. [Google Scholar] [CrossRef]
  14. Barzin, R.; Chen, J.J.J.; Young, B.R.; Farid, M.M. Application of PCM energy storage in combination with night ventilation for space cooling. Appl. Energy 2015, 158, 412–421. [Google Scholar] [CrossRef]
  15. Vanaga, R.; Blumberga, A.; Freimanis, R.; Mols, T.; Blumberga, D. Solar facade module for nearly zero energy building. Energy 2018, 157, 1025–1034. [Google Scholar] [CrossRef]
  16. Osterman, E.; Hagel, K.; Rathgeber, C.; Butala, V.; Stritih, U. Parametrical analysis of latent heat and cold storage for heating and cooling of rooms. Appl. Therm. Eng. 2015, 84, 138–149. [Google Scholar] [CrossRef]
  17. Darzi, A.A.R.; Moosania, S.M.; Tan, F.L.; Farhadi, M. Numerical investigation of free-cooling system using plate type PCM storage. Int. Commun. Heat Mass Transf. 2013, 48, 155–163. [Google Scholar] [CrossRef]
  18. Borcuch, M.; Musiał, M.; Sztekler, K.; Kalawa, W.; Gumuła, S.; Stefański, S. The influence of flow modification on air and PCM temperatures in an accumulative heat exchanger. In Proceedings of the EPJ Web of Conferences, Mikulov, Czech Republic, 21–24 November 2017; Volume 180. [Google Scholar]
  19. Borderon, J.; Virgone, J.; Cantin, R. Modeling and simulation of a phase change material system for improving summer comfort in domestic residence. Appl. Energy 2015, 140, 288–296. [Google Scholar] [CrossRef]
  20. Wang, X.; Niu, J.; van Paassen, A.H.C. Raising evaporative cooling potentials using combined cooled ceiling and MPCM slurry storage. Energy Build. 2008, 40, 1691–1698. [Google Scholar] [CrossRef]
  21. Koschenz, M.; Lehmann, B. Development of a thermally activated ceiling panel with PCM for application in lightweight and retrofitted buildings. Energy Build. 2004, 36, 567–578. [Google Scholar] [CrossRef]
  22. Klinker, F.; Weinläder, H.; Konstantinidou, C. Dynamic Thermal Behaviour of Two Newly Developed PCM Cooling Ceiling Prototypes. Int. Sloar Energy Soc. 2015, 1–10. [Google Scholar] [CrossRef]
  23. Weinläder, H.; Klinker, F.; Yasin, M. PCM cooling ceilings in the Energy Efficiency Center—Passive cooling potential of two different system designs. Energy Build. 2016, 119, 93–100. [Google Scholar] [CrossRef]
  24. Rucevskis, S.; Akishin, P.; Korjakins, A. Numerical Study of Application of PCM for a Passive Thermal Energy Storage System for Space Cooling in Residential Buildings. In Proceedings of the IOP Conference Series: Materials Science and Engineering, Prague, Czech Republic, 17–21 June 2019; Volume 603. [Google Scholar]
  25. Rucevskis, S.; Akishin, P.; Korjakins, A. Performance Evaluation of an Active PCM Thermal Energy Storage System for Space Cooling in Residential Buildings. Environ. Clim. Technol. 2019, 23, 74–89. [Google Scholar] [CrossRef] [Green Version]
  26. ASHRAE ASHRAE Fundamentals. 2017. Available online: http://ashrae-meteo.info/v2.0/ (accessed on 24 October 2020).
  27. Empirical Validation of Iowa Energy Resource Station Building Energy Analysis Simulation Models. A Report of Task 22, Subtask A Building Energy Analysis Tools Project A.1 Empirical Validation June. 2001. Available online: http://www.task39.iea-shc.org/data/sites/1/publications/Iowa_Energy_Report.pdf (accessed on 24 October 2020).
  28. Sahlin, P.; Grozman, P. IDA Simulation Environment a tool for Modelica based end-user application deployment. In Proceedings of the 3rd International Modelica Conference, Linköping, Sweden, 3–4 November 2003; pp. 105–114. [Google Scholar]
  29. Modelica Association. Available online: https://www.modelica.org (accessed on 13 September 2020).
  30. Sahlin, P. NMF Handbook; KTH: Stockholm, Sweden, 1996. [Google Scholar]
  31. Sahlin, P.; Sowell, E.F. A neutral model format for building simulation models. IBPSA Build. Simul. Conf. 1989, 89, 147–154. [Google Scholar]
  32. Rubitherm GmbH Technical Data Sheet for RT22HC. Available online: https://www.rubitherm.eu/media/products/datasheets/Techdata_-RT22HC_EN_06082018.PDF (accessed on 5 May 2019).
  33. Anderlind, G. A new model for calculating the effects of two and three-dimensional thermal bridges. In Proceedings of the 5th Symposium Building Physics in the Nordic Contries; Chalmers Univerity of Technology: Goteborg, Sweden, 1999. [Google Scholar]
  34. Nageler, P.; Schweiger, G.; Pichler, M.; Brandl, D.; Mach, T.; Heimrath, R.; Schranzhofer, H.; Hochenauer, C. Validation of dynamic building energy simulation tools based on a real test-box with thermally activated building systems (TABS). Energy Build. 2018, 168, 42–55. [Google Scholar] [CrossRef]
  35. Cornaro, C.; Pierro, M.; Roncarati, D.; Puggioni, V. Validation of a PCM simulation tool in IDA ICE dynamic building simulation software using experimental data from solar test boxes. In Proceedings of the Building Simulation Applications, Bolzano, Italy, 8–10 February 2017; Volume 2017, pp. 159–166. [Google Scholar]
  36. Gorshkov, A.S.; Vatin, N.I.; Rymkevich, P.P.; Kydrevich, O.O. Payback period of investments in energy saving. Mag. Civ. Eng. 2018, 78, 65–75. [Google Scholar] [CrossRef]
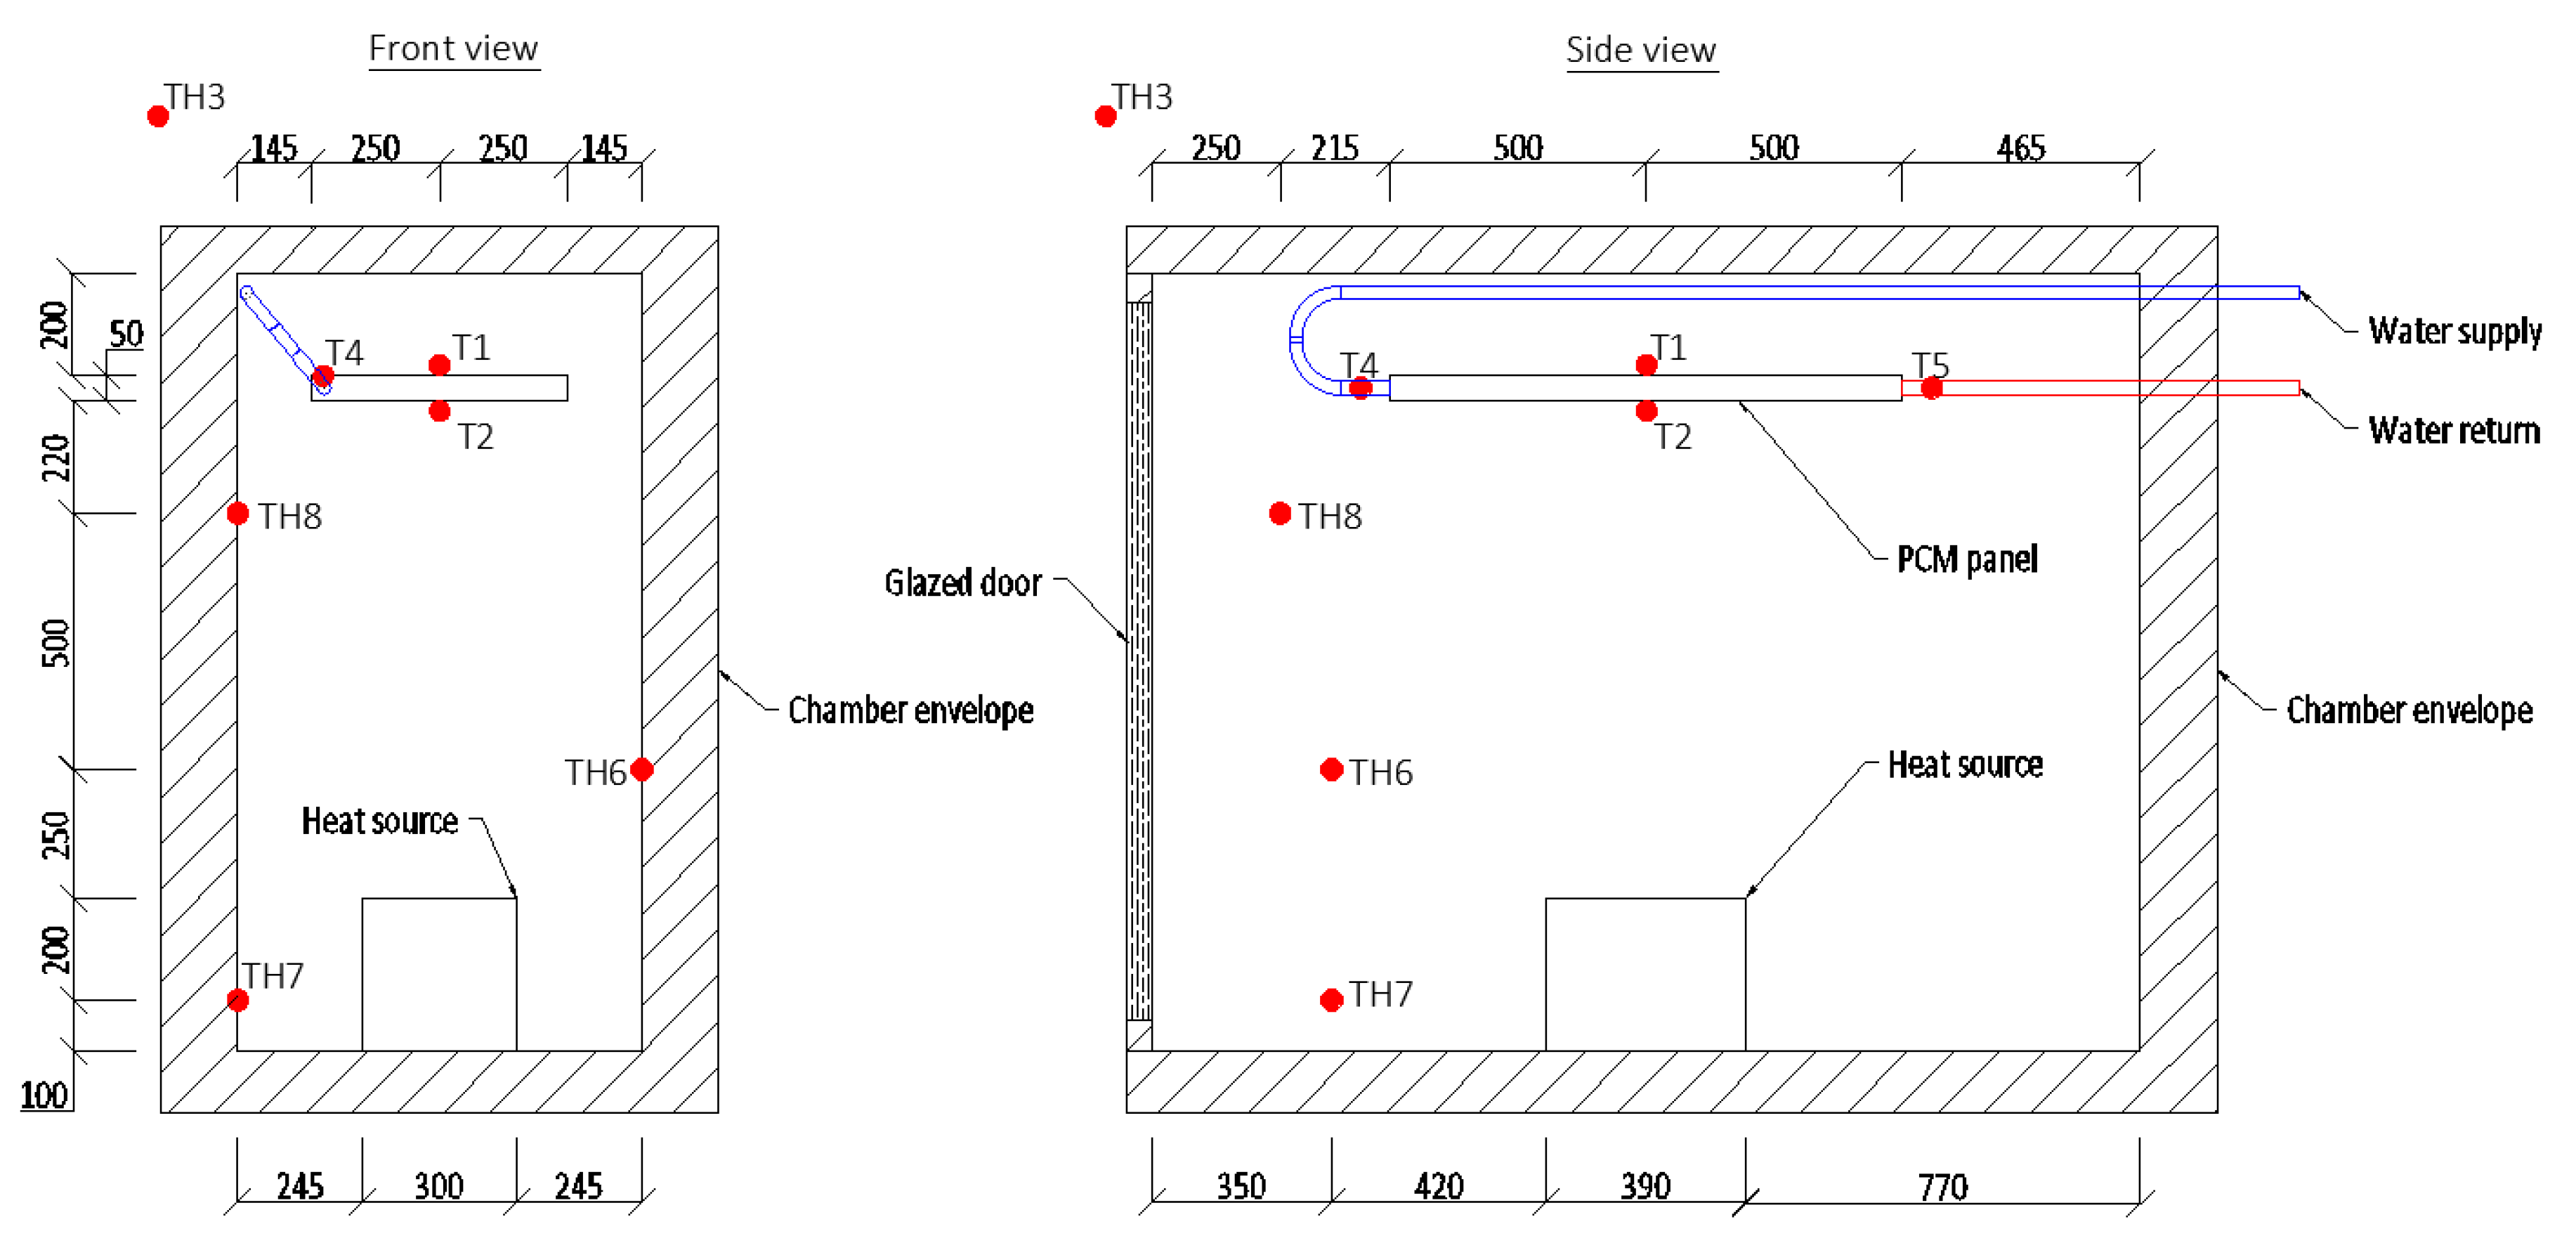
Figure 1. Test chamber used for the study (dimensions in mm).
Energies 13 05715 g001
Figure 2. Temperatures inside the chamber when heated with 90.1 W heat source.
Energies 13 05715 g002
Figure 3. Cooling panel (dimensions in mm).
Energies 13 05715 g003
Figure 4. Heat supply schedule.
Energies 13 05715 g004
Figure 5. Heat source.
Energies 13 05715 g005
Figure 6. IDA ICE model of the PCM cooling panel.
Energies 13 05715 g006
Figure 7. Adjusted (a) and measured (b) partial enthalpy model of the PCM.
Energies 13 05715 g007
Figure 8. Simulation set from the previous study [24,25].
Energies 13 05715 g008
Figure 9. Simulated external solar radiation and air temperature conditions from the previous study [24,25].
Energies 13 05715 g009
Figure 10. Measurements versus simulation-case without a PCM cooling panel.
Energies 13 05715 g010
Figure 11. Scatter diagrams for measured chamber temperatures (probe TH6) vs. simulated value deviation from measured values (a) and measured chamber temperatures (probe TH6) vs. simulated chamber temperatures (b).
Energies 13 05715 g011
Figure 12. Air temperature measurements versus simulation—case with a PCM cooling panel.
Energies 13 05715 g012
Figure 13. Surface temperature measurements versus simulation—case with a PCM cooling panel.
Energies 13 05715 g013
Figure 14. Scatter diagrams for measured chamber temperatures (probe TH6) vs. simulated value deviation from measured values (a) and measured chamber temperatures (probe TH6) vs. simulated chamber temperatures (b).
Energies 13 05715 g014
Figure 15. Comparison of predicted room temperatures in IDA ICE and CFD simulations.
Energies 13 05715 g015
Figure 16. Scatter diagrams for room temperatures with active PCM panel simulated with IDA ICE vs. deviation from values simulated with CFD (a) and room temperatures simulated with IDA ICE vs. room temperatures simulated with CFD (b).
Energies 13 05715 g016
Table 1. 1% annual exceedance of outdoor air wet bulb temperature in different Baltic Sea region cities [26].
CityOutdoor Air Wet Bulb Temperature Corresponding 1% (87.6 H) Annual Exceedance 1
Riga (WMO 264220) 219.6 °C
Tallinn (WMO 260380) 219.0 °C
Helsinki (WMO 029750) 219.4 °C
Stockholm (WMO 024840) 218.8 °C
1 The wet bulb temperature that on average is exceeded 1% of the time on an annual basis; for example, if a year consists of 8760 h then on average in Riga the wet bulb temperature will be higher than 19.6 °C for 87.6 h per year. 2 Number of meteorological observing station according to World Meteorological Organization system of station index numbers.
Table 2. Composition of simulated zone envelope.
StructureMaterialDensity, kg/m³Specific Heat, J/(kg·°C)Thermal Conductivity, W/(m·°C)
Inner wall and slabsConcrete23228501.7
External wallOuter layer (30 mm)452.216500.112
Middle layer (290 mm)210.112500.062
Inner layer (30 mm)332.514500.077
WindowU-value = 1.9 W/m²K (g-value = 0.6)
Finishing layer of the ceilingGypsum8009500.15
Publisher’s Note: MDPI stays neutral with regard to jurisdictional claims in published maps and institutional affiliations.