Article

The Identification of Hotspots in the Bioenergy Production Chain

by
Magdalena Muradin
1,2,* and
Joanna Kulczycka
2,3
1
Institute of Management, Poznan University of Economics and Business, 61-875 Poznan, Poland
2
The Department of Policy and Strategic Research, Mineral and Energy Economy Institute of the Polish Academy of Sciences, 31-261 Krakow, Poland
3
Faculty of Management, AGH University of Science and Technology, 30-059 Krakow, Poland
*
Author to whom correspondence should be addressed.
Energies 2020, 13(21), 5757; https://doi.org/10.3390/en13215757
Submission received: 5 October 2020 / Revised: 28 October 2020 / Accepted: 30 October 2020 / Published: 3 November 2020
(This article belongs to the Special Issue Application of Management Tools in the Energy Sector)

Abstract

:
Increasing interest in bioenergy production in the context of the transition towards a circular economy and the promotion of renewable energy has produced demands for optimization of the value chain of energy production to improve the environmental viability of the system. Hotspot analysis based on life cycle assessment (LCA) contributes to the mitigation of environmental burdens and is a very important step towards the implementation of a bioeconomy strategy. In this study, hotspots identified using two parallel pathways: a literature review and empirical research on four different biogas plants located in Poland. LCA and energy return on investment (EROI) analysis of the whole bioenergy production chain were considered to identify unit processes or activities that are highly damaging to the environment. The biogas plants differ mainly in the type of raw materials used as an input and in the method of delivery. The results show that the most impactful processes are those in the delivery of biomass, especially road transport by tractor. The second contributor was crop cultivation, where fossil fuels are also used. Although the EROI analysis indicates a negligible impact of transport on the energy efficiency of bioenergy plants, the environmental burden of biomass transportation should be taken into consideration when planning further measures to support the development of the bioeconomy.

Graphical Abstract

1. Introduction

The transition towards a circular economy is a rapidly ongoing process in many EU Member States. The European Commission updated its Bioeconomy Strategy in 2018 [1] to promote the use of biological resources in a circular manner and to use energy from renewable sources [2]. In Poland, one of the chapters of the Road Map towards the Transition to a Circular Economy which was approved in September 2019 was dedicated to the bioeconomy. Moreover, the bioeconomy plays an increasingly important role as an important element of the National Smart Specializations (NSS) and contributes about 10% of the global production volume of the Polish economy. The bioeconomy includes all industries and sectors that produce and exploit biological resources and related services, playing a significant role in supporting economic growth, employment, energy supply, and the production of bioproducts [3], as well as in the transition away from a fossil-based carbon-intensive economy. For example in the energy sector, the main CO2-reduction potential in Sweden is within the transportation sector, in which emissions, according to a recent investigation, can be reduced by 80% by 2030 [4].
The development of a global bioeconomy requires adequate logistical infrastructure to support trade in biomass feedstock and intermediates [5], as such trade can be accompanied by environmental, social, and economic concerns. There are still many requirements that need to be fulfilled to achieve sustainable bioenergy production. In the case of biofuels, production hotspots face different issues depending on the type of biofuel generation considered, since food conflicts with 1G and disruption of the nitrogen cycle conflict with 3G biofuel production [6]. Bioenergy use in general faces competition for resources such as land, water, and fertilizer from the two other general uses of biomass: food production and biomaterials [7]. The production of bioenergy also needs public acceptance [8]. Public awareness and knowledge can contribute to social acceptance of new bioenergy technologies and improve consumers’ behavior in the field of energy consumption [9].
In discussing replacing energy from conventional sources with bioenergy, we also have to take into account the environmental burdens associated with the supply and transport of biomass. The promotion of sustainable resource management [10] and the promotion of renewable energy [11] are enhancing the share of bioenergy year on year. Consequently, the increasing use of bioenergy creates market demand for bioenergy resources [12]. Demand is changing from a local energy source to the acquisition of biomass from a wider geographical area, which, in turn, produces an increasing role of transport throughout the whole supply chain. This increases energy demand and, at the same time, the level of emissions, which in transport is determined primarily by the use of fossil fuels and leads to lower environmental viability and sustainability. The processing of biomass into bioenergy is assumed to be CO2-neutral, which is indeed true if we consider biomass processing itself. However, if we extend the boundaries of the system to the cultivation, harvesting, or transport of biomass, we can see that the system generates significant environmental burdens. Feedstock provision is a crucial aspect of the sustainability of bioenergy chains [13]. The transport of raw biomass to the site where it is converted to bioenergy still mainly takes place using conventional fossil fuels. Emissions from the transport sector account for as much as 24% of total anthropogenic CO2 emissions affecting climate change [14] and have grown rapidly over the past decade, increasing by 1.6% annually [15]. The technology for replacing conventional fuel with biomass is also connected with economic constraints, including the high costs of collection, transport, and storage of biomass and higher local emissions to the air from the movement of trucks, which can be avoided by building efficient source-to-plant pipeline systems for wet waste or the installation of farm-, home-, or market-based digesters [16], but this will still require considerable economic incentives/subsidies [17]. Even if the pipeline system needs energy to pump the feedstock, the amount of energy consumption is negligible.
The hierarchy of uses of global biomass is as follows: feed (58%), bioenergy (heat and power, 16%), food (14%), materials (10%), and biofuels (transport fuels, e.g., biodiesel and bioethanol, 1%) [18]. However, the share of renewable energy in energy consumption in the EU increased from 9.6% to 18.9% between 2004 and 2018 [19]. The Europe 2030 target is 32% by 2030. In 2017, primary energy production from renewable energy sources in the EU-28 accounted for more than one-quarter (29.9%) of the EU-28′s total energy production [19]. Moreover, the average share of energy from renewable sources in transport increased from 1.5% in 2004 to 8.3% in 2018. With Renewable Energy Directive (RED II), the EU agreed to set a target of 14% renewable energy (including liquid biofuels, hydrogen, biomethane, “green” electricity, etc.) being used in transport by 2030, with a 3.5% target for advanced biofuels [1]. Biomass for bioenergy (heat, electricity, and transport fuels) is the main source of renewable energy in the EU [19]. However, food–feed–fuel competition for biomass consumption is widely discussed [20]. Bioenergy consists of a wide range of feedstocks derived from agriculture, forestry, or biological waste; however, forestry continues to be the main source of biomass. Bioenergy contributes almost 60% of all renewables to the gross final energy consumption [19]. Like everywhere else in the EU, biomass is currently one of the most popular sources of renewable energy in Poland. With rational management, the use of biomass should be cascading [21] based primarily on its use for food production and as a raw material for the chemical, pharmaceutical, paper, and building materials industries as well as for the production of organic fertilizers. Only residual biomass and waste from the final stages of recycling should be used for energy purposes, with priority given to the production of biofuels and biogas. The bioeconomy can provide a strong stimulus to increase the innovation and competitiveness of entire industries; however, the use of biomass by industry is still not widespread in Poland. To support the development of the bioeconomy in the industrial sector, the principle of the cascading use of biomass is important, favoring the use of higher value-added technologies that allow the reuse and recycling of products and raw materials.
One of the documents that provide information about a stable framework for a sustainable, economically effective transformation in the energy sector to support the development of the bioeconomy in Poland is the National Energy and Climate Plan for the years 2021–2030. The document describes the national objectives and targets of the Polish energy and climate policy to 2030 which are inter alia a 14% share of renewable energy in transport, a 32% share of renewable sources of energy (RES) in electricity production, and a 7% reduction of CO2 emissions in non-ETS sectors by 2030 [22]. This is planned to be achieved by the creation of new support and promotion mechanisms for offshore wind energy, renewable energy microinstallations, and the bioenergy sectors including advanced biofuels.
The environmental performance of bioenergy production can be assessed by the life cycle assessment approach based on ISO 14040:2009. This approach is a very valuable tool permitting the evaluation of products, processes, and services using energy efficiency indicators. One of these, energy return on investment (EROI), is an indicator of the capacity of a bioenergy production activity designed to assess the physical viability of the process, including its socioeconomic functions, regardless of the effects of externalities [23].
The objective of this study was to evaluate the environmental impact of transportation in the bioenergy production chain and its relevance in the whole life cycle of biomass production and conversion to bioenergy. The environmental impact of the transport of biomass by road from the site of production to the site of processing was also considered, as was its share in the total impact of the bioenergy produced. An analysis of its energy efficiency was also carried out, depending on the type of transport and distances over which the raw material for bioenergy production is transported. The research was carried out for four biogas plants differing in the type of raw materials and modes of transport used. Moreover, the article contains a literature review of the environmental hotspots in the bioenergy production chain focusing on the process of delivery of raw materials. Hotspot identification in the bioenergy value chain seems to be crucial in the development of the bioeconomy. The production of innovative materials and products within the bioeconomy requires a continuous supply of quality biomass. Therefore, it is important to build local value chains in the areas around local biorefineries that are able to produce high-quality bioresidue material in quantities consistent with entrepreneurs’ needs. At the same time, it is important to be aware of the environmental risk and have knowledge of the types of risks and ways of reducing them.

2. Materials and Methods

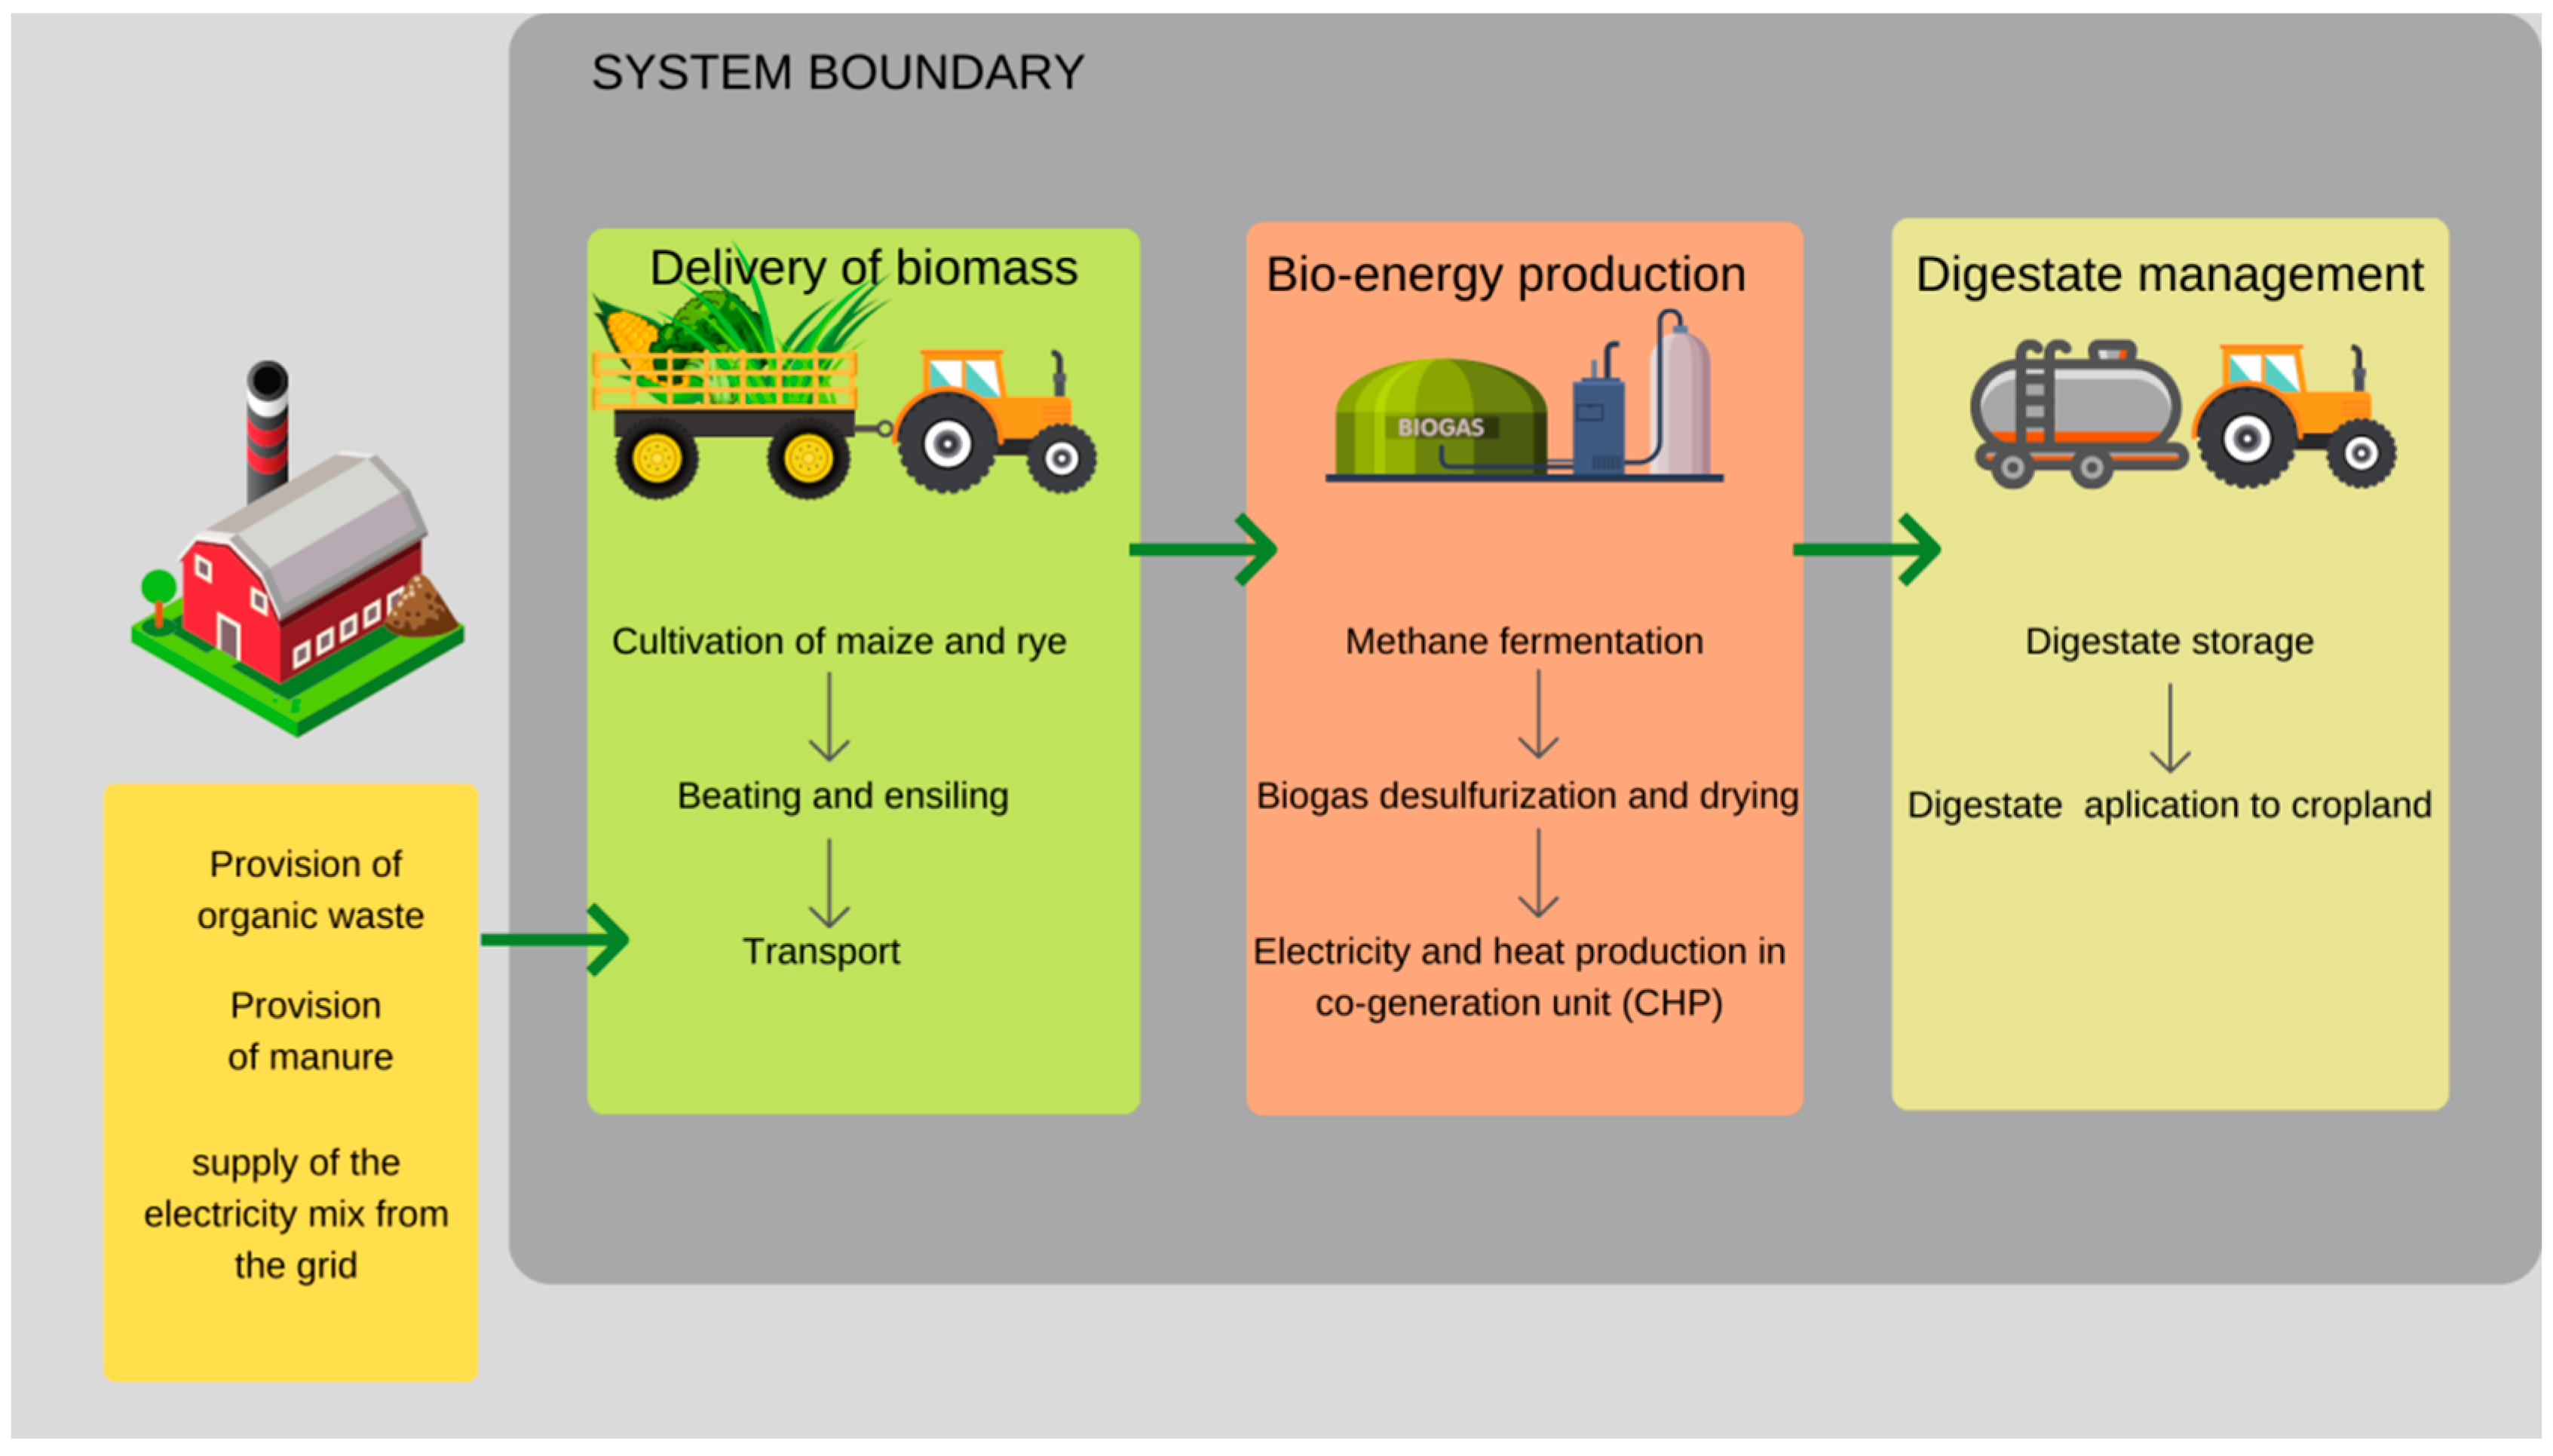
2.1. Goal and the Scope of the Study

This research described in this article involves LCA methodology based on ISO 14040:2009 guidelines, which provide a comprehensive assessment of the environmental impact of a bioenergy production system throughout its whole life cycle. LCA analysis was considered using the Impact 2002+ method with the endpoint approach to highlight the share of selected hotspots in the cumulative environmental impact of the biogas production chain, including the transport of biomass. The following fourteen impact potentials were calculated based on the chosen method: carcinogens, noncarcinogens, respiratory inorganics, ionizing radiation, ozone layer depletion, respiratory organics, aquatic ecotoxicity, terrestrial ecotoxicity, terrestrial acidification, land occupation, aquatic acidification, aquatic eutrophication, global warming, nonrenewable energy, and mineral extraction. The choice of this method for the study is based on the fact that it was used in research on bioenergy production in biogas plants [24,25]. An additional benefit of this method is the possibility to use the endpoint approach, where the environmental burdens are expressed in cumulative eco-indicator (Pt) using the weighting of standardized results. We considered four different scenarios based on case studies of four biogas plants located in Poland. The functional unit (FU) was used as a reference to quantify all inputs and outputs and is defined as 1000 MWh of electricity produced. The functional unit was set in regard to different plant efficiencies and electrical power.
Energy return on investment (EROI) is an energy efficiency indicator based on the LCA approach. This factor can measure the economic efficiency of an energy source. It determines the amount of net energy produced by the source (power plant), taking into account the energy flows involved in all stages of the production process during its lifetime for construction, fuel supply costs, maintenance, and decommissioning [26,27]. To fulfill all the requirements for a bioeconomy, bioenergy production should also be analyzed in terms of energy efficiency. EROI is most usually applied to, for example, the processing of biofuels [28].
EROI is dimensionless because both sides of the equation are in the same units. It is described as follows:
EROI = Energy output/Energy input,
Therefore, EROI is the ratio of energy gained in the energy generation process to energy used for this process. EROI by itself can be helpful for policy decisions, especially to show differences between competing energy sources [28]. EROI can display the impact of small changes in the main factors that can have a large impact on profits.

2.2. Allocation

In this study, the primary production of the input of raw materials and pig slurry was allocated to the primary user/producer. Therefore, the environmental burdens stemming from those processes were excluded from the system boundaries. It was also considered that the main product is electricity with 100% allocation, but the main purpose of these plants is biomass waste management. Only the cultivation of maize was taken into consideration as dedicated tillage.

2.3. Description of Scenarios

Four different biogas plants located in a rural area with installed power ratings of 1.0 MW (S01, S02) and 0.526 MW (S03, S04) were considered in this study. In three biogas plants, the slurry digestate is used as a natural fertilizer on arable fields without separation; in one case (S04), the slurry digestate is separated into two fractions: liquid and solid. The liquid is spread on arable fields and the solid fraction is used in a cowshed. The construction and demolition of the biogas plant were excluded from the scope of the study due to their negligible impact. The boundaries of the study included crop cultivation, delivery of biomass to the plant, energy production from biogas, storage of digestate, and application to fields (Figure 1). Input data were collected for the separate unit processes involved in modern mesophilic fermentation technology. Scenarios mainly differ in the type of raw materials (biomass) used as an input and the way that biomass is delivered (Table 1).
The production of electricity in high-efficiency cogeneration is based on the combustion of biogas produced from biomass through methane fermentation. The main product of biogas combustion in a cogeneration unit is electricity, but heat is also produced as an exothermic effect of combustion. Thanks to the installation of heat exchangers in the place of cooling the engine with water and on the exhauster in the place of the hot exhaust gas outlet, it is possible to obtain a similar amount of heat produced. A common situation is to find that the heat generated is only used in the form of hot water for the plant’s own heating purposes [29,30]. In the scenarios analyzed, it is only in scenario S01 that there is no potential for the heat to be utilized. In the other scenarios, heat is used to heat the fermentation tanks. The surplus heat in the form of steam is transferred to food industries or an agricultural holding nearby (Table 2).
The biomass delivery was mainly carried out by means of tractors and lorries. Only in S03 and S04 a gravity pipeline was used to transport liquid biomass with a low content of dry matter (Table 1). Inventory data from the Ecoinvent database were used for analysis related to the production of tractors and lories, their operation stage, and the amount of emissions from the combustion of diesel fuel. The data regarding the cultivation of energy crops were collected on the basis of empirical data as well as literature data and values included in the Ecoinvent database. Emissions from biogas combustion and digestate storage and digestate application were derived from [31,32,33].

3. Results and Discussion

3.1. Identification of Environmental Hotspots in the Bioenergy Production Chain Based on Literature Data

Depending on the kind of biofuels used for bioenergy production we can distinguish different environmental hotspots. For biomass pellets, transportation can play a negligible role if it is produced locally. Then, the highest environmental burdens are observed for the production process. The determination of hotspots also depends to a large extent on the boundaries of the system and the source of the biomass. The production of bioenergy rather than energy from conventional fuels leads to a reduction in CO2 emissions which can contribute to mitigating climate change [34]. However, literature research indicates that considering bioenergy over the whole cradle-to-cradle life cycle identifies environmental burdens in specific areas of the whole production chain [35]. Fazio and Monti claim that cradle-to-farm processes may account for up to 95% of total impacts. Lijó et al. also emphasize that the cultivation step represents the most important environmental hotspot [36]. Depending on the biomass and type of bioenergy, there is also a high impact observed in the land use change category [37]. This concerns dedicated crops and first-generation biofuels. Bioenergy generation from forest biomass mostly affects the environment during its transportation [38] from the production site to the processing site, especially when it is transported over long distances or across borders [39]. González-García and Bacenetti indicate that the key to improving the environmental performance of bioenergy production is feedstock distribution [40]. Large transport distances cause a high environmental impact and consumption of primary energy [41]. In many studies, the authors suggest that transport and biomass delivery play very important roles in the environmental impact of the bioenergy production chain (Table 3). However, they mainly refer to the significance of transport, although they do not determine the magnitude of this impact [42,43,44]. It is more difficult to find studies that directly indicate the share of transport in the environmental impact of the whole bioenergy production chain [31] (Table 3).
Environmental impact has been assessed for the whole production chain [24,48] and for just the biomass supply chains [13,49,50,51] of bioenergy systems. The different scope of the studies and system boundaries can change the way the magnitude of the environmental impact is viewed and the share of particular unit processes involved. Looking at the wider perspective of system boundaries, the transport of raw materials in a whole production chain can have lower importance than in the supply chain of a bioenergy system. Substituting fossil fuels with biofuels could significantly reduce greenhouse gas emissions and air pollution (e.g., particulate matter). However, the impacts of biofuel production on biodiversity and water quantity and quality vary greatly between biomass types, land sources, and management practices. Improved agricultural management and landscape planning can be beneficial to ecosystem services [52]. Paolotti et al. mention that attention should be paid to transport in terms of environmental impact and that bioenergy supply chains should be as short as possible [39]. The environmental impact of biomass energy production [53] is lower than that in the case of energy produced from oil but still higher than that of natural gas in terms of the amount of useful heat produced, assuming that there is only local transport involved.
The most common type of biomass distribution to bioprocessing plants such as biorefineries or biogas plants is road transport, with a maximum distance from the location where the biomass is produced of 100 km, which in most cases imposes unreasonable environmental costs [53,54]. The shortest optimal distance between farms and biogas plants is 5 km [55]. Tsapekos et al. have shown that a total distance of more than 75 km for all the necessary transport, together with other factors such as low methane yields, may result in failure to achieve the environmental effects of the entire bioenergy system [25]. Therefore, the location of a bioelectric power plant is important and should be carefully selected during the construction planning stage [44,45,56].
In the literature, studies on wood pellets by energy authors claim that even long-range transportation has environmental benefits over fossil fuels [12,57,58]. However, long-distance road transport, in particular, has a significant impact on environmental performance in relation to locally produced biomass [36,59]. Bacenetti et al. highlight that the solution to decreasing the impact of transport could be the use of high-energy-density biomass, e.g., silages obtained by a high cut or using the ear only [50]. However, as far as this matter is concerned, a technoeconomic analysis should be also conducted. The same point is made by Beagle and Belmont, who analyzed emissions from biomass transport for bioenergy production, including cross-border road, train, and sea transport [60]. They point out that as far as the distribution of biomass is concerned, the best results are obtained when pellets with increased density and higher calorific value are transported.

3.2. Life Cycle Impact Assessment

In this article, we focus on hotspots which seem to be crucial for bioenergy production from biogas. The hotspot identification was based on experimental data that were obtained from tested biogas plants. All these hotspots were selected based on life cycle assessment study and environmental impact results for particular processes in the whole bioenergy production chain:
  • Crop cultivation;
  • Delivery of biomass;
  • Energy production/plant operation;
  • Digestate management (storage and application).
All these hotspots are parallel to the unit processes that can be recognized within the biogas system boundary. The storage and application of digestate were taken as digestate management because in most cases, except S04, digestate is stored in a closed tank without electricity use for mixing, which has a negligible impact. Based on the share of unit processes in the total environmental impact of a whole production chain of investigated biogas plants, shown in Figure 2, the main hotspots were identified. An endpoint approach of Impact 2002+ has enabled an easier comparison of the cumulative environmental impact of entire systems and particular factors. However, the distribution of the environmental impact for scenario S04 differs from others, so it should be pointed out that the same unit processes were responsible for 100% impact in all four scenarios.
All scenarios were compared in impact categories based on the Impact 2002+ method (Table 4). Scenario S04 shows the best environmental performance in every impact category (Table 4). Focusing on the global warming, nonrenewable energy, and mineral extraction categories, it indicates that the influence of the biomass delivery process on climate change and resources is substantial and that the reduction of the transport distance in the S04 scenario can improve results tenfold, comparing with S01. However, burdens concerning the other impact categories can also be attributed to transport processes, although to a lesser extent. With regard to the methodology and the assignment of environmental loads to the different impact categories, these results are consistent with those of Huopana et al., who claim that the distance of biomass transportation has an influence on global warming potential, especially if the feedstock is biomass with low biogas production potential [61]. In three scenarios the unit process of biomass delivery is the largest of the environmental burdens in the bioenergy production chain (Figure 2). The main factor that is responsible for the high environmental impact of the biomass delivery process in biogas plant S01 is the pig slurry transportation by tractor with a barrel. A high amount of low-methane-efficiency slurry, with even short transportation distance, generates significant environmental burdens (90% of a whole biomass delivery process). In the S04 scenario, only internal transportation takes place. This means that all raw materials were transported within the boundaries of biogas plant, because the household is located on its premises.
Biomass delivery is the main contributor in three scenarios. It almost reaches 81%, 84%, and 67% shares of environmental impact in the whole production chain in scenarios S01, S02, and S03, respectively (Figure 2). In Figure 3, it can be seen that the delivery of biomass is also the prevailing contributor in every impact category. The highest contribution is observed for scenarios S01 and S03. Even though the longest distance from the production site to the plant in scenario S01 is only 5 km, the main contributor to the impact is the number and the frequency of transport movements. The main input consists of pig slurry with a low methane efficiency which is transported by barrel tractor. This type of transport consumes large amounts of fossil fuel and produces harmful emissions which mainly have an influence on the global warming (6.81 × 10⁶ kg CO2 eq), nonrenewable energy (1.08 × 10⁸ MJ primary), and mineral extraction (6.57 × 10⁵ MJ surplus) impact categories (Table 4). On the other hand, according to Boulamanti et al., transport also shows a significant environmental burden for other types of raw materials with higher dry matter parameters and with increasing distance of delivery [62]. As a way to maintain a balance of ecosystems and minimize excessive use of slurry as fertilizer in one region compared with another, one can develop a slurry trade between biogas plants from different regions with different pig populations [63]. Research shows that it is even more ecologically and economically efficient to first separate the liquid fraction of pig slurry and transport only the dry fraction [63]. Literature sources also state that the provision of feedstock and its transportation over long distances causes the highest environmental impact related to the use of fossil fuels in the life cycle of agricultural biogas plants [50]. The impact of the bioenergy production chain in biogas plants can even be comparable with the impact of a conventional power plant, depending on the biomass delivery process used [64].
On the other hand, the prevailing process in scenario S04 is digestate management (DM) (Figure 2). Only in the S04 scenario is the digestate stored in an open tank, so emissions to the air are higher. However, if we compare absolute values, the storage of the application of digestate brings almost negligible impact in relation to the biomass delivery process in other scenarios (Figure 3). The DM process does not show the impact in every impact category. This process does not contribute to the carcinogens, ionizing radiation, ozone layer depletion, or respiratory organics. The environmental burdens are mainly correlated with emissions of methane and ammonium and the methane emissions’ main impact is on global warming, where the ammonium is responsible for ecotoxicity and acidification (Figure 3). Based on these results, it can be concluded that the methods of digestate management do not have a significant impact as a hotspot.
The second contributor is the crop cultivation process, which varies between 12 and 28% of total share (Figure 2). The same applies in relation to the impact categories (Figure 3). Comparing to biomass delivery, crop cultivation has a rather low effect, but cannot be neglected. This process mostly affects the land occupation category. The high share of the crop cultivation for S01 and S02 is related to the ensilage and storage of raw maize at the biogas plant grounds. In the case of scenario S04, the impact of the biomass delivery process in all categories is negligible. This is directly related to the lack of external road transport of biomass and the use of gravity pipeline for transportation of liquid inputs. Beyond the land occupation category, the highest environmental impact for the crop cultivation process was observed in scenario S03 (Figure 3). Only in the S03 scenario is the external supplier responsible for providing corn silage, which causes the crop cultivation process to include burdens from ensilaging raw maize in plastic tunnels and transport of silage to the biogas plant over 60 km with a 16–32 t Euro 4 lorry. There is no possibility to ensilage the raw maize on site, due to the localization of the biogas plant S03. System boundaries have not changed, but the background of the scope of the study has changed. Although there are differences in the allocation of unit processes to corn cultivation, the key process is related to the transport of feedstock. In scenarios S01, S02, and S04, raw maize or rye is transported to the biogas plant and ensilaged on site. Harvesting of raw maize for these three biogas plants is carried out in the nearest vicinity (within a distance of 1 km at the most) by a tractor with a trailer. However, the transport of raw maize and rye for S02 and S03 was considered in the biomass delivery unit process; this process also requires the use of fossil fuels for the agricultural machinery and mainly causes emissions to the air. Such processes as sowing, harrowing, plowing, pesticide spraying, and harvesting were assigned to crop cultivation. The main environmental burdens are observed in the same impact categories as for the delivery of biomass. Therefore, depending on the type and amount of raw material (crops or organic wastes) used as an input, crop cultivation can be named as a hotspot in the bioenergy production chain.
It is also worth mentioning the digestate management process, where the transport of digestate is also included. The results show a very low environmental impact of this process (Figure 2) because the digestate is only applied on fields in the vicinity of the plant, so the distance between the installation and the field was less than 1 km on average. The application technology is also aided by covering the fertilizer with soil, meaning that emissions to the air during spreading are negligible.
The energy production process is strictly bonded with plant operation, where all environmental burdens are caused by electricity and heat use and emissions released to the air from biogas combustion. In Figure 3, it can be seen that the share of the energy production in each category is also negligible compared with other processes.

3.3. The Energy Efficiency Indicator

The energy efficiency indicator EROI was estimated by including the energy input and output in the whole production chain of bioenergy from biogas, including crop cultivation, biomass delivery, energy and heat consumption and production during plant operation, digestate storage and application, and labor (Table 5). The data for energy output and input were based mainly on empirical experiences from investigated biogas plants. The energy contained in the machinery was not included—only the usage step was taken into account. Human labor was assessed by considering that 1 Mh corresponds to 100 MJ, where the crop cultivation was evaluated based on [23]. Scenario S02 shows the highest energy efficiency among all scenarios studied (Table 5). This is also seen with the EROI indicator. The least efficient is scenario S01. The minimum EROI value should be 3, based on the findings that two units of energy are required for other maintenance processes before society receives one unit of energy provision [65]. All four biogas plants have different energy inputs and outputs, as well as differences in the use of heat waste for their own purposes (Table 2). The use of heat and electricity in biogas plants mainly depends on technical advancement, type of feedstock (solid or liquid), and the use of machinery. It has a significant impact on the energy efficiency and EROI value.
The EROI value for the biogas plants tested (Table 5) is comparable with results found in the literature for different bioenergy sources [66,67]. The EROI decreases with increasing distance of transportation [66]; however, the EROI fluctuates over a small range, especially for S01 and S04 where the biomass is delivered to the installation on a local scale. The small impact of transport on EROI results does not correlate with the LCA results, where for three scenarios, excluding S04, the contribution of biomass delivery was substantial.
This stems from the fact that only the energy efficiency is calculated in EROI, whereas the LCA analysis also takes into account the vehicle or engine type and emissions to the air from fuel combustion.

4. Conclusions

The results show that one of the stages of the bioenergy production chain that has the greatest impact is the distribution of biomass. Road transport has a significant impact on the value of environmental performance. In the development of a biobased economy, the reduction of fossil fuel use and climate change mitigation should be priorities in the case of bioenergy production from biomass. These goals can be achieved by changing the method of biomass distribution and increasing the share of biofuels in transport. The environmental impact can be minimized by the use of gravity pipelines, as in the case of biogas plants S03 and S04, in the case of raw materials with low dry matter content and low biogas production capacity. However, this is only a solution if the installation is close to the biomass source. Otherwise, the other solution could be to replace fossil fuels in vehicles with biofuels, which would reduce anthropogenic CO2 emissions to the atmosphere.
The second contributor to the environmental impact of bioenergy production is the crop cultivation process. This stems from the use of agricultural machinery which also operates using diesel fuels. Energy crops have a high dry mass density and biogas yield compared with other kinds of biomass, and their fields are located relatively close to the biogas plants, which reduces transport emissions. The solution could be to change the feedstock to input biowaste, but with similar parameters to energy crops and also locally acquired.
Importantly, the LCA results presented in the impact categories are not reflected in the EROI results for energy efficiency. In this case, the impact of transport on EROI is small and does not significantly affect the energy efficiency of the entire bioenergy production chain. The EROI values for all four cases were at an acceptable level compared to other bioenergy technologies [68]. The stability of the EROI under the transport distance fluctuations indicates that changes in any direction do not have a significant impact on energy efficiency in the case studies presented. This means that the bioenergy production chains which support the transition to a bioeconomy should be analyzed from the point of view of environmental burdens to improve environmental performance and diminish CO2 emissions.
In biogas plants, two main processes are taken as hotspots: biomass delivery and crop cultivation. Thus, the literature analysis and the results of experimental analysis lead to the conclusion that transport is a weak point in the bioenergy production chain and needs special attention in the future development of the bioeconomy.
The transformation of the energy system towards a climate-neutral status is an objective in many EU documents and policies [69,70,71,72]. Research on new energy technologies and eco-innovative solutions is supported by the Cohesion Funds, H2020, and other programs [73]. However, it is important to focus on optimization. This involves not just taking account of the processes of the production and generation of energy but instead combining these concerns with the minimization of impact on the value chain, i.e., transport. The forecast use of biomass for energy purposes will need competitive and friendly transport taking into account the environmental and economic impacts of inputs and outputs over the whole life cycle.

Author Contributions

Conceptualization, M.M. and J.K.; methodology, M.M.; software, M.M.; validation, M.M.; formal analysis, M.M.; investigation, M.M.; resources, M.M. and J.K.; data curation, M.M.; writing—original draft preparation, M.M. and J.K.; writing—review and editing, M.M. and J.K.; visualization, M.M.; supervision, J.K.; project administration, J.K.; funding acquisition, J.K. All authors have read and agreed to the published version of the manuscript.

Funding

This research within the Bioren project (No. 818310) was funded under the EU Framework Programme for Research and Innovation Horizon 2020. The publishing of this work was also supported by National Center for Research and Development as a part of the oto–GOZ project.

Acknowledgments

Part of the studies used in this article was carried out at the Poznan University of Economics and Business under the supervision of Zenon Foltynowicz. The authors would like to thank the biogas plants’ owners and operators for providing the experimental data for this study.

Conflicts of Interest

The authors declare no conflict of interest. The funders had no role in the design of the study; in the collection, analyses, or interpretation of data; in the writing of the manuscript; or in the decision to publish the results.

References

  1. European Commission. A Sustainable Bioeconomy for Europe: Strengthening the Connection between Economy, Society and the Environment; European Commission: Brussel, Belgium, 2018. [Google Scholar]
  2. European Parliament. Directive (EU) 2018/2001 of the European Parliament and of the Council of 11 December 2018 on the Promotion of the Use of Energy from Renewable Sources; European Parliament: Strasbourg/Paris, France, 2018. [Google Scholar]
  3. Woźniak, E.; Twardowski, T. The bioeconomy in Poland within the context of the European Union. New Biotechnol. 2018, 40, 96–102. [Google Scholar] [CrossRef]
  4. Tullin, C. Heat Generation from Biomass in Sweden; Elsevier BV: Amsterdam, The Netherlands, 2016; pp. 241–265. [Google Scholar]
  5. Searcy, E.; Lamers, P.; Deutmeyer, M.; Ranta, T.; Hektor, B.; Heinimö, J.; Trømborg, E.; Wild, M. Commodity-Scale Biomass Trade and Integration with Other Supply Chains; Elsevier BV: Amsterdam, The Netherlands, 2016; pp. 115–137. [Google Scholar]
  6. Darda, S.; Papalas, T.; Zabaniotou, A. Biofuels journey in Europe: Currently the way to low carbon economy sustainability is still a challenge. J. Clean. Prod. 2019, 208, 575–588. [Google Scholar] [CrossRef]
  7. Moriarty, P.; Yan, X.; Wang, S.J. Liquid biofuels: Not a long-term transport solution. Energy Proc. 2019, 158, 3265–3270. [Google Scholar] [CrossRef]
  8. Moula, M.E.; Nyári, J.; Bartel, A. Public acceptance of biofuels in the transport sector in Finland. Int. J. Sustain. Built Environ. 2017, 6, 434–441. [Google Scholar] [CrossRef]
  9. Karytsas, S.; Theodoropoulou, H. Socioeconomic and demographic factors that influence publics’ awareness on the different forms of renewable energy sources. Renew. Energy 2014, 71, 480–485. [Google Scholar] [CrossRef]
  10. European Commission. Communication from the Commission to the European Parliament, The Council, The European Economic and Social Committee and the Committee of the Regions a New Circular Economy Action Plan for a Cleaner and More Competitive Europe COM/2020/98 Final; European Commission: Brussel, Belgium, 2020; p. 98. [Google Scholar]
  11. European Commission. Directive 2009/28/EC of the European Parliament and of the Council of 23 April 2009 on the Promotion of the Use of Energy from Renewable Sources and Amending and Subsequently Repealing Directives 2001/77/EC and 2003/30/EC; European Commission: Brussel, Belgium, 2009; p. 28/EC. [Google Scholar]
  12. Forsberg, G. Biomass energy transport. Biomass Bioenergy 2000, 19, 17–30. [Google Scholar] [CrossRef]
  13. Chary, K.; Aubin, J.; Guindé, L.; Sierra, J.; Blazy, J.-M. Cultivating biomass locally or importing it? LCA of biomass provision scenarios for cleaner electricity production in a small tropical island. Biomass Bioenergy 2018, 110, 1–12. [Google Scholar] [CrossRef] [Green Version]
  14. International Energy Agency CO2 Emissions from Fuel Combustion 2019. CO2 Emiss. Fuel Combust. 2019. [CrossRef]
  15. Hannula, I.; Reiner, D.M. Near-Term Potential of Biofuels, Electrofuels, and Battery Electric Vehicles in Decarbonizing Road Transport. Joule 2019, 3, 2390–2402. [Google Scholar] [CrossRef]
  16. Arodudu, O.; Voinov, A.; van Duren, I. Assessing bioenergy potential in rural areas—A NEG-EROEI approach. Biomass Bioenergy 2013, 58, 350–364. [Google Scholar] [CrossRef] [Green Version]
  17. Arodudu, O.; Holmatov, B.; Voinov, A. Ecological impacts and limits of biomass use: A critical review. Clean Technol. Environ. Policy 2020, 22, 1591–1611. [Google Scholar] [CrossRef]
  18. Piotrowski, S.; Carus, M.; Essel, R. Global Bioeconomy in the Conflict Between Biomass Supply and Demand. Ind. Biotechnol. 2015, 11, 308–315. [Google Scholar] [CrossRef]
  19. D’Adamo, I.; Rosa, P. Current state of renewable energies performances in the European Union: A new reference framework. Energy Conver. Manag. 2020, 121, 84–92. [Google Scholar] [CrossRef]
  20. Muscat, A.; de Olde, E.; de Boer, I.; Ripoll-Bosch, R. The battle for biomass: A systematic review of food-feed-fuel competition. Glob. Food Secur. 2020, 25, 100330. [Google Scholar] [CrossRef]
  21. Bais-Moleman, A.L.; Sikkema, R.; Vis, M.; Reumerman, P.; Theurl, M.C.; Erb, K.-H. Assessing wood use efficiency and greenhouse gas emissions of wood product cascading in the European Union. J. Clean. Prod. 2018, 172, 3942–3954. [Google Scholar] [CrossRef]
  22. Ministry of State Assets. Poland’s National Energy and Climate Plan for the Years 2021–2030; Ministry of State Assets: Warsaw, Poland, 2019; In Polish. [Google Scholar]
  23. Arodudu, O.; Helming, K.; Voinov, A.; Wiggering, H. Integrating agronomic factors into energy efficiency assessment of agro-bioenergy production—A case study of ethanol and biogas production from maize feedstock. Appl. Energy 2017, 198, 426–439. [Google Scholar] [CrossRef] [Green Version]
  24. Duan, N.; Khoshnevisan, B.; Lin, C.; Liu, Z.; Liu, H. Life cycle assessment of anaerobic digestion of pig manure coupled with different digestate treatment technologies. Environ. Int. 2020, 137, 105522. [Google Scholar] [CrossRef]
  25. Tsapekos, P.; Khoshnevisan, B.; Alvarado-Morales, M.; Symeonidis, A.; Kougias, P.; Angelidaki, I. Environmental impacts of biogas production from grass: Role of co-digestion and pretreatment at harvesting time. Appl. Energy 2019, 252, 113467. [Google Scholar] [CrossRef]
  26. Weißbach, D.; Ruprecht, G.; Huke, A.; Czerski, K.; Gottlieb, S.; Hussein, A. Energy intensities, EROIs (energy returned on invested), and energy payback times of electricity generating power plants. Energy 2013, 52, 210–221. [Google Scholar] [CrossRef]
  27. Hall, C.A.; Lambert, J.G.; Balogh, S.B. EROI of different fuels and the implications for society. Energy Policy 2014, 64, 141–152. [Google Scholar] [CrossRef] [Green Version]
  28. Murphy, D.J.; Hall, C.A.S. Year in review-EROI or energy return on (energy) invested. Ann. N. Y. Acad. Sci. 2010, 1185, 102–118. [Google Scholar] [CrossRef]
  29. de Vries, J.; Vinken, T.; Hamelin, L.; de Boer, I.J.M. Comparing environmental consequences of anaerobic mono- and co-digestion of pig manure to produce bio-energy—A life cycle perspective. Bioresour. Technol. 2012, 125, 239–248. [Google Scholar] [CrossRef] [Green Version]
  30. Lijó, L.; Lorenzo-Toja, Y.; González-García, S.; Bacenetti, J.; Negri, M.; Feijoo, G. Eco-efficiency assessment of farm-scaled biogas plants. Bioresour. Technol. 2017, 237, 146–155. [Google Scholar] [CrossRef]
  31. Fantin, V.; Giuliano, A.; Manfredi, M.; Ottaviano, G.; Stefanova, M.; Masoni, P. Environmental assessment of electricity generation from an Italian anaerobic digestion plant. Biomass Bioenergy 2015, 83, 422–435. [Google Scholar] [CrossRef]
  32. Hartmann, J.K. Life-Cycle-Assessment of Industrial Scale Biogas Plants. Ph.D. Thesis, Georg-August-Universitat Gottingen, Gottingen, Germany, 2006. Available online: https://d-nb.info/982240473/34 (accessed on 21 October 2020).
  33. de Vries, J.; Groenestein, C.; de Boer, I. Environmental consequences of processing manure to produce mineral fertilizer and bio-energy. J. Environ. Manag. 2012, 102, 173–183. [Google Scholar] [CrossRef] [Green Version]
  34. Gold, S.; Seuring, S. Supply chain and logistics issues of bio-energy production. J. Clean. Prod. 2011, 19, 32–42. [Google Scholar] [CrossRef]
  35. Fazio, S.; Monti, A. Life cycle assessment of different bioenergy production systems including perennial and annual crops. Biomass Bioenergy 2011, 35, 4868–4878. [Google Scholar] [CrossRef]
  36. Lijó, L.; González-García, S.; Bacenetti, J.; Negri, M.; Fiala, M.; Feijoo, G.; Feijoo, G. Environmental assessment of farm-scaled anaerobic co-digestion for bioenergy production. Waste Manag. 2015, 41, 50–59. [Google Scholar] [CrossRef]
  37. Secchi, S.; Kurkalova, L.; Gassman, P.W.; Hart, C. Land use change in a biofuels hotspot: The case of Iowa, USA. Biomass Bioenergy 2011, 35, 2391–2400. [Google Scholar] [CrossRef]
  38. Shabani, N.; Akhtari, S.; Sowlati, T. Value chain optimization of forest biomass for bioenergy production: A review. Renew. Sustain. Energy Rev. 2013, 23, 299–311. [Google Scholar] [CrossRef]
  39. Paolotti, L.; Martino, G.; Marchini, A.; Pascolini, R.; Boggia, A. Economic and environmental evaluation of transporting imported pellet: A case study. Biomass Bioenergy 2015, 83, 340–353. [Google Scholar] [CrossRef]
  40. González-García, S.; Bacenetti, J. Exploring the production of bio-energy from wood biomass. Italian case study. Sci. Total. Environ. 2019, 647, 158–168. [Google Scholar] [CrossRef] [PubMed]
  41. Caserini, S.; Livio, S.; Giugliano, M.; Grosso, M.; Rigamonti, L. LCA of domestic and centralized biomass combustion: The case of Lombardy (Italy). Biomass Bioenergy 2010, 34, 474–482. [Google Scholar] [CrossRef]
  42. Gao, C.-K.; Na, H.-M.; Song, K.-H.; Dyer, N.; Tian, F.; Xu, Q.-J.; Xing, Y.-H. Environmental impact analysis of power generation from biomass and wind farms in different locations. Renew. Sustain. Energy Rev. 2019, 102, 307–317. [Google Scholar] [CrossRef]
  43. Montemayor, E.; Bonmatí, A.; Torrellas, M.; Camps, F.; Ortiz, C.; Domingo, F.; Riau-Arenas, V.; Antón, A. Environmental accounting of closed-loop maize production scenarios: Manure as fertilizer and inclusion of catch crops. Resour. Conserv. Recycl. 2019, 146, 395–404. [Google Scholar] [CrossRef]
  44. Poeschl, M.; Ward, S.; Owende, P. Environmental impacts of biogas deployment—Part II: Life cycle assessment of multiple production and utilization pathways. J. Clean. Prod. 2012, 24, 184–201. [Google Scholar] [CrossRef]
  45. Muradin, M.; Joachimiak-Lechman, K.; Foltynowicz, Z. Evaluation of Eco-Efficiency of Two Alternative Agricultural Biogas Plants. Appl. Sci. 2018, 8, 2083. [Google Scholar] [CrossRef] [Green Version]
  46. Uusitalo, V.; Havukainen, J.; Manninen, K.; Höhn, J.; Lehtonen, E.; Rasi, S.; Soukka, R.; Horttanainen, M. Carbon footprint of selected biomass to biogas production chains and GHG reduction potential in transportation use. Renew. Energy 2014, 66, 90–98. [Google Scholar] [CrossRef]
  47. Rana, R.; Ingrao, C.; Lombardi, M.; Tricase, C. Greenhouse gas emissions of an agro-biogas energy system: Estimation under the Renewable Energy Directive. Sci. Total Environ. 2016, 550, 1182–1195. [Google Scholar] [CrossRef] [Green Version]
  48. González-García, S.; Dias, A.C.; Clermidy, S.; Benoist, A.; Bellon-Maurel, V.; Gasol, C.M.; Gabarrell, X.; Arroja, L. Comparative environmental and energy profiles of potential bioenergy production chains in Southern Europe. J. Clean. Prod. 2014, 76, 42–54. [Google Scholar] [CrossRef]
  49. Miguel, G.S.; Corona, B.; Ruiz, D.; Landholm, D.M.; Laina, R.; Tolosana, E.; Sixto, H.; Cañellas, I. Environmental, energy and economic analysis of a biomass supply chain based on a poplar short rotation coppice in Spain. J. Clean. Prod. 2015, 94, 93–101. [Google Scholar] [CrossRef]
  50. Bacenetti, J.; Lovarelli, D.; Ingrao, C.; Tricase, C.; Negri, M.; Fiala, M. Assessment of the influence of energy density and feedstock transport distance on the environmental performance of methane from maize silages. Bioresour. Technol. 2015, 193, 256–265. [Google Scholar] [CrossRef]
  51. Paolotti, L.; Martino, G.; Marchini, A.; Boggia, A. Economic and environmental assessment of agro-energy wood biomass supply chains. Biomass Bioenergy 2017, 97, 172–185. [Google Scholar] [CrossRef]
  52. Qin, Z.; Zhuang, Q.; Cai, X.; He, Y.; Huang, Y.; Jiang, D.; Lin, E.; Liu, Y.; Tang, Y.; Wang, M.Q. Biomass and biofuels in China: Toward bioenergy resource potentials and their impacts on the environment. Renew. Sustain. Energy Rev. 2018, 82, 2387–2400. [Google Scholar] [CrossRef]
  53. Rajaeifar, M.A.; Akram, A.; Ghobadian, B.; Rafiee, S.; Heijungs, R.; Tabatabaei, M. Environmental impact assessment of olive pomace oil biodiesel production and consumption: A comparative lifecycle assessment. Energy 2016, 106, 87–102. [Google Scholar] [CrossRef]
  54. Khoshnevisan, B.; Rafiee, S.; Tabatabaei, M.; Ghanavati, H.; Mohtasebi, S.S.; Rahimi, V.; Shafiei, M.; Angelidaki, I.; Karimi, K. Life cycle assessment of castor-based biorefinery: A well to wheel LCA. Int. J. Life Cycle Assess. 2017, 23, 1788–1805. [Google Scholar] [CrossRef]
  55. Styles, D.; Adams, P.; Thelin, G.; Vaneeckhaute, C.; Chadwick, D.; Withers, P.J.A. Life Cycle Assessment of Biofertilizer Production and Use Compared with Conventional Liquid Digestate Management. Environ. Sci. Technol. 2018, 52, 7468–7476. [Google Scholar] [CrossRef]
  56. van Stappen, F.; Mathot, M.; Decruyenaere, V.; Loriers, A.; Delcour, A.; Planchon, V.; Goffart, J.-P.; Stilmant, D. Consequential environmental life cycle assessment of a farm-scale biogas plant. J. Environ. Manag. 2016, 175, 20–32. [Google Scholar] [CrossRef] [PubMed]
  57. Röder, M.; Whittaker, C.; Thornley, P. How certain are greenhouse gas reductions from bioenergy? Life cycle assessment and uncertainty analysis of wood pellet-to-electricity supply chains from forest residues. Biomass Bioenergy 2015, 79, 50–63. [Google Scholar] [CrossRef]
  58. Damen, K.; Faaij, A. A Greenhouse Gas Balance of two Existing International Biomass Import Chains. Mitig. Adapt. Strat. Glob. Chang. 2006, 11, 1023–1050. [Google Scholar] [CrossRef]
  59. Dwivedi, P.; Johnson, E.; Greene, D.; Baker, S. Tracking Economic and Environmental Indicators of Exported Wood Pellets to the United Kingdom from the Southern United States: Lessons for Policy? BioEnergy Res. 2016, 9, 907–916. [Google Scholar] [CrossRef]
  60. Beagle, E.; Belmont, E. Comparative life cycle assessment of biomass utilization for electricity generation in the European Union and the United States. Energy Policy 2019, 128, 267–275. [Google Scholar] [CrossRef]
  61. Huopana, T.; Song, H.; Kolehmainen, M.; Niska, H. A regional model for sustainable biogas electricity production: A case study from a Finnish province. Appl. Energy 2013, 102, 676–686. [Google Scholar] [CrossRef]
  62. Boulamanti, A.K.; Maglio, S.D.; Giuntoli, J.; Agostini, A. Influence of different practices on biogas sustainability. Biomass Bioenergy 2013, 53, 149–161. [Google Scholar] [CrossRef]
  63. Garbs, M.; Geldermann, J. Analysis of selected economic and environmental impacts of long distance manure transports to biogas plants. Biomass Bioenergy 2018, 109, 71–84. [Google Scholar] [CrossRef]
  64. Bacenetti, J.; Sala, C.; Fusi, A.; Fiala, M. Agricultural anaerobic digestion plants: What LCA studies pointed out and what can be done to make them more environmentally sustainable. Appl. Energy 2016, 179, 669–686. [Google Scholar] [CrossRef] [Green Version]
  65. Hall, C.A.S.; Balogh, S.; Murphy, D.J.R. What is the Minimum EROI that a Sustainable Society Must Have? Energies 2009, 2, 25–47. [Google Scholar] [CrossRef]
  66. Yazan, D.M.; Fraccascia, L.; Mes, M.; Zijm, H. Cooperation in manure-based biogas production networks: An agent-based modeling approach. Appl. Energy 2018, 212, 820–833. [Google Scholar] [CrossRef]
  67. Chiriboga, G.; ve la Rosa, A.; Molina, C.; Velarde, S. Energy Return on Investment (EROI) and Life Cycle Analysis (LCA) of biofuels in Ecuador. Heliyon 2020, 6, e04213. [Google Scholar] [CrossRef]
  68. Fraccascia, L.; Yazan, D.M. The role of online information-sharing platforms on the performance of industrial symbiosis networks. Resour. Conserv. Recycl. 2018, 136, 473–485. [Google Scholar] [CrossRef]
  69. European Commission. The European Green Deal; European Commission: Brussel, Belgium, 2019; p. 640. [Google Scholar]
  70. von der Leyen, U. Mission Letter to Timmermans Responsible for the Green Deal; European Commission: Brussels, Belgium, September 2019. [Google Scholar]
  71. European Commission. National Energy and Climate Plans (NECPs). Available online: https://ec.europa.eu/energy/topics/energy-strategy/national-energy-climate-plans_en#national-long-term-strategies (accessed on 4 October 2020).
  72. European Commission. A Framework Strategy for a Resilient Energy Union with a Forward-Looking Climate Change Policy; European Commission: Brussel, Belgium, 2015; p. 80. [Google Scholar]
  73. EU Funding Possibilities in the Energy Sector. Available online: https://ec.europa.eu/energy/funding-and-contracts/eu-funding-possibilities-in-the-energy-sector_en (accessed on 4 October 2020).
Figure 1. System boundary of the bioenergy production in biogas plant.
Energies 13 05757 g001
Figure 2. The share of unit processes in the environmental impact of a whole production chain of investigated biogas plants, expressed in cumulative eco-indicator (Pt) for the functional unit, based on SimaPro calculations.
Energies 13 05757 g002
Figure 3. The share of hotspots in impact categories for investigated biogas plants (BD, biomass delivery; CC, crop cultivation; EP, energy production; DM, digestate management), based on SimaPro calculations.
Energies 13 05757 g003
Table 1. Life cycle inventory data of biomass input and delivery in relation to annual operations.
Biogas Plant ScenarioType of BiomassAnnual Amount of Biomass (tonnes/Year)Maximum Transportation Distance (km) One DirectionType of TransportMethane Efficiency 1 (m3/t of Input)
S01pig slurry14,8245.0tractor with a barrel8.6
maize silage21,6930.87tractor with trailer123.0
S02chicken manure15360.1tractor with a barrel182.0
maize silage10,7430.03telescopic handler123.1
raw maize11,9370.9tractor with trailer-
potato pulp2735.0tractor with trailer51.7
distillery residues391720.0tractor with a barrel30.8
slaughterhouse waste134780.0lorry 16–32 t, Euro 4225.1
sludges550100.0tanker 16–32 t, Euro 462.9
pig slurry565210.0tractor with a barrel8.6
animal fats552100.0tanker 16–32 t, Euro 4540.6
organic food waste854100.0lorry 3.5–7.5 t, Euro 471.5
S03raw maize22500.4tractor with trailer-
maize silage202545.0lorry 16–32 t, Euro 4121.9
distillery residues11,4900.1gravity pipeline17.1
potato pulp592011.3lorry 16–32 t, Euro 451.7
vegetables and fruit pomaces159622.5lorry 16–32 t, Euro 444.8
pig slurry5903.8tractor with a barrel5.4
protein residues403172.5lorry 16–32 t, Euro 4497.0
S04cattle manure12,8370.3telescopic handler46.8
maize silage (as residues from a household)9360.3tractor with trailer123.0
distillery residues10,8350.1gravity pipeline30.6
cattle slurry11070.3gravity pipeline17.1
raw rye24330.2telescopic handler-
rye silage21900.2tractor with trailer97.0
1 Experimental data taken from investigated biogas plants, based on their own laboratory tests.
Table 2. Life cycle inventory for energy production and use in four different biogas plants in MWh per year.
Type of EnergyS01S02S03S04
electricity produced7862622430073746
electricity used10201727598446
heat waste obtained7769795131934224
heat used (own purposes)14708764171232
heat sold-795118042253
Table 3. Environmental studies concerning the share of transport in the environmental impact of a system boundary process.
AuthorsType of BiomassDistanceShare of Transport in Environmental Impact of a Production Chain 1Type of TransportLCA Method
[24]pig manure20 km37% of total impact in baseline scenarioroad transport, lorry 7.5–16.0 metric tonsImpact 2002+
[45]energy crops, pig manure, agri-food residuesup to 3 km81%road transport, tractor with a barrel 16.0–22.0 metric tonsImpact 2002+
local transport on site of the farm3%pipeline, local transport on site from farm
up to 100 km84%road transport
up to 100 km67%road transport and pipeline
[46]biowaste13 km/tonne for biowaste~27%road truckGHG
agricultural biomasswithin 10 km of the plant8%tractor
[25]grass100 km from grassland to biogas plant and 25 km to farmland69% reduction of ecosystem quality and 21% of climate change from baseline scenario to minimal distancen.a.Impact 2002+
[39]pelletsCross-border distances 1000–2000 kmn.a.lorry 26–32Eco indicator 99
from USA to Italyn.a.freight ship
[47]maizemax 17 km4%Euro5 3.5–16.0 lorryGWP100
triticale6%
tritello1%
animal effluents6%
[48]eucalyptus logging108 kmthird contributor in all categories from 5 to 10%truckCML method
vineyard pruning residues9.5 kmsecond contributor in all categories from 5 to 20%tractor
66 kmtruck
poplar plantation SRC107 kmthird contributor in all categories from 2 to 10%truck
[42]straw20 km15%diesel tractorGW
1 Own calculation based on literature data.
Table 4. Characterization of environmental impact for functional units (FUs) produced in four different biogas plants based on SimaPro calculations, Impact 2002+ method.
Impact CategoryUnitS01S02S03S04
Carcinogenskg C2H3Cl eq7.72 × 1043.92 × 1043.55 × 1041.13 × 103
Noncarcinogenskg C2H3Cl eq1.54 × 1057.12 × 1045.87 × 1042.41 × 103
Respiratory inorganicskg PM2.5 eq6.79 × 1033.65 × 1035.24 × 1037.80 × 102
Ionizing radiationBq C-14 eq1.59 × 1087.67 × 1075.13 × 1071.97 × 106
Ozone layer depletionkg CFC-11 eq7.24 × 10-16.01 × 10-17.75 × 10-17.38 × 10⁻³
Respiratory organicskg C2H4 eq6.71 × 1033.48 × 1033.17 × 1031.36 × 102
Aquatic ecotoxicitykg TEG water4.42 × 1082.82 × 1083.35 × 1085.82 × 106
Terrestrial ecotoxicitykg TEG soil1.62 × 1081.21 × 1082.17 × 1082.68 × 106
Terrestrial acid/nutrikg SO2 eq1.85 × 1051.01 × 1051.69 × 1054.12 × 104
Land occupationm2org.arable8.56 × 1054.85 × 1052.13 × 1059.22 × 103
Aquatic acidificationkg SO2 eq3.36 × 1041.86 × 1042.74 × 1045.36 × 103
Aquatic eutrophicationkg PO4 P-lim1.47 × 1037.83 × 1026.60 × 1023.84 × 101
Global warmingkg CO2 eq6.81 × 1063.80 × 1065.11 × 1061.02 × 105
Nonrenewable energyMJ primary1.08 × 1087.37 × 1078.43 × 1071.19 × 106
Mineral extractionMJ surplus6.57 × 1052.45 × 1055.60 × 1041.04 × 104
Table 5. The values of energy return on investment in a 1-year period.
Biogas Plant ScenarioS01S02S03S04
energy input (GJ)crop cultivation3742715179
feedstock delivery271861499137
energy input/plant operation3672621721531606
heat input/plant operation5292315414984435
digestate storage092500
digestate application6429307923313517
man work181382382181
sum16,21914,89069139955
energy output (GJ)energy production28,30322,40610,82513,486
heat production529231,777799612,546
energy in digestate6549481036464799
sum40,14458,99322,46730,831
EROI2.483.963.253.10
EROI without energy for transportation2.504.173.373.13
Publisher’s Note: MDPI stays neutral with regard to jurisdictional claims in published maps and institutional affiliations.

