Effects of Relative Roughness and Particle Size on the Interface Behavior of Concrete Suction Caisson Foundation for Offshore Wind Turbines

Abstract
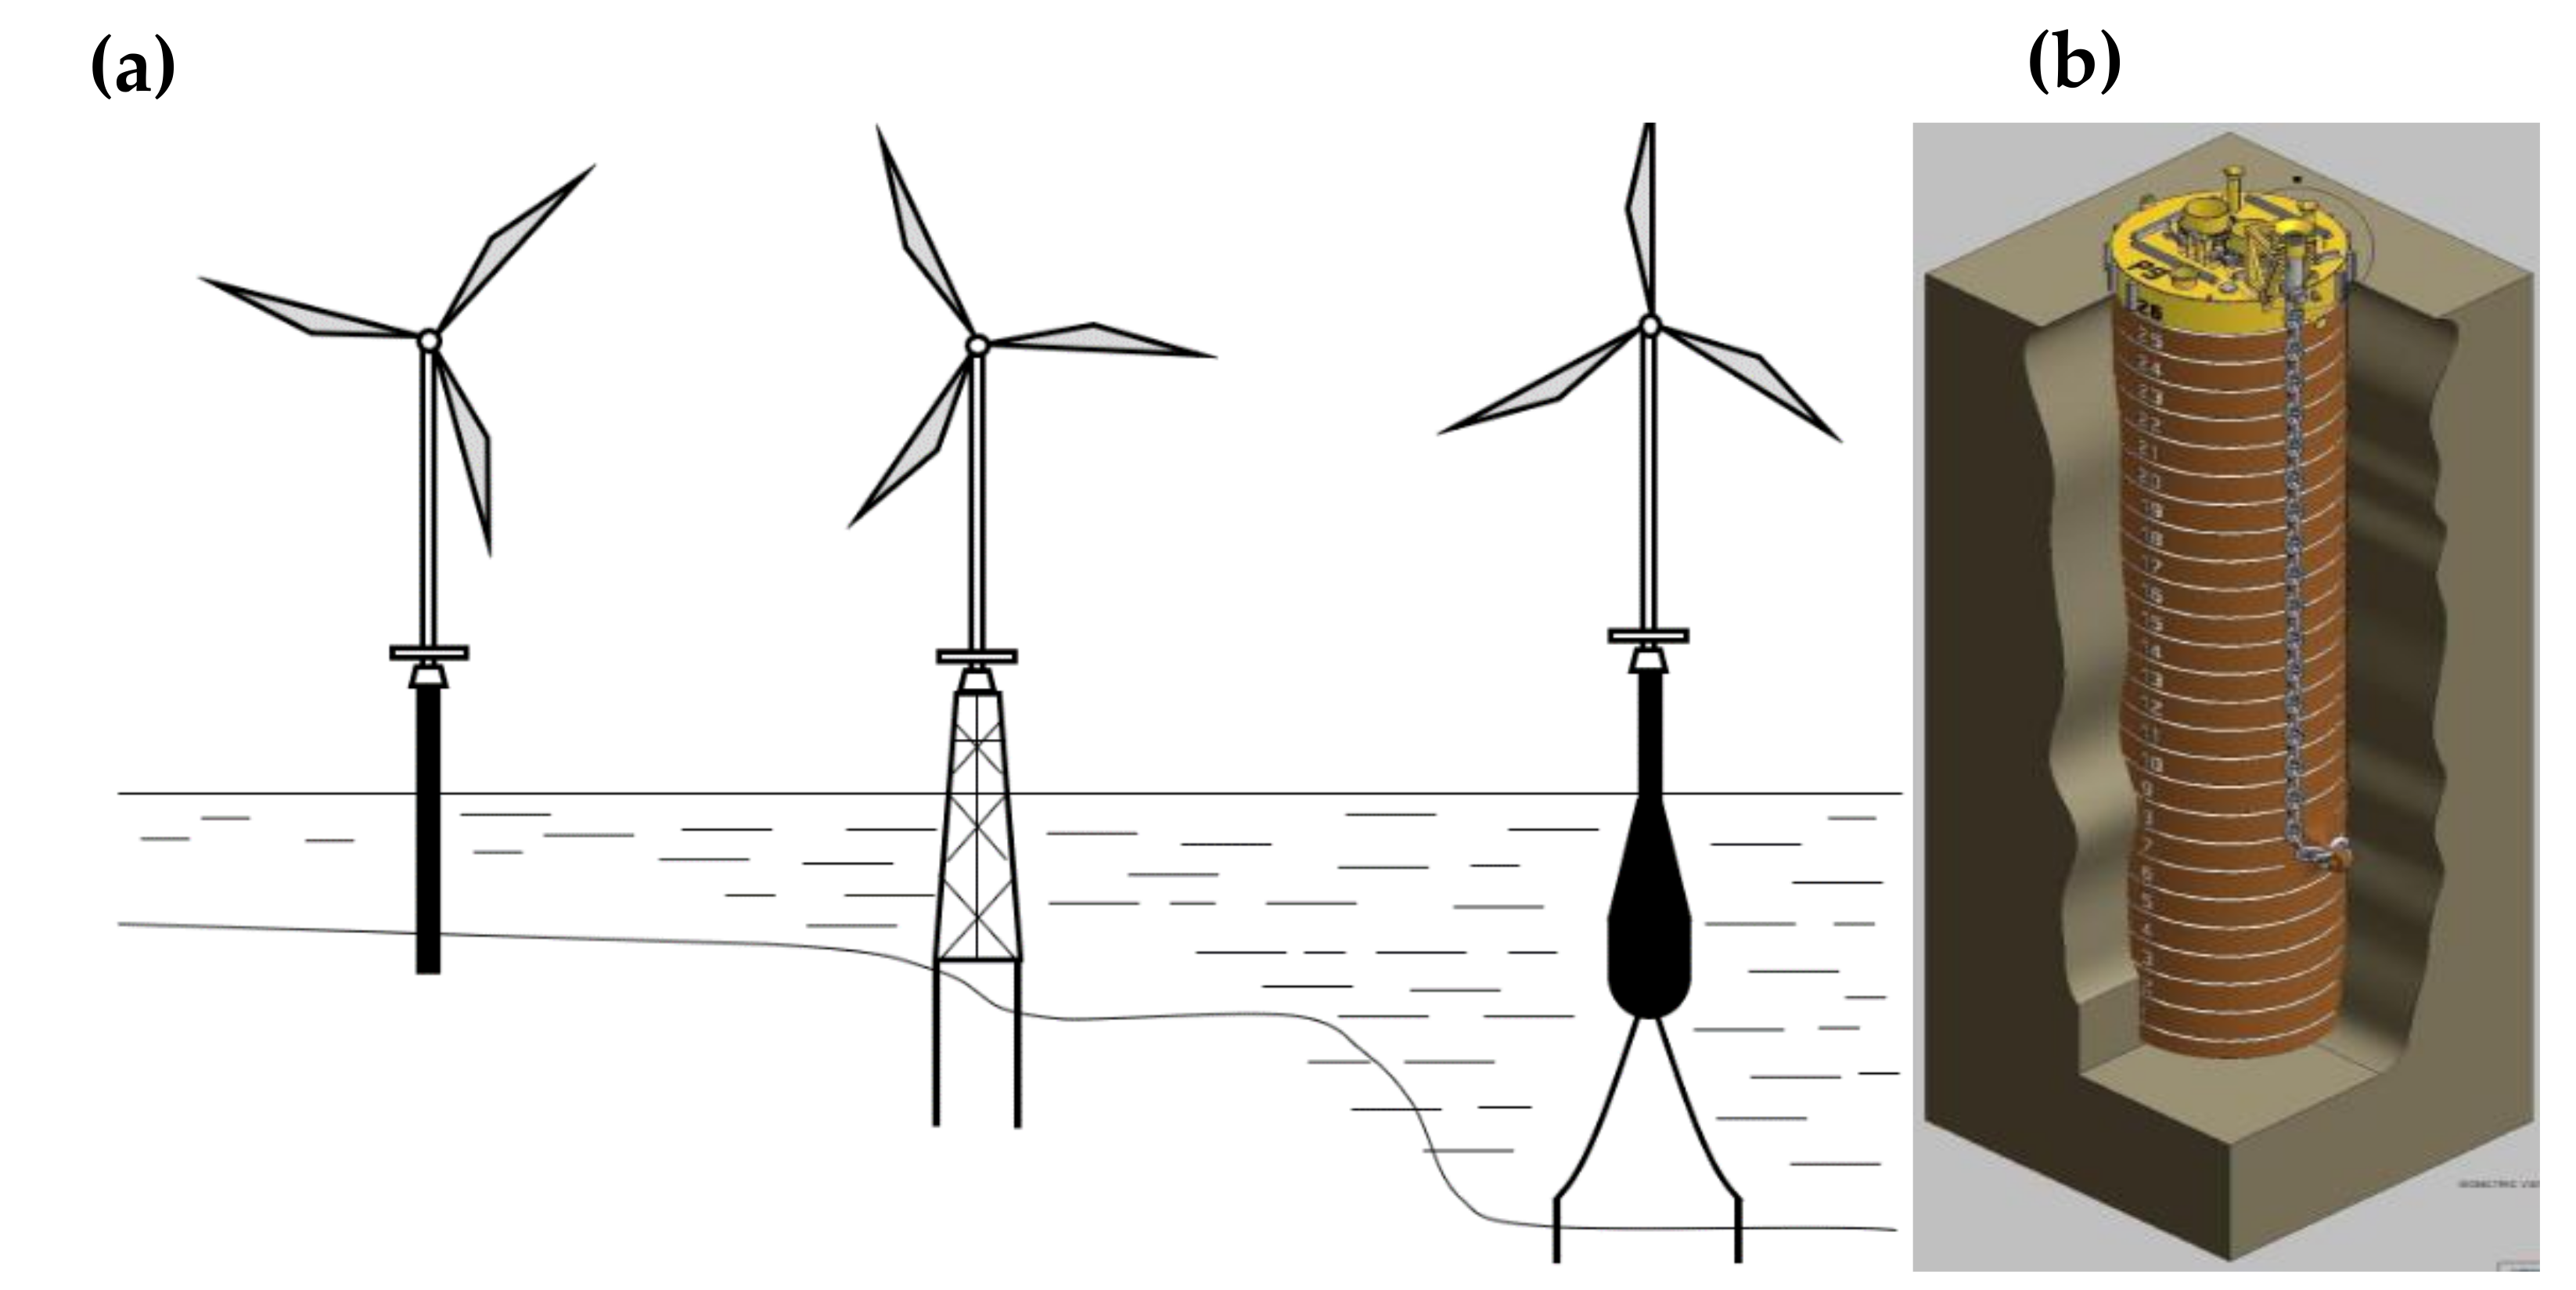
:1. Introduction
2. Materials and Methods
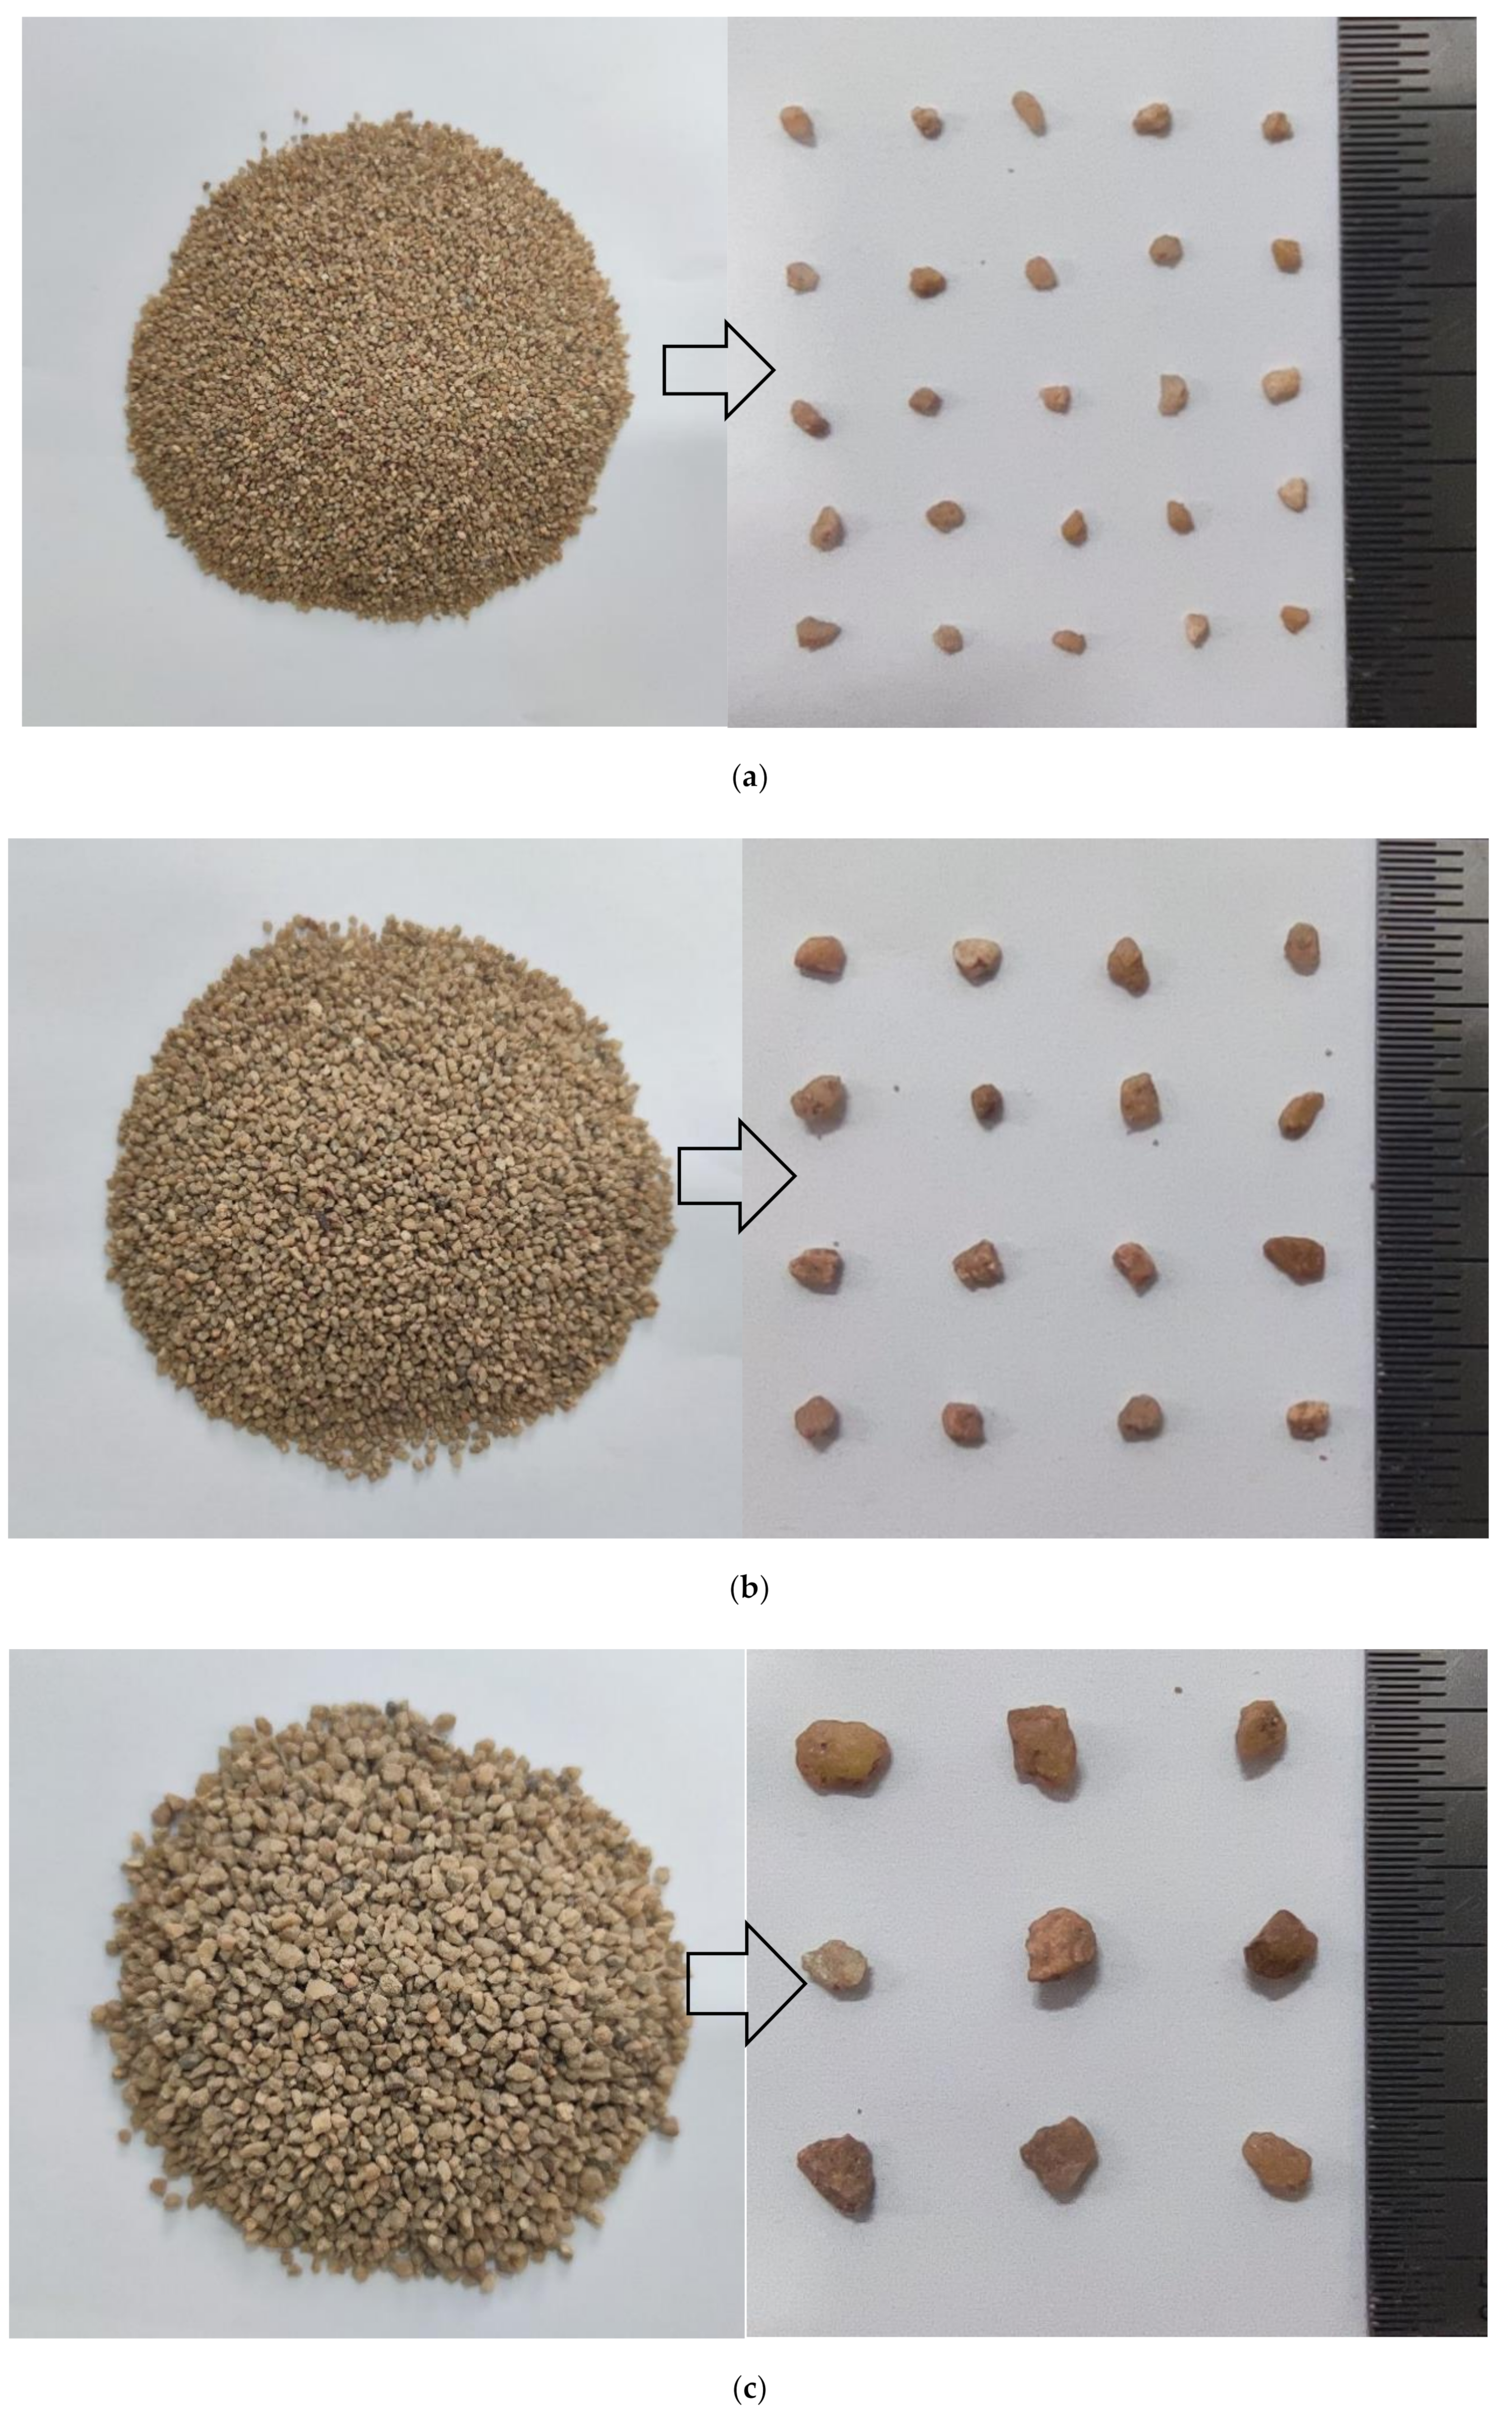
2.1. Test Sand
2.2. Concrete Plates
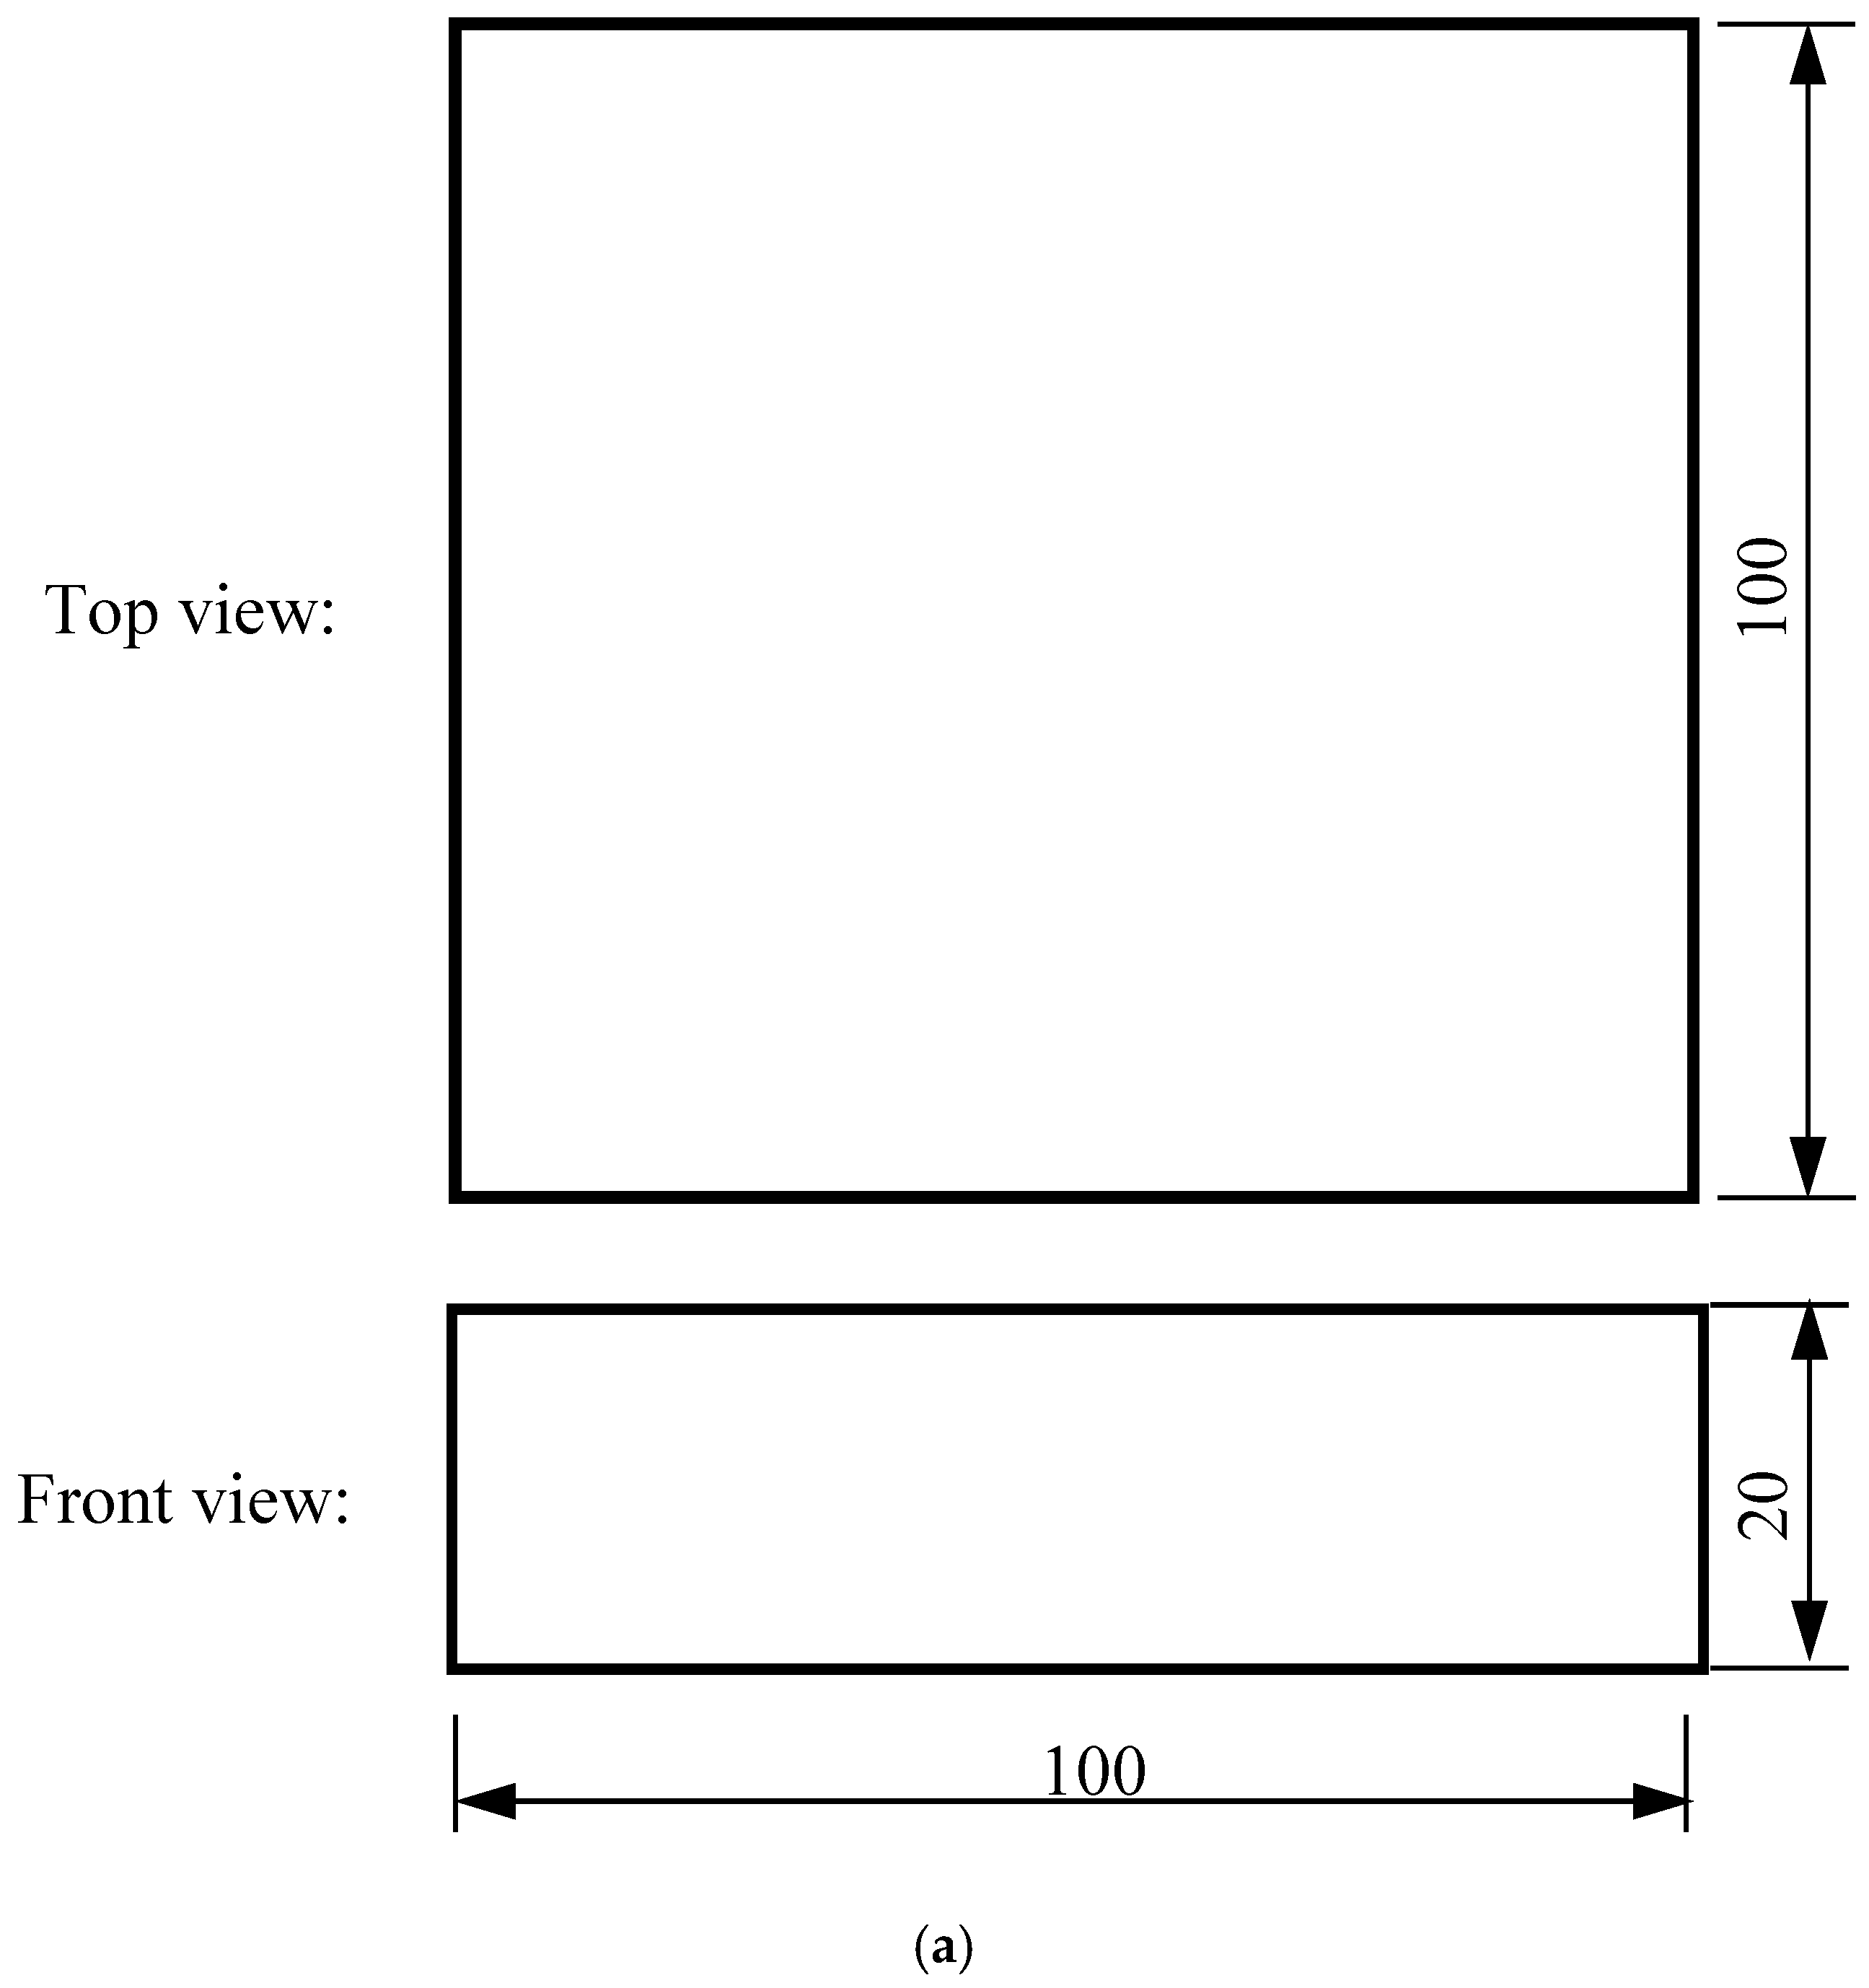
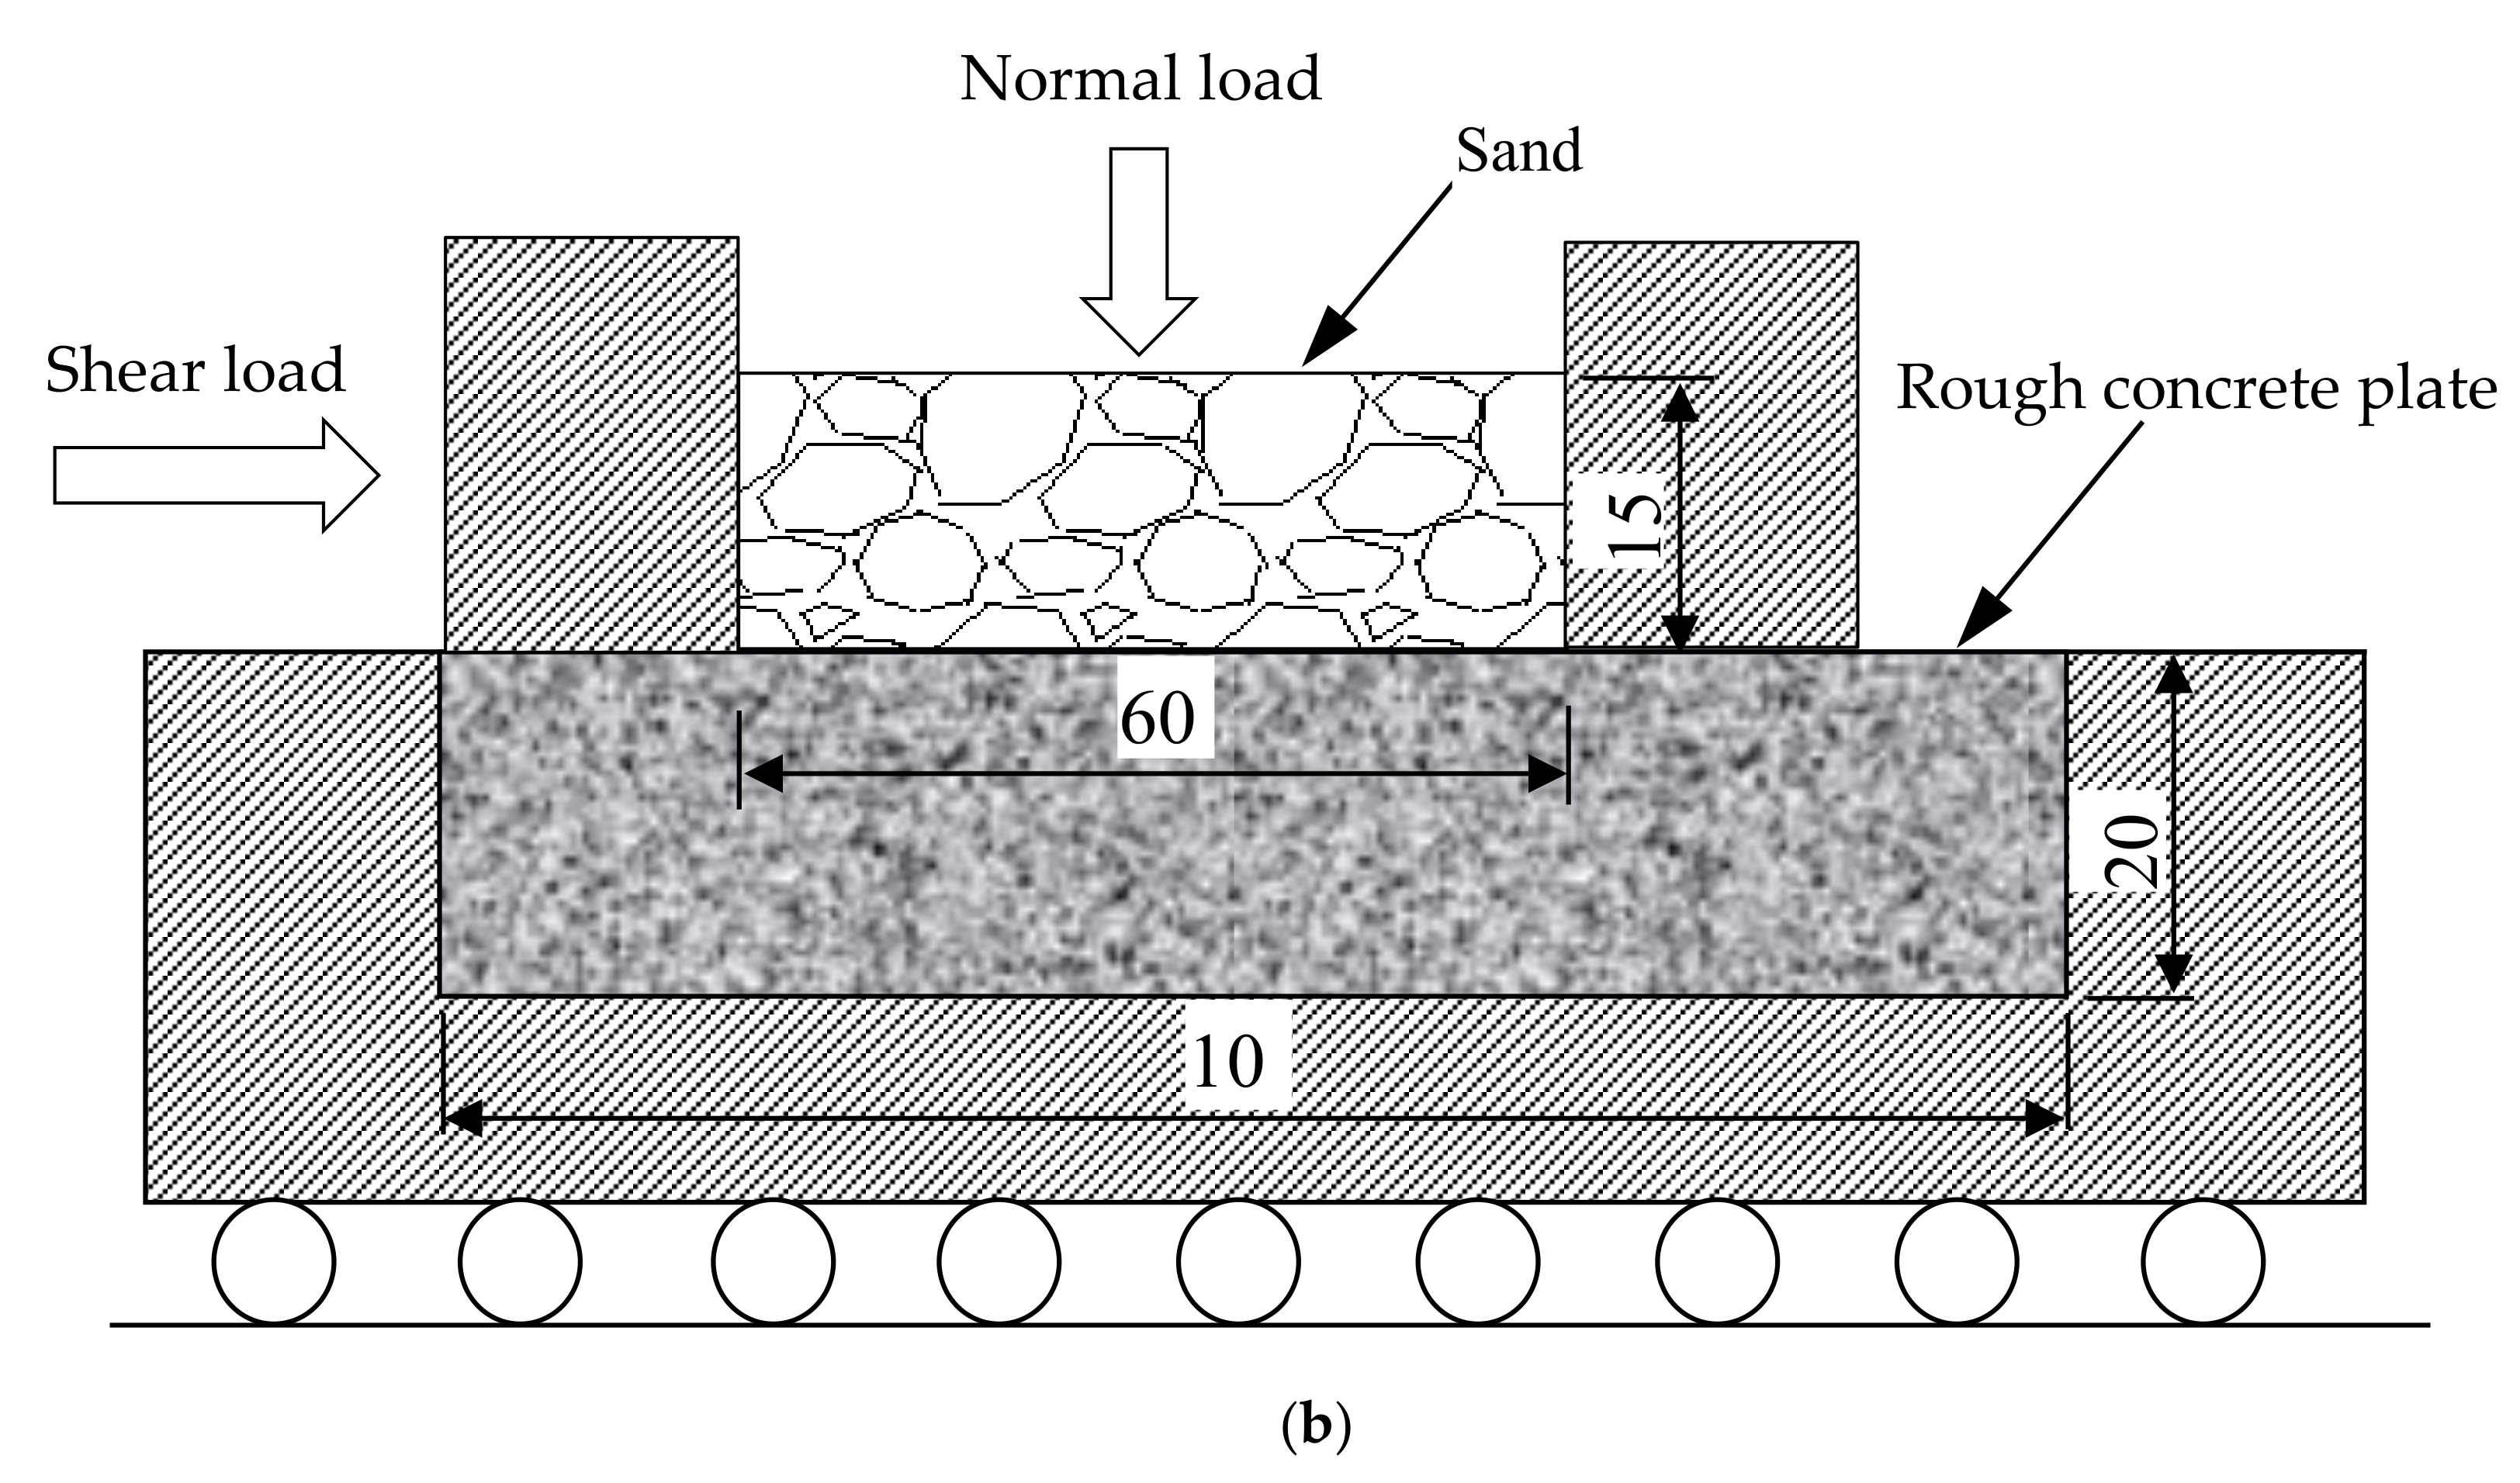
2.3. Testing Method
3. Results and Discussion
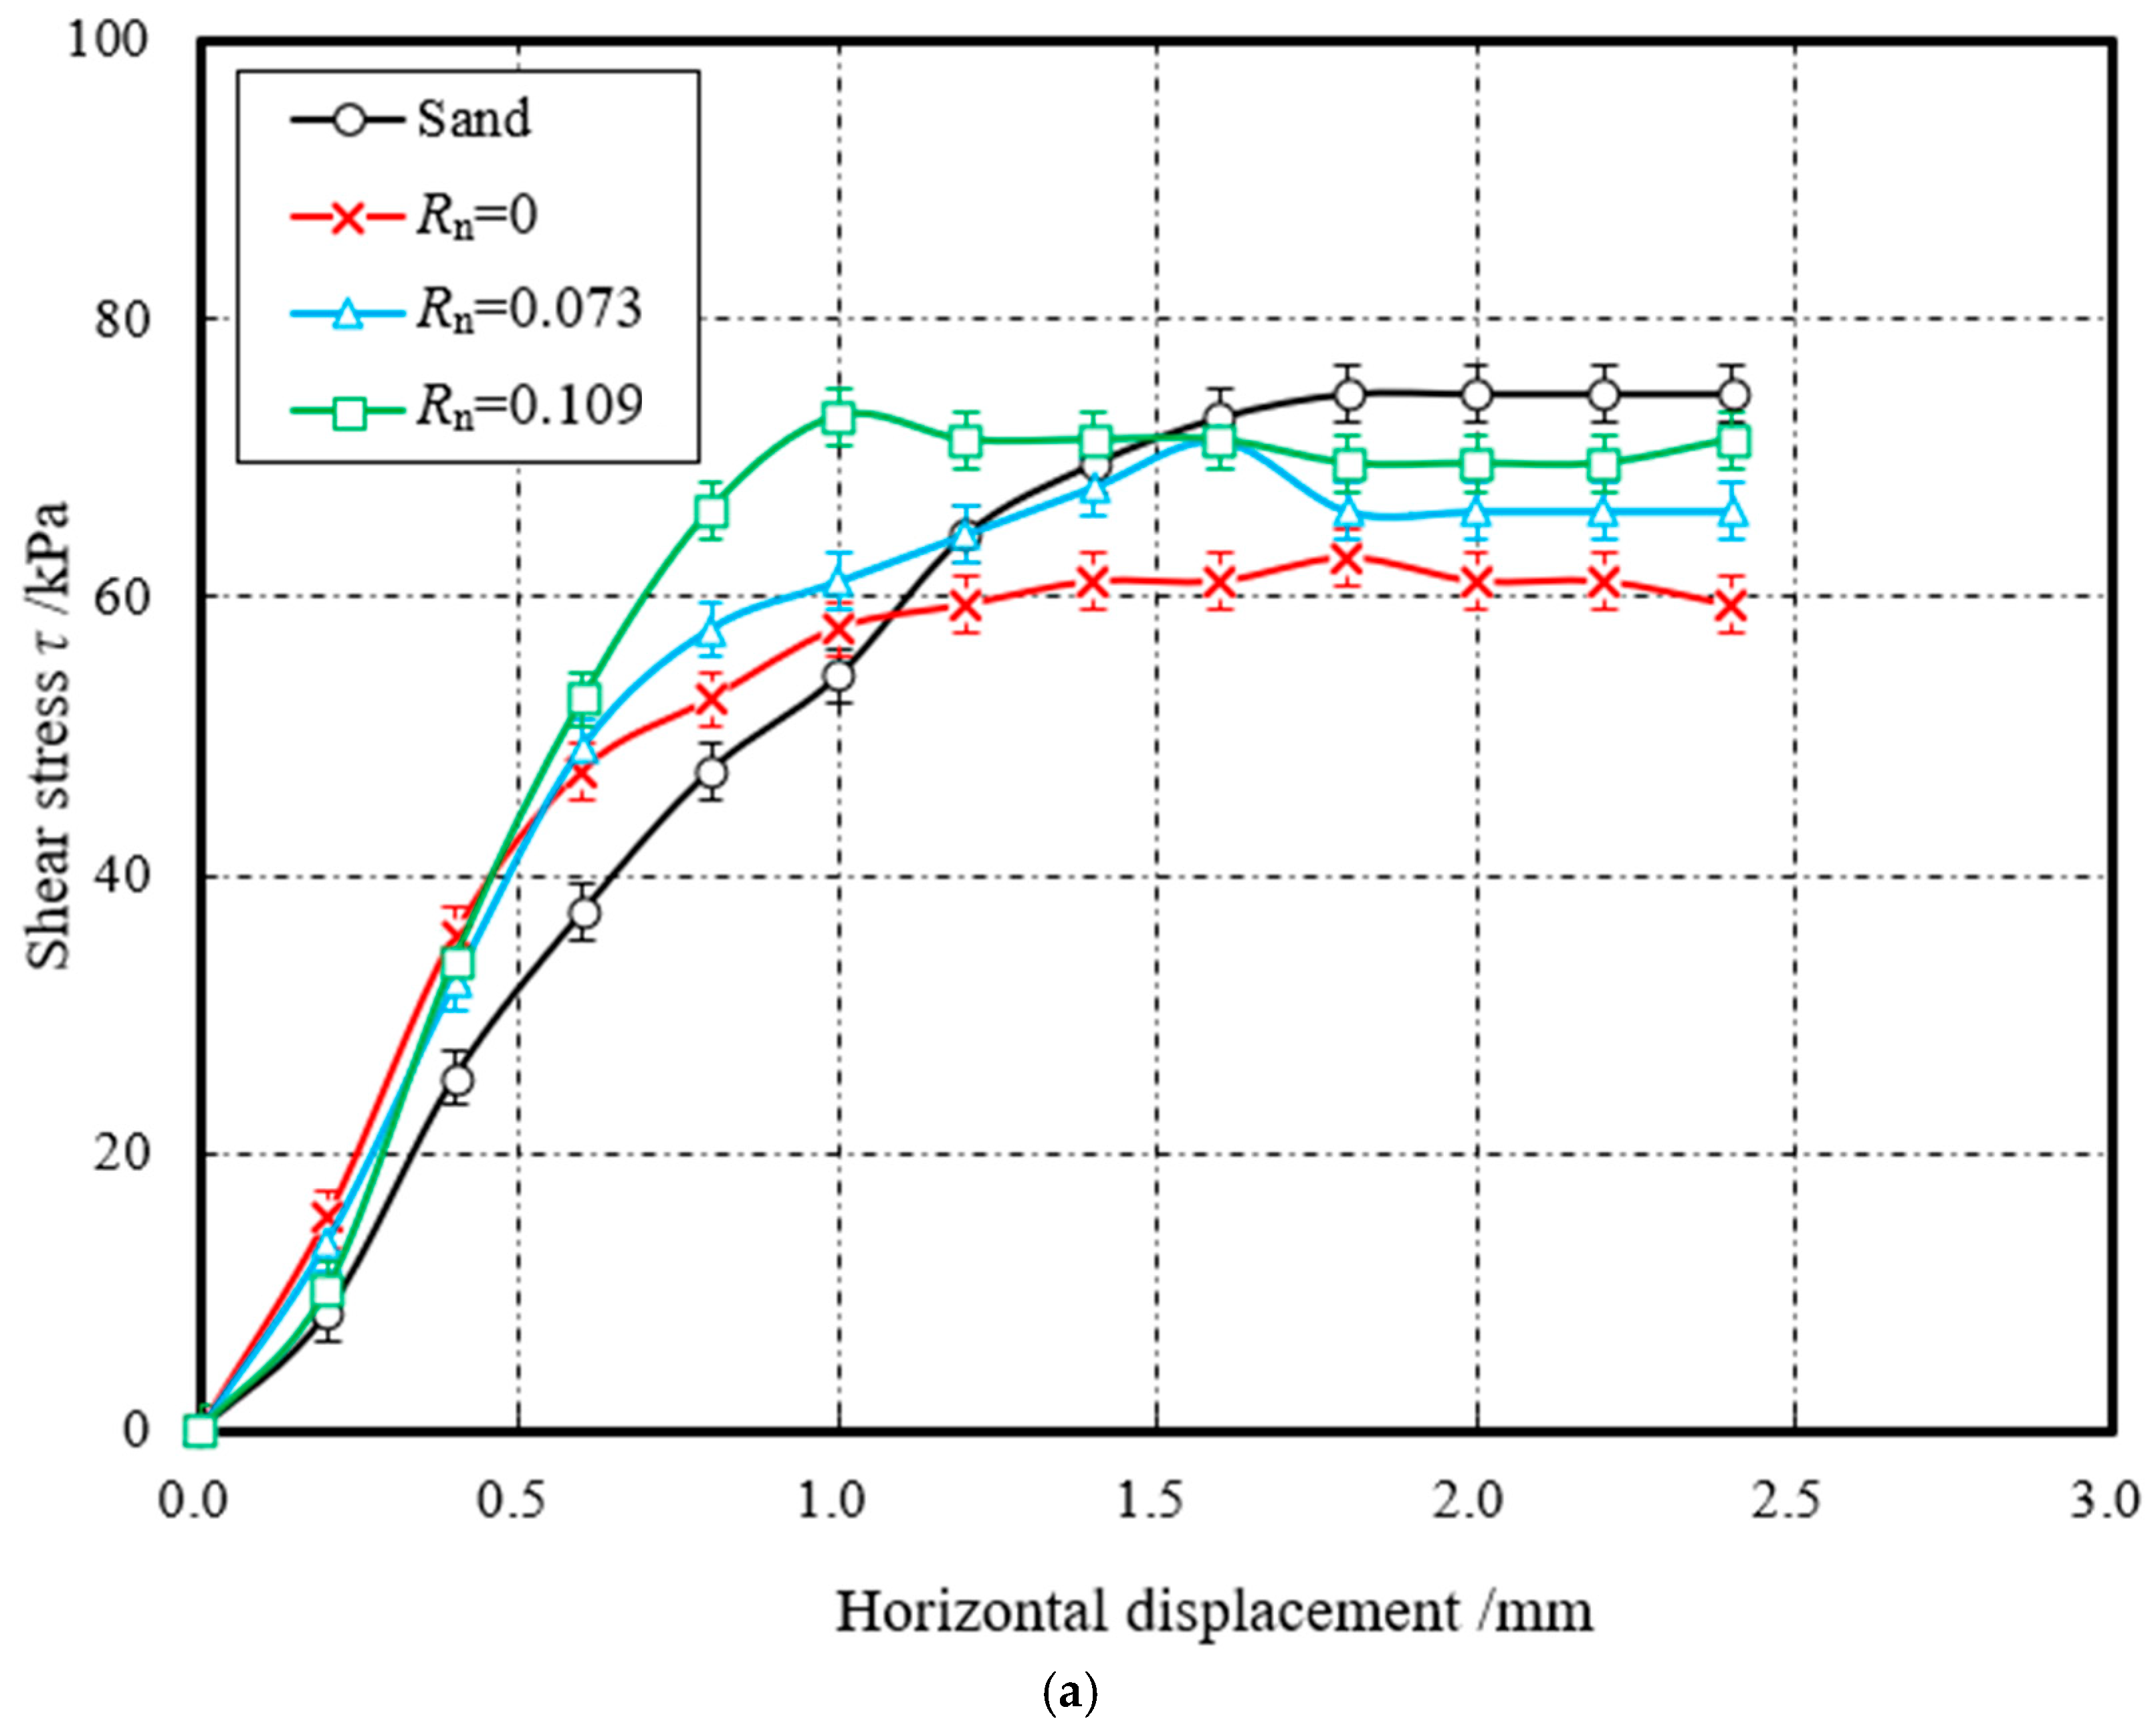
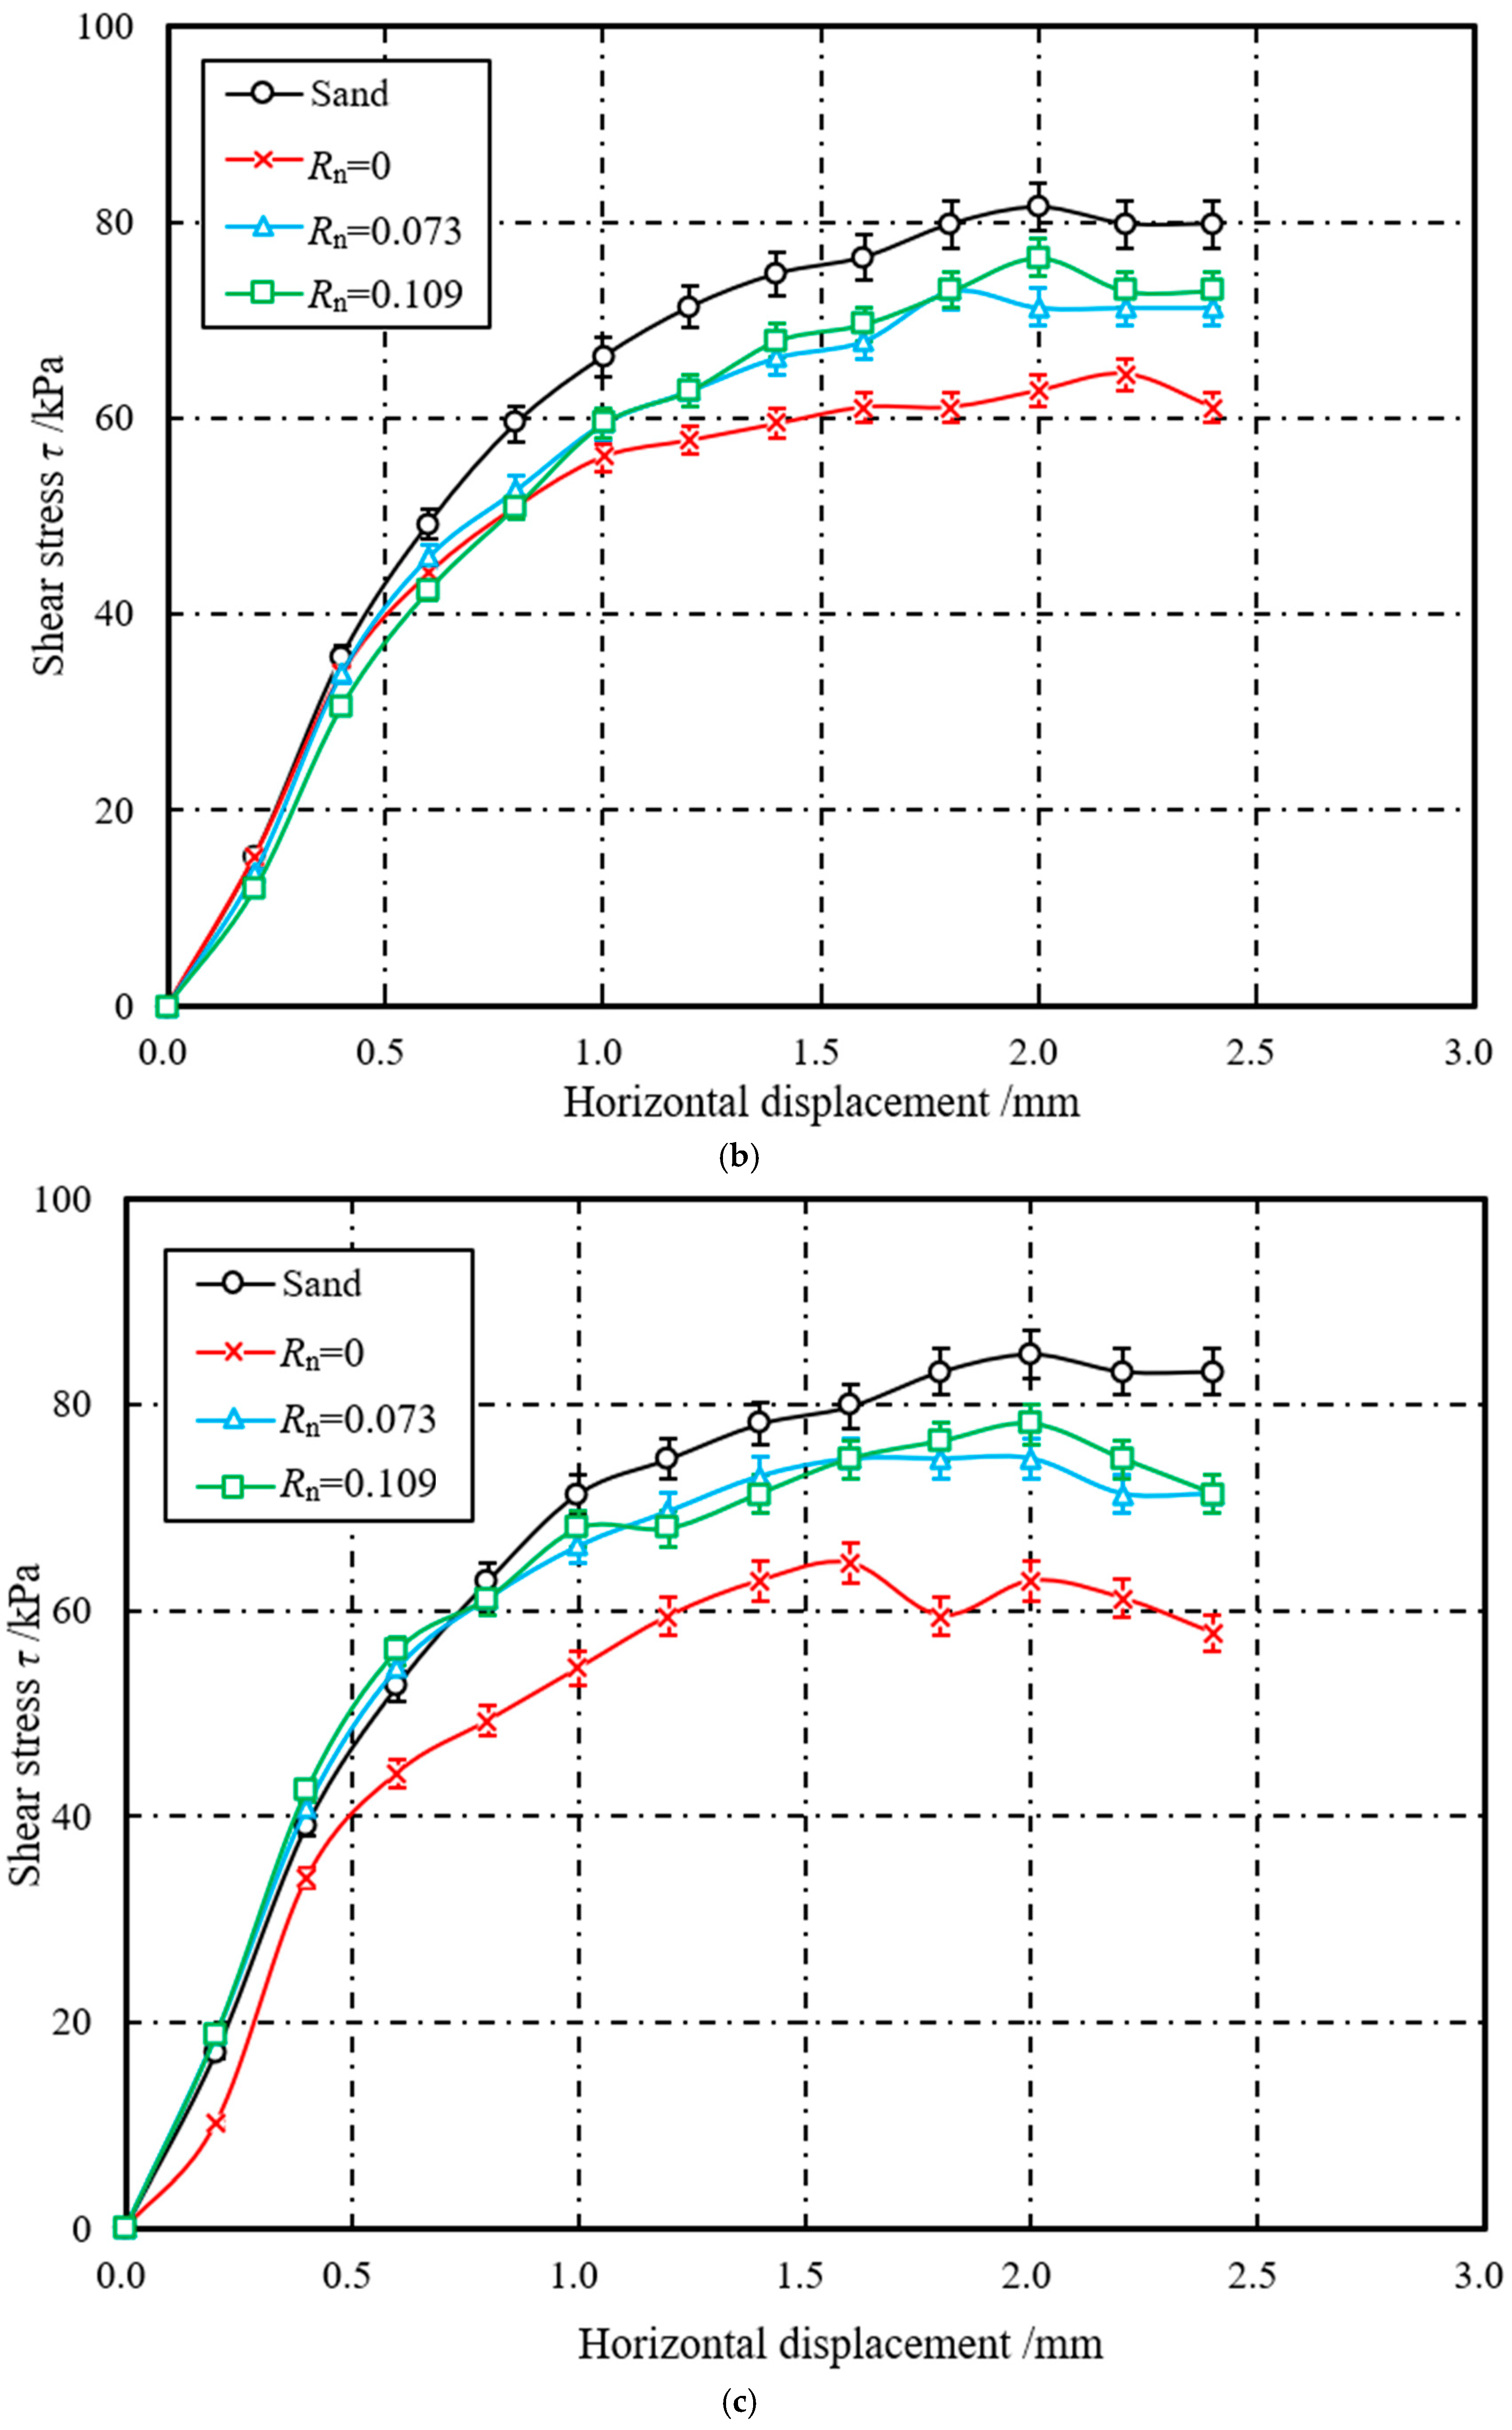
3.1. Relationship between Interface Shear Stress and Displacement
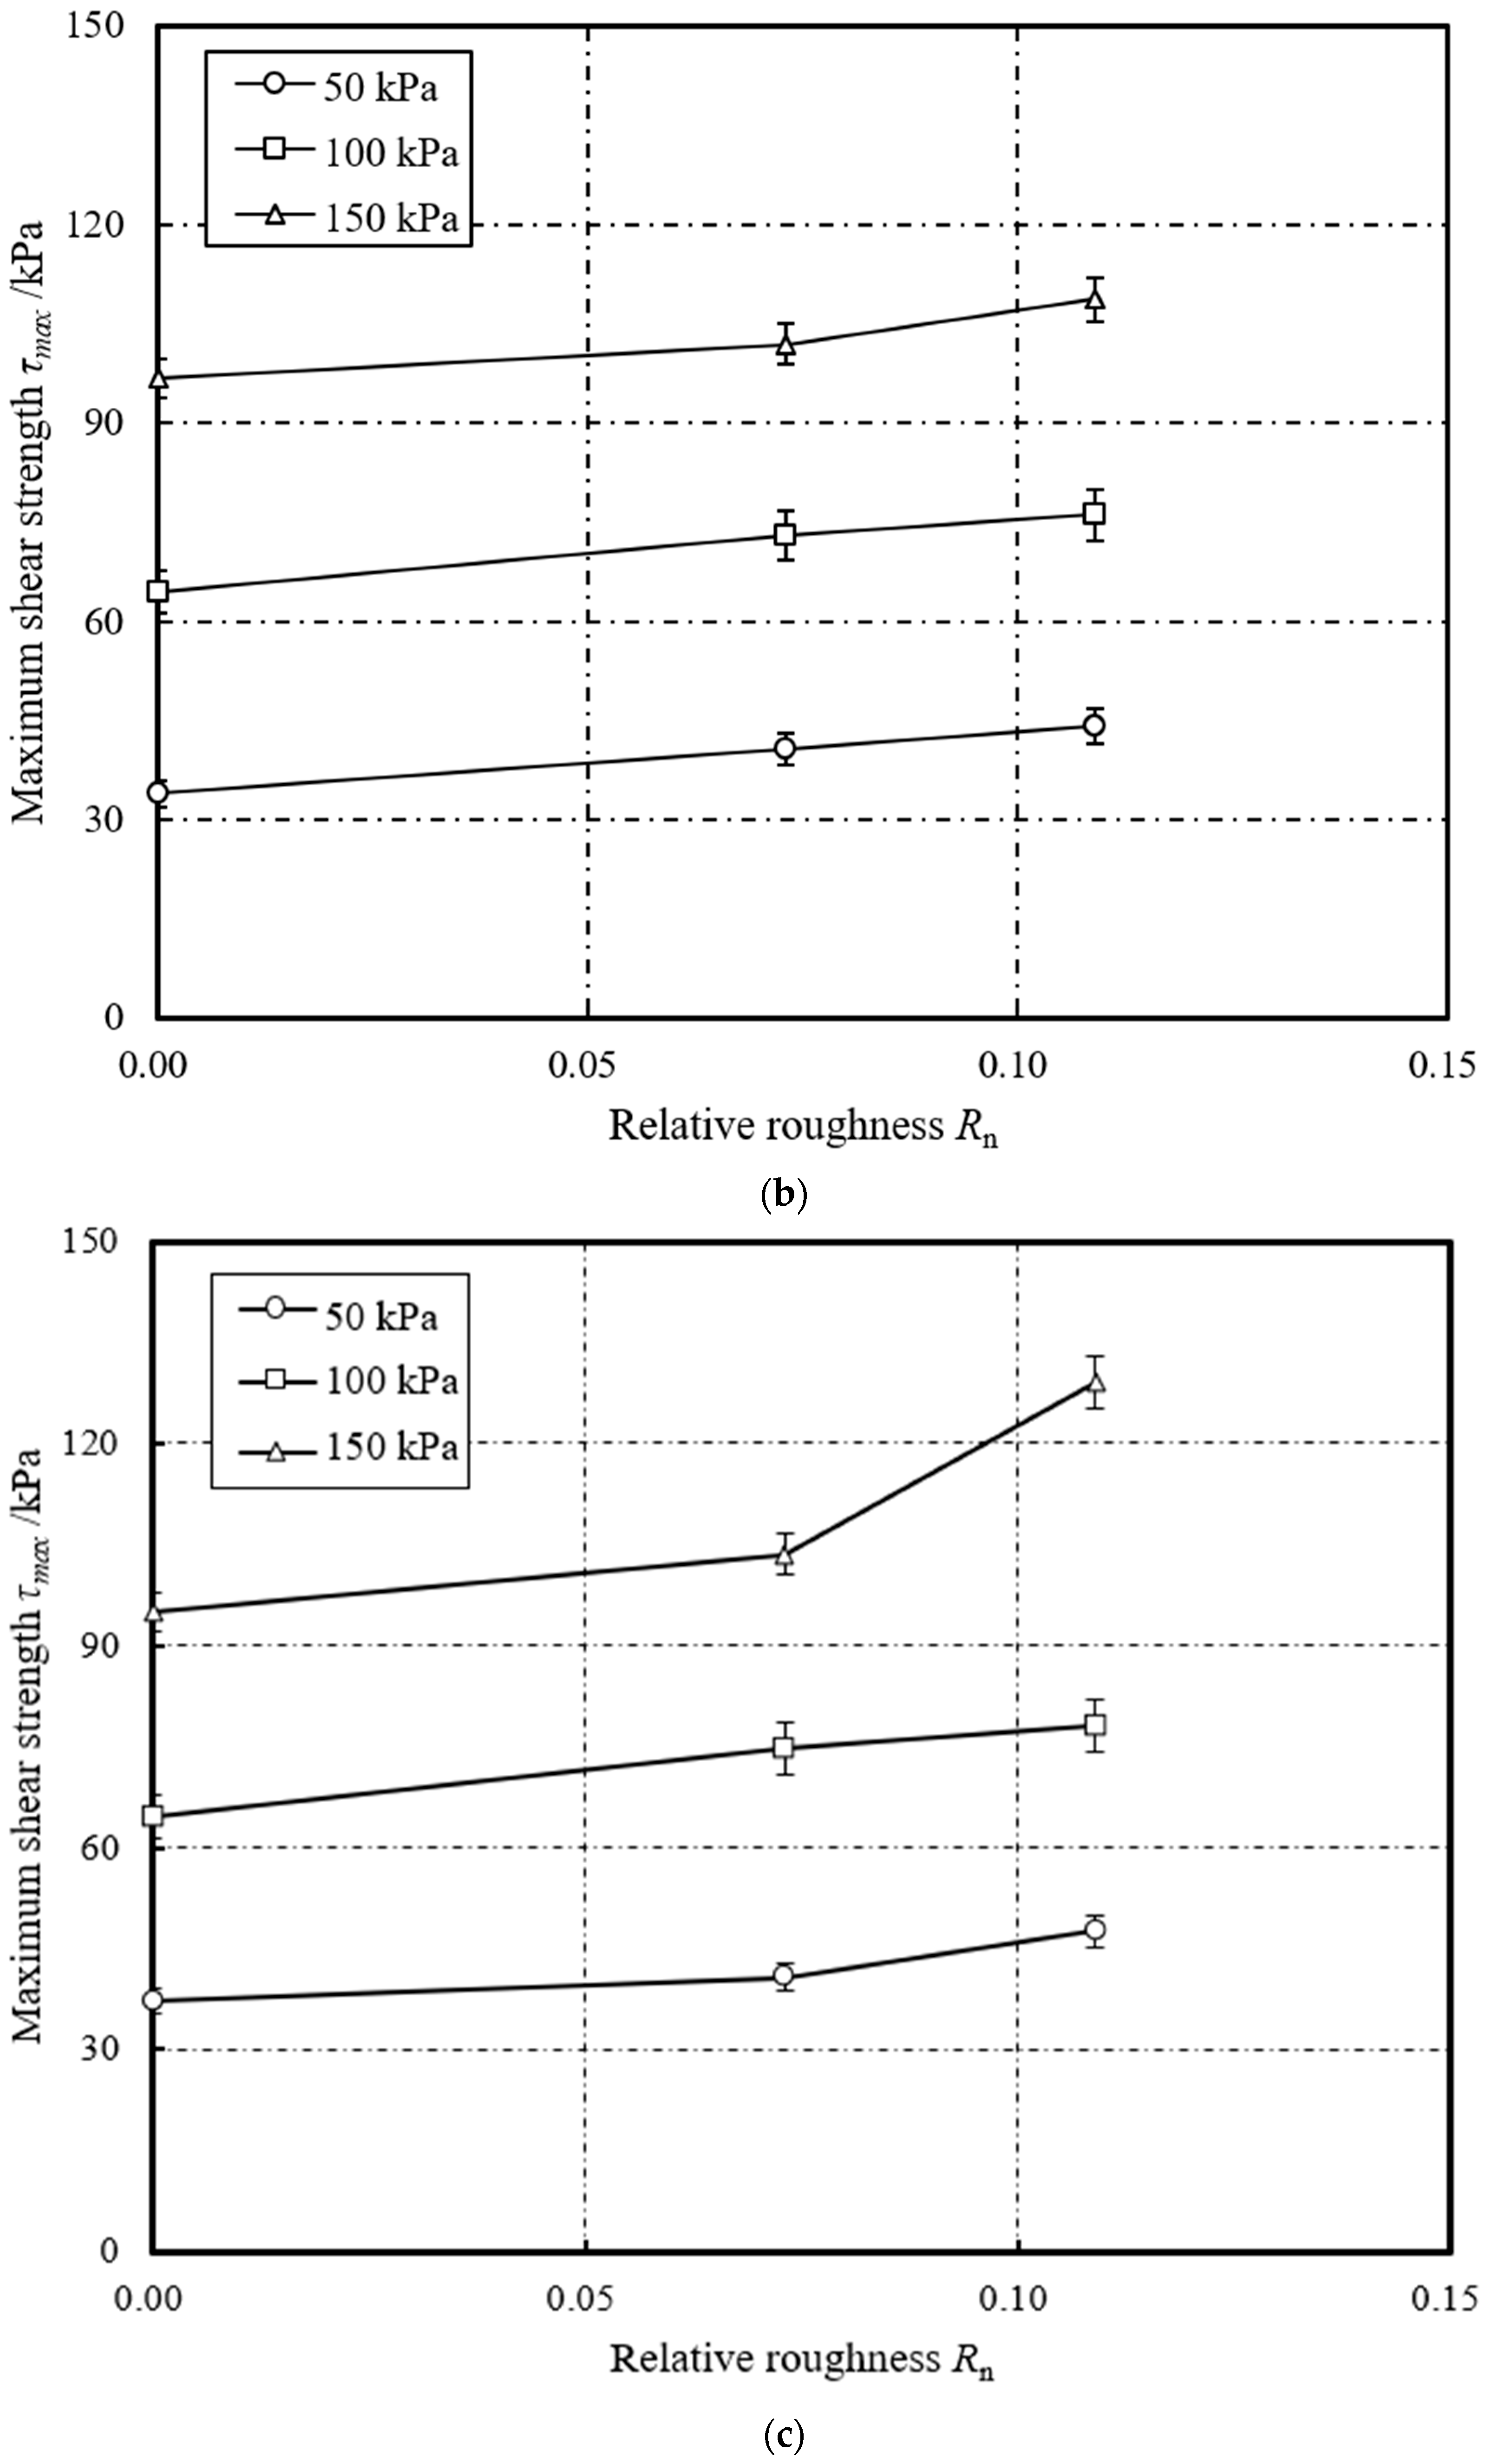
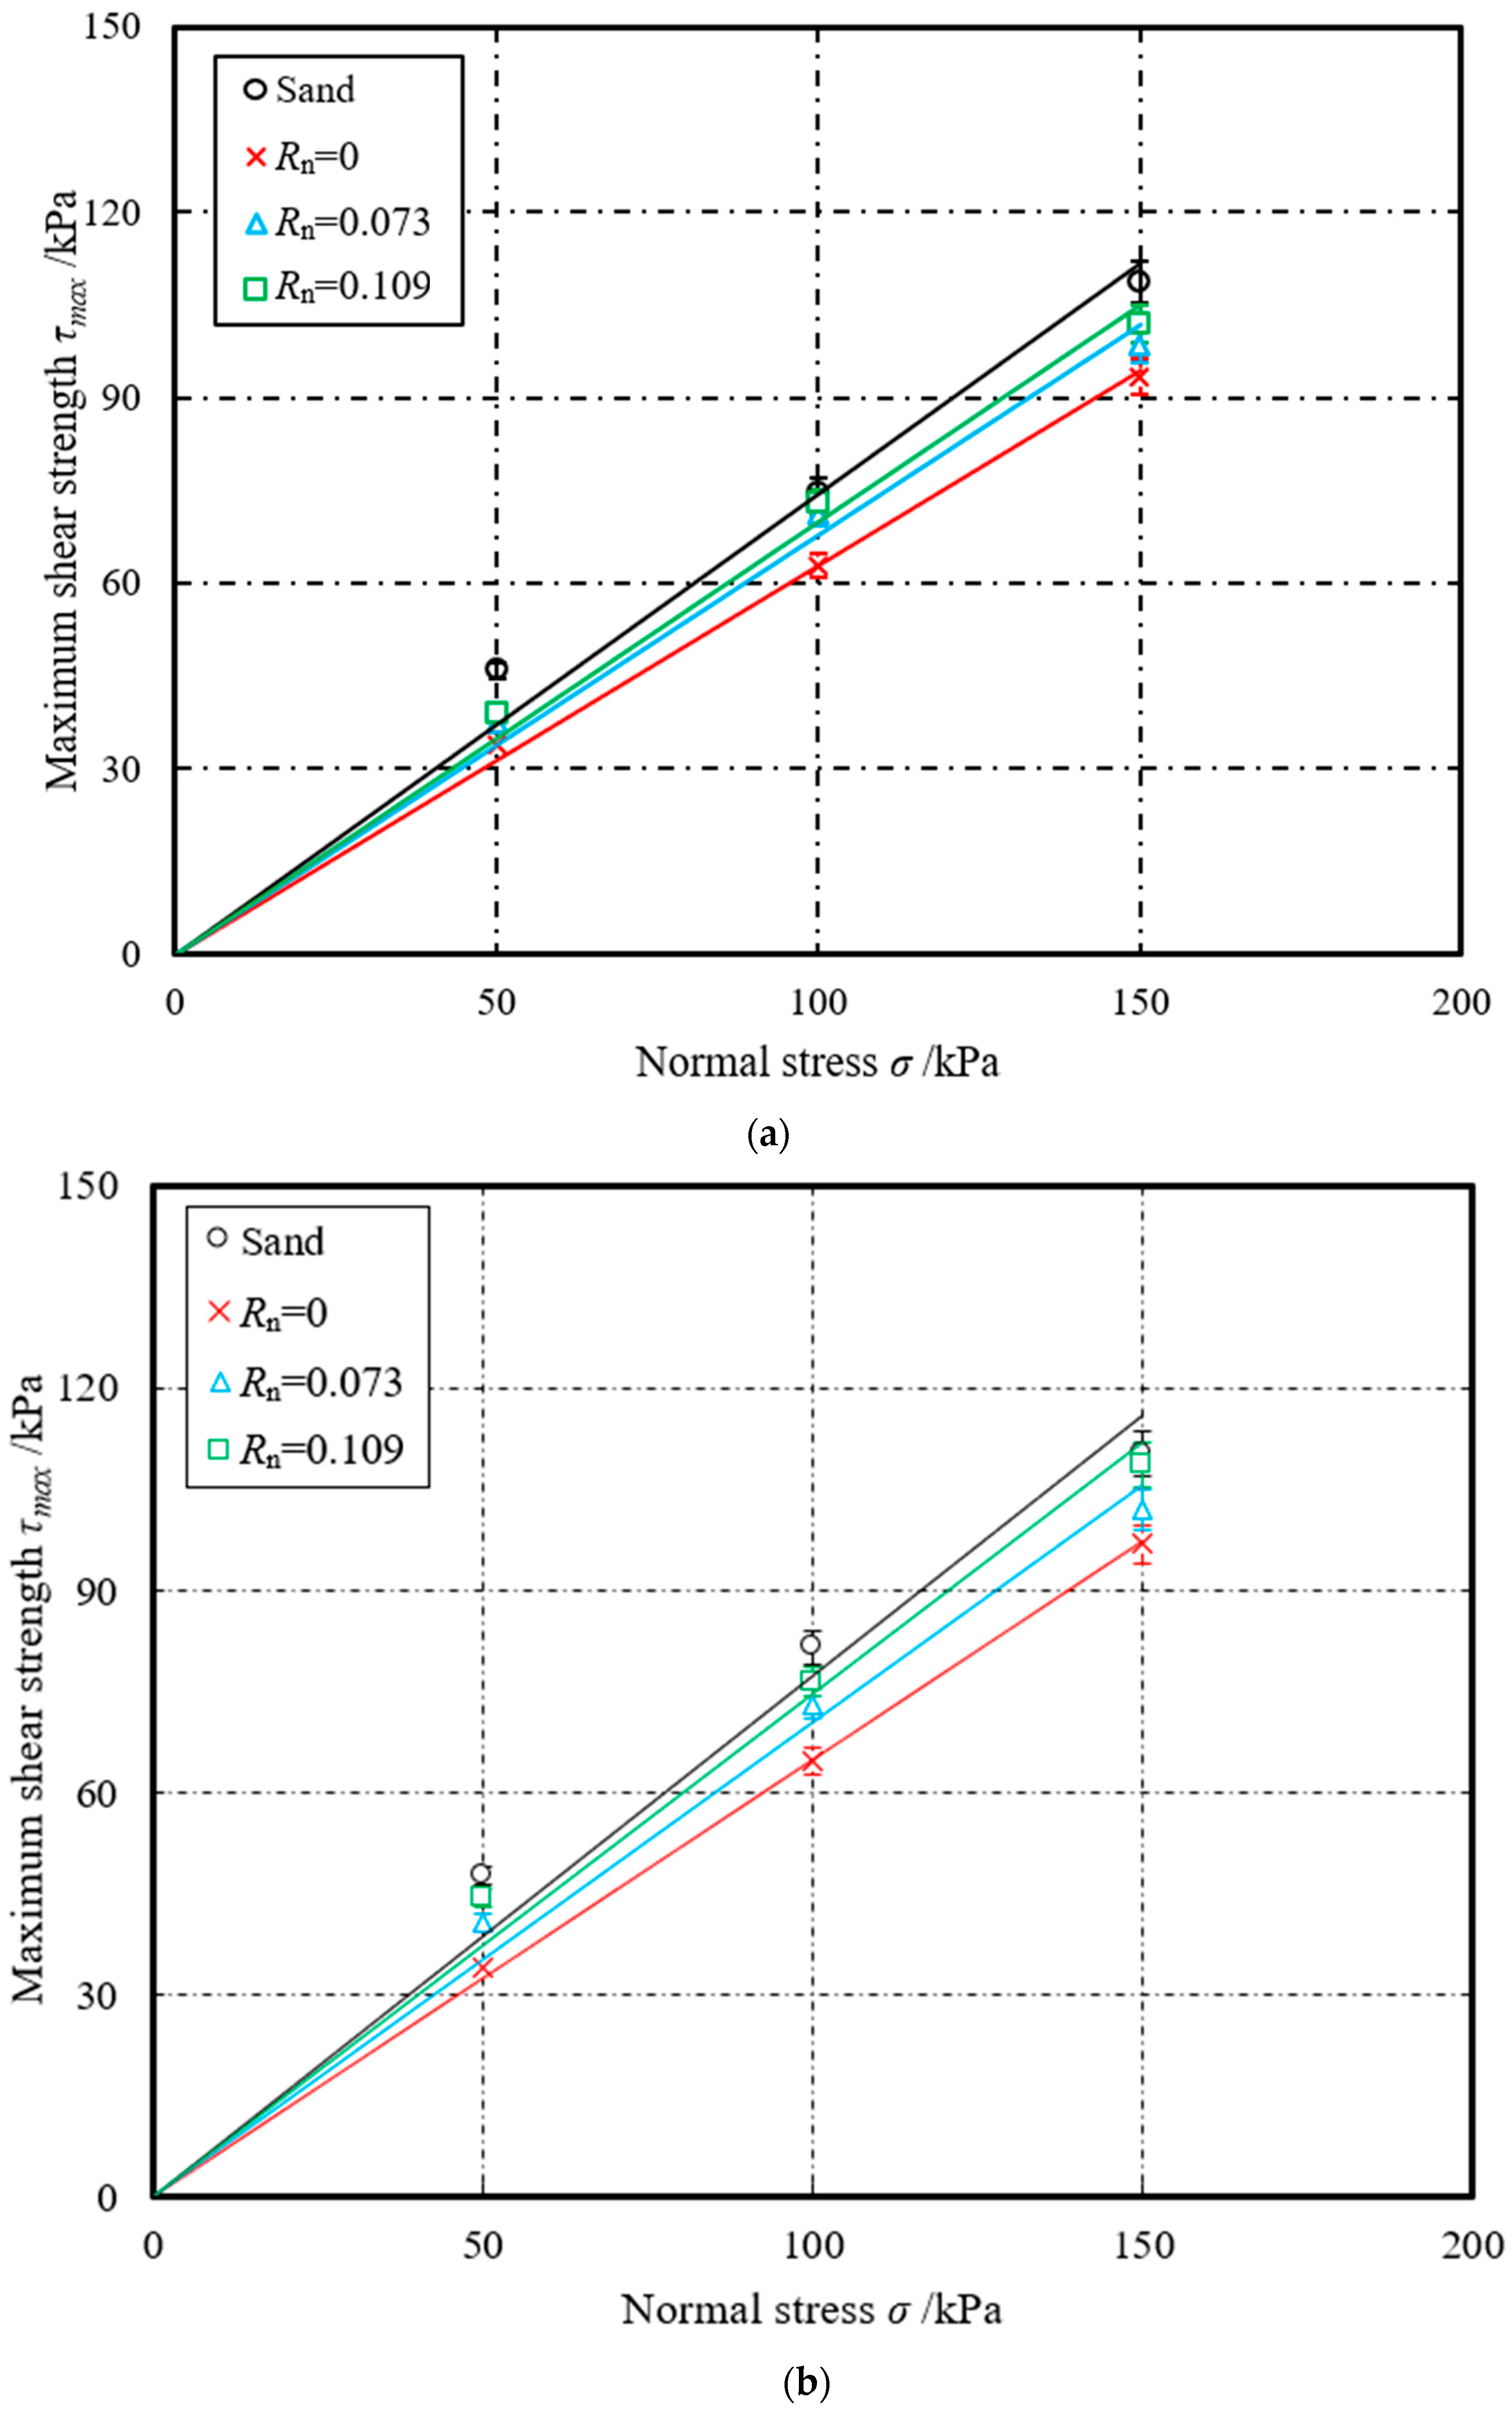
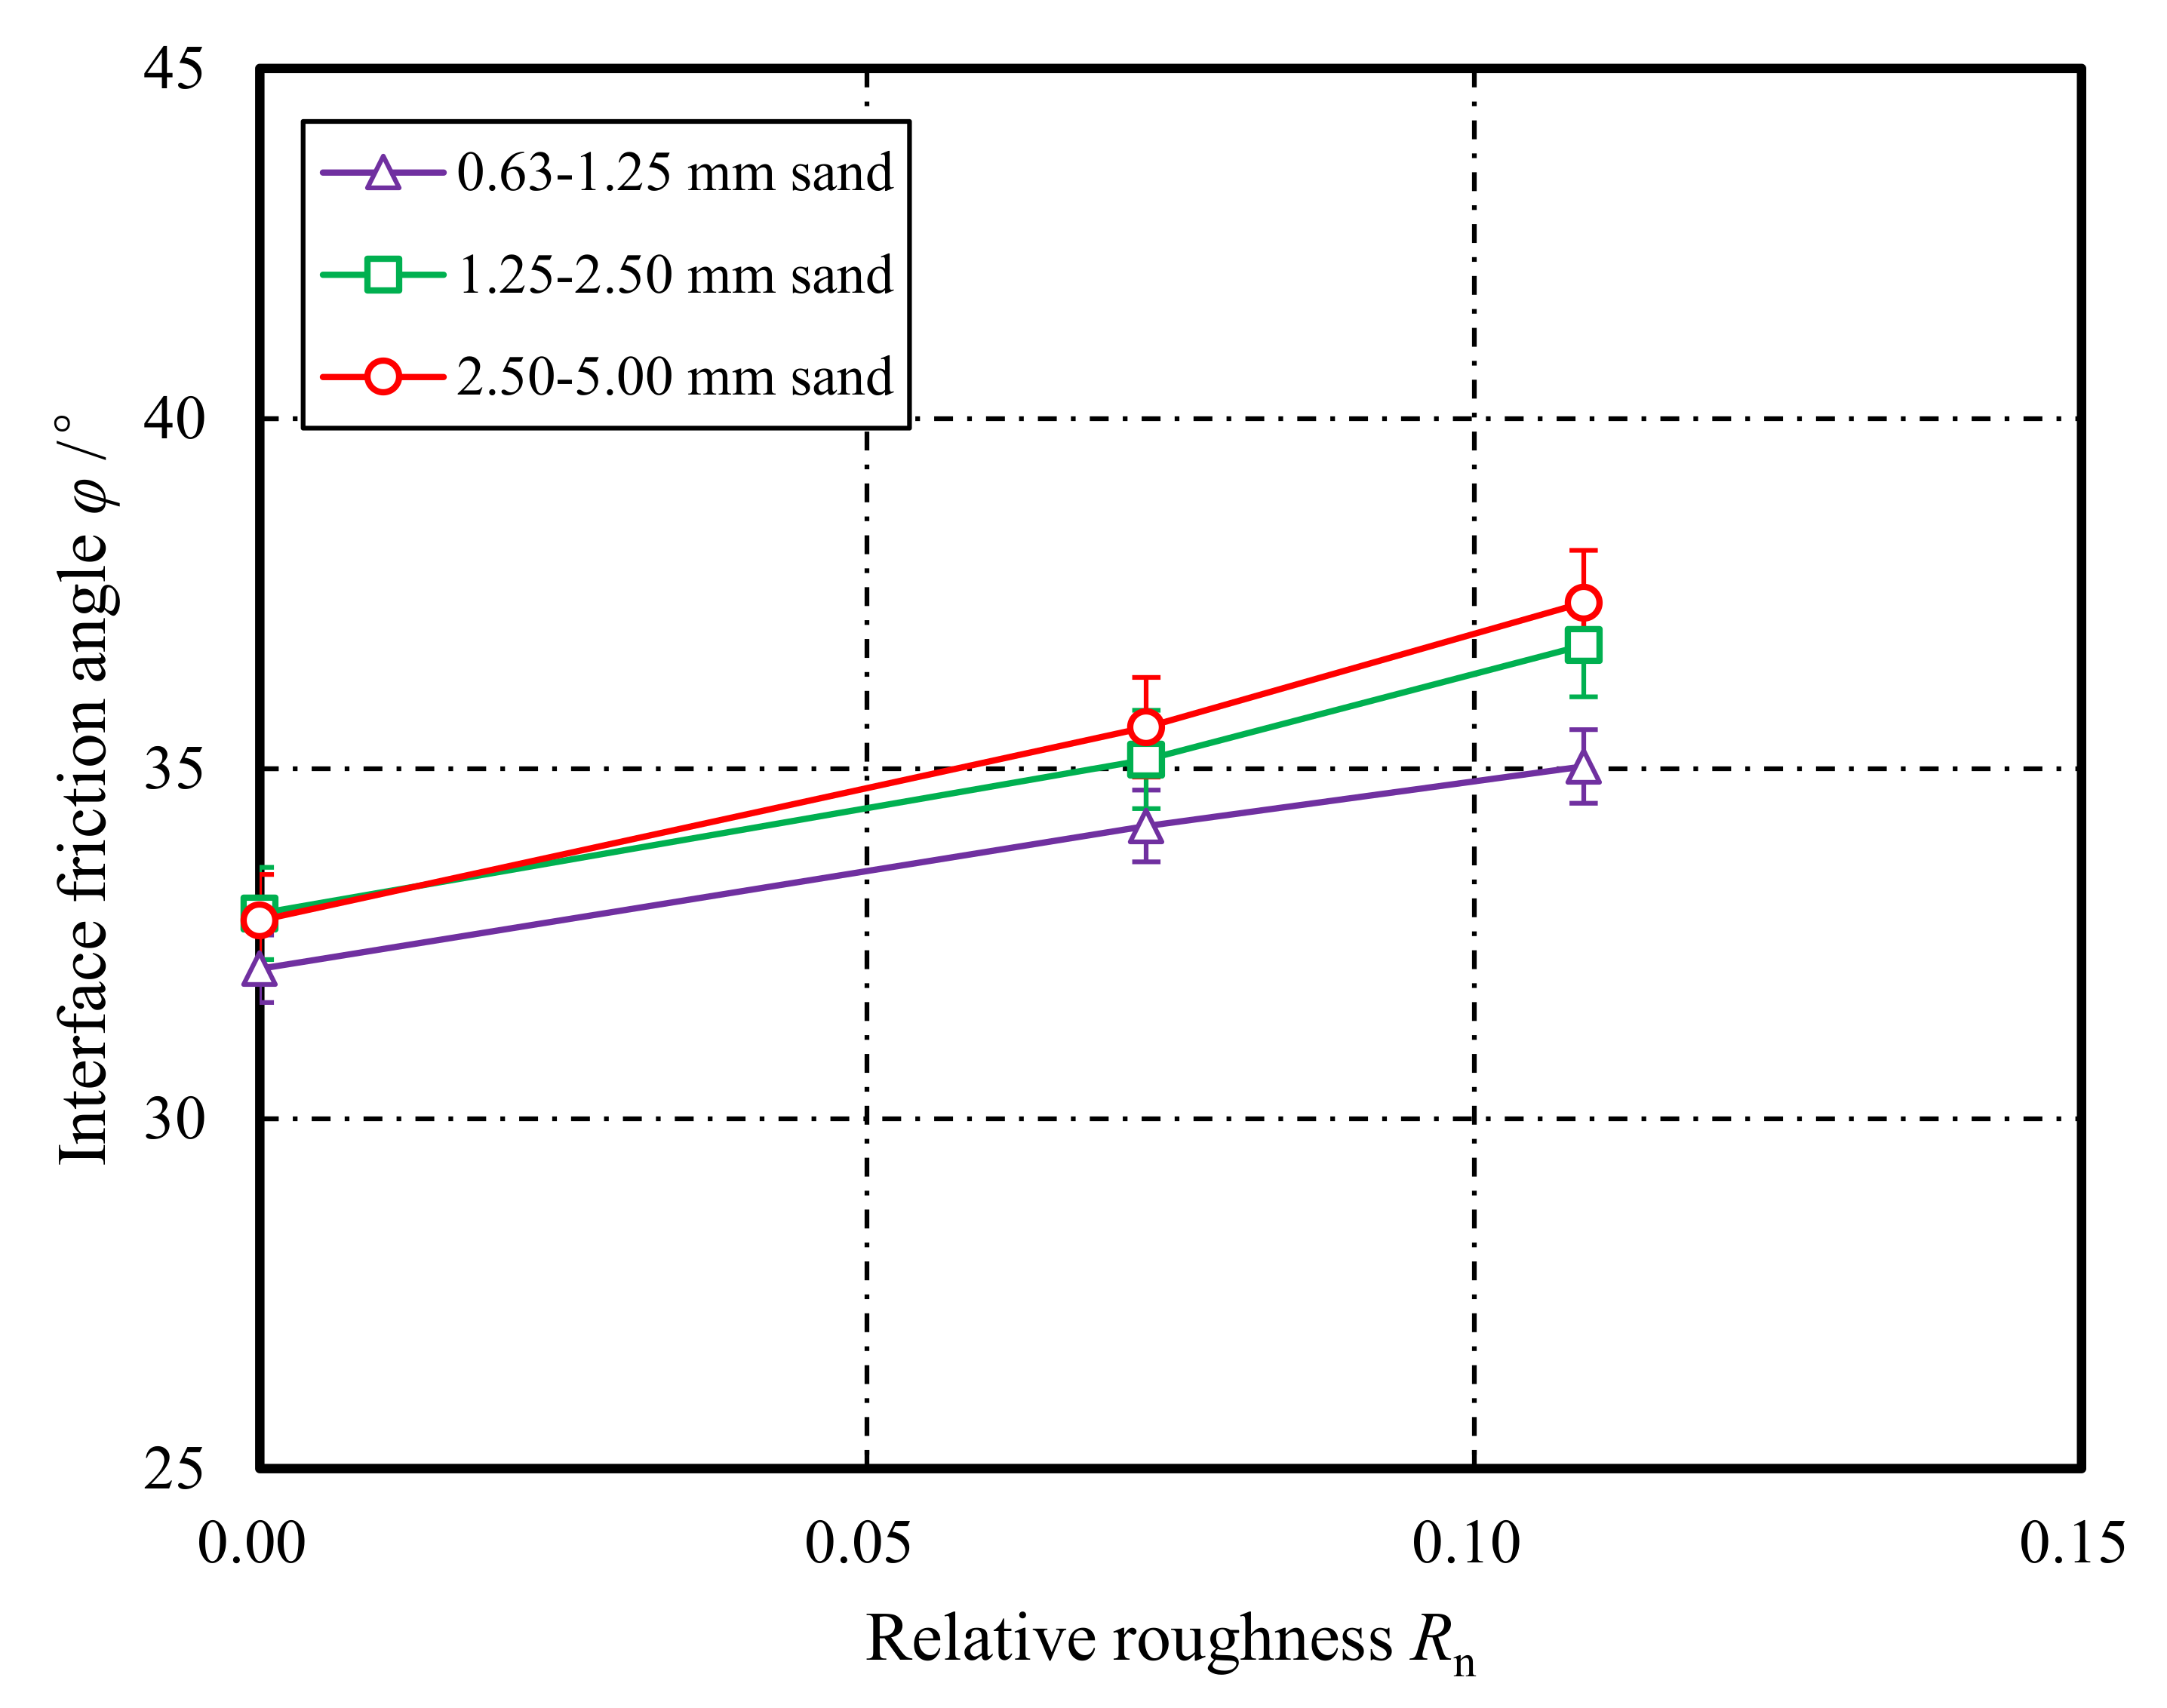
3.2. Effect of Relative Roughness (Rn)
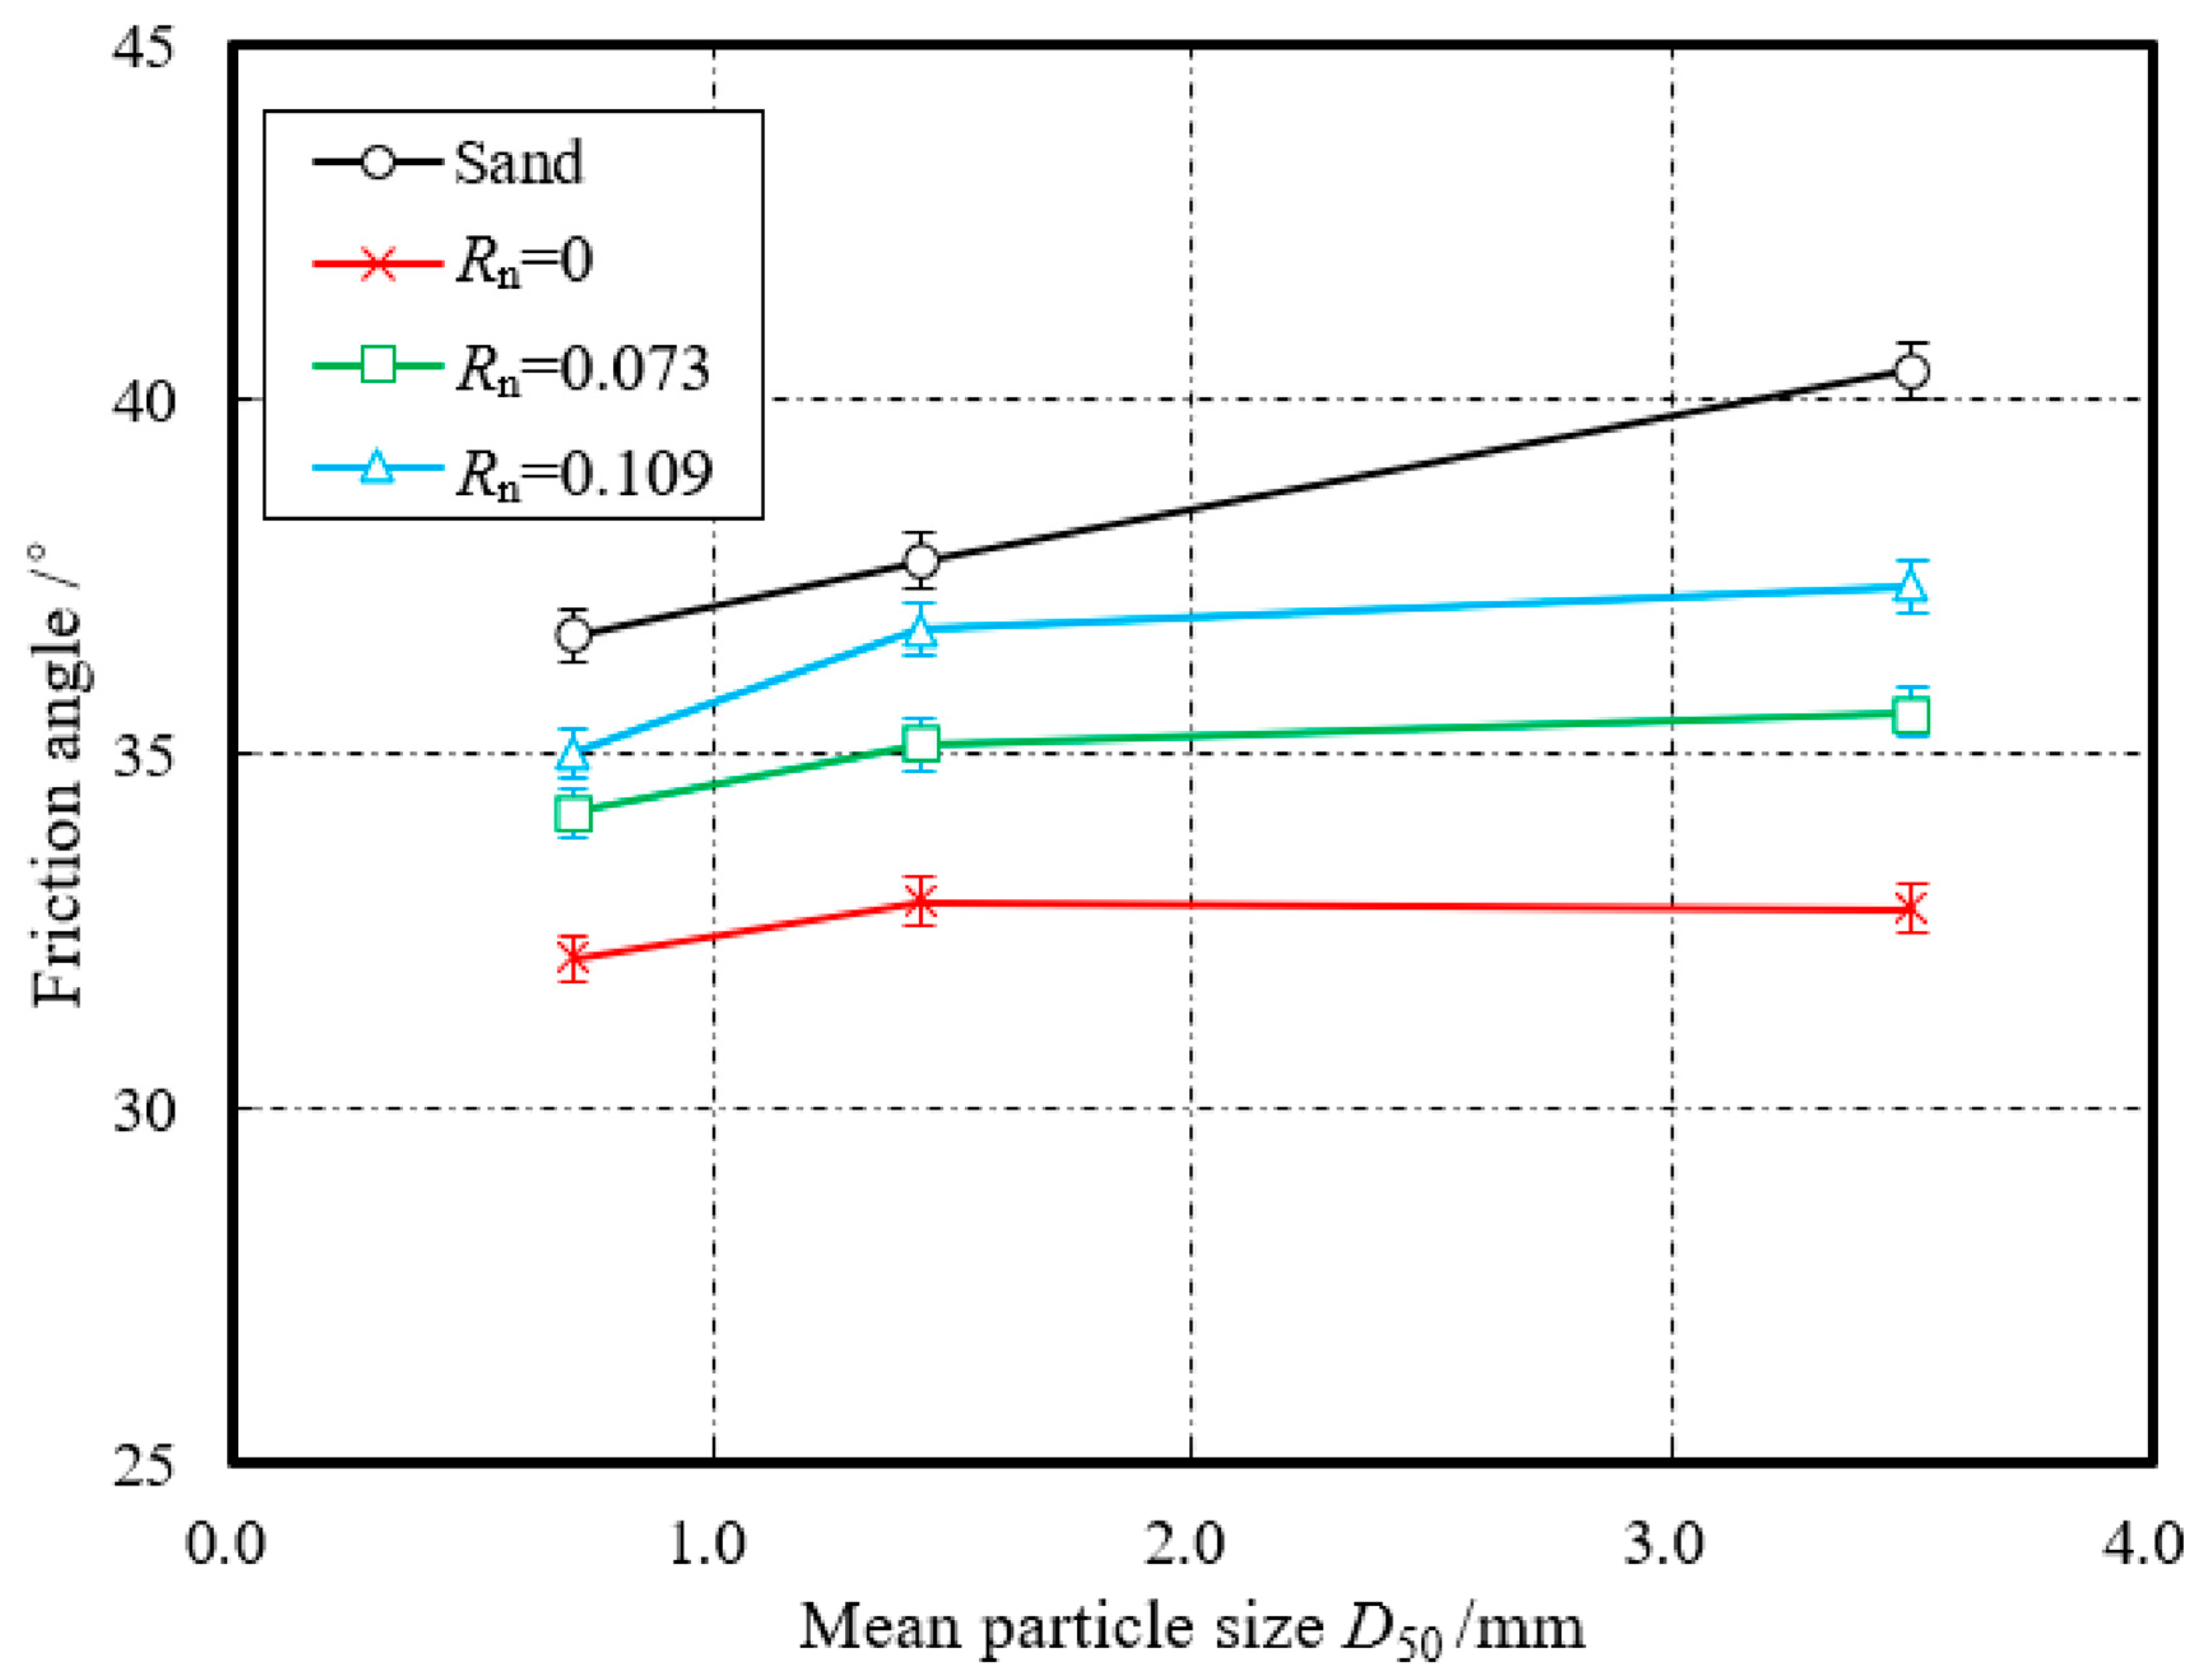
3.3. Effect of Mean Particle Size (D50)
4. Conclusions
- The shear behavior between sand and concrete was affected by the levels of relative roughness (Rn). The higher the relative roughness, the larger the maximum shear stress appeared. However, the mobilized shear stress was still lower than that of the pure sand test.
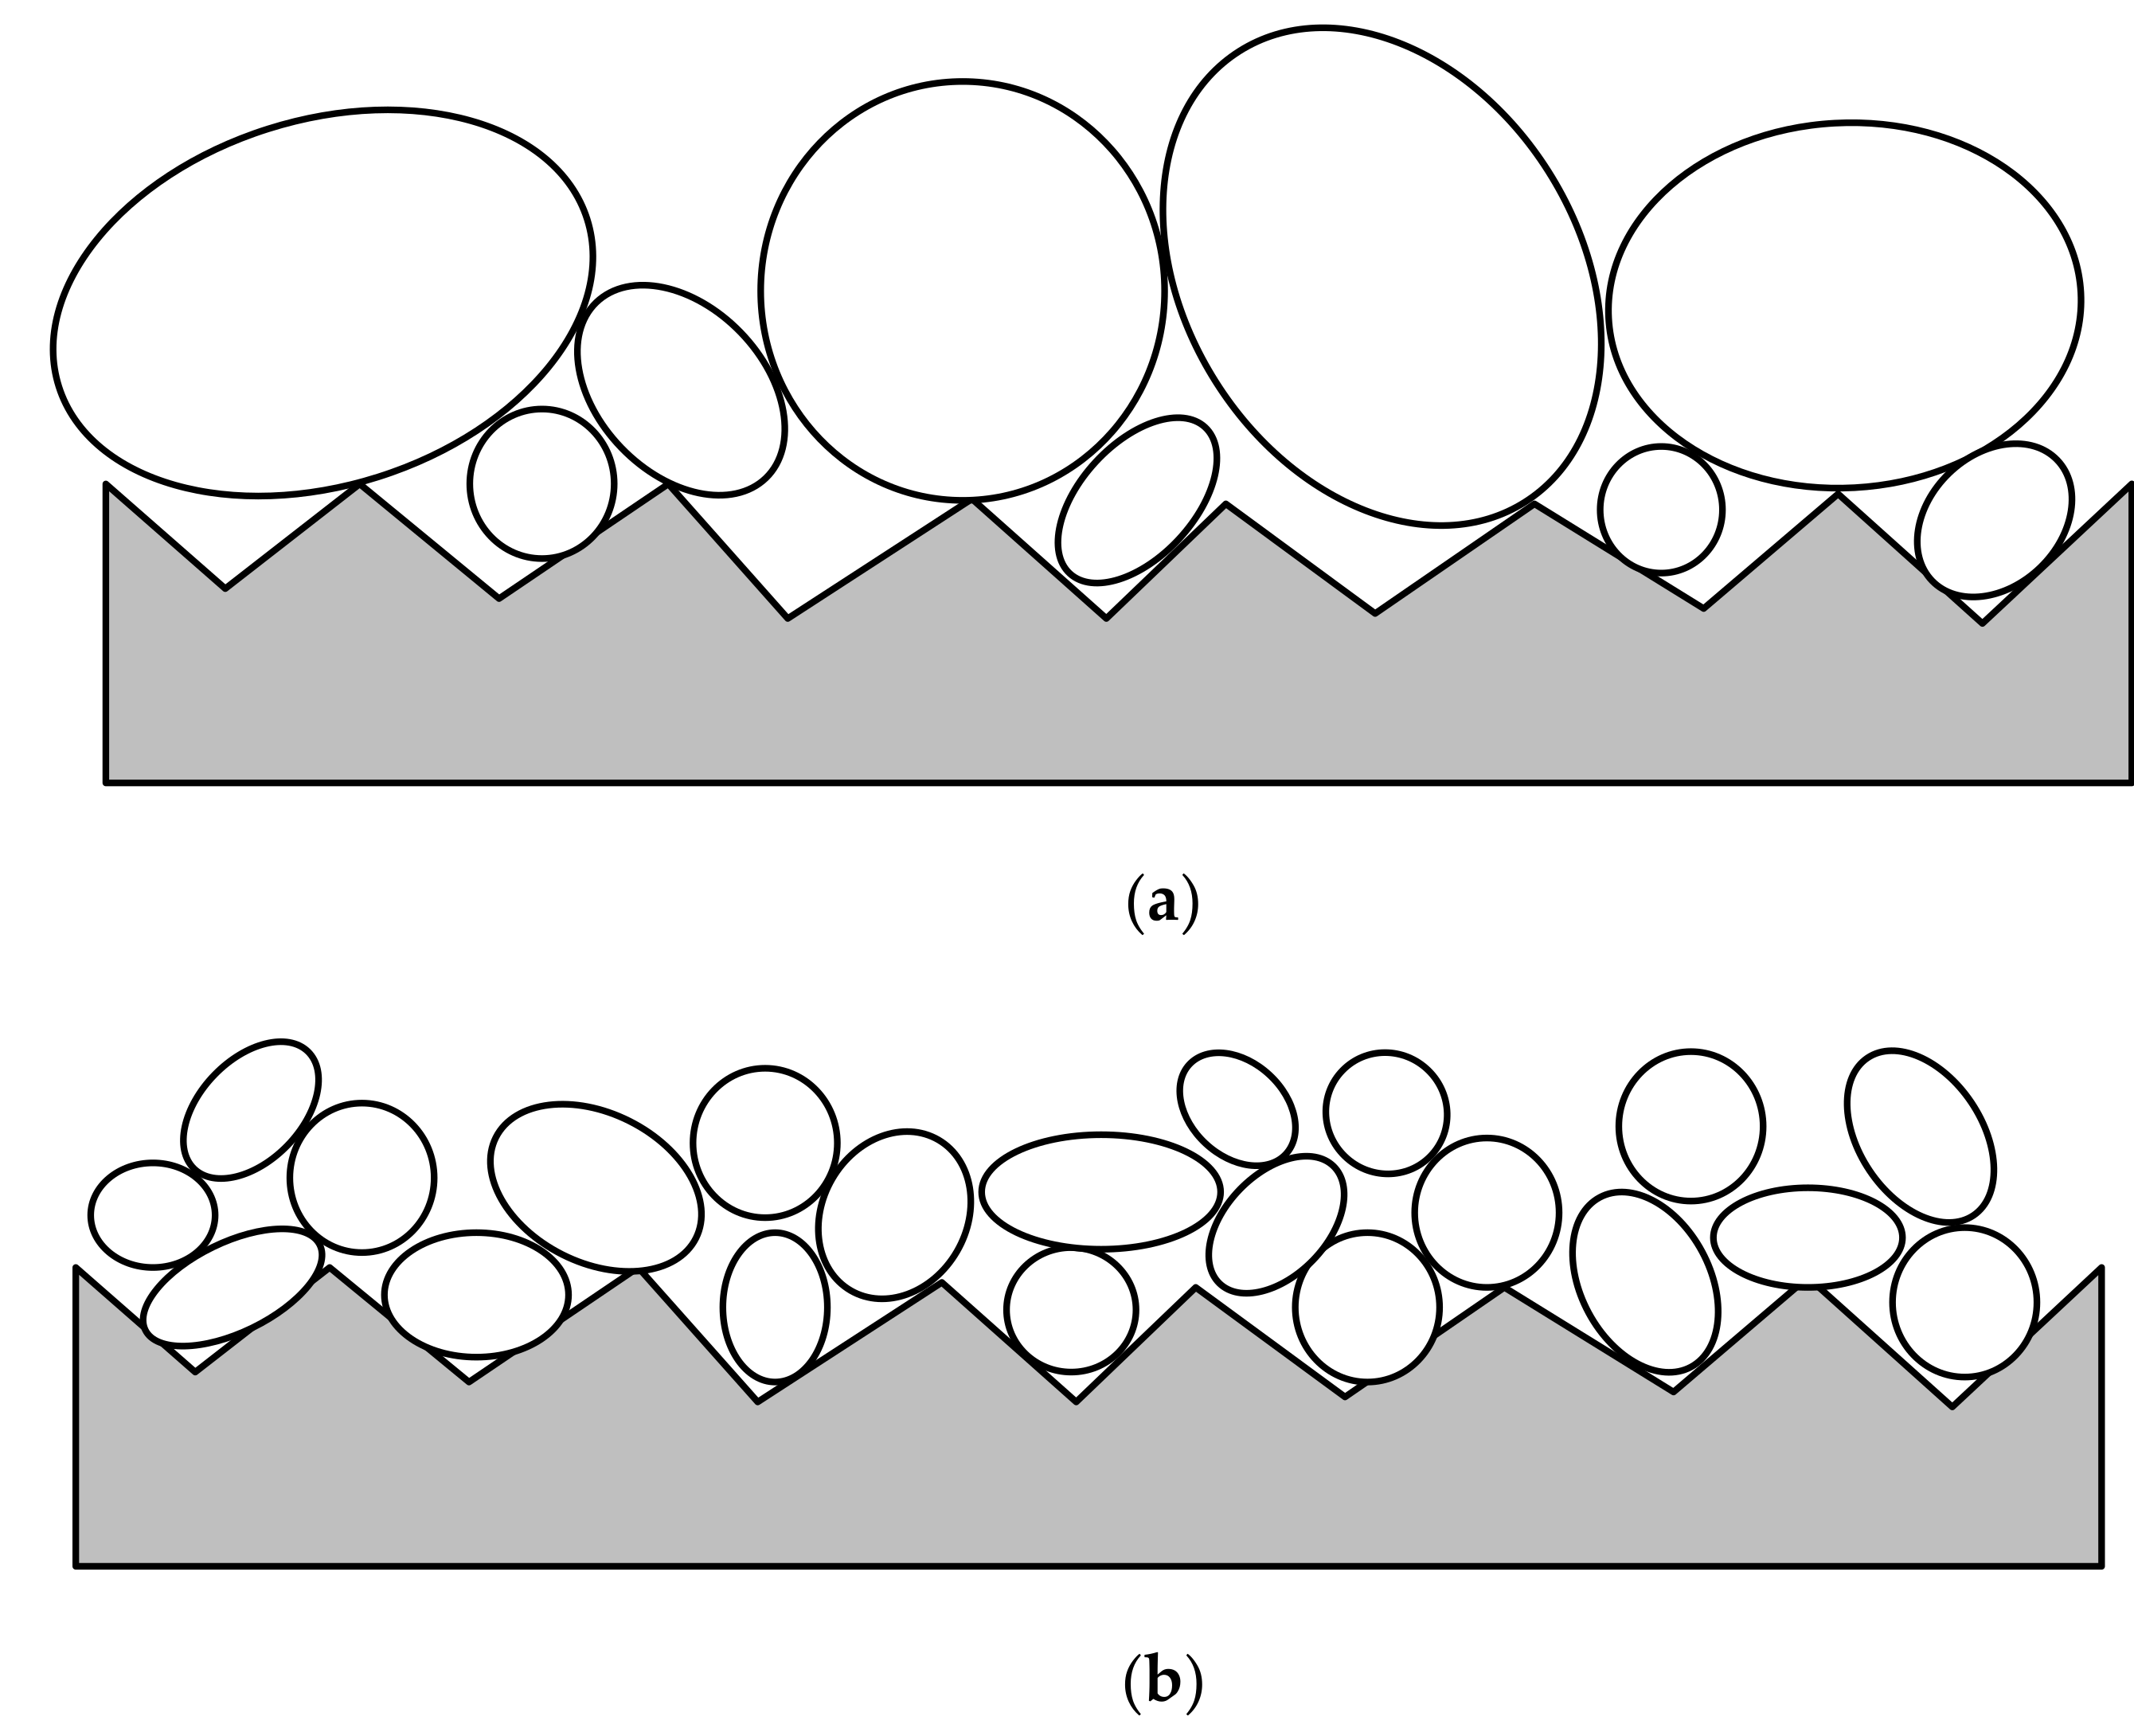
- The interface friction angle (φ) between sand and concrete was closely related to the surface relative roughness (Rn). Under the same conditions, the interface friction angle (φ) increased with the interface relative roughness (Rn), which resulted from the redistribution of sand grains and fracture of the contact bond during the shearing process.
- The effect of mean particle size (D50) on the friction angle of the sand–concrete interface was less significant than that for pure sand. This is because particle breakage and embedded fine particles were much more significant in sand–solid materials interaction.
- The relationship between the normalized friction angle (φ/φ′) and the ratio of Rn to D50 for the tested particle size ranges and roughness agreed well with that reported by Dietz and Ling (2006) for the sand–mild steel interface. This indicates that the shear behavior of the sand–concrete interface for the tested particle size ranges and roughness was similar to that of the sand–mild steel interface. Hence, under the premise of the tested particle size ranges and roughness, the shear behavior, considering the ratio of Rn to D50, should be taken into account in practical recommendations.
Author Contributions
Funding
Acknowledgments
Conflicts of Interest
References
- Andersen, K.H.; Dyvik, R.; Schroder, K.; Hansteen, O.E.; Bysveen, S. Field Tests of Anchors in Clay II: Predictions and Interpretation. J. Geotech. Eng. 1993, 119, 1532–1549. [Google Scholar] [CrossRef]
- Hu, L.; Pu, J. Testing and modeling of soil-structure interface. J. Geotech. Geoenviron. Eng. 2004, 130, 851–860. [Google Scholar] [CrossRef]
- Sparrevik, P. Suction pile technology and installation in deep waters. In Proceedings of the Offshore Technology Conference, Houston, TX, USA, 6–9 May 2002. [Google Scholar]
- Randolph, M.F.; Gaudin, C.; Gourvenec, S.M.; White, D.J.; Boylan, N.; Cassidy, M.J. Recent advances in offshore geotechnics for deep water oil and gas developments. Ocean Eng. 2011, 38, 818–834. [Google Scholar] [CrossRef] [Green Version]
- Barari, A.; Ibsen, L.B. Undrained response of bucket foundations to moment loading. Appl. Ocean Res. 2012, 36, 12–21. [Google Scholar] [CrossRef]
- Ukritchon, B.; Keawsawasvong, S. Undrained pullout capacity of cylindrical suction caissons by finite element limit analysis. Comput. Geotech. 2016, 80, 301–311. [Google Scholar] [CrossRef]
- Nielsen, S.D. Finite element modeling of the tensile capacity of suction caissons in cohesionless soil. Appl. Ocean Res. 2019, 90, 101866. [Google Scholar] [CrossRef]
- Iskander, M.; El-Gharbawy, S.; Olson, R. Performance of suction caissons in sand and clay. Can. Geotech. J. 2002, 39, 576–584. [Google Scholar] [CrossRef]
- Shahr-Babak, M.M.; Khanjani, M.J.; Qaderi, K. Uplift capacity prediction of suction caisson in clay using a hybrid intelligence method (GMDH-HS). Appl. Ocean Res. 2016, 59, 408–416. [Google Scholar] [CrossRef]
- Maniar, D.R. A Computational Procedure for Simulation of Suction Caisson Behavior under Axial and Inclined Loads. Ph.D. Thesis, The University of Texas at Austin, Austin, TX, USA, 2004. [Google Scholar]
- Stutz, H.; Masin, D.; Wuttke, F. Enhancement of a hypoplastic model for granular soil-structure interface behaviour. Acta Geotech. 2016, 11, 1249–1261. [Google Scholar] [CrossRef]
- Clough, G.W.; Duncan, J.M. Finite element analyses of retaining wall behavior. J. Soil Mech. Found. 1971, 97, 1657–1673. [Google Scholar]
- Martinez, A.; Frost, J.D.; Hebeler, G.L. Experimental study of shear zones formed at sand/steel interfaces in axial and torsional axisymmetric tests. Geotech. Test. J. 2015, 38, 409–426. [Google Scholar] [CrossRef]
- Hadi, H. Simulating the crack propagation mechanism of pre-cracked concrete specimens under shear loading conditions. Strength Mater. 2015, 47, 618–632. [Google Scholar]
- Hadi, H.; Vahab, S.; Ahmadreza, H. Suggesting a new testing device for determination of tensile strength of concrete. Struct. Eng. Mech. 2016, 60, 939–952. [Google Scholar]
- Desai, C.S.; Drumm, E.C.; Zaman, M.M. Cyclic testing and modeling of interfaces. J. Geotech. Eng. 1985, 111, 793–815. [Google Scholar] [CrossRef]
- Uesugi, M.; Kishida, H.; Uchikawa, Y. Frictional resistance at yield between dry sand and mild steel. Soils Found. 1986, 26, 139–149. [Google Scholar] [CrossRef] [Green Version]
- Desai, C.S.; Rigby, D.B. Cyclic interface and joint shear device including pore pressure effects. J. Geotech. Geoenviron. Eng. 1997, 123, 568–579. [Google Scholar] [CrossRef]
- Subba Rao, K.S.; Allam, M.M.; Robinson, R.G. Interfacial friction between sands and solid surfaces. Geotech. Eng. 1998, 131, 75–82. [Google Scholar] [CrossRef]
- DeJong, J.T.; Frost, J.D.; Saussus, D.R. Measurement of relative surface roughness at particulate—Continuum interfaces. J. Test. Eval. JTEVA 2002, 30, 8–19. [Google Scholar]
- DeJong, J.T.; Randolph, M.F.; White, D.J. Interface load transfer degradation during cyclic loading: A microscale investigation. Soils Found. 2003, 43, 81–93. [Google Scholar] [CrossRef] [Green Version]
- Lashkari, A. Prediction of the shaft resistance of non-displacement piles in sand. Int. J. Numer. Anal. Methods Geomech. 2013, 37, 904–931. [Google Scholar] [CrossRef]
- Martinez, A.; Frost, J.D. The influence of surface roughness form on the strength of sand–structure Interfaces. Géotech. Lett. 2017, 7, 104–111. [Google Scholar] [CrossRef]
- Kou, H.; Chu, J.; Guo, W.; Zhang, M. Pile load test of jacked open-ended prestressed high-strength concrete pipe pile in clay. Proc. Inst. Civ. Eng.-Geotech. Eng. 2018, 171, 243–251. [Google Scholar] [CrossRef]
- Hryciw, R.D.; Irsyam, M. Behavior of sand particles around rigid ribbed inclusions during shear. Soils Found. 1993, 33, 1–13. [Google Scholar] [CrossRef] [Green Version]
- Porcino, D.; Fioravante, V.; Ghionna, V.N.; Pedroni, S. Interface behavior of sands from constant normal stiffness direct shear tests. Geotech. Test. J. 2003, 26, 289–301. [Google Scholar]
- Lehane, B.M.; White, D.J. Lateral stress changes and shaft friction for model displacement piles in sand. Can. Geotech. J. 2005, 42, 1039–1052. [Google Scholar] [CrossRef]
- Potyondy, J.G. Skin friction between various soils and construction materials. Geotechnique 1961, 11, 339–353. [Google Scholar] [CrossRef]
- Wernick, E. Skin friction of cylindrical anchors in noncohesive soils. In Proceedings of the Symposium on Soil Reinforcing and Stabilizing Techniques, Sidney, Australia, 16–19 October 1978; pp. 201–219. [Google Scholar]
- Yin, Z.Z.; Zhu, H.; Xu, G.H. A study of deformation in the interface between soil and concrete. Comput. Geotech. 1995, 17, 75–92. [Google Scholar]
- Subba Rao, K.S.; Allam, M.M.; Robinson, R.G. Drained shear strength of fine-grained soil–solid surface interfaces. Proc. Inst. Civ. Eng.-Geotech. Eng. 2000, 143, 75–81. [Google Scholar] [CrossRef]
- Shakir, R.R.; Zhu, J. Behavior of compacted clay-concrete interface. Front. Archit. Civ. Eng. China 2009, 3, 85–92. [Google Scholar] [CrossRef]
- Liu, J.; Zou, D.; Kong, X. A three-dimensional state-dependent model of soil-structure interface for monotonic and cyclic loadings. Comput. Geotech. 2014, 61, 166–177. [Google Scholar] [CrossRef]
- Chen, X.; Zhang, J.; Xiao, Y.; Li, J. Effect of roughness on shear behavior of red clay-concrete interface in large-scale direct shear tests. Can. Geotech. J. 2015, 52, 1122–1135. [Google Scholar] [CrossRef]
- Hadi, H.; Vahab, S.; Mohammad, F.M.; Ahmadreza, H.; Zheming, Z. Experimental and numerical study of shear fracture in brittle materials with interference of initial double cracks. Acta Mech. Solida Sin. 2016, 29, 555–566. [Google Scholar]
- Di Donna, A.; Ferrari, A.; Laloui, L. Experimental investigations of the soil-concrete interface: Physical mechanisms, cyclic mobilization.; behavior at different temperatures. Can. Geotech. J. 2016, 53, 659–672. [Google Scholar] [CrossRef]
- ASTM D6913/D6913M-17. Standard Test Methods for Particle-Size Distribution (Gradation) of Soils Using Sieve Analysis; ASTM International: West Conshohocken, PA, USA, 2017; Available online: https://www.astm.org/Standards/D6913.htm (accessed on 21 September 2020).
- ASTM D422-63. Standard Test Method for Particle-Size Analysis of Soils; ASTM International: West Conshohocken, PA, USA, 2007; Available online: https://www.astm.org/DATABASE.CART/WITHDRAWN/D422.htm (accessed on 21 September 2020).
- ASTM D558-11. Standard Test Methods for Moisture-Density (Unit Weight) Relations of Soil-Cement Mixtures; ASTM International: West Conshohocken, PA, USA, 2011; Available online: https://www.astm.org/Standards/D558.htm (accessed on 2 November 2020).
- ASTM D854-14. Standard Test Methods for Specific Gravity of Soil Solids by Water Pycnometer; ASTM International: West Conshohocken, PA, USA, 2014; Available online: https://www.astm.org/Standards/D854.htm (accessed on 21 September 2020).
- ASTM D3080/D3080M-11. Standard Test Method for Direct Shear Test of Soils Under Consolidated Drained Conditions; ASTM International: West Conshohocken, PA, USA, 2014; Available online: https://www.astm.org/DATABASE.CART/WITHDRAWN/D3080D3080M.htm (accessed on 21 September 2020).
- Abbas, S.M. Constitutive Modeling of Rockfill Materials; Lap Lambert Academic: Saarbrücken, Germany, 2011. [Google Scholar]
- Kou, H.L.; Wu, C.Z.; Ni, P.P.; Jang, B.A. Assessment of erosion resistance of biocemented sandy slope subjected to wave actions. Appl. Ocean Res. 2020, 105, 102401. [Google Scholar]
- Dietz, M.S.; Lings, M.L. Postpeak strength of interfaces in a stress-dilatancy framework. J. Geotech. Geoenviron. Eng. 2006, 132, 1474–1484. [Google Scholar] [CrossRef]
- Uesugi, M.; Kishida, H.; Uchikawa, Y. Friction between dry sand and concrete under monotonic and repeated loading. Soils Found. 1990, 30, 115–128. [Google Scholar] [CrossRef] [Green Version]
- Han, F.; Ganju, E.; Salgado, R.; Prezzi, M. Effects of interface roughness, particle geometry, and gradation on the sand-steel interface friction angle. J. Geotech. Geoenviron. Eng. 2018, 144, 04018096. [Google Scholar] [CrossRef]


| Particle Size Range (mm) | Mean Particle Size (D50) (mm) | Specific Gravity (Gs) | Relative Density (Dr) (%) | Maximum Dry Density (ρdmax) (g/cm3) | Minimum Dry Density (ρdmin) (g/cm3) |
|---|---|---|---|---|---|
| 0.63–1.25 | 0.71 | 2.65 | 51.39 | 1.67 | 1.37 |
| 1.25–2.50 | 1.43 | 2.65 | 51.39 | 1.69 | 1.39 |
| 2.50–5.00 | 3.50 | 2.67 | 51.39 | 1.73 | 1.45 |
| Types of Shear Tests | 0.63–1.25 mm | 1.25–2.5 mm | 2.5–5.0 mm |
|---|---|---|---|
| Rn = 0 | 32.14° | 32.93° | 32.83° |
| Rn = 0.073 | 34.18° | 35.13° | 35.59° |
| Rn = 0.109 | 35.03° | 36.76° | 40.17° |
| Pure sand | 36.68° | 37.73° | 40.41° |
Publisher’s Note: MDPI stays neutral with regard to jurisdictional claims in published maps and institutional affiliations. |
© 2020 by the authors. Licensee MDPI, Basel, Switzerland. This article is an open access article distributed under the terms and conditions of the Creative Commons Attribution (CC BY) license (http://creativecommons.org/licenses/by/4.0/).
Share and Cite
Zhang, W.-c.; Jing, H.; Kou, H.-l. Effects of Relative Roughness and Particle Size on the Interface Behavior of Concrete Suction Caisson Foundation for Offshore Wind Turbines. Energies 2020, 13, 5866. https://doi.org/10.3390/en13225866
Zhang W-c, Jing H, Kou H-l. Effects of Relative Roughness and Particle Size on the Interface Behavior of Concrete Suction Caisson Foundation for Offshore Wind Turbines. Energies. 2020; 13(22):5866. https://doi.org/10.3390/en13225866
Chicago/Turabian StyleZhang, Wang-chun, Hao Jing, and Hai-lei Kou. 2020. "Effects of Relative Roughness and Particle Size on the Interface Behavior of Concrete Suction Caisson Foundation for Offshore Wind Turbines" Energies 13, no. 22: 5866. https://doi.org/10.3390/en13225866