Article

Investigation on the Mechanism of Heat Load Reduction for the Thermal Anti-Icing System

1
College of Aerospace Engineering, Nanjing University of Aeronautics and Astronautics, Nanjing 210016, China
2
Interdisciplinary Research Institute of Aeronautics and Astronautics, Nanjing University of Aeronautics and Astronautics, Nanjing 210016, China
*
Author to whom correspondence should be addressed.
Energies 2020, 13(22), 5911; https://doi.org/10.3390/en13225911
Submission received: 10 October 2020 / Revised: 5 November 2020 / Accepted: 6 November 2020 / Published: 12 November 2020

Abstract

:
The aircraft ice protection system that can guarantee flight safety consumes a part of the energy of the aircraft, which is necessary to be optimized. A study for the mechanism of the heat load reduction in the thermal anti-icing system under the evaporative mode was presented. Based on the relationship between the anti-icing heat load and the heating power distribution, an optimization method involved in the genetic algorithm was adopted to optimize the anti-icing heat load and obtain the optimal heating power distribution. An experiment carried out in an icing wind tunnel was conducted to validate the optimized results. The mechanism of the anti-icing heat load reduction was revealed by analyzing the influences of the key factors, such as the heating range, the surface temperature and the convective heat transfer coefficient. The results show that the reduction in the anti-icing heat load is actually the decrease in the convective heat load. In the evaporative mode, decreasing the heating range outside the water droplet impinging limit can reduce the convective heat load. Evaporating the runback water in the high-temperature region can lead to the less convective heat load. For the airfoil, the heating power distribution that has an opposite trend with the convective heat transfer coefficient can reduce the convective heat load. Thus, the optimal heating power distribution has such a trend that is low at the leading edge, high at the water droplet impinging limit and zero at the end of the protected area.

Graphical Abstract

1. Introduction

Ice accretion always occurs on aircraft wings and stabilizers when the aircraft is flying through super-cooled water droplet clouds. This phenomenon may have adverse impacts on flight safety where aerodynamic and maneuvering performances are threatened if no adequate protection is supplied [1]. To prevent the aircraft wings and stabilizers from ice accretion, all commercial aircrafts are equipped with ice protection systems [2]. Generally, the thermal anti-icing system is the most widely used for large commercial aircraft and it also accounts for about 20% energy consumption of the aircraft engines [3,4,5]. Therefore, it is critical to optimize the thermal anti-icing system to achieve energy conservation, which can lighten the take-off weight and extend the flying range [6,7].
To prevent ice accretion, the aircraft is equipped with many kinds of anti-icing systems, which can be classified as passive and active anti-icing systems. The passive systems utilize hydrophobic or icephobic materials [8,9] to coat the surfaces of the protected components. The hydrophobic or icephobic properties can keep the surfaces as clean as possible so that ice cannot easily accumulate [10,11,12]. However, in many cases, the passive systems alone are difficult to keep the surfaces free from ice completely and need the active systems to operate together [13]. At present, most active systems are mainly thermal anti-icing systems. The thermal anti-icing system raises the surface temperature of the protected area above the freezing point. The surface temperature can be varied depending on the external environment and the supplied energy, which can lead to different anti-icing modes, i.e., dry surface mode, evaporative mode and runback water mode [14]. The dry surface mode ensures that no water exists within the protected area, which keeps the aircraft quite safe, but wastes massive energy. The runback water mode barely evaporates water and just maintains the surface temperature slightly above the freezing point. Despite its low energy consumption, it risks the runback ice [15], which is not permitted on the lifting and handling surfaces, or the air intakes of aircraft engines [16,17]. The evaporative mode means that the runback water is allowed but will be completely evaporated within the protected area. The energy consumption in this mode is between that in the dry surface mode and the runback water mode. For the sake of flight safety and energy conservation, the thermal anti-icing system usually works in the evaporative mode.
The energy required in the evaporative mode is determined by the heat load of the anti-icing process. There have been many advanced computational codes that can be used for predicting the anti-icing heat load under the evaporative mode, such as LEWICE [18,19], CANICE [20,21], and FENSAP-ICE [22,23]. Al-khalil [24] carried out the validation test of ANTICE code with an NACA0012 airfoil at the NASA Lewis Icing Research Tunnel. The test investigated the performances of the electro-thermal anti-icing system in the evaporative mode and presented the airfoil surface temperature distributions corresponding to different heat flux distributions and icing conditions. The test manifested that the predictions of ANTICE code were in good agreement with the experimental results. Further analysis indicated that there were a series of heat flux distributions enabled the anti-icing system to operate in the evaporative mode, which led to different anti-icing heat loads. Among all the heat flux distributions that keep the system in the evaporative mode, there will be an optimal heat flux distribution that can cause a lesser anti-icing heat load and reduce the energy consumption.
To achieve energy conservation under the evaporation model, many works have been done. Saeed and Paraschivoiu [25] presented a genetic algorithm-based optimization method to determine the optimum characteristics of a hot-air jet. The results enhanced the heat transfer process and improved the efficiency of a hot-air-based anti-icing system. Pellissier and Habashi [26] combined the reduced-order models and genetic algorithms with 3D computational fluid dynamics (CFD) to determine the optimal configuration of the piccolo tube, including jet angles, spacing of holes, and position from the leading edge. The results reduced the runback water mass flow rate and made good use of hot-air energy. Long Chen et al. [27] optimized the heat transfer in the anti-icing component for helicopter rotor, which considered the wiring pattern and heat transfer parameters of the anti-icing component. Mahdi Pourbagian and Habashi [28,29] conducted the optimization for the electro-thermal wing anti-icing systems through the surrogate-based model in conjunction with the Kriging algorithm. The set of design variables included the power density and the length of every heater. The optimization results obtained the minimum anti-icing heat load under different constrained conditions and figured out the corresponding distributions of the power density as well as the surface temperature. The results showed that, in the evaporative mode, the optimal heat flux distribution tended to keep a low value at the leading edge and increase immensely at the end of the protected area. Then, based on the previous works, Mahdi Pourbagian et al. [30] proposed more different constrained problem formulations from the physical and mathematical viewpoints and investigated the models on the convergence speed and the quality of the obtained design solutions. Chang et al. [31] proposed an approach to predict the minimum anti-icing heat load based on the icing limit state in the runback water mode. The numerical simulation was conducted with a DFVLR R-4 airfoil under different conditions. The results revealed that the optimal heating power distribution had a minimum value in the stagnation point and increased along the lower surface.
The previous work mentioned above could achieve energy conservation for the thermal anti-icing system. However, the general underlying mechanism of the anti-icing heat load reduction has not been revealed. Moreover, there is a lack of experimental investigations on the mechanism of the anti-icing heat load reduction. The influence of key parameters on the optimal heat flux distribution has not been fully studied. Therefore, in this paper, the mechanism of anti-icing heat load reduction was uncovered through both numerical simulation and experimental validations. The influences of the heating range, the surface temperature and the convective heat transfer coefficient on the anti-icing heat load reduction were also investigated. The outline of this paper is as follows. First of all, Section 2 presents the modeling and optimization methods of the thermal anti-icing system. Then, to demonstrate the applicability of the numerical models and the optimization methods, an experimental test is conducted and introduced in Section 3. Section 4 gives the numerical and experimental results and discusses the underlying mechanism of the anti-icing heat load reduction. The conclusion is presented in Section 5.

2. Numerical Simulation and Optimization Method

2.1. Modeling of the Anti-Icing Process

According to the Messinger model [32], the mass and energy conservation equations of a control volume for the runback water on the anti-icing surface can be formulated from Figure 1:
m ˙ in + m ˙ imp d x = m ˙ out + m ˙ evap d x
Q w , in + ( q w + q a + q n ) d x = ( q evap + q conv ) d x + Q w , out
where m ˙ in is the mass coming in from the previous control volume, m ˙ out is the mass flowing into the next control volume, m ˙ imp is the mass of water droplets impingement per unit length, m ˙ evap is the mass of evaporation per unit length, q w is the heat flux converted from the kinetic energy of the water droplets impingement, q a is the aerodynamic heating flux, q n is the heat flux supplied by the thermal anti-icing system, q evap is the evaporative heat flux, q conv is the convective heat flux, Q w , in is the energy coming in from the previous control volume, and Q w , out is the energy flowing into the next control volume. The above mass terms are detailed as follows:
m ˙ imp = β u L W C
m ˙ evap = α c p , air ( P r S c ) air 2 / 3 M water M air ( p v , s p v , e p e p v , s )
p v = 602.4 × 10 7.45 ( T 273.15 ) T 38.15
where β is the local water droplet collection efficiency, u is the freestream air velocity, L W C is the liquid water content, α is the local convective heat transfer coefficient, c p , air is the specific heat of air, P r is the Prandtl number, S c is the Schmidt number, M water is the relative molecular mass of water, M air is the relative molecular mass of air and pe is the static pressure at the edge of the boundary layer. pv,s and pv,e are the saturation vapor pressure of water on the airfoil surface and at the edge of the boundary layer, respectively. The above energy terms are detailed as follows:
Q w , in = c p , w m ˙ in ( T s , in T r )
Q w , out = c p , w m ˙ out ( T s T r )
q w = m ˙ imp [ u 2 2 + c p , w ( T T r ) ]
q a = α γ u e 2 2 c p , air
q evap = m ˙ evap r + m ˙ evap c p , w ( T s T e )
q conv = α ( T s T e )
T e = T + u 2 u e 2 2 c p , air
where c p , w is the specific heat of water, T s , in is the temperature of the previous control volume, T s is the temperature of the current control volume, T r is the reference temperature (273.15K), T e is the temperature at the edge of the boundary layer, T is the freestream air temperature, γ is the recovery factor, u e is the velocity at the edge of the boundary layer and r is the latent heat of water evaporation.
Some parameters involved in the calculation of the anti-icing heat load, such as α , β and p e , are determined by the solution of flow field, which can be divided into two steps. The first step is to solve the air flow field by using ANSYS FLUENT CFD code. The Spalart–Allmaras model was selected as the turbulence model. The second step is to calculate the water droplet impingement characteristics by means of the Eulerian approach [33]. A UDF (User Defined Function) [34] was built to solely calculate the water droplets’ movement based on the simulation results of the air flow field. To calculate the anti-icing heat load precisely, the heat conduction calculation was also taken into consideration [35,36].

2.2. Optimization Method of the Anti-Icing Heat Load

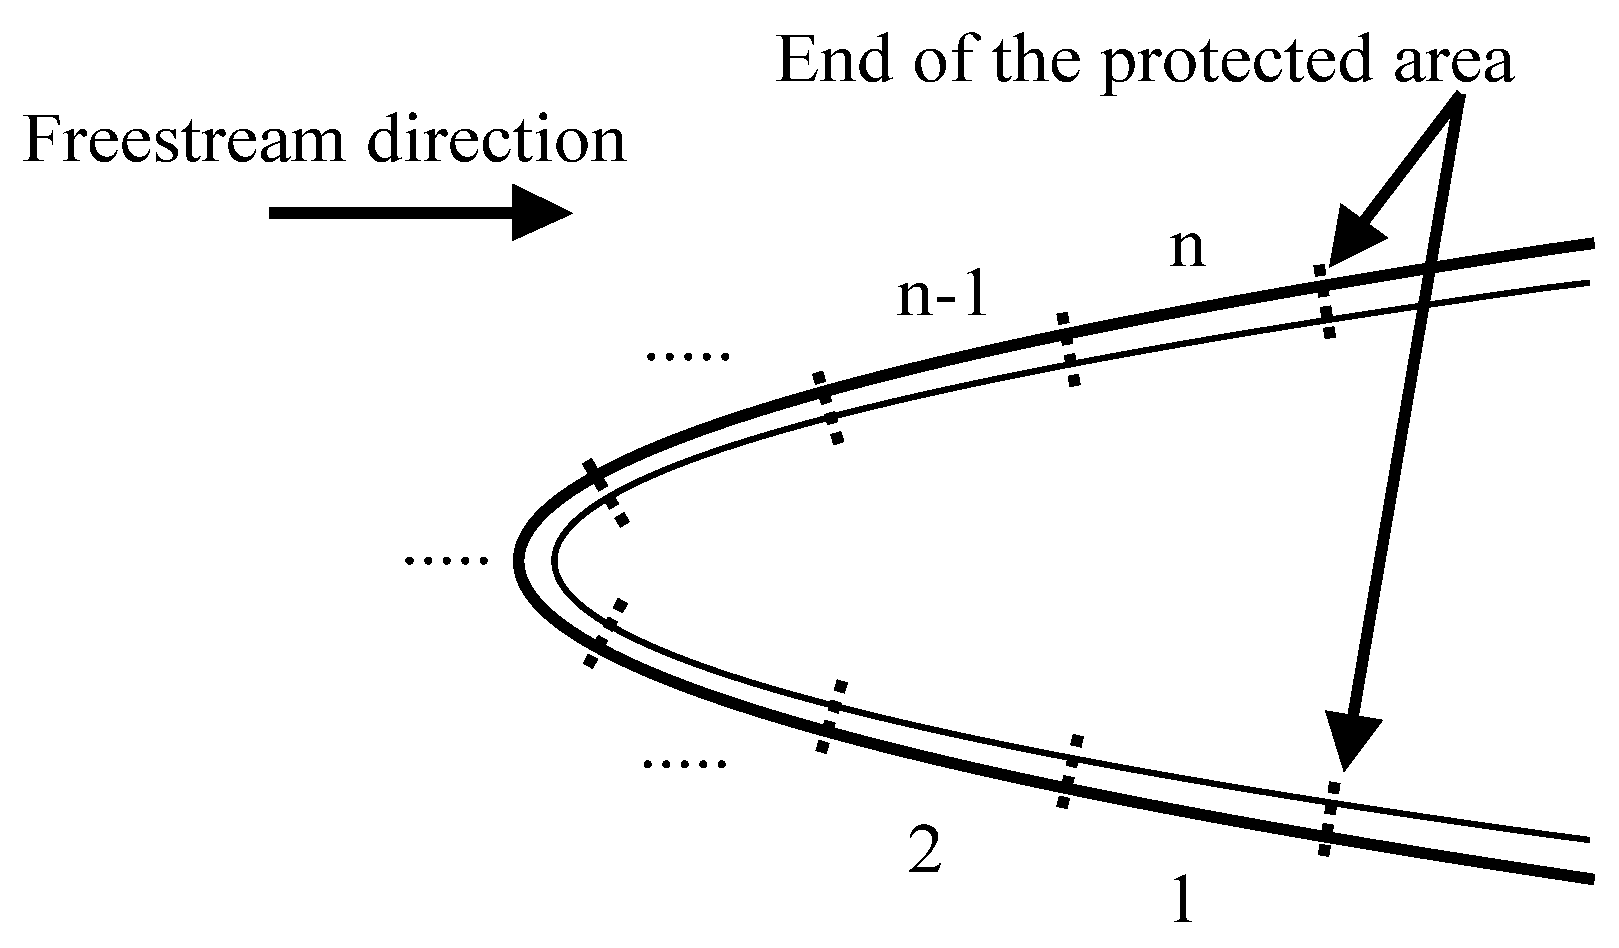
Based on the numerical simulation of the anti-icing process, an optimization method was proposed to optimize the heat flux distribution. For the convenience of practical application, the entire protected area was divided into multiple heating zones, as illustrated in Figure 2 whose heating power can be adjusted independently. The heating power of each zone can be treated as an individual variable and all these independent variables ultimately constituted the heating power distributions. By organizing a set of equations described in Section 2.1, the function for calculating the anti-icing heat load was established. The input of this function was the heating power distribution, and the output was the anti-icing heat load. The optimization goal is to find an optimal heating power distribution that can reduce the anti-icing heat load in the evaporative mode and the constraint condition can be expressed as follows:
Q t = min i = 1 n ( q n , i Δ s i )
subject to
m ˙ out , end = 0
275 K T i T max
where the subscript end denotes the end of the protected area. Equation (14) means that the runback water does not flow out of the protected area, ensuring the system operates in the evaporation mode. Equation (15) makes the protected area free of any ice. Moreover, the mechanical properties of the aircraft structure are greatly affected by temperature. The ultimate strength, the yield strength and the fatigue life of many composite materials decrease as temperature increases [37]. Furthermore, large temperature differences may cause non-uniform expansions in different parts of the structure, resulting in thermal stresses, added to the other imposed stresses [38]. As a consequence, it is recommended that the maximum temperature should be limited to the temperature at which the material is allowed to stand.
For the optimization problem, it is quite suitable to select the Genetic Algorithm (GA) [39]. The Genetic algorithm can deal with multiple individuals simultaneously in a population, which means that it evaluates multiple solutions in the searching space, reducing the risk of falling into the local optimal solution. Moreover, the fitness function is not constrained by continuous differentiability and its domain can be set arbitrarily. In the present study, a heating power distribution under the evaporative mode was encoded into the initial population. By following the selection, mutation and intersection, the initial population was evolved into the high fitness population through generations. Subsequently, the optimal heating power distribution that can reduce the anti-icing heat load was obtained. The flow chart of the optimization method is illustrated in Figure 3.

3. Experimental Setup and Test Model

In the present study, a comprehensive experimental campaign was performed to validate the numerical optimized results. The experimental campaign was conducted in an ejector-driven and straight-flow icing wind tunnel, as shown schematically in Figure 4. The icing wind tunnel consisted of three parts, namely the ejector-driven wind tunnel system, the temperature adjustment system and the spraying system. The ejector-driven wind tunnel system was controlled by a pressure-regulating valve in front of the ejector, and the wind speed in the test section can be regulated from 0 to 90 m/s. The temperature adjustment system was manipulated by another pressure-regulating valve ahead of the cooling turbine, and the ambient temperature inside the insulated chamber can be adjusted from −25 to 0 °C. The spraying system can simulate the icing weather condition of which the liquid water content (LWC) varies from 0.5 to 2 g/m3 and the median volumetric diameter (MVD) varies from 15 to 40 μm. Additional details of the icing wind tunnel are provided in [40].
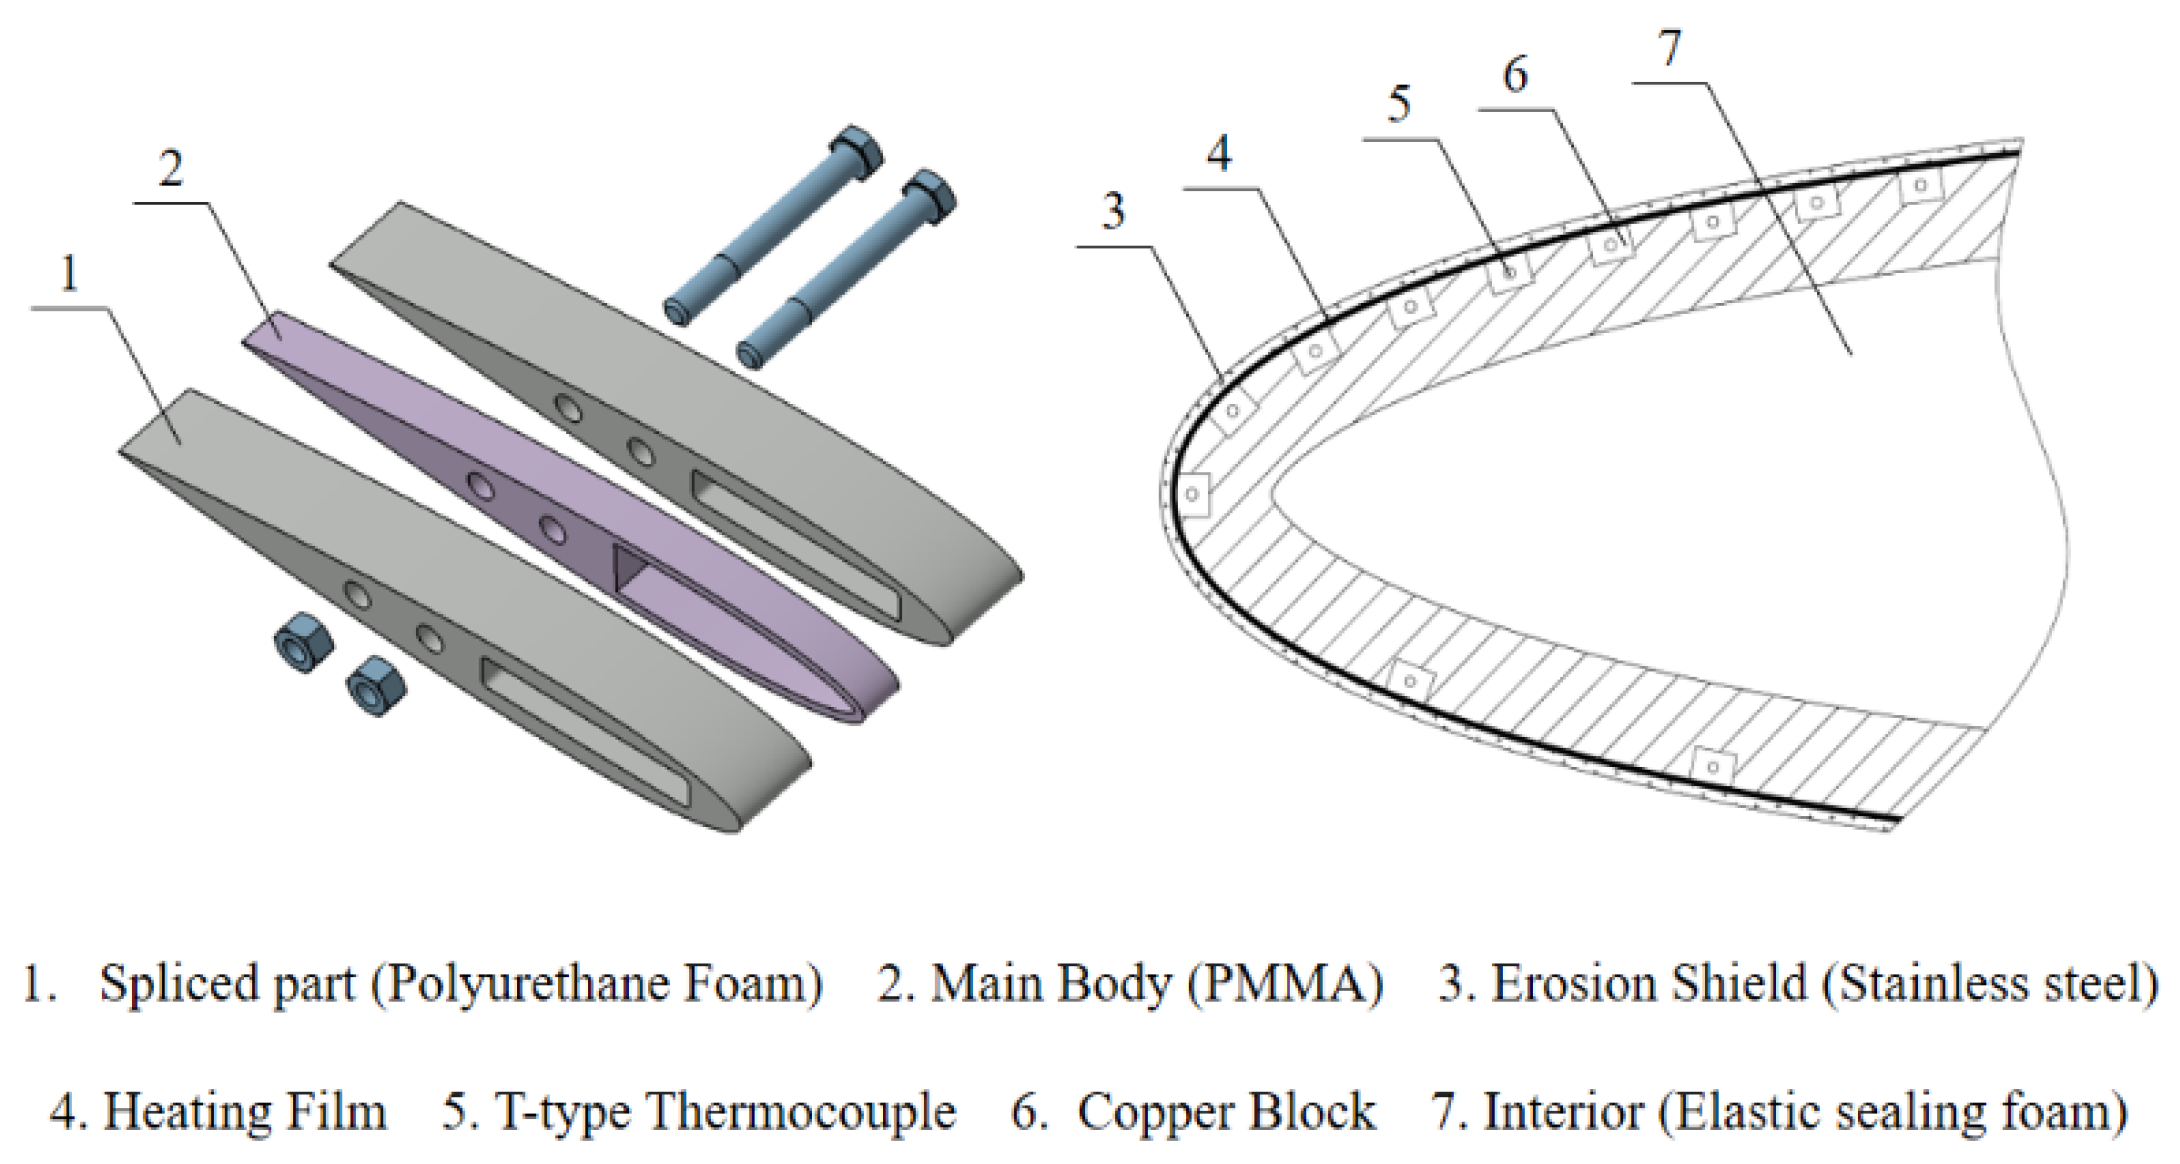
An NACA0012 airfoil with a chord length of 0.3 m and a span length of 0.2 m was designed as a scaled test model. As shown in Figure 5, the test model comprised one main body and two spliced parts. The main body was 20 mm wide and made of polymethyl methacrylate (PMMA). The spliced parts on both sides were 40 mm wide and made of polyurethane foam. Near the front, the insides of the main body and the spliced parts were hollowed out for wiring and temperature sensor installation. Three parts were bolted together and mounted vertically in the test section of the icing wind tunnel.
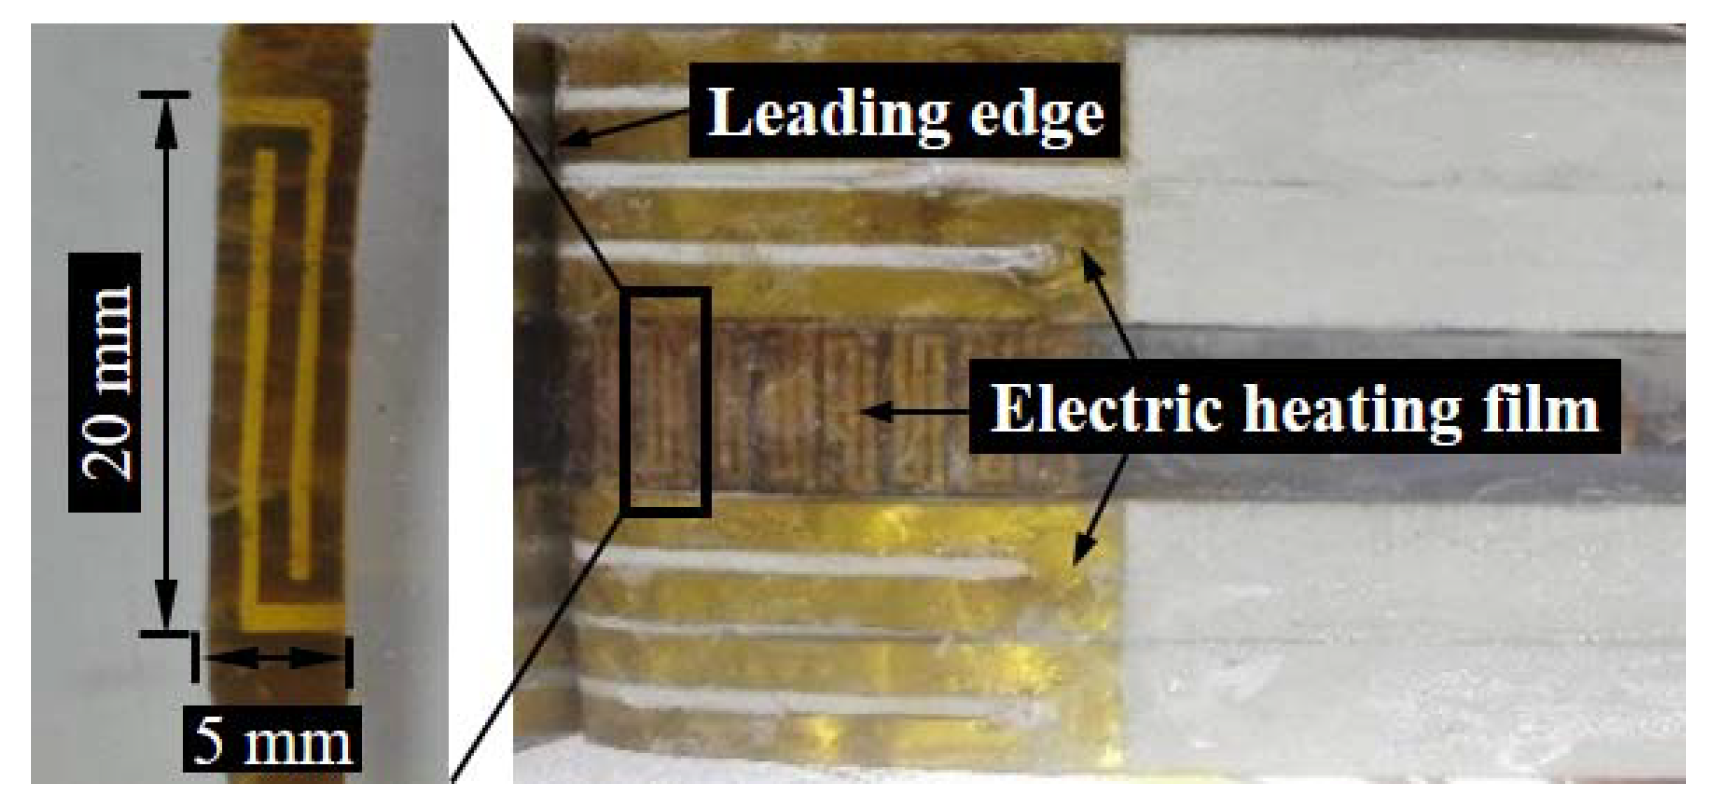
The internal structure, as well as the material composition inside the main body, is illustrated in Figure 5. The outermost layer was the erosion shield, made of stainless steel. To observe and record the location and the distribution of the water film during the experiment, marks were curved on the erosion shields of each spliced part. Next to the erosion shield was the electric heating film layer. The heating film was made of nickel-chromium alloys with the polyimide tape covering its both sides. The size of the heating part was 20 mm × 5 mm. The resistance of each heating film was calibrated before the experiment, and 24 V DC power supplies with the precision of ±0.01V were applied to control the heating power of each heating film, of which the maximum value can be reached to 60 kW/m2. Since the NACA0012 airfoil was symmetrical, only one side needed to be investigated at the angle of attack (AOA) = 0°. Due to the size limitation of experimental conditions, the protected area on one side of the main body was divided into 8 heating zones to simulate various heating power distributions. Each heating zone was covered by an electric heating film which is displayed in Figure 6. The heating zone lengths streamwise are presented in Table 1. On the other side of the main body, the protected area was covered by a larger electric heating film of which the size was 80 mm × 20 mm. Similarly, the leading edges of the spliced parts were also wrapped by the electric heating films, as shown in Figure 6. These heating films were used to keep as much of the test model clean of ice to prevent ice accretion from interference in the measurement on the main body. Material properties of each layer are presented in Table 2.
To obtain the surface temperature distribution without disturbing the heat transfer on the airfoil surface, several T-type thermocouples with the measurement range from −50 to 200 °C and the precision of ±0.5 °C, were installed beneath the heating film inside the main body. Each thermocouple was attached to a small piece of copper block which featured excellent thermal conductivity. Furthermore, the main body interior was filled with polyurethane elastic sealing foam which had a good adiabatic performance. As a consequence, the thermocouples were able to directly and precisely measure the surface temperature, which can be used to validate the numerical simulation and the optimization method.

4. Results and Discussions

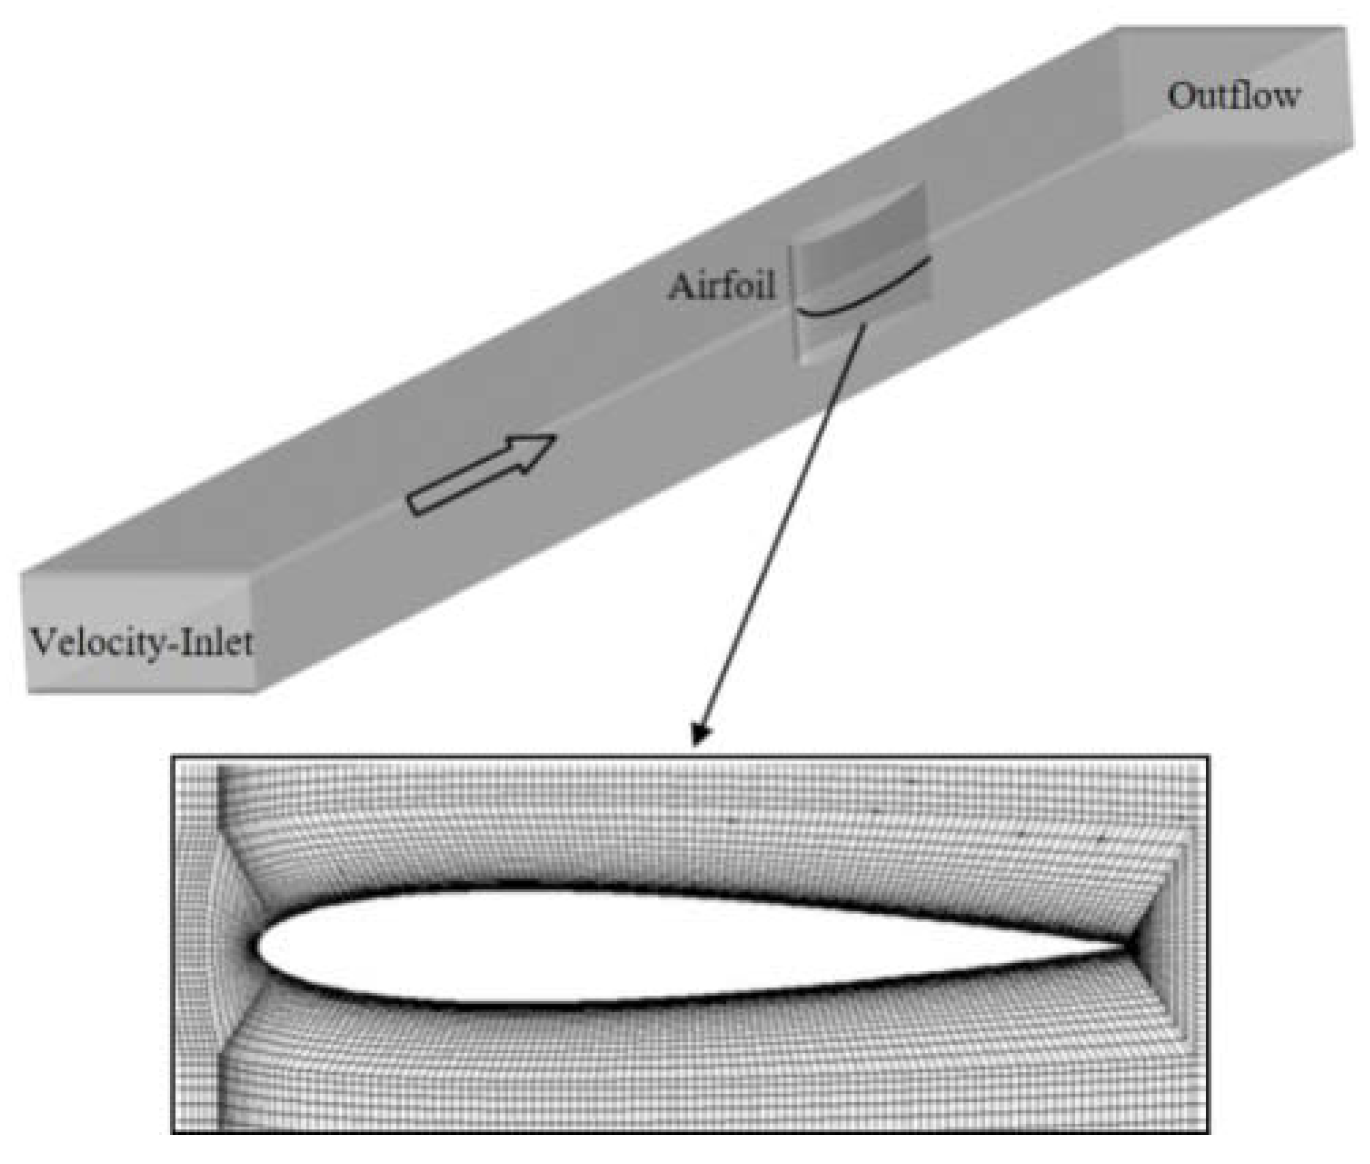
According to the configuration of the icing wing tunnel and the test model, the computational domain of the numerical simulation was established and the boundary conditions were defined, which are displayed in Figure 7. After various tests, a structured grid with 3 million cells was used to calculate the flow field around the test model. The cells in the first boundary layer were refined to y+ ≈ 1. The experimental conditions are listed in Table 3. To validate the numerical simulation and the optimization methods, the numerical results were compared with the experimental results.

4.1. Validation of the Numerical Simulation

4.1.1. Convective Heat Transfer Coefficient

The convective heat transfer coefficient plays an important role in the calculation of the anti-icing heat load. In the icing wind tunnel test, the experimental cases were conducted without the spraying system turned on. When the steady state conditions were achieved, the heating films were adjusted to a uniform temperature, typically in the range of 32 to 38 °C [41]. Roughly three minutes were required to record the temperature and heat flux distribution. The convective heat transfer coefficient can be derived by
α i = q i T s , i T
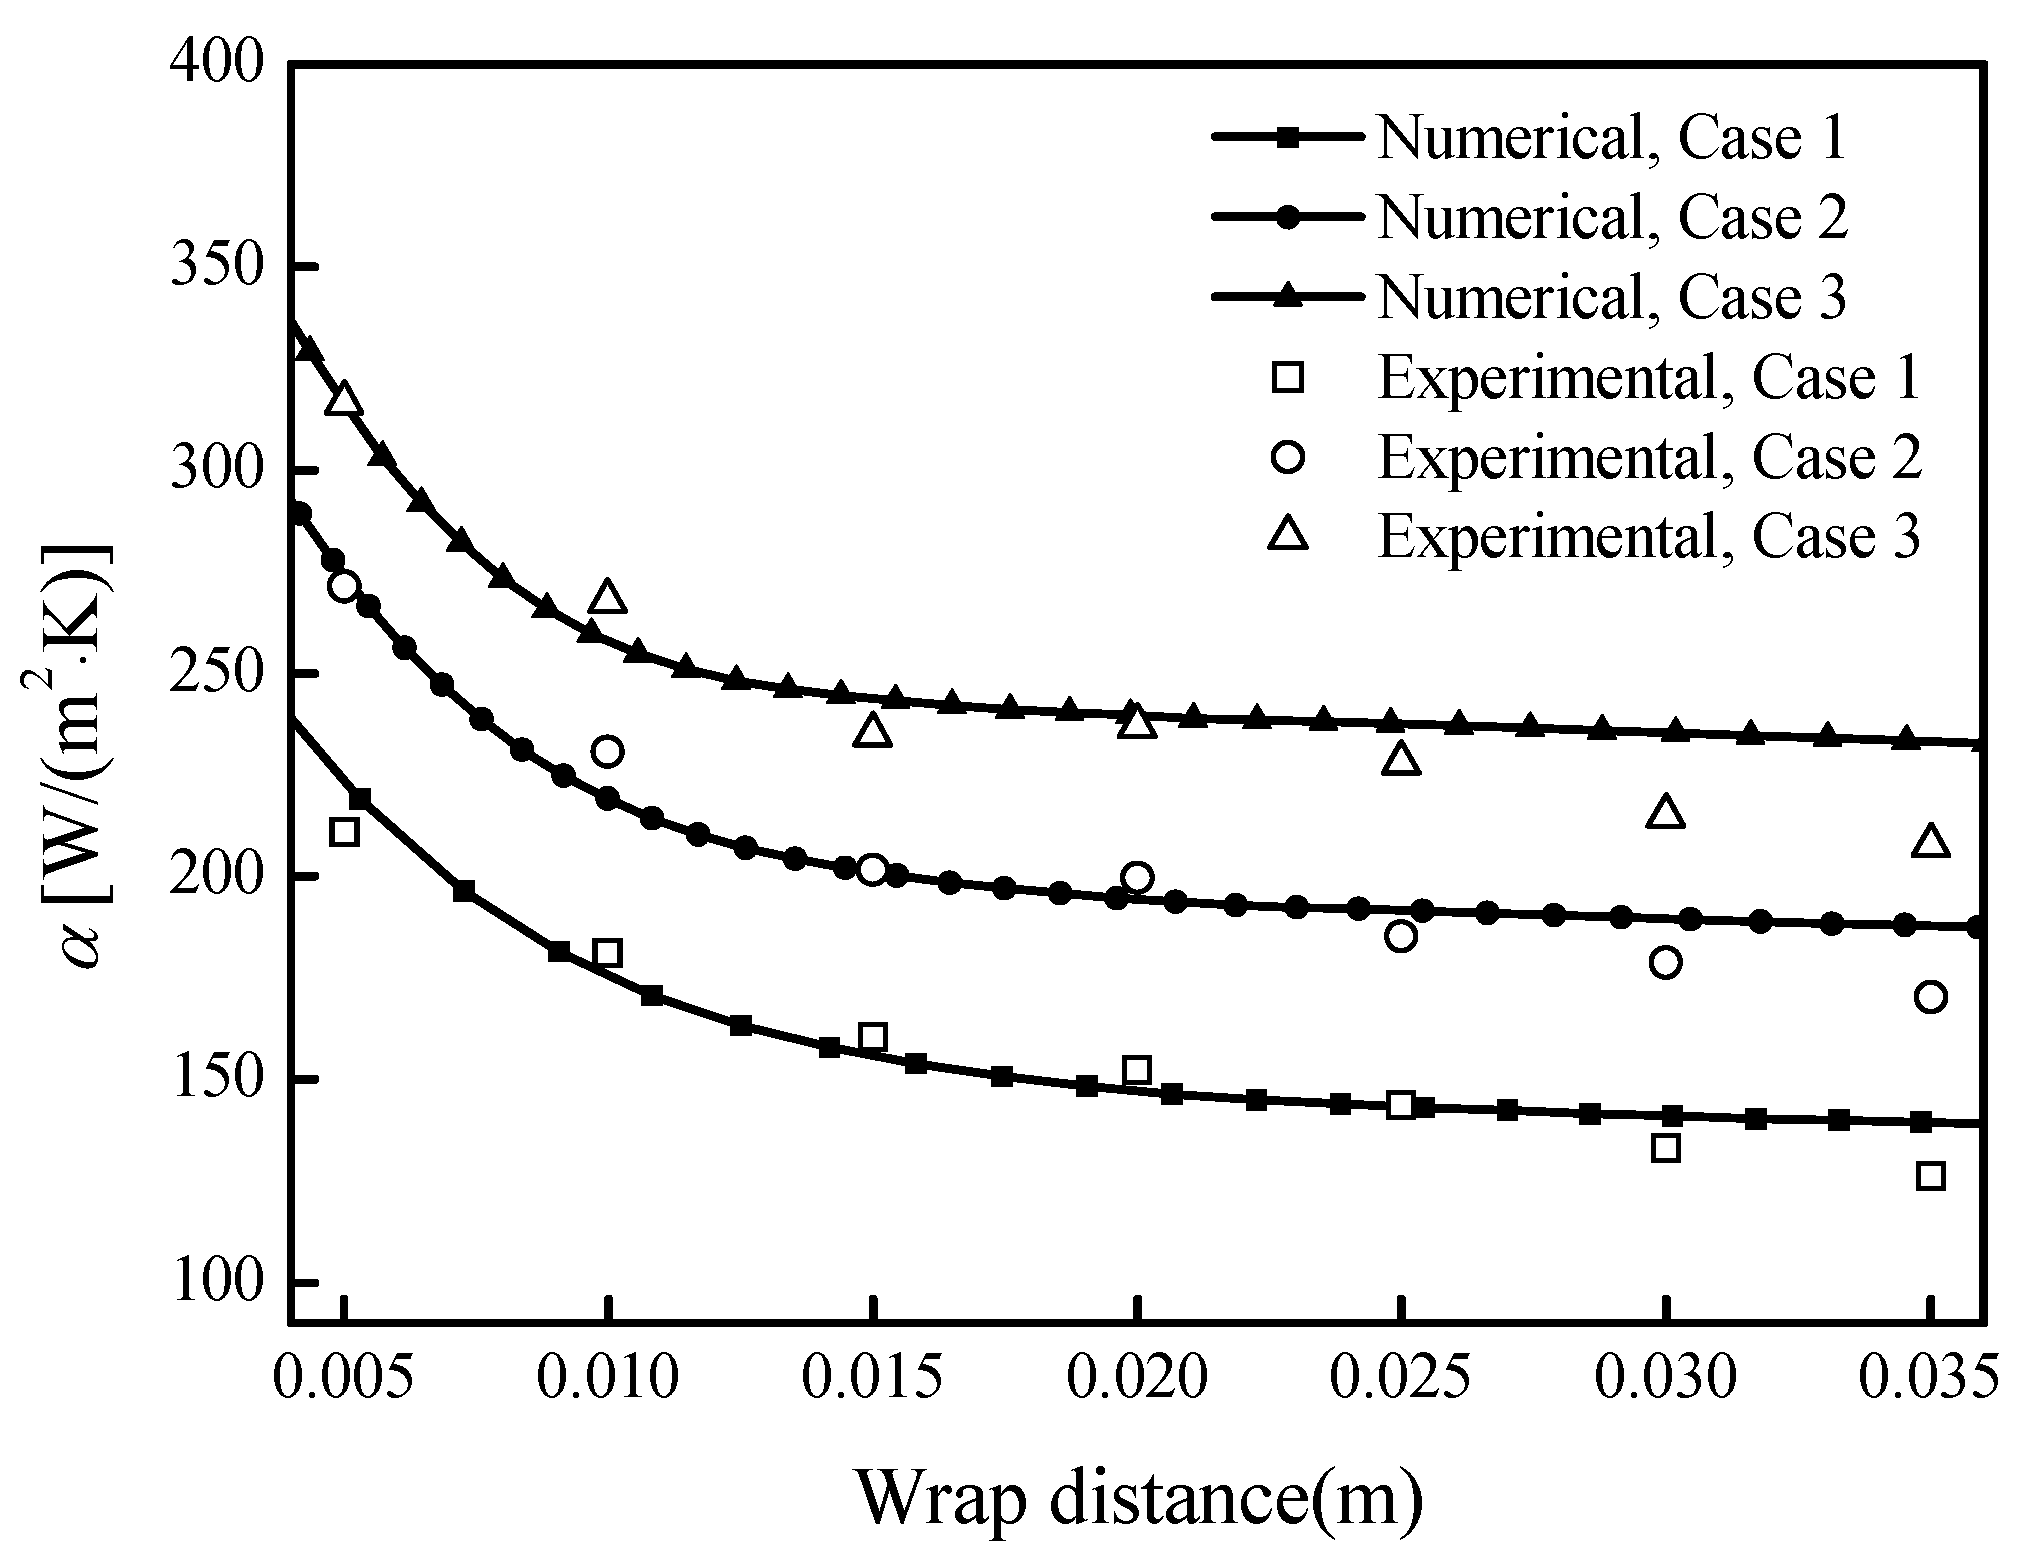
where qi is the power density of the ith heating film. The measurements of the convective heat transfer coefficient were carried out from Case 1 to Case 3. The comparisons of the results of the numerical simulation and the experiment are displayed in Figure 8. As can be seen, the distributions of the convective heat transfer coefficient in all cases show a decreasing tendency, which drops more at the leading edge and less backwards. This kind of distribution means that the leading edge has intensive heat transfer. The maximum error between the numerical and experimental results is less than 15%. In general, there is an acceptable agreement between the numerical and the experimental results.

4.1.2. Water Droplet Impinging Limit

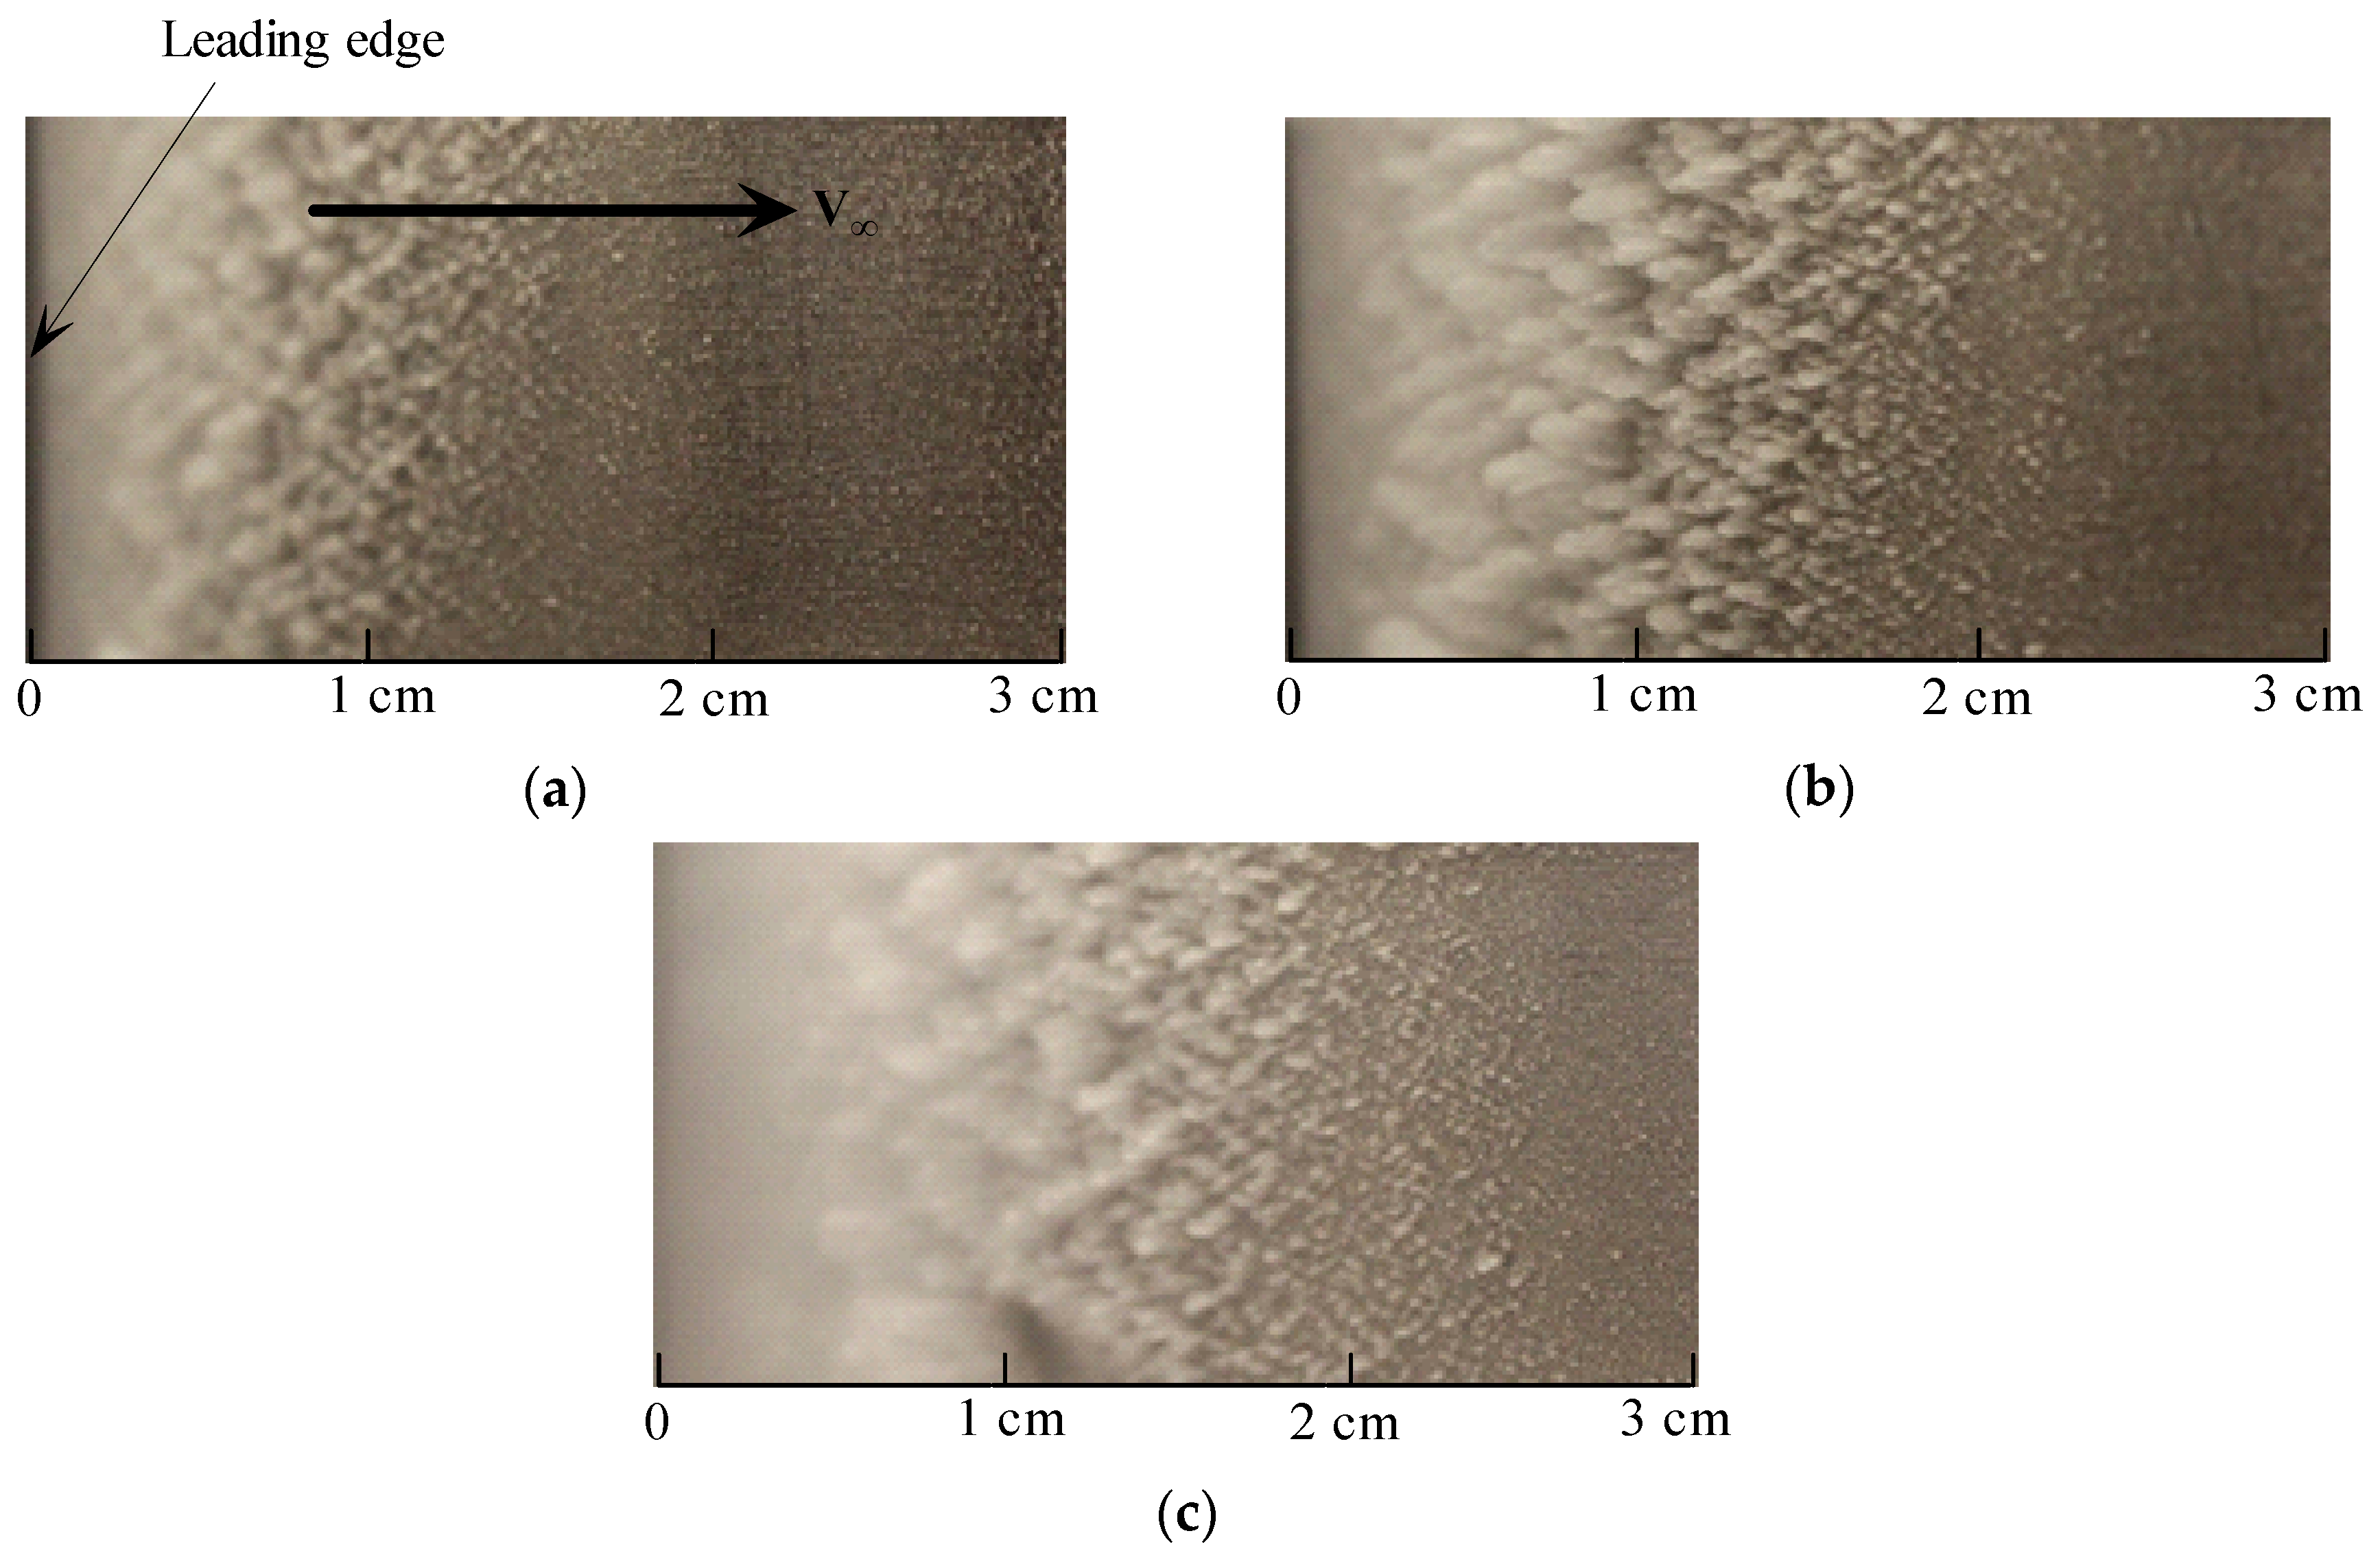
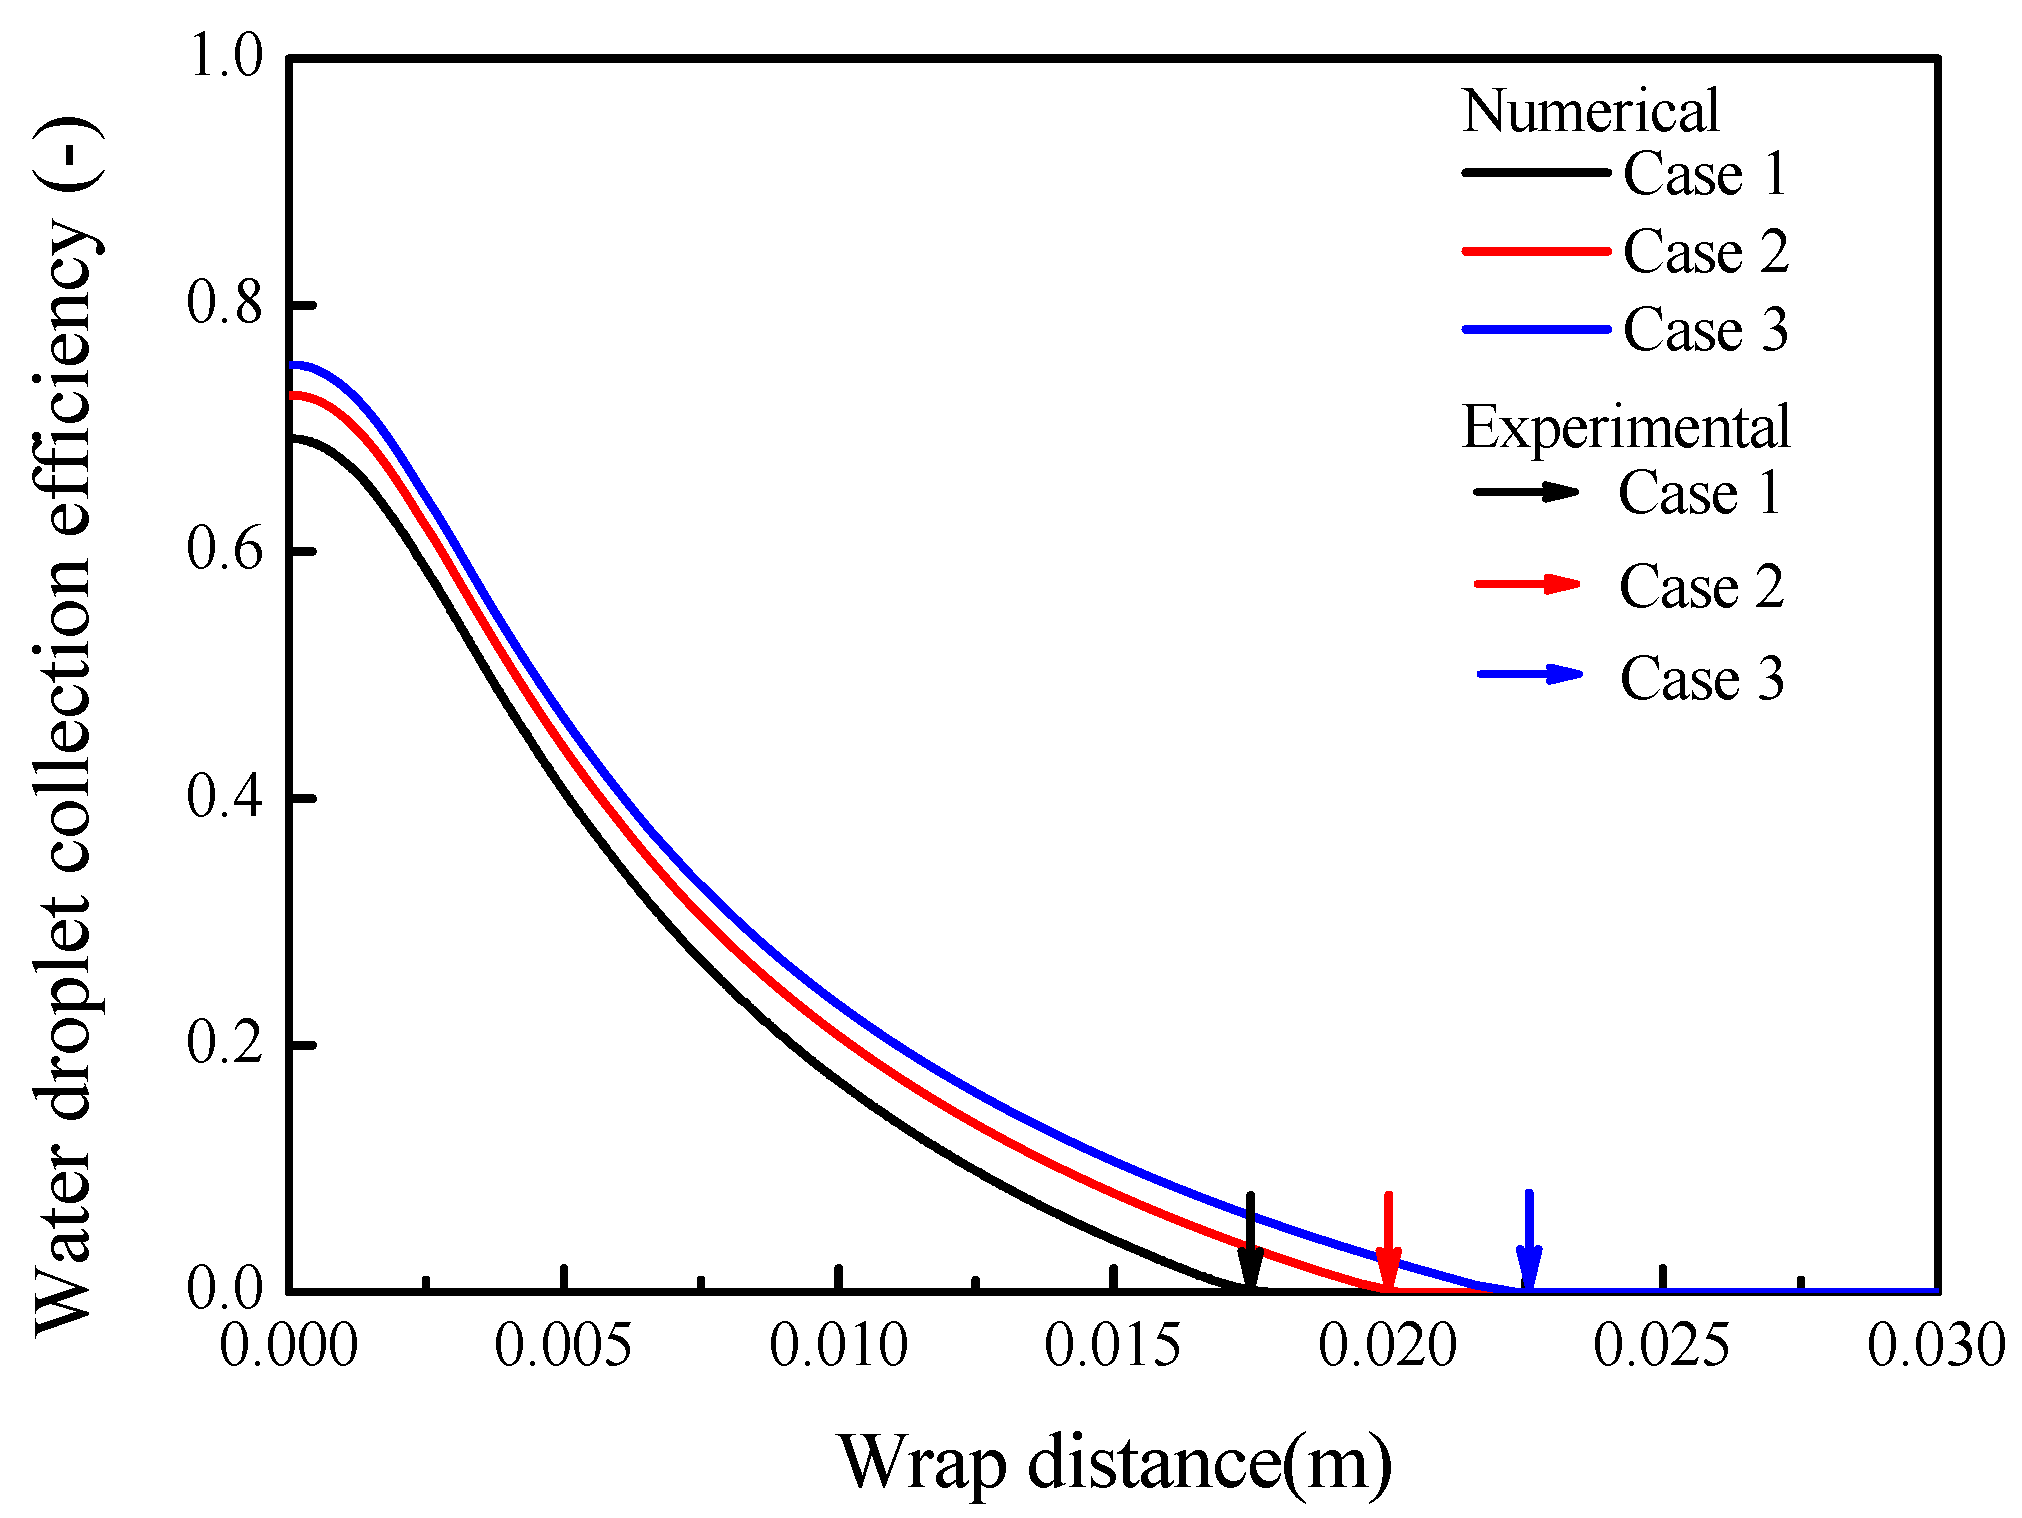
The water droplet impinging limit in each case was measured by the rime ice method, which can form the thin rime ice on the surface of the test model. The pictures of the experimental results are shown in Figure 9, which are 17.5 mm in Case 1, 20 mm in Case 2 and 22.5 mm in Case 3. As can be seen, the water droplet impinging limits increase with the increase in the wind speed. There is more ice accretion at the leading edge and less at the impinging limit, which means the water droplet collection efficiency has a decreasing tendency along with the chord. The comparison between experimental results and numerical simulation of the water droplet collection efficiencies are shown in Figure 10. The results indicate that the numerical water droplet impinging limits are generally consistent with the experimental ones, which means the numerical simulation and the experiments are reliable.

4.1.3. Surface Temperature

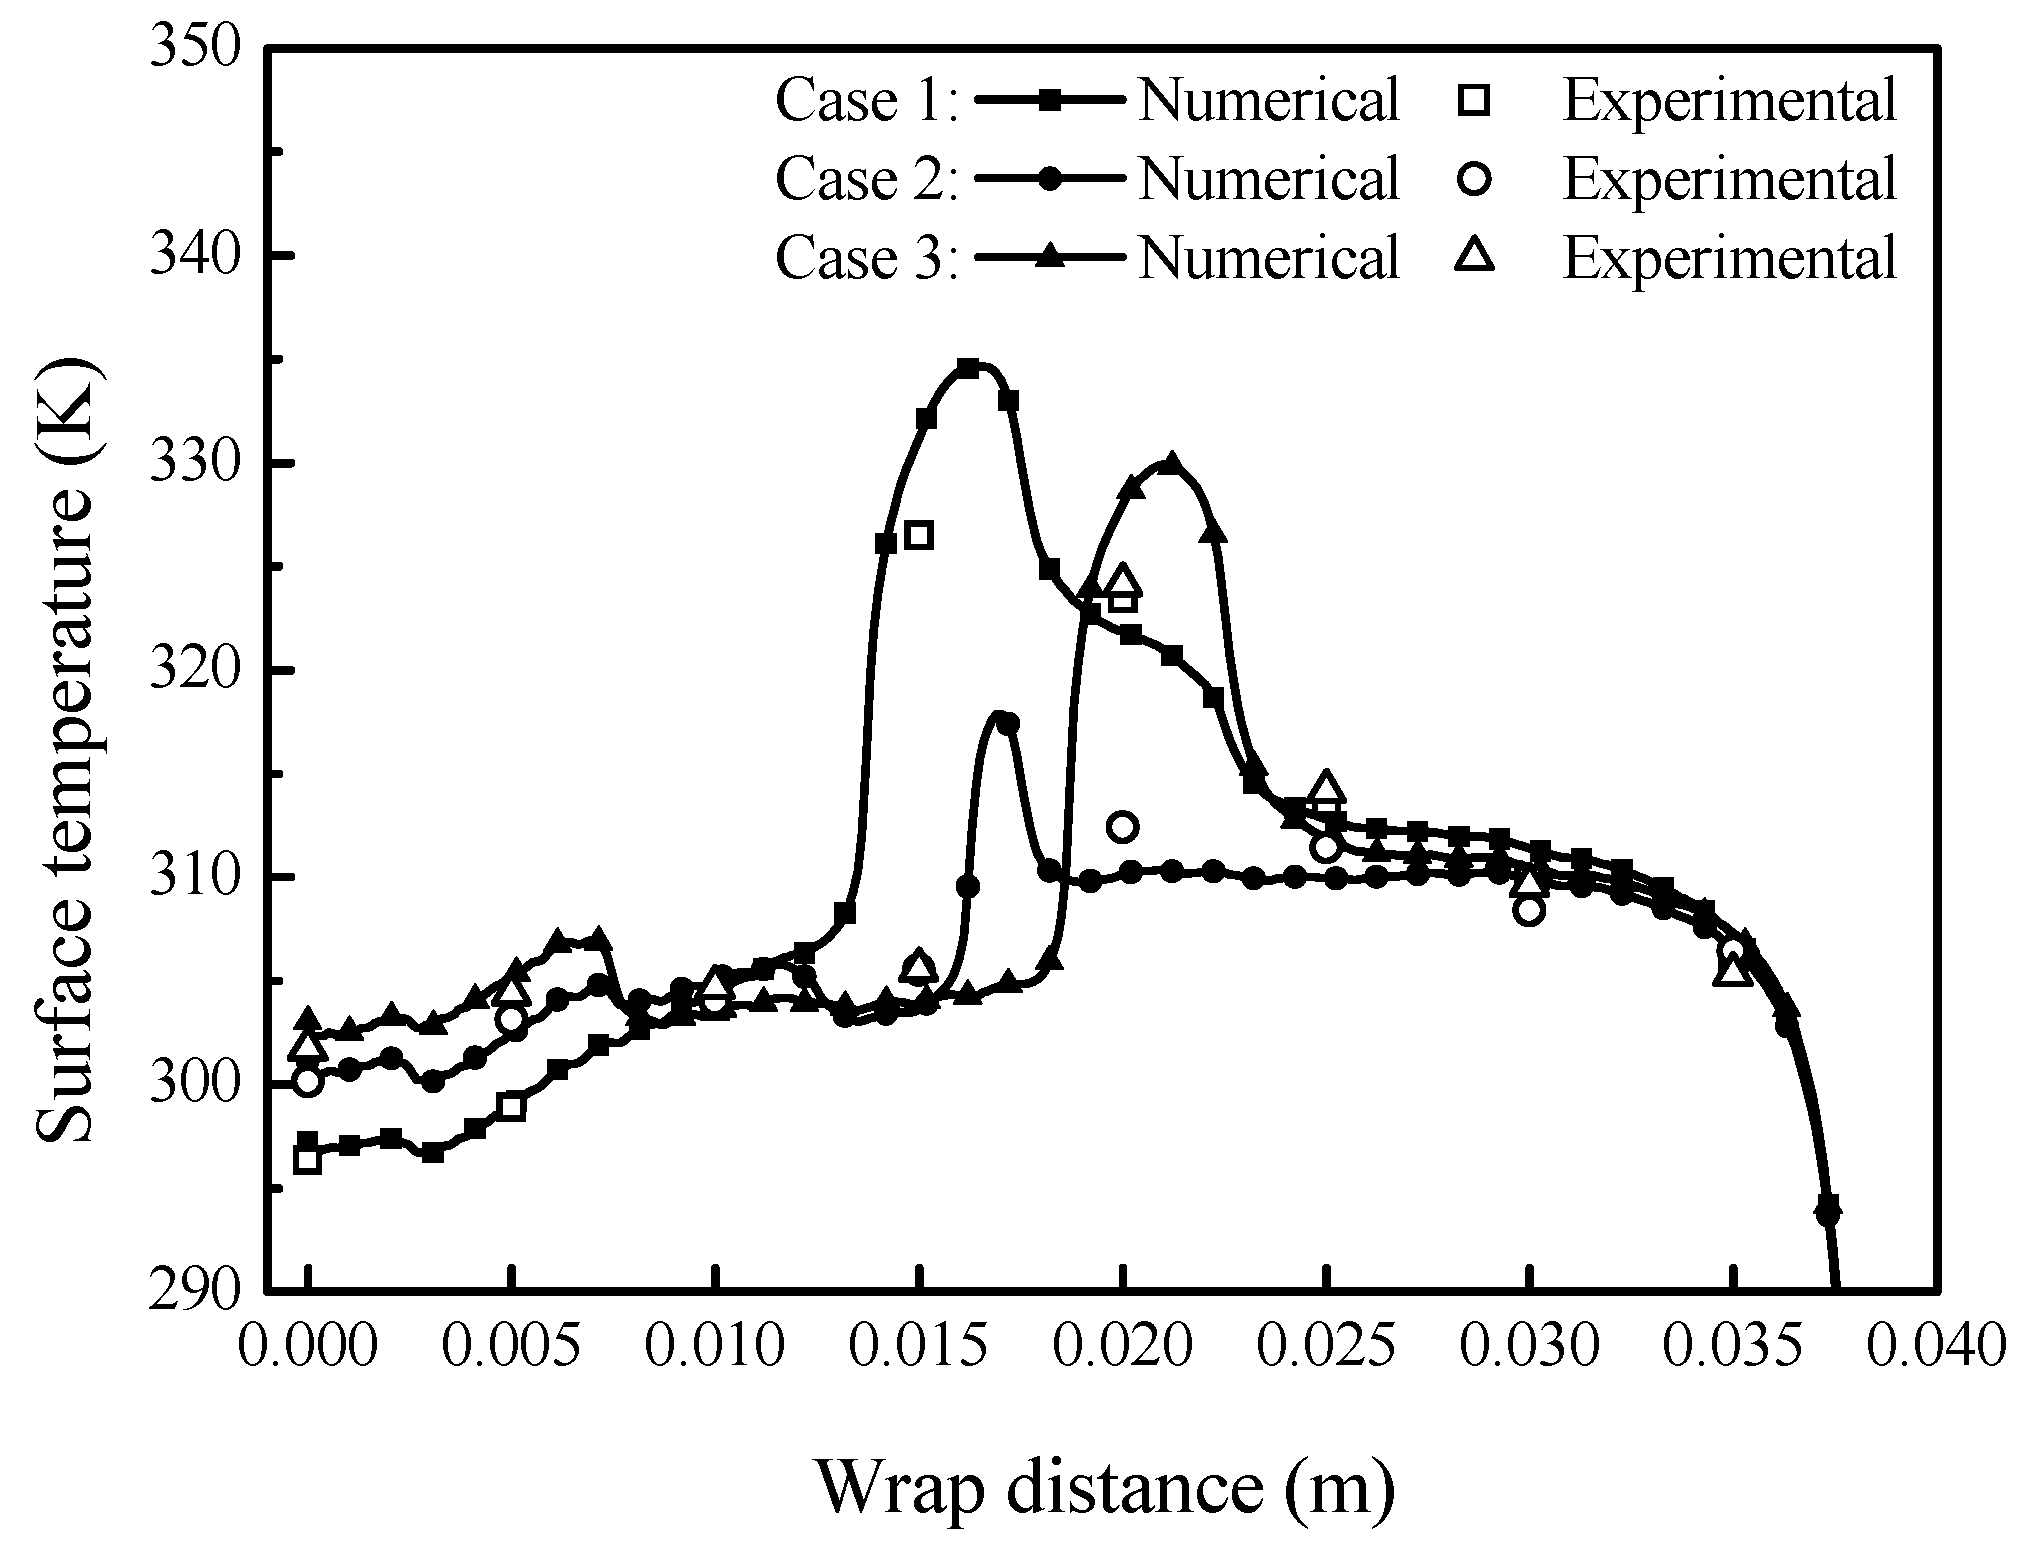
The heating power distributions used for the surface temperature validation are listed in Table 4. Figure 11 displays the numerical and experimental results of surface temperature distributions. As can be seen, the surface temperature distributions had humps in the middle of the protected area, which was caused by completely evaporating the runback water. There were small discrepancies between the experimental and numerical results in the low-temperature regions, while the differences became larger in the high-temperature regions. This was because the thermal conduction from the main body to the spliced parts of the test model was not considered in the numerical simulation. The maximum error between the numerical and experimental results was about 8.8%, and the average error was about 4.1%, which was acceptable.

4.2. The Optimal Heating Power Distribution

To optimize the heating power distribution, the experiments started with the critical dry surface state which is the boundary between the dry surface mode and the evaporative mode. The dry surface mode was easily accessible in the experiment. Firstly, the heat power distribution was set up at a high level to ensure no runback water within the protected area. Then, from 8# to 1#, the power density of each heating film was reduced as low as possible until the critical dry surface state emerged. Then, the power density of 1# heating film was turned down and the power density of 2# heating film was turned up till the runback water covered 1# heating zone. After that, the power density of 1# and 2# heating films were turned down and the power density of 3# heating film was turned up till the runback water covered 2# heating zone, and so on till the runback water covered the entire protected area. Figure 12 shows the experimental heating power distributions with the runback water covering the different heating zones in each case. The corresponding anti-icing heat loads of the heating power distributions are also displayed in Figure 12. The results show that the anti-icing heat loads had a decreasing tendency as the runback water covered more protected areas. In Case 1, the anti-icing heat load had a minimum value when the runback water covered 4# heating zone and was reduced by 23.8% compared to the initial heating power distribution. In Cases 2 and 3, the anti-icing heat loads had minimum values when the runback water covered 5# heating zones and were reduced by 19.6% and 18.6%, respectively, compared to the initial heating power distributions. It can be seen from Table 2 and Figure 10 that the water droplet impinging limit of Case 1 was located in 4# heating zone while the water droplet impinging limits of Cases 2 and 3 were located in 5# heating zones. This indicates that the anti-icing heat load can be reduced to a minimum value as the runback water reaches the water droplet impinging limit.
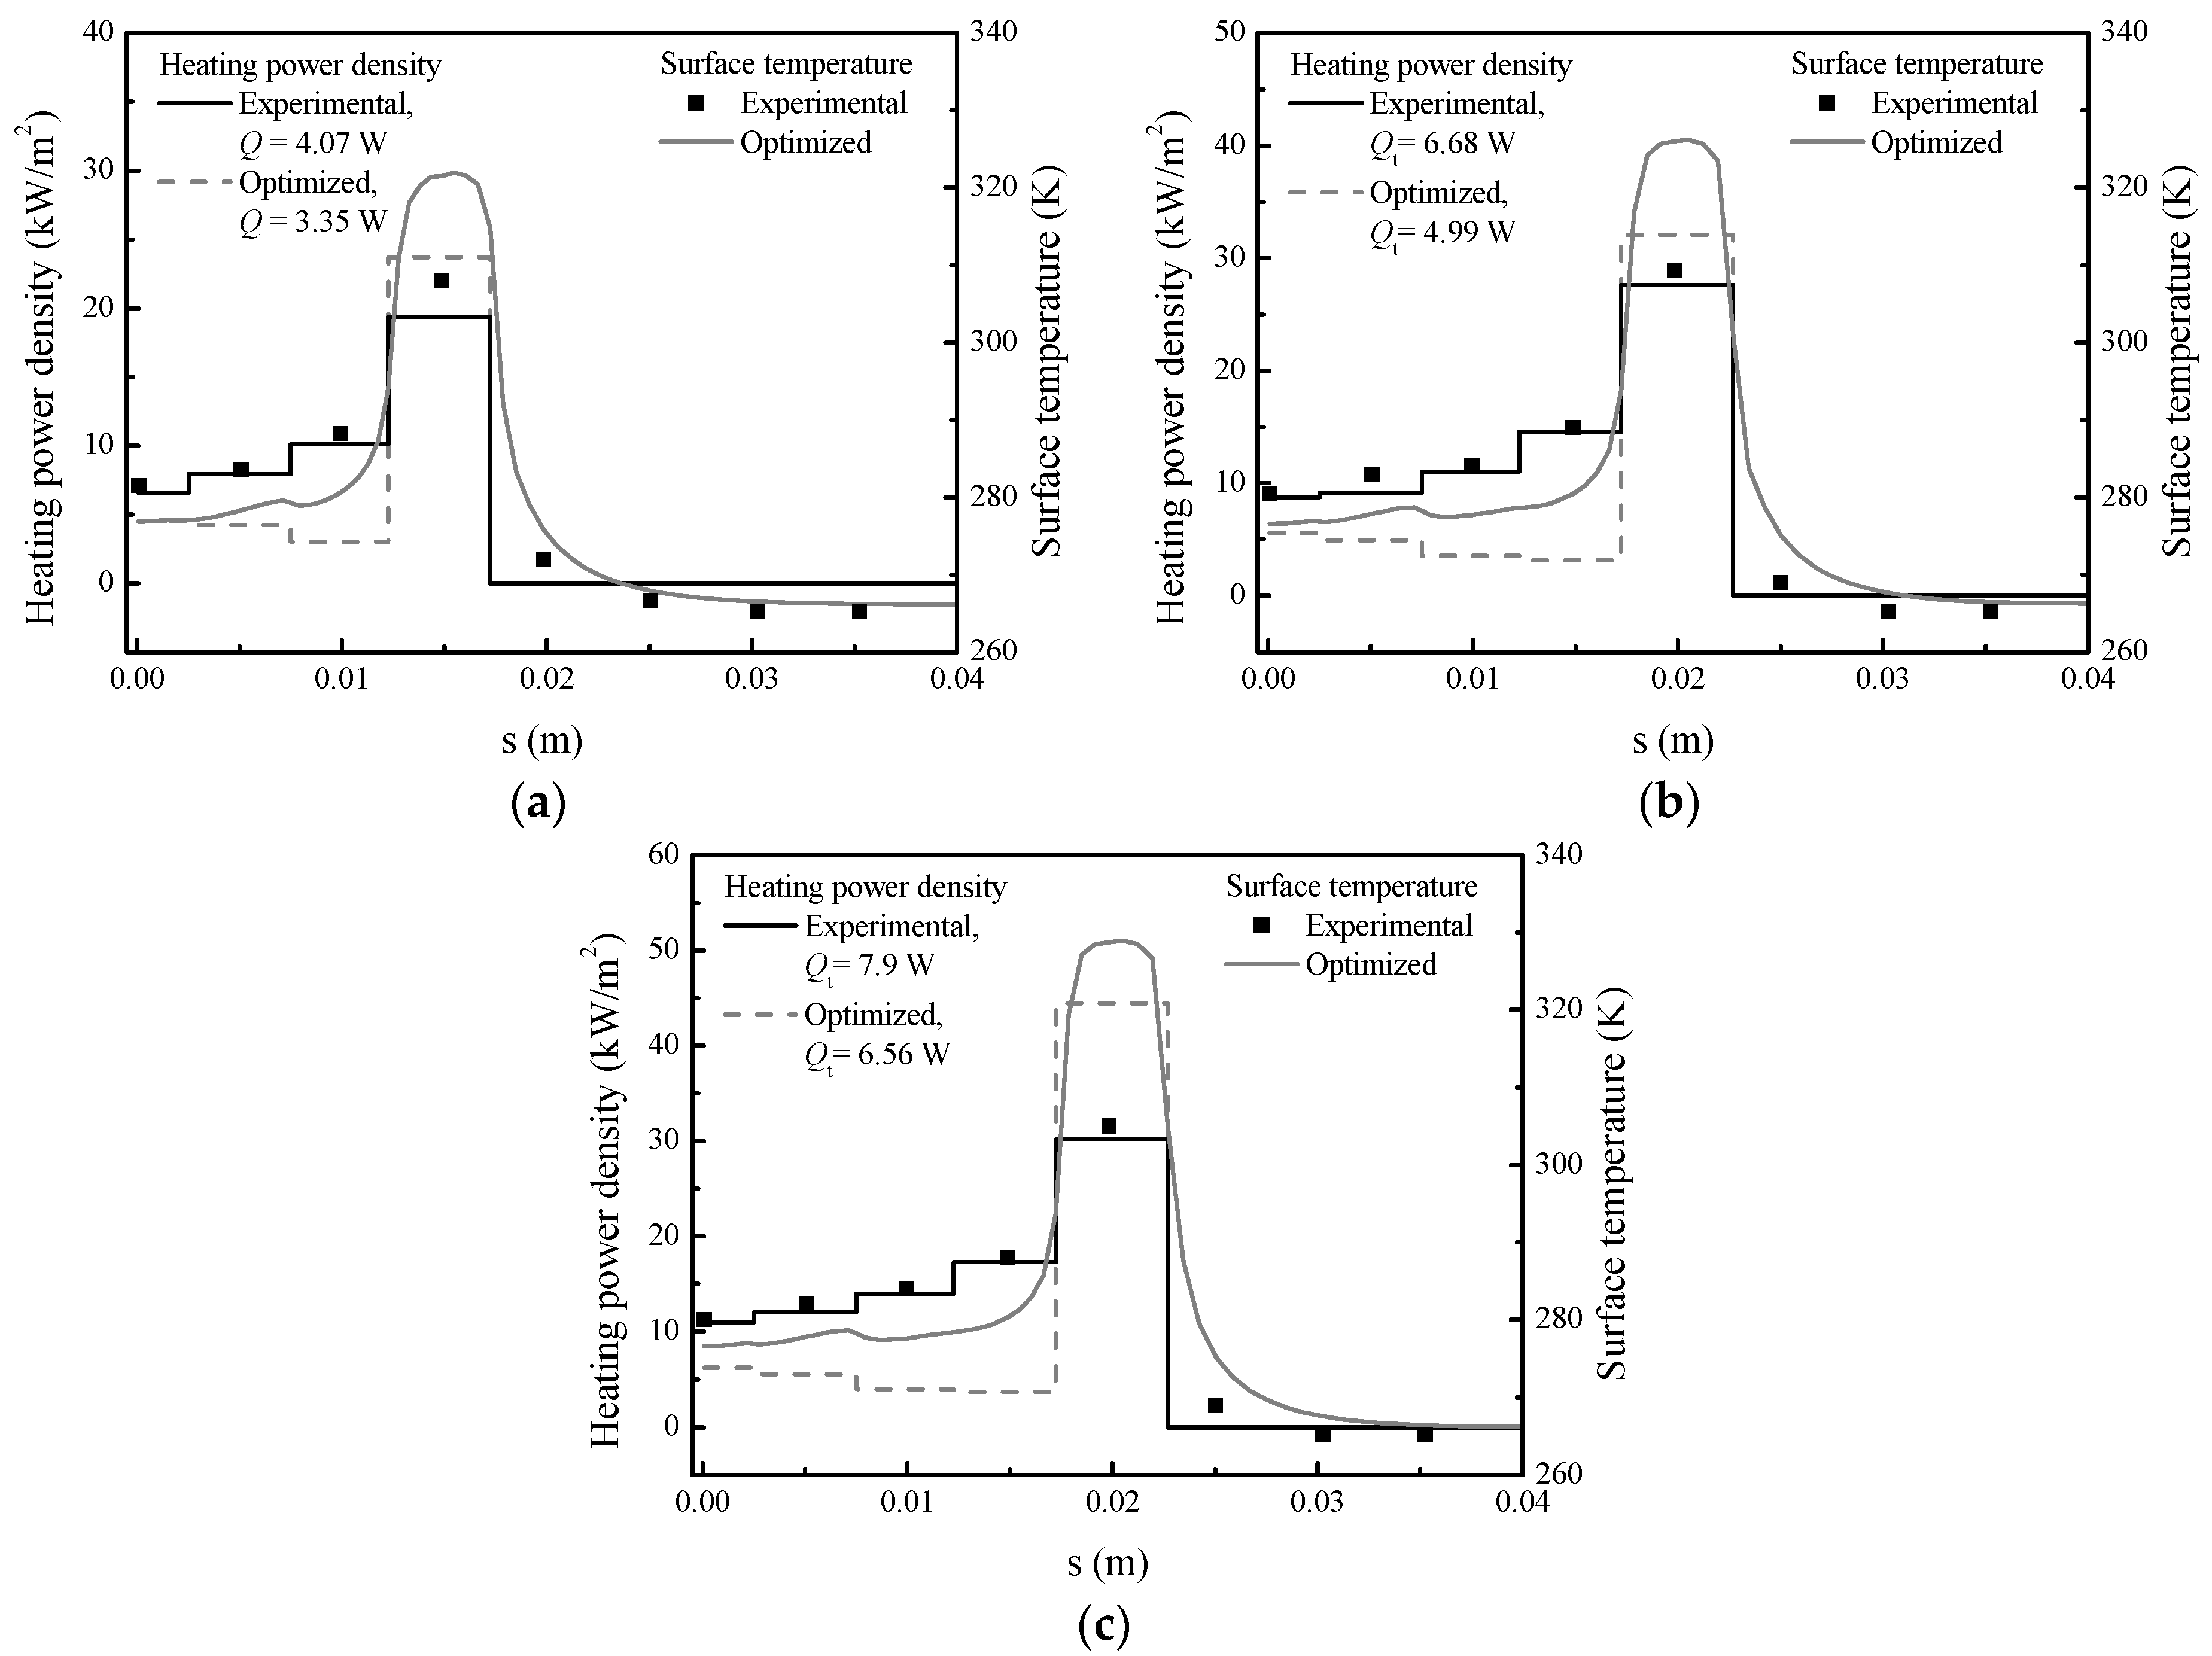
Considering that the PMMA has a poor temperature tolerance among the materials of the test model, the maximum temperature in Equation (15) is set to be 353 K [42]. The comparison of the optimized and the experimental results are displayed in Figure 13. The optimal heating power distributions of the optimization and the experiment were generally consistent in the trends, which were both low at the leading edge, high at the water droplet impinging limit and zero at the end of the protected area. The anti-icing heat loads in the experiment were a little larger than those in the optimization because of the differences of the heating power distributions at the leading edge and the impinging limit. The difference between the optimizations and the experiments in the heating power distribution is that the experimental results are higher at the leading edge and lower at the water droplet impinging limit. As a matter of fact, during the experiment, when the heating power density at the leading edge was reduced excessively, the runback water film became unstable and easily turned into the rivulets, which failed the ice protection. However, the numerical simulation did not consider this process, which made the differences in the anti-icing heat load as well as the surface temperature.

4.3. Mechanism of the Anti-Icing Heat Load Reduction

According to the results of the optimization and the experiments, the optimal heating power distribution has such a characteristic that is low at the leading edge, high at the water droplet impinging limit and zero at the end of the protected area. This tendency can lead to a less anti-icing heat load. To find out the mechanism behind this consequence, it is necessary to figure out the composition of the anti-icing heat load. Integrating the control volume within the protected area, Equation (2) can be written as:
A q n d x = A ( q evap + q conv q w q a ) d x + A ( Q w , in Q w , out )
where A refers to the protected area. The third term in Equation (16) should be zero because neither the inflow enthalpy nor the outflow enthalpy exists in the evaporative mode, except the enthalpy of water droplet impingement. According to References [24] and [31], q w and q a are usually much smaller than the others, which can also be neglected. Therefore, Equation (16) can be simplified as:
A q n d x = A q evap d x + A q conv d x
or
Q t = Q evap + Q conv
where Q t is the total anti-icing heat load, Q evap is the evaporative heat load and Q conv is the convective heat load.
It follows that the anti-icing heat load is mainly composed of the evaporative and convective heat loads. As can be seen from Equation (10), Q evap includes both the latent part and the sensible part. In the evaporative mode, supposing the thermal anti-icing system operates in a stable environment, the total amount of the collected water droplets remains constant. Consequently, Q evap does not change much even under different heating power distributions. As a result, the reduction in the anti-icing heat load can only be the decrease in Q conv . It is well known that Q conv is influenced by the heating range, the surface temperature as well as the convective heat transfer coefficient. Analyzing the influences of these factors is conducive to reveal the mechanism of the anti-icing heat load reduction.

4.3.1. Heating Range

The anti-icing heat loads reached the minimum value as the runback water exactly covered the water droplet impinging limit as shown in Figure 12. It indicates that the heating range is important to the anti-icing heat load reduction. To better investigate its influence, a uniform heating power distribution was experimentally tested. In this experiment, only the wet area covered by the runback water was heated, and the dry area was not heated. Hence, the heating range can be represented by the runback water length. Additionally, when the runback water length was less than the water droplet impinging limit, the heating range was fixed at the limit.
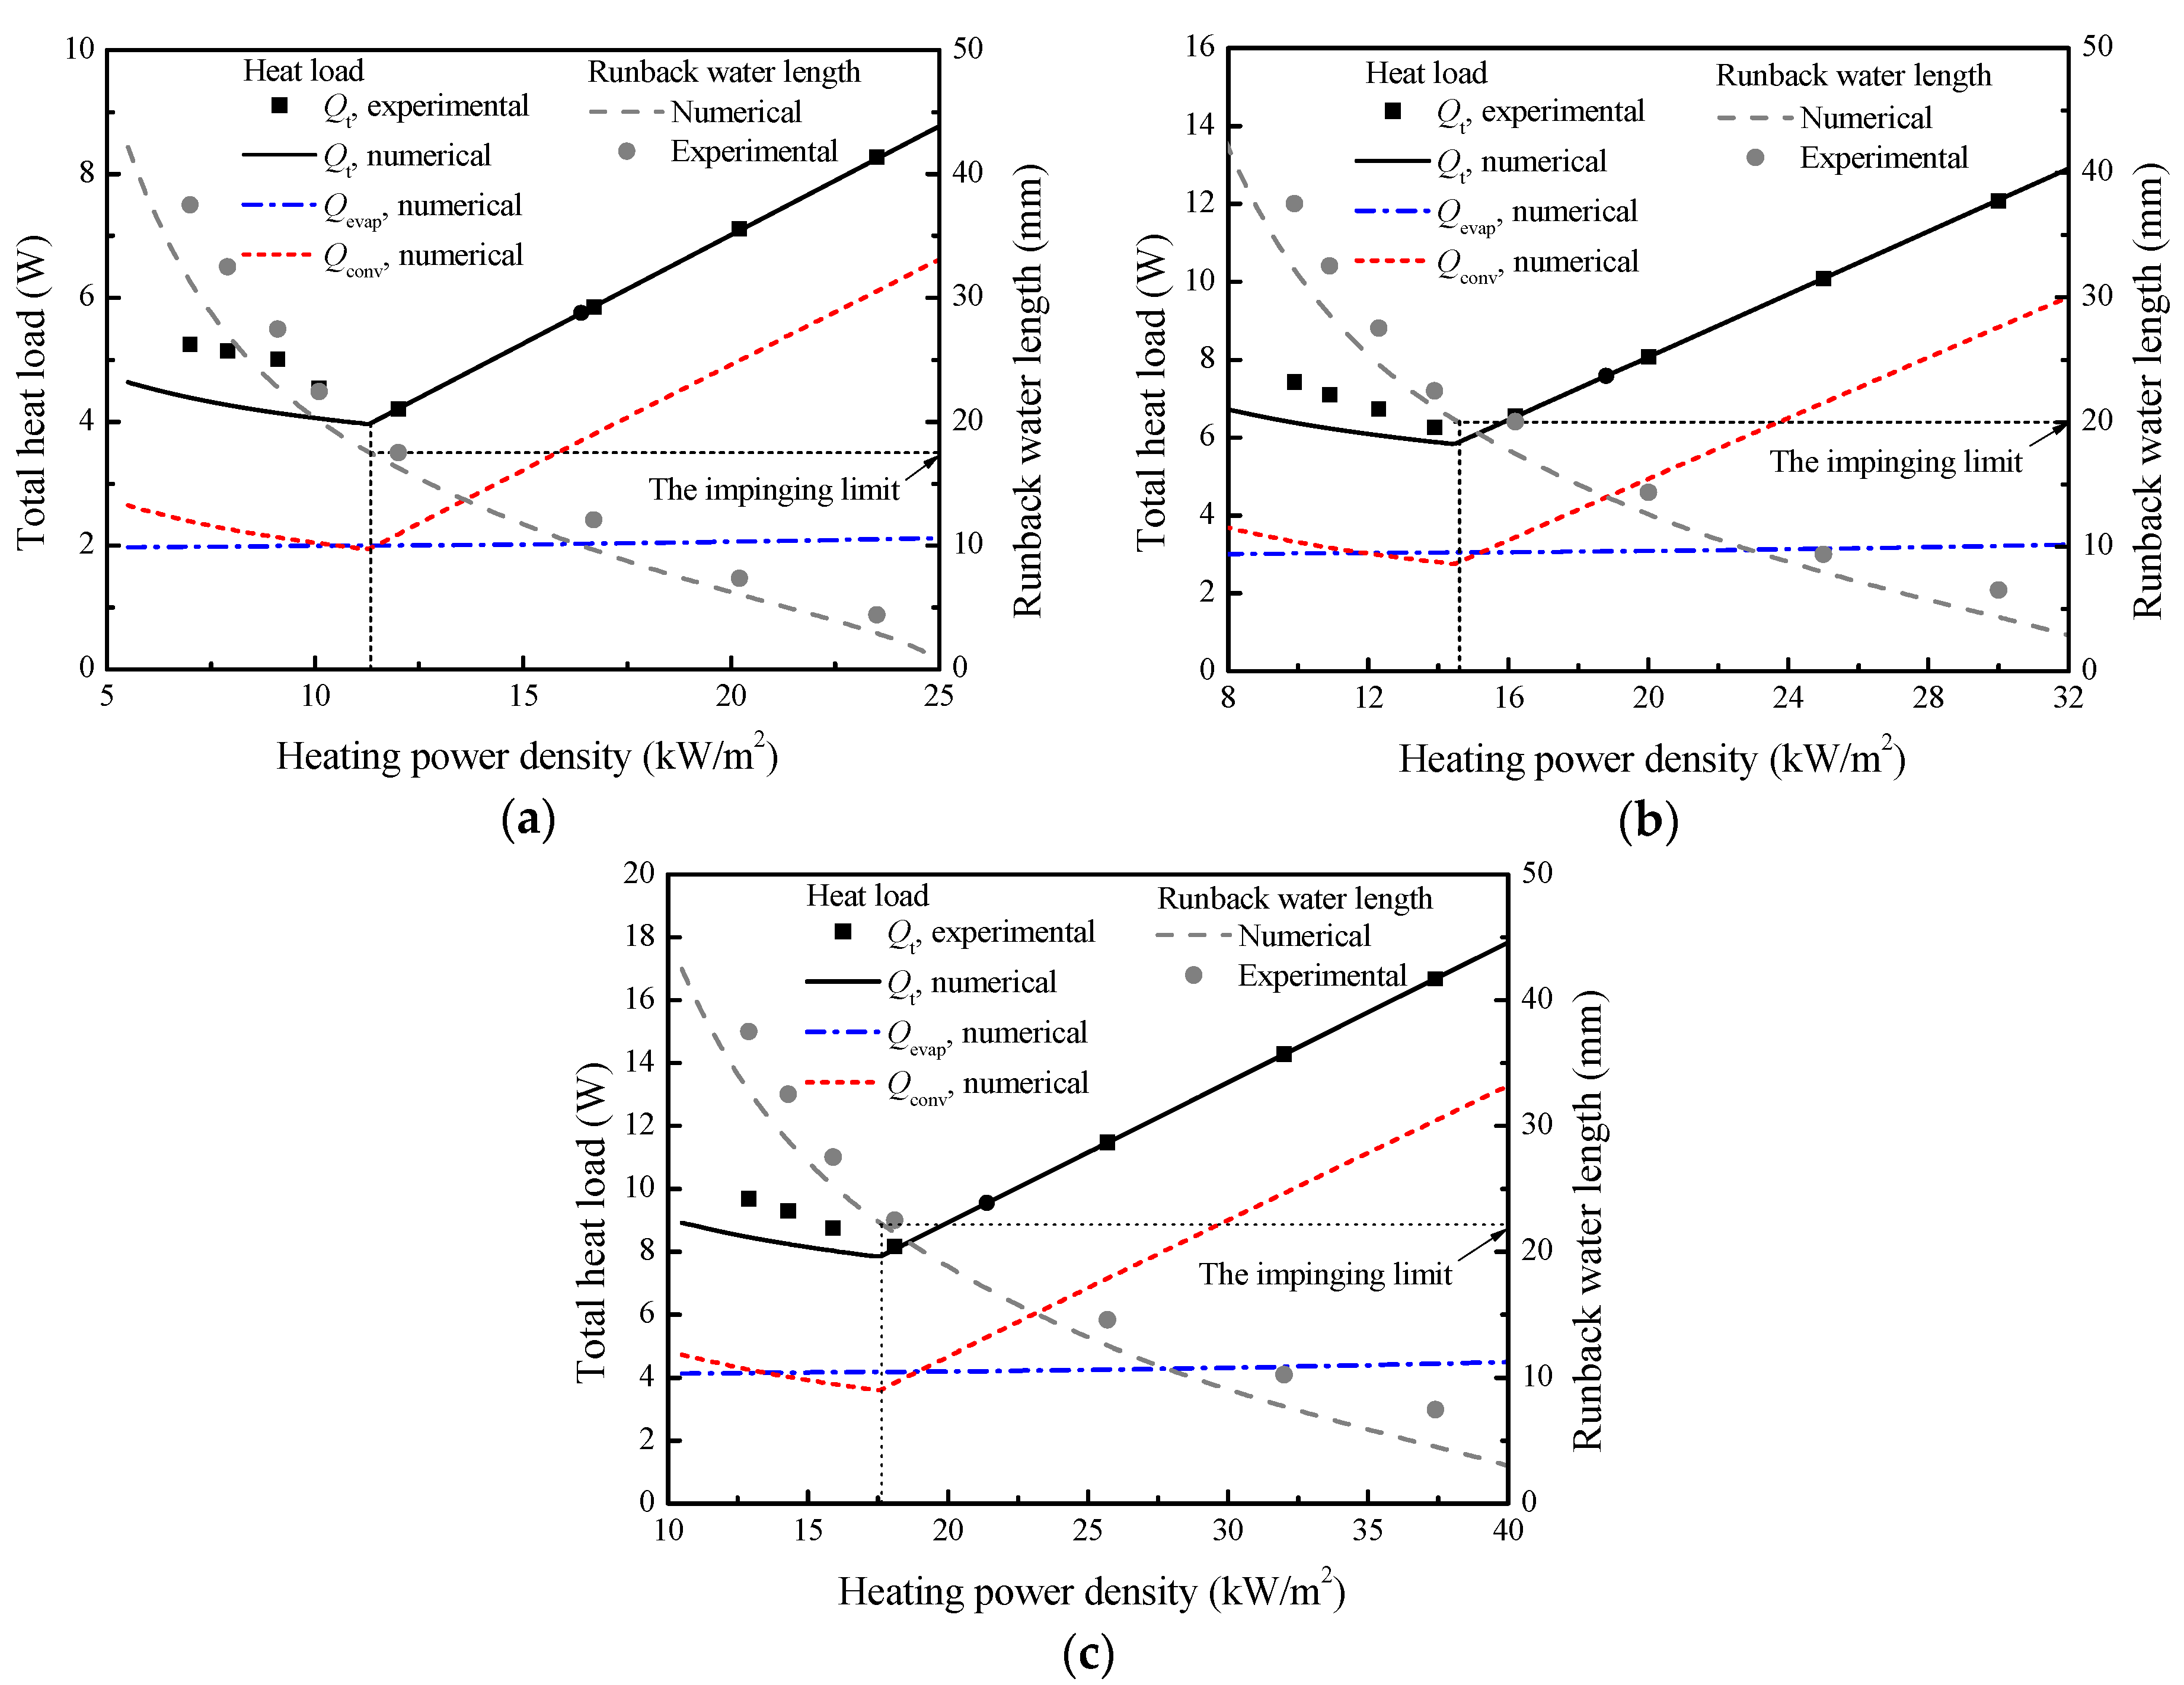
The experimental and the numerical results are displayed in Figure 14, which presents the relationship between the anti-icing heat load and the range of the runback water length. As can be seen, both the experimental and the numerical anti-icing heat loads had minimum values as the runback water lengths were at the water droplet impinging limits. The evaporative heat loads barely change with the heating power density. The trend of the convective heat load is similar to the anti-icing heat load, which has an inflection point corresponding to the impinging limit. This can be explained in two aspects. On one hand, when the heating power density was higher than the value at the impinging limit, the runback water length decrease. However, the heating range was fixed at the impinging limit, so the anti-icing heat load increased. On the other hand, when the heating power density was lower than the value at the impinging limit, both the runback water length and the heating range increased, as did the anti-icing heat load. Therefore, decreasing the heating range outside the water droplet impinging limit can effectively reduce the anti-icing heat load. As the heating range is equal to the impinging limit, the anti-icing heat load is the minimum.

4.3.2. Surface Temperature

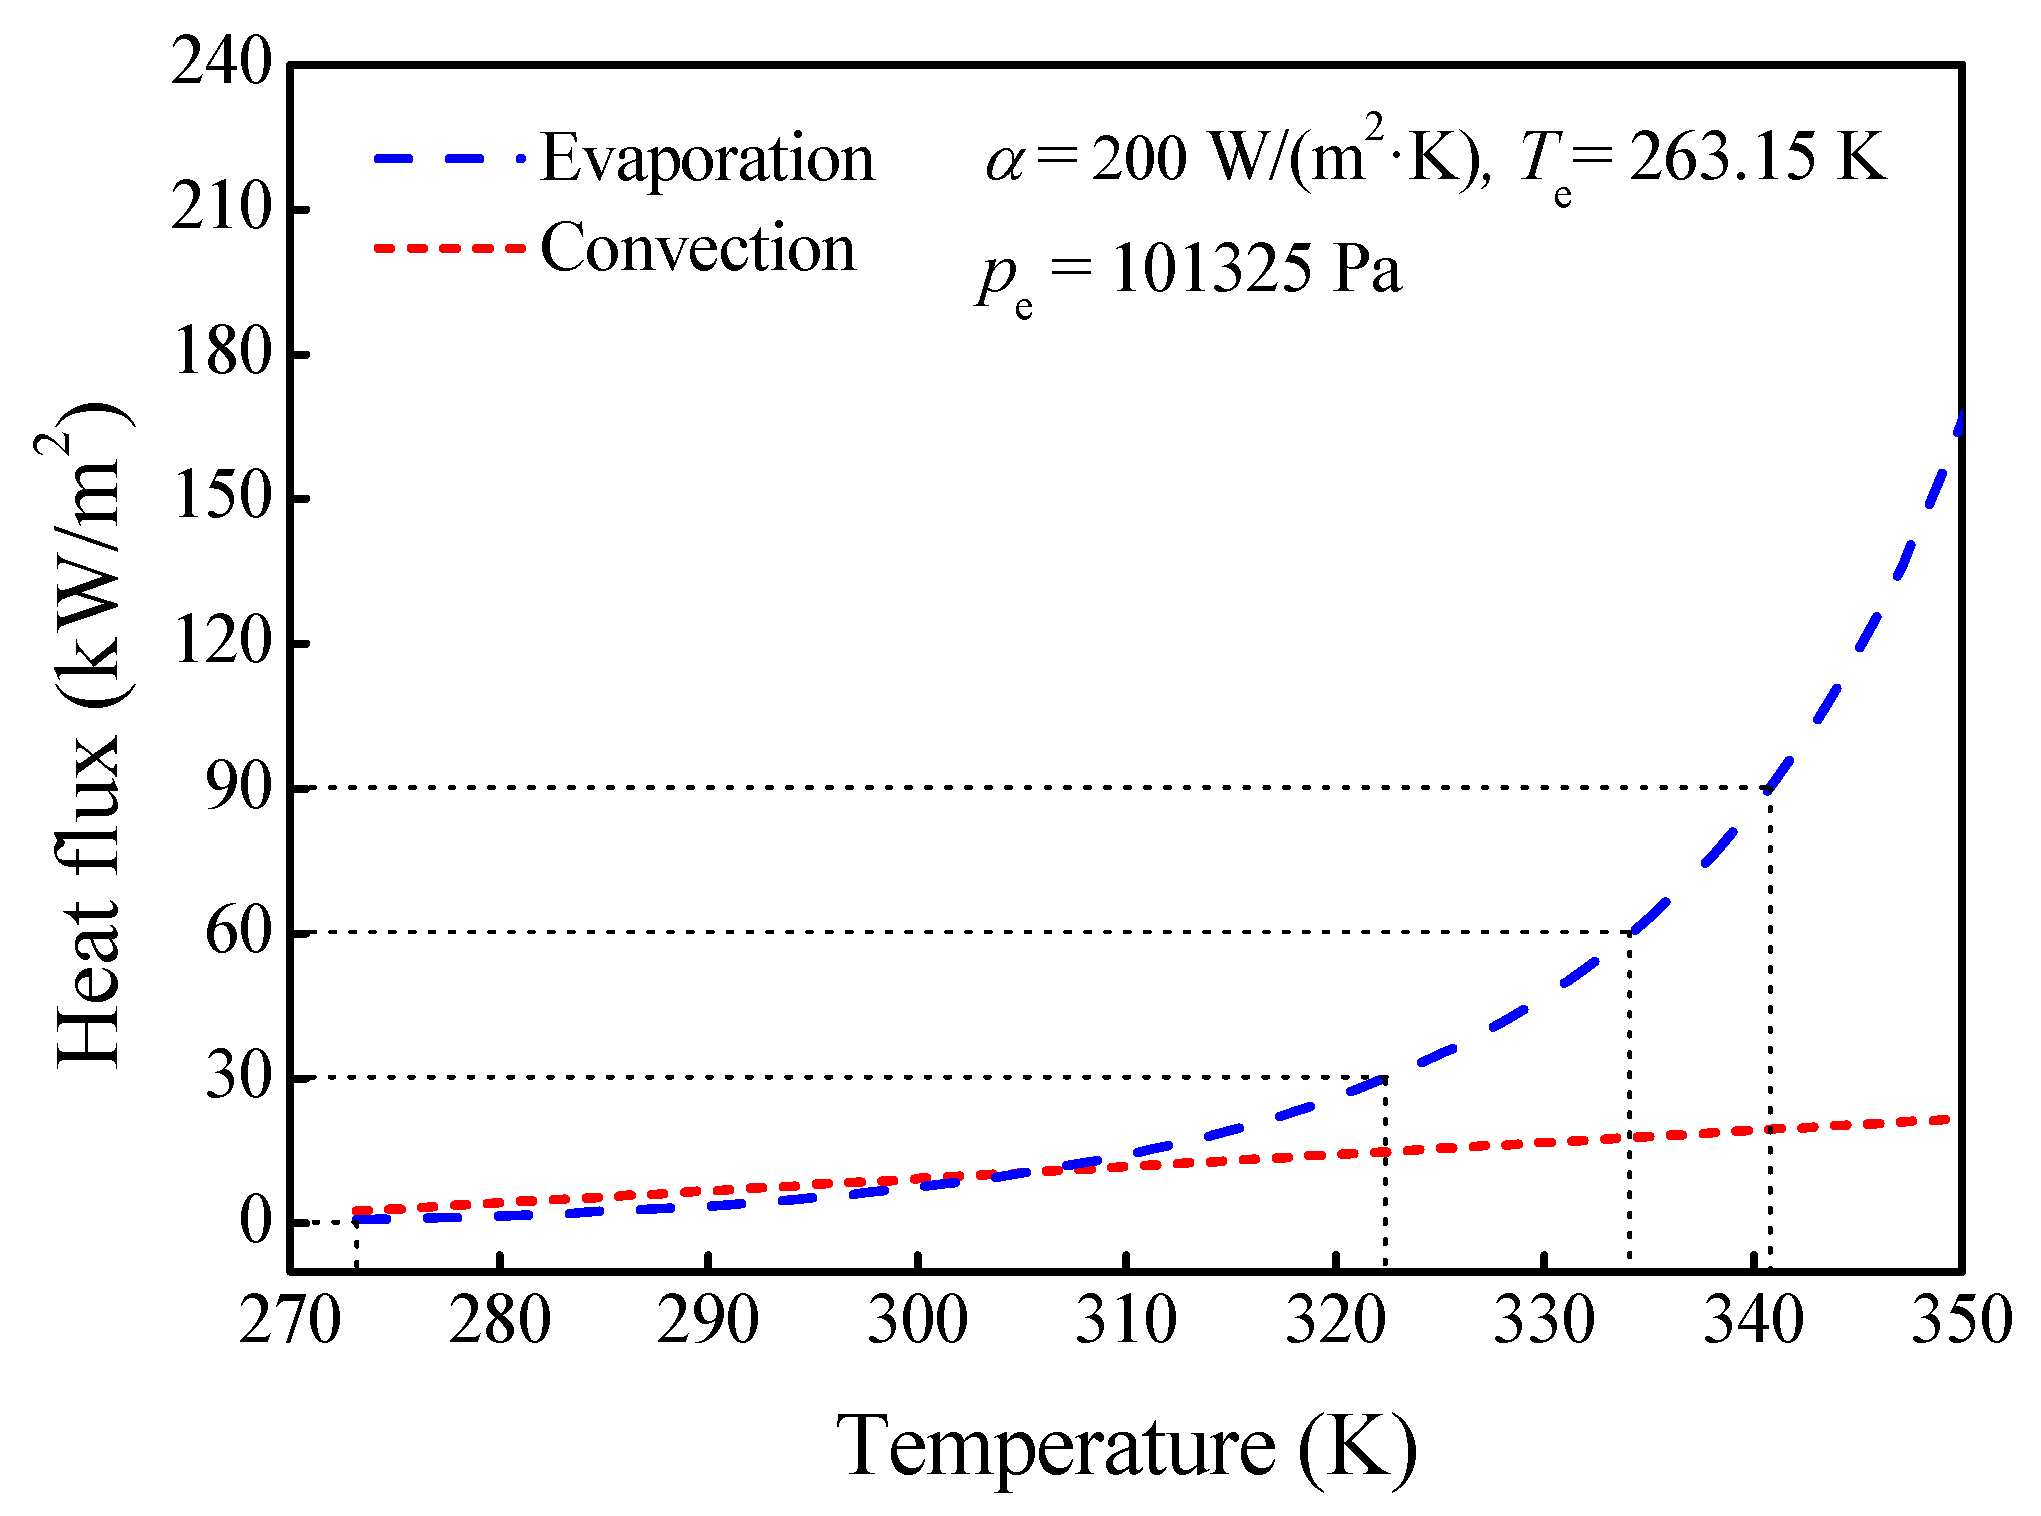
Figure 15 displays the surface temperature distributions and the proportions of the convection and evaporation under the optimal heating power distributions. As can be seen, the evaporation has a higher proportion in the high-temperature regions, while the convection has a higher proportion in the low-temperature regions. This suggests that the temperature has different impacts on convection and evaporation. To better illustrate the influences of the surface temperature, the following parameters are selected as representative values: α = 200 W/(m2·K), Te = 263.15 K, pe = 101.325 kPa. The changes in the evaporative and convective heat fluxes with the surface temperature are displayed in Figure 16. Noted that the evaporative heat flux can directly denote the evaporative mass transfer of the runback water according to Equation (10). According to Equations (4), (5), (10) and (11), the convective heat flux has a linear relationship while the evaporative heat flux has an exponential relationship with the surface temperature. As can be seen, when the same amount of water is evaporated simultaneously at both high and low temperatures, the temperature rise required in the high-temperature region is less than that in the low-temperature region. Moreover, the additional convective heat flux rise in the high-temperature region is less than that in the low-temperature region. For instance, as the evaporative heat flux increases from 0 to 30 kW/m2, the temperature will have an increment of about 49 K. However, as the evaporative heat flux increases from 60 to 90 kW/m2, the temperature rise is less than 10 K, which leads to a significant reduction in the convective heat load. Therefore, evaporating most runback water in the high-temperature region can surely reduce the convective heat load.

4.3.3. Convective Heat Transfer Coefficient

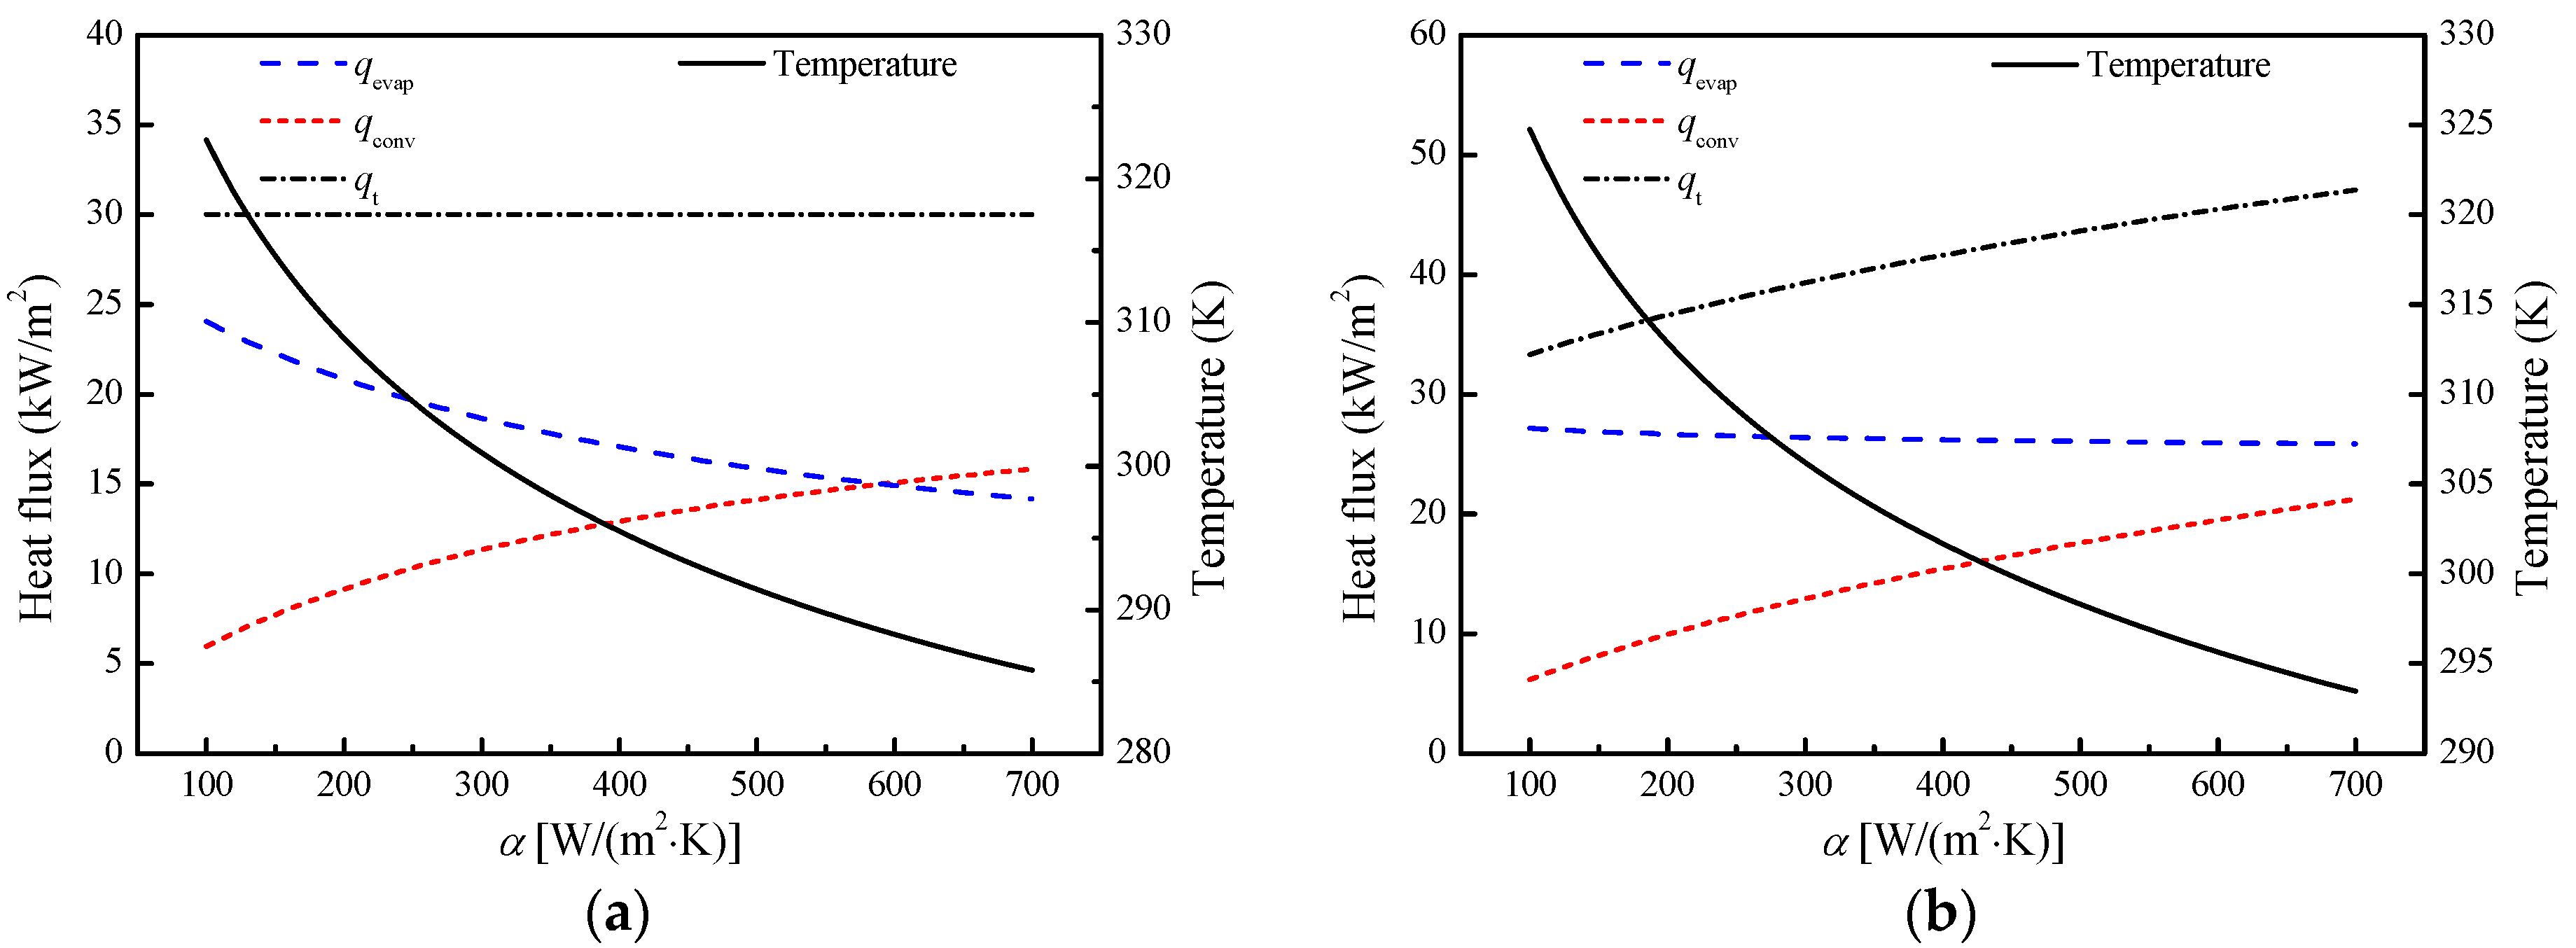
The surface temperature distribution is not only influenced by the heating power distribution, but also by the characteristics of the convective heat transfer. Supposed that a constant heating power density of 30 kW/m2 is provided within the protected area, Te and pe are selected as representative values: Te = 263.15 K, pe = 101.325 kPa. According to Equations (10), (11) and (18), the changes of qevap and qconv as well as the surface temperature with the convective heat transfer coefficient are displayed in Figure 17a. As can be seen with the increase in the convective heat transfer coefficient, qconv tends to increase, while the surface temperature tends to decrease, so does qevap. The results show that qevap has a higher proportion in the region with the small convective heat transfer coefficient, while qconv has a higher proportion in the region with the large convective heat transfer coefficient.
Given the constant mass flow rate of the evaporation, of which m ˙ evap is equal to 0.01 kg/(m2·s), the changes of qevap and qconv, as well as the surface temperature with the convective heat transfer coefficient, are displayed in Figure 17b. As can be seen with the increase in the convective heat transfer coefficient, qconv tends to increase, while the surface temperature tends to decrease. However, due to constant m ˙ evap , the heating power density tends to increase. The results show that, when evaporating the same amount of water, the anti-icing heat load in the region with the small convective heat transfer coefficient is smaller than that in the region with the large convective heat transfer coefficient.
According to the influence of the surface temperature, evaporating the runback water in the high-temperature region can reduce the anti-icing heat load. The surface temperature can easily be raised in the region with the small convective heat transfer coefficient. For the flow field around the airfoil surface, the convective heat transfer coefficient is always large in the vicinity of the leading edge and small at the end of the protected area, due to the increase in the boundary layer thickness and the turbulence. The trend of the optimal heating power distribution is opposite to that of the convective heat transfer coefficient. Thus, the anti-icing heat load can be reduced.

5. Conclusions

In this paper, the optimal heating power distribution that leads to the less anti-icing heat load in the evaporative mode was investigated both in the numerical optimization and the experiment. By analyzing the influences of the key factors on the convective heat load, the mechanism of the anti-icing heat load reduction was revealed.
(1)
The reduction in the anti-icing heat load is the decrease in the convective heat load. As the thermal anti-icing system operating in the evaporative mode, the evaporative heat load keeps nearly constant. The convective heat load can be varied with the surface temperature distribution which is influenced by the heating power distribution. Thus, there must be an optimal heating power distribution that can reduce the convective heat load as well as the anti-icing heat load.
(2)
The optimal heating power density obtained by the numerical optimization and the experiment has such characteristics that are low at the leading edge, high at the water droplet impinging limit and zero at the end of the protected area. These characteristics are mainly influenced by the heating range, the surface temperature and the convective heat transfer coefficient. In the evaporative mode, decreasing the heating range outside the protected area can reduce the anti-icing heat load effectively. As the heating range is decreased to the impinging limit, the anti-icing heat load has the minimum value. Due to the different impacts of the surface temperature on the evaporative and convective heat fluxes, it is better to evaporate the runback water in the high-temperature region, which can lead to a lesser additional convective heat load. The surface temperature distribution is affected by the convective heat transfer coefficient distribution of which the trend is high at the leading edge and decreases chordwise around the airfoil surface. As a consequence, the optimal heating power distribution has the opposite trend with the convective heat transfer coefficient distribution.
The present investigations on the mechanism of the anti-icing heat load reduction can provide valuable guidance for the design of the thermal anti-icing system, which can be used for wings, stabilizers and engine inlets of the aircraft as well as wind blades and cowlings of the wind turbines, or any component that has an aerodynamic profile. The configuration of the thermal anti-icing system can be improved according to the presented results, which can achieve the purpose of saving energy and reducing weight. However, the results obtained in this paper have certain limitations. Considering the anti-icing requirement in practical applications, the margins of both the anti-icing heat load and the protected area ought to be increased appropriately, and extra constraints such as maximum heating power density should also be taken into consideration.

Author Contributions

Conceptualization, R.L. and D.Z.; Methodology, R.L.; Software, R.L.; Validation, R.L. and G.Z.; Formal Analysis, R.L.; Investigation, R.L.; Resources, D.Z.; Data Curation, R.L.; Writing—Original Draft Preparation, R.L.; Writing—Review and Editing, G.Z. and D.Z.; Visualization, R.L.; Supervision, D.Z.; Project Administration, D.Z.; Funding Acquisition, D.Z. All authors have read and agreed to the published version of the manuscript

Funding

This research received no external funding.

Acknowledgments

The authors are grateful to Guangya Zhu and Qihang Lu for proofreading this manuscript.

Conflicts of Interest

The authors declare no conflict of interest.

References

  1. Green, S. A Study of U.S. Inflight Icing Accidents and Incidents, 1978 to 2002. In Proceedings of the 44th AIAA Aerospace Sciences Meeting and Exhibit, Reno, NV, USA,, 9–12 January 2006. AIAA-2006-82. [Google Scholar]
  2. Thomas, S.K.; Cassoni, R.P.; MacArthur, C.D. Aircraft anti-icing and de-icing techniques and modeling. J. Aircr. 1996, 33, 841–854. [Google Scholar] [CrossRef]
  3. Cronin, M. The prospects and potential of all electric aircraft. Aircraft Design. In Proceedings of the Systems and Technology Meeting, Fort Worth, TX, USA, 17–19 October 1983. AIAA-83-2478. [Google Scholar]
  4. Ingram, C.; Dendinger, T.; Inclan, E.; Charront, Y.; Handschuh, K.; Chakraborty, I.; García, E.; Mavris, D.N. Integrating Subsystem Sizing into the More Electric Aircraft Conceptual Design Phase. In Proceedings of the 53rd AIAA Aerospace Sciences Meeting, Kissimmee, FL, USA, 5–9 January 2015. AIAA-2015-1682. [Google Scholar]
  5. Chakraborty, I.; Ozcan, M.F.; Mavris, D.N. Effect of Major Subsystem Power Off-takes on Aircraft Performance in More Electric Aircraft Architectures. In Proceedings of the 15th AIAA Aviation Technology, Integration, and Operations Conference, Dallas, TX, USA, 22–26 January 2015. AIAA-2015-3287. [Google Scholar]
  6. Gandolfi, R.; Pellegrini, L.; De Oliveira, S. More Electric Aircraft Analysis Using Exergy as a Design Comparison Tool. In Proceedings of the 48th AIAA Aerospace Sciences Meeting Including the New Horizons Forum and Aerospace Exposition, Orlando, FL, USA, 4–7 January 2010. AIAA 2010-809. [Google Scholar]
  7. Ensign, T.; Gallman, J. Energy Optimized Equipment Systems for General Aviation Jets. In Proceedings of the 44th Aerospace Sciences Meeting and Exhibit, Reno, NV, USA, 9–12 January 2006. AIAA 2006-228. [Google Scholar]
  8. Wang, P.; Wei, W.; Li, Z.; Duan, W.; Han, H.; Xie, Q. A superhydrophobic fluorinated PDMS composite as a wearable strain sensor with excellent mechanical robustness and liquid impalement resistance. J. Mater. Chem. A 2020, 8, 3509–3516. [Google Scholar] [CrossRef]
  9. He, Z.; Zhuo, Y.; Wang, F.; He, J.; Zhang, Z. Design and preparation of icephobic PDMS-based coatings by introducing an aqueous lubricating layer and macro-crack initiators at the ice-substrate interface. Prog. Org. Coat. 2020, 147, 105737. [Google Scholar] [CrossRef]
  10. Brassard, J.-D.; Laforte, J.-L.; Blackburn, C.; Perron, J.; Sarkar, D.K. Silicone based superhydrophobic coating efficient to reduce ice adhesion and accumulation on aluminum under offshore arctic conditions. Ocean. Eng. 2017, 144, 135–141. [Google Scholar] [CrossRef]
  11. Ma, L.; Wang, J.; Zhao, F.; Wu, D.; Huang, Y.; Zhang, D.; Zhang, Z.; Fu, W.; Li, X.; Fan, Y. Plasmon-mediated photothermal and superhydrophobic TiN-PTFE film for anti-icing/de-icing applications. Compos. Sci. Technol. 2019, 181, 107696. [Google Scholar] [CrossRef]
  12. Lv, J.; Zhu, C.; Qiu, H.; Zhang, J.; Gu, C.; Feng, J. Robust icephobic epoxy coating using maleic anhydride as a crosslinking agent. Prog. Org. Coat. 2020, 142, 105561. [Google Scholar] [CrossRef]
  13. Wang, P.; Yao, T.; Li, Z.; Wei, W.; Xie, Q.; Duan, W.; Han, H. A superhydrophobic/electrothermal synergistically anti-icing strategy based on graphene composite. Compos. Sci. Technol. 2020, 198, 108307. [Google Scholar] [CrossRef]
  14. Silva, G.; Silvares, O.; Zerbini, E.; Hefazi, H.; Chen, H.-H.; Kaups, K. Differential Boundary-Layer Analysis and Runback Water Flow Model Applied to Flow Around Airfoils with Thermal Anti-ice. In Proceedings of the 1st AIAA Atmospheric and Space Environments Conference, San Antonio, TX, USA, 22–25 June 2009. AIAA 2009-3967. [Google Scholar]
  15. Broeren, A.P.; Whalen, E.A.; Busch, G.T.; Bragg, M.B. Aerodynamic Simulation of Runback Ice Accretion. J. Aircr. 2010, 47, 924–939. [Google Scholar] [CrossRef] [Green Version]
  16. Whalen, E.; Broeren, A.; Bragg, M.; Lee, S. Characteristics of Runback Ice Accretions on Airfoils and their Aerodynamics Effects. In Proceedings of the 43rd Aerospace Sciences Meeting and Exhibit, Reno, NV, USA, 10–13 January 2005. AIAA-2005-1065. [Google Scholar]
  17. Alègre, N.; Hammond, D. Experimental Setup for the Study of Runback Ice at Full Scale. J. Aircr. 2011, 48, 1978–1983. [Google Scholar] [CrossRef]
  18. Wright, W.B. User’s Manual for the Improved NASA Lewis Ice Accretion Code LEWICE 1.6; CR-198355; NASA: Washington, DC, USA, 1995.
  19. Wright, W.B. User’s Manual for the NASA Glenn Ice Accretion Code LEWICE Version 2.0; CR-209409; NASA: Washington, DC, USA, 1999.
  20. Morency, F.; Brahimi, T.; Tezok, F.; Paraschivoiu, I. Hot air anti-icing system modelization in the ice prediction code CANICE. In Proceedings of the 36th AIAA Aerospace Sciences Meeting and Exhibit, Reno, NV, USA, 12–15 January 1998. AIAA Paper 1998-0192. [Google Scholar]
  21. Morency, F.; Tezok, F.; Paraschivoiu, I.; Para, F.; Morency, O. Anti-Icing System Simulation Using CANICE. J. Aircr. 1999, 36, 999–1006. [Google Scholar] [CrossRef]
  22. Baruzzi, G.; Tran, P.; Habashi, W.; Narramore, J. Actuator Disk Implementation in FENSAP-ICE, a 3D Navier-Stokes In-Flight Simulation System. In Proceedings of the 41st Aerospace Sciences Meeting and Exhibit, Reno, NV, USA, 6–9 January 2003. AIAA-2003-0619. [Google Scholar]
  23. Morency, F.; Beaugendre, H.; Habashi, W.G. FENSAP-ICE: A study of the effect of ice shapes on droplet impingement. In Proceedings of the 41st Aerospace Sciences Meeting and Exhibit, Reno, NV, USA, 6–9 January 2003. AIAA-2003-1223. [Google Scholar]
  24. Al-Khalil, K.M.; Horvath, C.; Miller, D.R.; Wright, W. Validation of NASA Thermal Ice Protection Computer Codes. Ⅲ –Validation of ANTICE. In Proceedings of the 35th Aerospace Sciences Meeting and Exhibit, Reno, NV, USA, 6–9 January 1997. AIAA 1997-51. [Google Scholar]
  25. Saeed, F.; Paraschivoiu, I. Optimization of a Hot-Air Anti-Icing System. In Proceedings of the 41st Aerospace Sciences Meeting and Exhibit, Reno, NV, USA, 6–9 January 2003. AIAA-2003-0733. [Google Scholar]
  26. Pellissier, M.P.C.; Habashi, W.G.; Pueyo, A. Optimization via FENSAP-ICE of Aircraft Hot-Air Anti-Icing Systems. J. Aircr. 2011, 48, 265–276. [Google Scholar] [CrossRef]
  27. Chen, L.; Zhang, Y.; Wu, Q. Heat transfer optimization and experimental validation of anti-icing component for helicopter rotor. Appl. Eng. 2017, 127, 662–670. [Google Scholar] [CrossRef]
  28. Pourbagian, M.; Habashi, W.G. Surrogate-Based Optimization of Electrothermal Wing Anti-Icing Systems. J. Aircr. 2013, 50, 1555–1563. [Google Scholar] [CrossRef]
  29. Pourbagian, M.; Habashi, W. On Optimal Design of Electro-Thermal In-Flight Ice Protection Systems. In Proceedings of the 5th AIAA Atmospheric and Space Environments Conference, San Diego, CA, USA, 24–27 June 2013. AIAA 2013-2937. [Google Scholar]
  30. Pourbagian, M.; Talgorn, B.; Habashi, W.G.; Kokkolaras, M.; Le Digabel, S. Constrained problem formulations for power optimization of aircraft electro-thermal anti-icing systems. Optim. Eng. 2015, 16, 663–693. [Google Scholar] [CrossRef]
  31. Chang, S.; Zhao, Y.; Yang, B.; Leng, M.; Wang, C. Study on the Minimum Anti-Icing Energy Based on the Icing Limit State. J. Aircr. 2016, 53, 1690–1696. [Google Scholar] [CrossRef]
  32. Messinger, B.L. Equilibrium Temperature of an Unheated Icing Surface as a Function of Air Speed. J. Aeronaut. Sci. 1953, 20, 29–42. [Google Scholar] [CrossRef]
  33. Chen, W. Numerical Simulation of Ice Accretion on Airfoil. Ph.D. Thesis, Nanjing University of Aeronautics and Astronautics, Nanjing, China, 2007. [Google Scholar]
  34. Villalpando, F.; Reggio, M.; Ilinca, A. Prediction of ice accretion and anti-icing heating power on wind turbine blades using standard commercial software. Energy 2016, 114, 1041–1052. [Google Scholar] [CrossRef]
  35. Al-Khalil, K.M. Numerical Simulation of an Aircraft Anti-icing System Incorporating a Rivulet Model for the Runback Water. Ph.D. Thesis, The University of Toledo, Toledo, OH, USA, 1991. [Google Scholar]
  36. Elangovan, R.; Olsen, R. Analysis of Layered Composite Skin Electro-Thermal Anti-Icing System. In Proceedings of the 46th AIAA Aerospace Sciences Meeting and Exhibit, Reno, NV, USA, 7–10 January 2008. AIAA 2008-446. [Google Scholar]
  37. Mivehchi, H.; Varvani-Farahani, A. The effect of temperature on fatigue strength and cumulative fatigure damage of FRP composites. Procedia Eng. 2010, 2, 2011–2020. [Google Scholar] [CrossRef] [Green Version]
  38. National Research Council. Accelerated Aging of Materials and Structures; The National Academies Press: Washington, DC, USA, 1996; pp. 24–25.
  39. Goldberg, D.E. Genetic Algorithms in Search, Optimization, and Machine Learning; Addison-Wesley Professional: Longman, MA, USA, 1989; pp. 55–60. [Google Scholar]
  40. Meng, F. Study on Key Problems in Airfoil Icing Simulation. Ph.D. Thesis, Nanjing University of Aeronautics and Astronautics, Nanjing, China, 2013. [Google Scholar]
  41. Poinsatte, P.E.; Newton, J.E.; De Witt, K.J.; Van Fossen, G.J. Heat transfer measurements from a smooth NACA 0012 airfoil. J. Aircr. 1991, 28, 892–898. [Google Scholar] [CrossRef]
  42. Abdel-Wahab, A.; Ataya, S.; Silberschmidt, V.V. Temperature-dependent mechanical behaviour of PMMA: Experimental analysis and modelling. Polym. Test. 2017, 58, 86–95. [Google Scholar] [CrossRef] [Green Version]
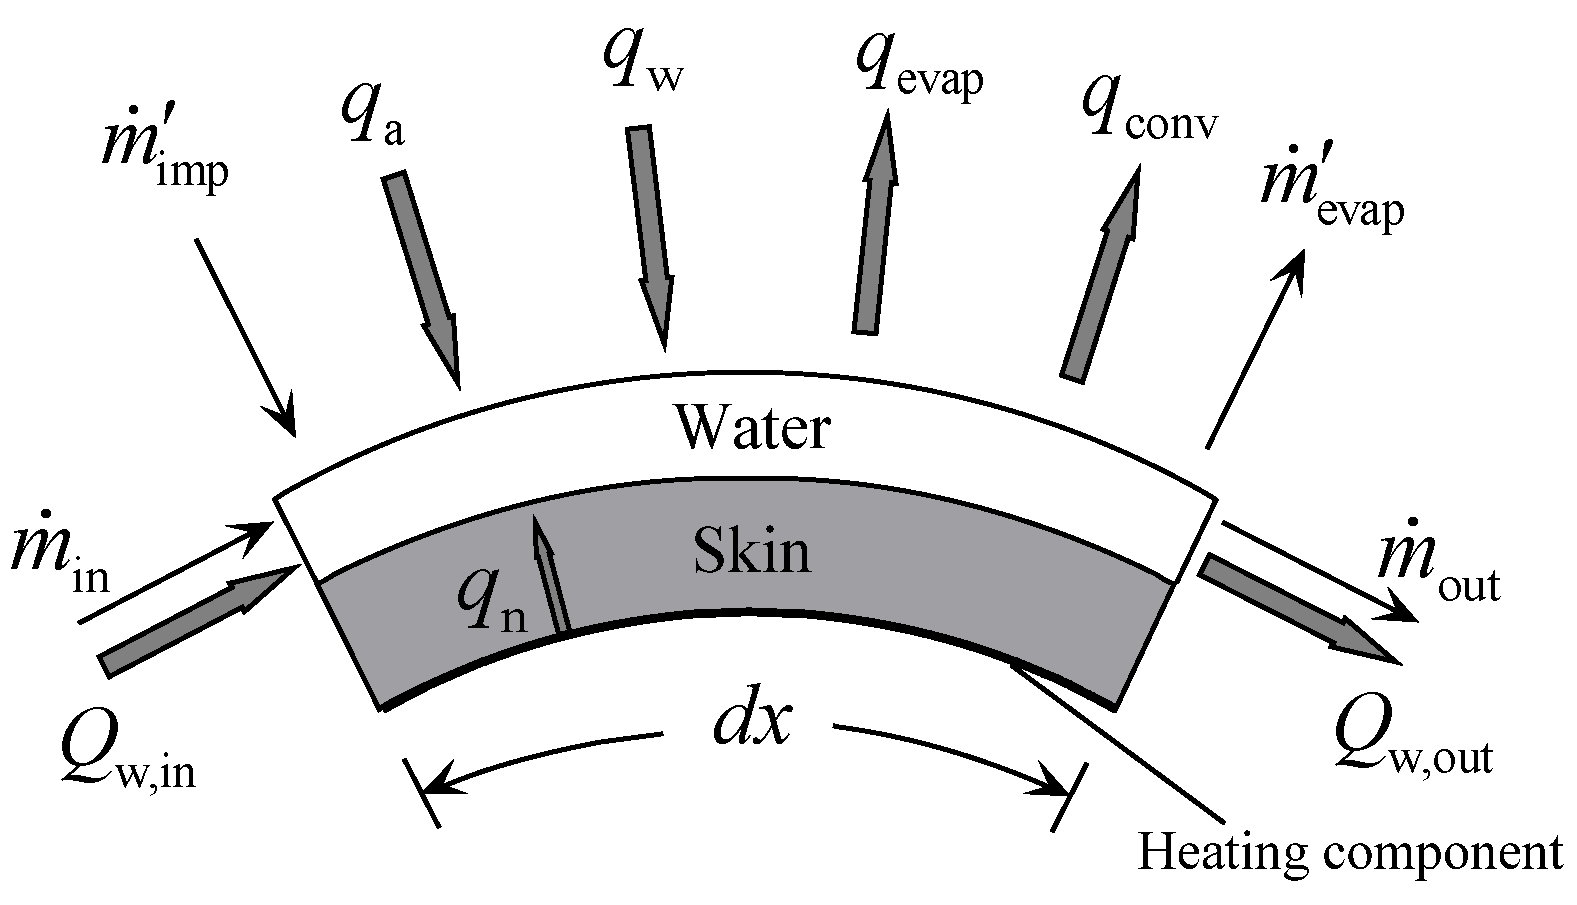
Figure 1. Control volume for the runback water on the airfoil surface.
Energies 13 05911 g001
Figure 2. Division of heating zones within the protected area.
Energies 13 05911 g002
Figure 3. Flow chart of the optimization method by the genetic algorithm.
Energies 13 05911 g003
Figure 4. Schematic diagram of ejector-driven and straight-flow icing wind tunnel.
Energies 13 05911 g004
Figure 5. Structure of the test model.
Energies 13 05911 g005
Figure 6. Configuration of the heating films on the test model.
Energies 13 05911 g006
Figure 7. Computational domain size and boundary conditions.
Energies 13 05911 g007
Figure 8. Comparisons of the convective heat transfer coefficients.
Energies 13 05911 g008
Figure 9. Experimental results of the water droplet impinging limits: (a) Case 1; (b) Case 2; (c) Case 3.
Energies 13 05911 g009
Figure 10. Numerical and experimental results of the water droplet impinging limits.
Energies 13 05911 g010
Figure 11. Numerical and experimental results of the surface temperature.
Energies 13 05911 g011
Figure 12. Heating power distributions and the anti-icing heat loads with different runback water locations: (a) Case 1; (b) Case 2; (c) Case 3.
Energies 13 05911 g012
Figure 13. Comparison of the optimized and experimental results: (a) Case 1; (b) Case 2; (c) Case 3.
Energies 13 05911 g013
Figure 14. Relationship between the anti-icing heat load and the heating range: (a) Case 1; (b) Case 2; (c) Case 3.
Energies 13 05911 g014
Figure 15. Surface temperature and the proportions of Q evap and Q conv : (a) Case 1; (b) Case 2; (c) Case 3.
Energies 13 05911 g015
Figure 16. Changes of qevap and qconv with the surface temperature.
Energies 13 05911 g016
Figure 17. Changes of qevap, qconv and the surface temperature with α: (a) Constant qt; (b) Constant m ˙ evap .
Energies 13 05911 g017
Table 1. Heating zones length streamwise.
Heating
Zones
Start
(mm)
End
(mm)
Heating Area
(mm2)
102.550
22.57.5100
37.512.5100
412.517.5100
517.522.5100
622.527.5100
727.532.5100
832.537.5100
Table 2. Material properties.
MaterialDensity,
kg/m3
Specific Heat, kJ/(kg·K)Conductivity, W/(m·K)Thickness, mm
Stainless Steel79300.516.30.10
Polyimide14001.10.20.06
Nickel-Chromium Alloys84000.4612.20.03
PMMA(Poly Methyl Methacrylatemethacrylic Acid)11901.470.194.00
Polyurethane Foam35002.480.024-
Table 3. Experimental conditions.
Caseu, m/sT, KLWC, g/m3MVD, μm
130263.150.2720
240263.150.2720
350263.150.2720
Table 4. Heating power distributions for the surface temperature validation.
CaseHeating Film Power Density (kW/m2)
12345678
119.917.215.414.913.17.27.37.2
224.821.018.415.19.08.89.08.9
330.327.119.618.617.910.710.910.8
Publisher’s Note: MDPI stays neutral with regard to jurisdictional claims in published maps and institutional affiliations.