Article

Effect of Evaporator Position on Heat Pump Assisted Solid Desiccant Cooling Systems

1
Department of Architecture and Architectural Engineering, Graduate School, Seoul National University, Seoul 08826, Korea
2
Division of Architecture for Urban Planning & Real Estate Development, The University of Suwon, Hwaseong 18323, Korea
3
Department of Architecture and Architectural Engineering, Institute of Construction and Environmental Engineering, Seoul National University, Seoul 08826, Korea
*
Author to whom correspondence should be addressed.
Energies 2020, 13(22), 5918; https://doi.org/10.3390/en13225918
Submission received: 19 October 2020 / Revised: 8 November 2020 / Accepted: 11 November 2020 / Published: 13 November 2020
(This article belongs to the Section G: Energy and Buildings)

Abstract

:
The packaged terminal air conditioning with reheat (PTACR) system, as a commonly used dehumidification system, faces the problem of extra energy consumption in the deep-cooling and reheating processes. Therefore, different heat pump assisted hybrid solid desiccant cooling (HPDC) systems were proposed and their characteristics were investigated via EnergyPlus simulations. The system energy efficiency presents an upward trend with the increase in outdoor temperature and humidity. A high-humidity climate leads to the improvement of system performance. The dehumidification performance of the desiccant wheel in the HPDC system declines when outdoor humidity increases. Compared with the PTACR system, the energy consumption of the HPDC system in which the evaporator was placed upstream of the desiccant wheel is reduced by 36%, 66%, and 64%, respectively, under different high-humidity climates. The system maintained the indoor environment within the comfort zone, and eliminated the need for a heat source for desiccant regeneration. In conclusion, the HPDC system is an available alternative that considers both energy consumption and system performance. Placing the evaporator upstream of the desiccant wheel is more advantageous in high-temperature and high-humidity climates.

Graphical Abstract

1. Introduction

In high-humidity climates, the indoor humidity of superinsulated residential buildings with significant air tightness tends to be high [1]. The latent load has a significant influence on human comfort; the introduction of outdoor air further raises this load. When packaged terminal air conditioning (PTAC) systems are used, humidity discomfort occurs owing to the inability of this system to control the indoor humidity [2]. Therefore, it is necessary to propose a system or system operation mode that can control the indoor temperature and humidity. Generally, a PTAC with reheat (PTACR) system can be employed as an alternative to a conventional PTAC system. However, the deep-cooling and reheating of the supply air in the former theoretically leads to excessive energy consumption. Moreover, this system type is not suitable for the case of high latent load [3]. Various hybrid desiccant cooling systems combining desiccant components and cooling equipment have been extensively studied as solutions to the aforementioned problems. However, the main disadvantage of these systems is that an additional heat source is needed to regenerate the desiccant. Therefore, current research efforts on hybrid desiccant cooling systems are mainly focused on the performance of different system structures and demand for reduction of regeneration heat.
According to the type of desiccant used, hybrid desiccant cooling systems can be divided into hybrid liquid and hybrid solid desiccant cooling systems; the former are more complex and relatively more difficult to miniaturise than the latter. Many researchers have applied this type of system to commercial buildings with large latent loads. Chuanshuai Dong et al. took a commercial building consisting of five floors of retail and 24 floors of office as the building case and proved that the solar-assisted plate-type liquid desiccant air-conditioning system has a certain energy saving effect (9%) [4]. Hye-Jin Cho and Su Liu et al. studied a liquid desiccant-assisted evaporative cooling system for office buildings in terms of indoor comfort [5] and energy consumption [6]. In contrast, the hybrid solid desiccant cooling system can be used as an air-conditioning unit for residential buildings with small thermal loads and diverse cooling needs. Its desiccant wheel can be combined with various types of cooling equipment, including direct expansion (DX) heat pump, energy recovery wheel (sensible heat exchanger, enthalpy exchanger wheel), and direct/indirect evaporative coolers. D.B. Jania et al. combined the solid desiccant wheel with the sensible heat recovery wheel and the DX cooling coil, and analysed the effect of outdoor temperature and regeneration temperature on the air state at desiccant wheel outlet and system performance [7]. M. Kashif Shahzad et al. chose to add an indirect evaporative cooler after the heat recovery device to re-cooling the air, and then studied the influence of the system inlet air temperature/humidity ratio and regeneration temperature on the supply air temperature/humidity and the system coefficient of performance [8]. Ramadas Narayanan et al. installed a direct evaporative cooler on the regeneration side of the system to reduce the load on the reheat coil. The energy consumption of this system [9] and indoor comfort [10] have been investigated. In addition, the solid desiccant can be directly coated onto the heat exchange components of the cooling equipment. The literature shows that this method can obtain sufficient dehumidification and cooling capacity by switching dehumidification and regeneration modes [11] and perform a high COP under the high temperature and humidity ratio condition [12]. P. Vivekh et al. developed a transient 3-D mathematical models based on the basic laws of the conservation of mass, momentum, energy, and composition, which can be used to design and optimize the aforementioned systems [13]. Turkan Ucok Erkek et al. established a system model with the Modelica modelling language, studied the heat and mass exchange performance of heat exchangers coated with two different desiccants, and proposed that the heat exchanger coated with the aluminum fumarate desiccant has higher dehumidification capacity [14].
To reduce the demand for regeneration heat, novel desiccants (Ye Yao et al. [15]) and multi-stage dehumidification processes (Ashkan Asadi et al. [16]) have been developed, which allow for regeneration temperature reduction. Additionally, solar energy has been employed to reduce the consumption of regeneration heat. Ghulam Qadar Chaudhary et al. found that solar energy contributes 70% of the regenerative heat in the system [17]. Other scholars have proved the high utilization rate of solar thermal energy through solar fraction [18], which can also reach 0.67 in March [19]. However, with regard to solar energy, there is no sufficient regeneration heat to ensure the effective operation of the desiccant wheel in days of high humidity and low solar radiation [20]. In the heat-pump assisted hybrid solid desiccant cooling (HPDC) system, which uses condenser-generated heat, the condenser is placed upstream of the regeneration side of the desiccant wheel to decrease or even eliminate the demand for an additional heat source. Won-Baek Hwang et al. proposed a HPDC system with the evaporator placed downstream of the desiccant wheel, and compared it with a reference desiccant cooling system. The research results indicated that compared with the reference system, the proposed system can provide more regeneration heat from the condenser, thereby reducing the heat input of the heating coil. Moreover, the proposed system has less energy consumption and higher cooling capacity within a certain range of the primary energy factor ratio [21]. Fenghua Ge et al. compared the exergy efficiency and energy consumption of condensing dehumidification system and the aforementioned HPDC system in 17 cases with different outdoor temperature and humidity. They pointed out that the increase in outdoor temperature is conducive to the exergy efficiency and the reduction of energy consumption for the latter system [22]. Additionally, the HPDC system with the evaporator located upstream of the desiccant wheel for improved dehumidification efficiency has been proposed. Pedro J. Martínez et al. used the system model established in TRNSYS to quantitatively study the influence of regeneration temperature and air flow rate on dehumidified air humidity ratio and suggested that the same dehumidification effect could be obtained with a low-temperature heat source when perform low air flow rate and large dehumidification section [23]. Chih-Hao Chen et al. demonstrated the low energy consumption and the low regeneration temperature characteristics of the aforementioned HPDC system using a composited desiccant wheel [24]. The existing research shows that the HPDC system is a compact system with energy saving potential and excellent performance. In the case of using a low regeneration temperature desiccant material, the HPDC system has the potential to overcome the need for additional heat sources in general desiccant cooling system and achieve the temperature and humidity independent control. The goal of this research is to develop a dehumidification and refrigeration system that can balance indoor temperature and humidity control and energy consumption based on the commonly used heat pump (DX coil). However, prior studies have failed to evaluate the indoor thermal comfort in case of using the HPDC system, which is an important factor to consider the feasibility of the system. Although the existing research has proven the dehumidification and cooling capacity of the HPDC system under cases with different outdoor temperature and humidity, the characteristics and operational stability of HPDC systems need to be further explored under the dynamic weather parameters and indoor load conditions. This paper advocates comparative analysis of HPDC systems with different evaporator configurations in order to obtain a comprehensive HPDC system applicable conditions. In view of the above research gaps for the HPDC system, this paper proposes the following innovations in methods and contents:
  • The HPDC system model with different evaporator positions and corresponding control strategies was developed by EnergyPlus. The desiccant wheel model was validated by the performance data.
  • The indoor thermal comfort and the change of indoor temperature/humidity with the different configuration of HPDC system under various climatic conditions were studied.
  • This paper analysed the performance trend of the HPDC system and the respective characteristics of each configuration and defined the stable operation conditions of HPDC system.

2. Simulation Description and Methodology

2.1. System Structure and Simulation Conditions

2.1.1. Air Handling Process and System Sizing Method

A reheat heater, which reheated the deep-cooled air to meet the indoor design temperature, was added after the evaporator to obtain a PTACR system which serves as an evaluation standard for system energy consumption and performance. To control the simulation variables, the heat pump with the same performance parameters was used for the HPDC systems. Herein, the HPDC system with the evaporator placed upstream of the desiccant wheel is denoted as System A, and the HPDC system with the evaporator placed downstream of the desiccant wheel is denoted as System B. The system configurations used in this study are shown in Figure 1.
The air handling process of three systems is shown in Figure 1d. For the PTACR system, the air is cooled and dehumidified from air state point 1 to air state point 2, and then heated to air state point 3. In System A, the mixed air was cooled and accompanied by a certain dehumidification to air state point 2, and then conveyed to the desiccant wheel. Finally, after isentropic dehumidification (state point 3), the dry air was injected into the air-conditioned space. In System B, the mixed air reaches air state point 2 through the isentropic dehumidification, and then it is cooled by the evaporator to the appropriate supply temperature.
The heat pump (HP) of the PTACR system treats the indoor latent load. Therefore, the rated cooling capacity of the HP is determined according to the maximum indoor latent load and the sensible heat ratio of the HP. In order to optimise the operating state of the desiccant wheel, the HP of System A cools the air to the dew point temperature +0.5 °C to increase the relative humidity of the air. The rated cooling capacity of the HP is determined based on the maximum difference between the dry bulb and the dew point temperature as well as the sensible heat ratio of the HP. According to the psychrometric chart (Figure 1d), the sensible load of the HP of System B is equal to the total load of the HP in System A. Therefore, the rated cooling capacity is determined according to the total load of the HP in System A and the sensible heat ratio of the HP.
The component in the HPDC system is controlled according to the indoor design temperature and humidity, which is achieved through the energy management system (EMS) in EnergyPlus. The operation state of the desiccant wheel is determined by comparing the indoor relative humidity with the design relative humidity. In addition, when the indoor relative humidity is within the range of design RH ± 0.5%, the desiccant wheel maintains the operation state of the previous time step. Then, the heat pump behaves according to the operation state of the desiccant wheel and the indoor temperature. The detailed control strategy of the HPDC system is shown in Figure 2.

2.1.2. Indoor and Outdoor Conditions Used in the Simulations

HPDC systems with a small size and simple structure can be potentially employed in residential buildings, and a high-rise residential building was selected as the simulation case (Figure 3). As the number of occupants in the living room changes significantly and the living room is connected with the kitchen, where significant moisture dissipation occurs, a living room on the 69th floor was selected as the air-conditioned space. The floor plan of the studied area is shown in Figure 4. The average temperature of Seoul, which has a continental climate, is not high. However, the humidity is relatively high owing to monsoon circulation. The meteorological data of the city of Seoul were selected as the outdoor conditions for the simulation. The simulation conditions are detailed in Table 1.

2.2. System Components Modelling and Performance Evaluation Methods

EnergyPlus is a mature simulation engine for building energy consumption and air conditioning system performance simulation. It has different heat balance algorithm to calculate indoor cooling/heating load, and then calculate the operation state and energy consumption of HVAC systems. In this paper, the conduction transfer function (CTF) is used as heat balance algorithm, and the internal/external surface convection algorithm is based on TARP variable natural convection model and DOE-2 convection model which based on the correlation from measurements by KLEMS and Yazdanian for rough surfaces, respectively. The building model described in Section 2.1.2 is imported into EnergyPlus and then establish the HVAC system after setting the thermal physical properties of building envelope and the internal heat gain parameters listed in Table 1. The HVAC system is divided into supply side and demand side in EnergyPlus. The supply side mainly includes air handling devices, while the demand side includes various indoor terminal units and air outlet ducts. The DX cooling coil, desiccant wheel and fan in the HPDC system proposed in this paper are located on the supply side, while the demand side is the general air outlet duct. Each device object is connected by “node” to form the HPDC system, and the device object is modelled by various parameters and performance curves. The main parameters of the device modelling are described below.

2.2.1. Desiccant Wheel Modelling

The desiccant wheel model was established based on a super desiccant polymer (SDP) sheet with a low regeneration temperature, as shown in Figure 5a. In the dehumidification process, there is heat and mass exchange between the desiccant side and the airside. According to the laws of mass and heat conservation, the governing equations for the airside and desiccant side can be established as shown in Equations (1)–(4).
ρ a ( ε W a t   + u a W a x ) = α h D ( W d W a )
ρ a ( C p , a + W a C p , v ) ( ε T a t   + u a T a x ) = α h ( T d T a )
f m ρ d ( 1 ε ) Y t = α h D ( W a W d )
ρ d ( C p , d + f m YC p , w ) ( 1 ε ) T d t = α [ h D ( W a W d ) i v + h ( T a T d ) ]
where Equations (1)–(4) are the mass and energy conservation governing equations of the airside and the desiccant side, respectively. The capital letters W, T, Y, and C in governing equations represent humidity ratio, temperature, water content of the desiccant material, and specific heat respectively; lowercase letters t, u, x, h, and f represent time, air velocity, length, enthalpy, and the mass fraction of the desiccant in the wheel. The Greek symbols ρ, ε, and α represent density, porosity of desiccant and the specific surface area of desiccant wheel respectively. The subscript is used to distinguish air and desiccant. To obtain an analytic solution for the state of air flowing through the SDP desiccant wheel, the following equations (Equations (5)–(8)) for calculating the outlet air temperature and humidity on the dehumidification side and regeneration side of the SDP desiccant wheel were derived based on the above four governing equations, where A, B, C, and D are the four integral constants originating from the 2nd order differential equations [25,26]:
T po = Aexp ( λ 1 , p τ p ) + Bexp ( λ 2 , p τ p ) 1 N + 1 2
W po = A ( κ p λ 1 , p 1 ) exp ( λ 1 , p τ p ) + B ( κ p λ 2 , p 1 ) exp ( λ 2 , p τ p ) 1 N + 1 2
T ro = Cexp ( λ 1 , r τ r ) + Dexp ( λ 2 , r τ r ) 1 N + 1 2 + T ri
W ro = C ( κ p λ 1 , r 1 ) exp ( λ 1 , r τ r ) + D ( κ r λ 2 , r 1 ) exp ( λ 2 , r τ r ) 1 N + 1 2 + W ri
Lee [25] has proved that the analytic solution obtained through this mathematical model is in good agreement with the numerical solution. Therefore, the inlet air conditions used by Lee and the outlet air conditions calculated herein were employed to model the SDP desiccant wheel in EnergyPlus. According to the form of the dehumidification performance curves presented in Equations (9) and (10), the air temperature and humidity data for each point in Figure 5b were substituted to perform linear regression analysis and obtain the coefficients of such curves. The values obtained for coefficients B1–B8 and C1–C8 are listed in Table 2. By comparing the analytical solution and the solution calculated by the regression curve under 46 cases, we can find that the error of regeneration outlet temperature is within ±5%, and the error in 38 cases is within ±3%, as shown in Figure 6a. For the error of regeneration outlet humidity ratio, the error range is from −3.5% to +3.3%, and the error in 41 cases is distributed within ±2%, as shown in Figure 6b. These results confirm that the coefficients obtained by linear regression analysis have high accuracy. Finally, the dehumidification performance curves based on the obtained coefficients were employed to build the SDP desiccant wheel model in EnergyPlus.
T ro = B 1 + B 2 × W ri + B 3 × T ri + B 4 × W ri T ri + B 5 × W pi + B 6 × T pi + B 7 × W pi T pi + B 8 × u
W ro = C 1 + C 2 × W ri + C 3 × T ri + C 4 × W ri T ri + C 5 × W pi + C 6 × T pi + C 7 × W pi T pi + C 8 × u

2.2.2. Heat Pump Modelling

The PTACR and HPDC systems used the heat pump with the same performance parameters. In addition to setting the rated cooling capacity and rated coefficient of performance (COP) of the heat pump, the actual cooling capacity and energy efficiency during heat pump operation were obtained by the cooling capacity and energy input rate (EIR) modifier curves in EnergyPlus. The cooling capacity modifier curve can be divided into the modifier curve based on the inlet wet bulb temperature of the evaporator and the inlet dry bulb temperature of the condenser and the modifier curve based on the airflow mass; these modifier curves are shown in Equations (11) and (12), respectively.
MC tcc _ T = a 1 + a 2 × θ ei + a 3 × θ ei 2 + a 4 × T ci + a 5 × T ci 2 + a 6 × θ ei × T ci
MC tcc _ F = b 1 + b 2 × V + b 3 × V 2
For the actual energy efficiency of the heat pump, in addition to the two EIR modifier curves calculated based on the temperature and airflow mass data (Equations (13) and (14)), the EIR modifier curve based on the part-load fraction of the heat pump is also employed, as shown in Equation (15).
MC EIR _ T = c 1 + c 2 × θ ei + c 3 × θ ei 2 + c 4 × T ci + c 5 × T ci 2 + c 6 × θ ei × T ci
MC EIR _ F = d 1 + d 2 × V + d 3 × V 2
  MC PL = e 1 + e 2 × PL + e 3 × PL 2
The coefficient of the above curve ultimately determines the performance of the heat pump under different evaporator inlet wet bulb temperature and condenser inlet dry bulb temperature conditions. The manufacturer performance data tested under ARI standard conditions (35 °C outside air dry-bulb temperature, 26.7 °C entering evaporator dry-bulb temperature and 19.4 °C entering evaporator wet-bulb temperature) following HVAC BESTEST specification were used to develop the coefficient parameter database in EnergyPlus. DX coil and heat pump are currently commercialized and commonly used cooling/heating equipment, therefore, a series of coefficients provided in the EnergyPlus coefficient parameter database was used in this paper, as shown in Table 3.

2.2.3. System Performance Evaluation Parameters

The energy efficiency of the PTACR system is calculated using the following equation:
ε PTACR = Q PTACR E hp + E rh + E f
For the HPDC system, the energy efficiency is defined as the ratio of the total cooling capacity to the total energy consumption by the heat pump, motor of the desiccant wheel, and fans.
ε HPDC = Q HPDC E hp + E m + E f
There are many evaluation methods for dehumidification performance; two effective parameters were used by many researchers, which were calculated from the characteristic potential of an active silica-gel desiccant [27]. However, this method is not suitable for systems using other desiccants when prior experimental data is not available [28]. The evaluation index of dehumidification performance should be able to reflect the thermal energy efficiency of the desiccant wheel. The ratio of the latent heat taken away by the desiccant wheel to the regeneration heat used in the literature is an appropriate method [29]. In this study, the dehumidification coefficient of performance, which is defined as the ratio of the latent load treated by the desiccant wheel to the condenser heat required to regenerate the desiccant, was used to evaluate the dehumidification performance of the desiccant wheel.
DCOP = m . p i v ( W pi W po ) m . r ( H ri H oa )
In addition, the mass of moisture removed by the desiccant wheel in the HPDC system was evaluated using the moisture removal capacity (MRC), which is defined as the humidity ratio difference between the inlet and outlet of the desiccant wheel, as follows:
MRC = m . p ( W pi W po )
The MRC of the system and heat pump is defined as the humidity ratio difference between the inlet and outlet of the system and heat pump, respectively.

3. Results and Discussion

The energy consumption and performance data obtained from the pre-simulation of the PTACR system were used to evaluate the HPDC system. The above low regeneration temperature desiccant wheel and heat pump models were combined to establish the HPDC system. The characteristics of the HPDC systems with different evaporator positions were analysed.

3.1. Indoor Thermal Comfort and Energy Consumption Analysis of Existing Systems

3.1.1. Indoor Thermal Comfort Analysis

The indoor thermal comfort results for the HPDC systems are shown in Figure 7. Both HPDC system configurations could maintain an indoor environment within the comfort zone. For System A, the indoor relative humidity exceeded the design relative humidity during 0.8% of the system operation time; however, this only occurred when the outdoor temperature was low. Since the condenser heat decreased with the drop of the cooling capacity, the regeneration heat was slightly insufficient. Such a problem needs to be further studied under climatic conditions with significantly higher humidity. Apart from the aforementioned situation, the condenser heat could sufficiently meet the demand for regeneration heat. The temperature of the dehumidified air rose owing to the adsorption of the heat generated in the dehumidification process, which resulted in an increase in the indoor temperature during System A operation. This problem also requires further analysis under other climatic conditions.

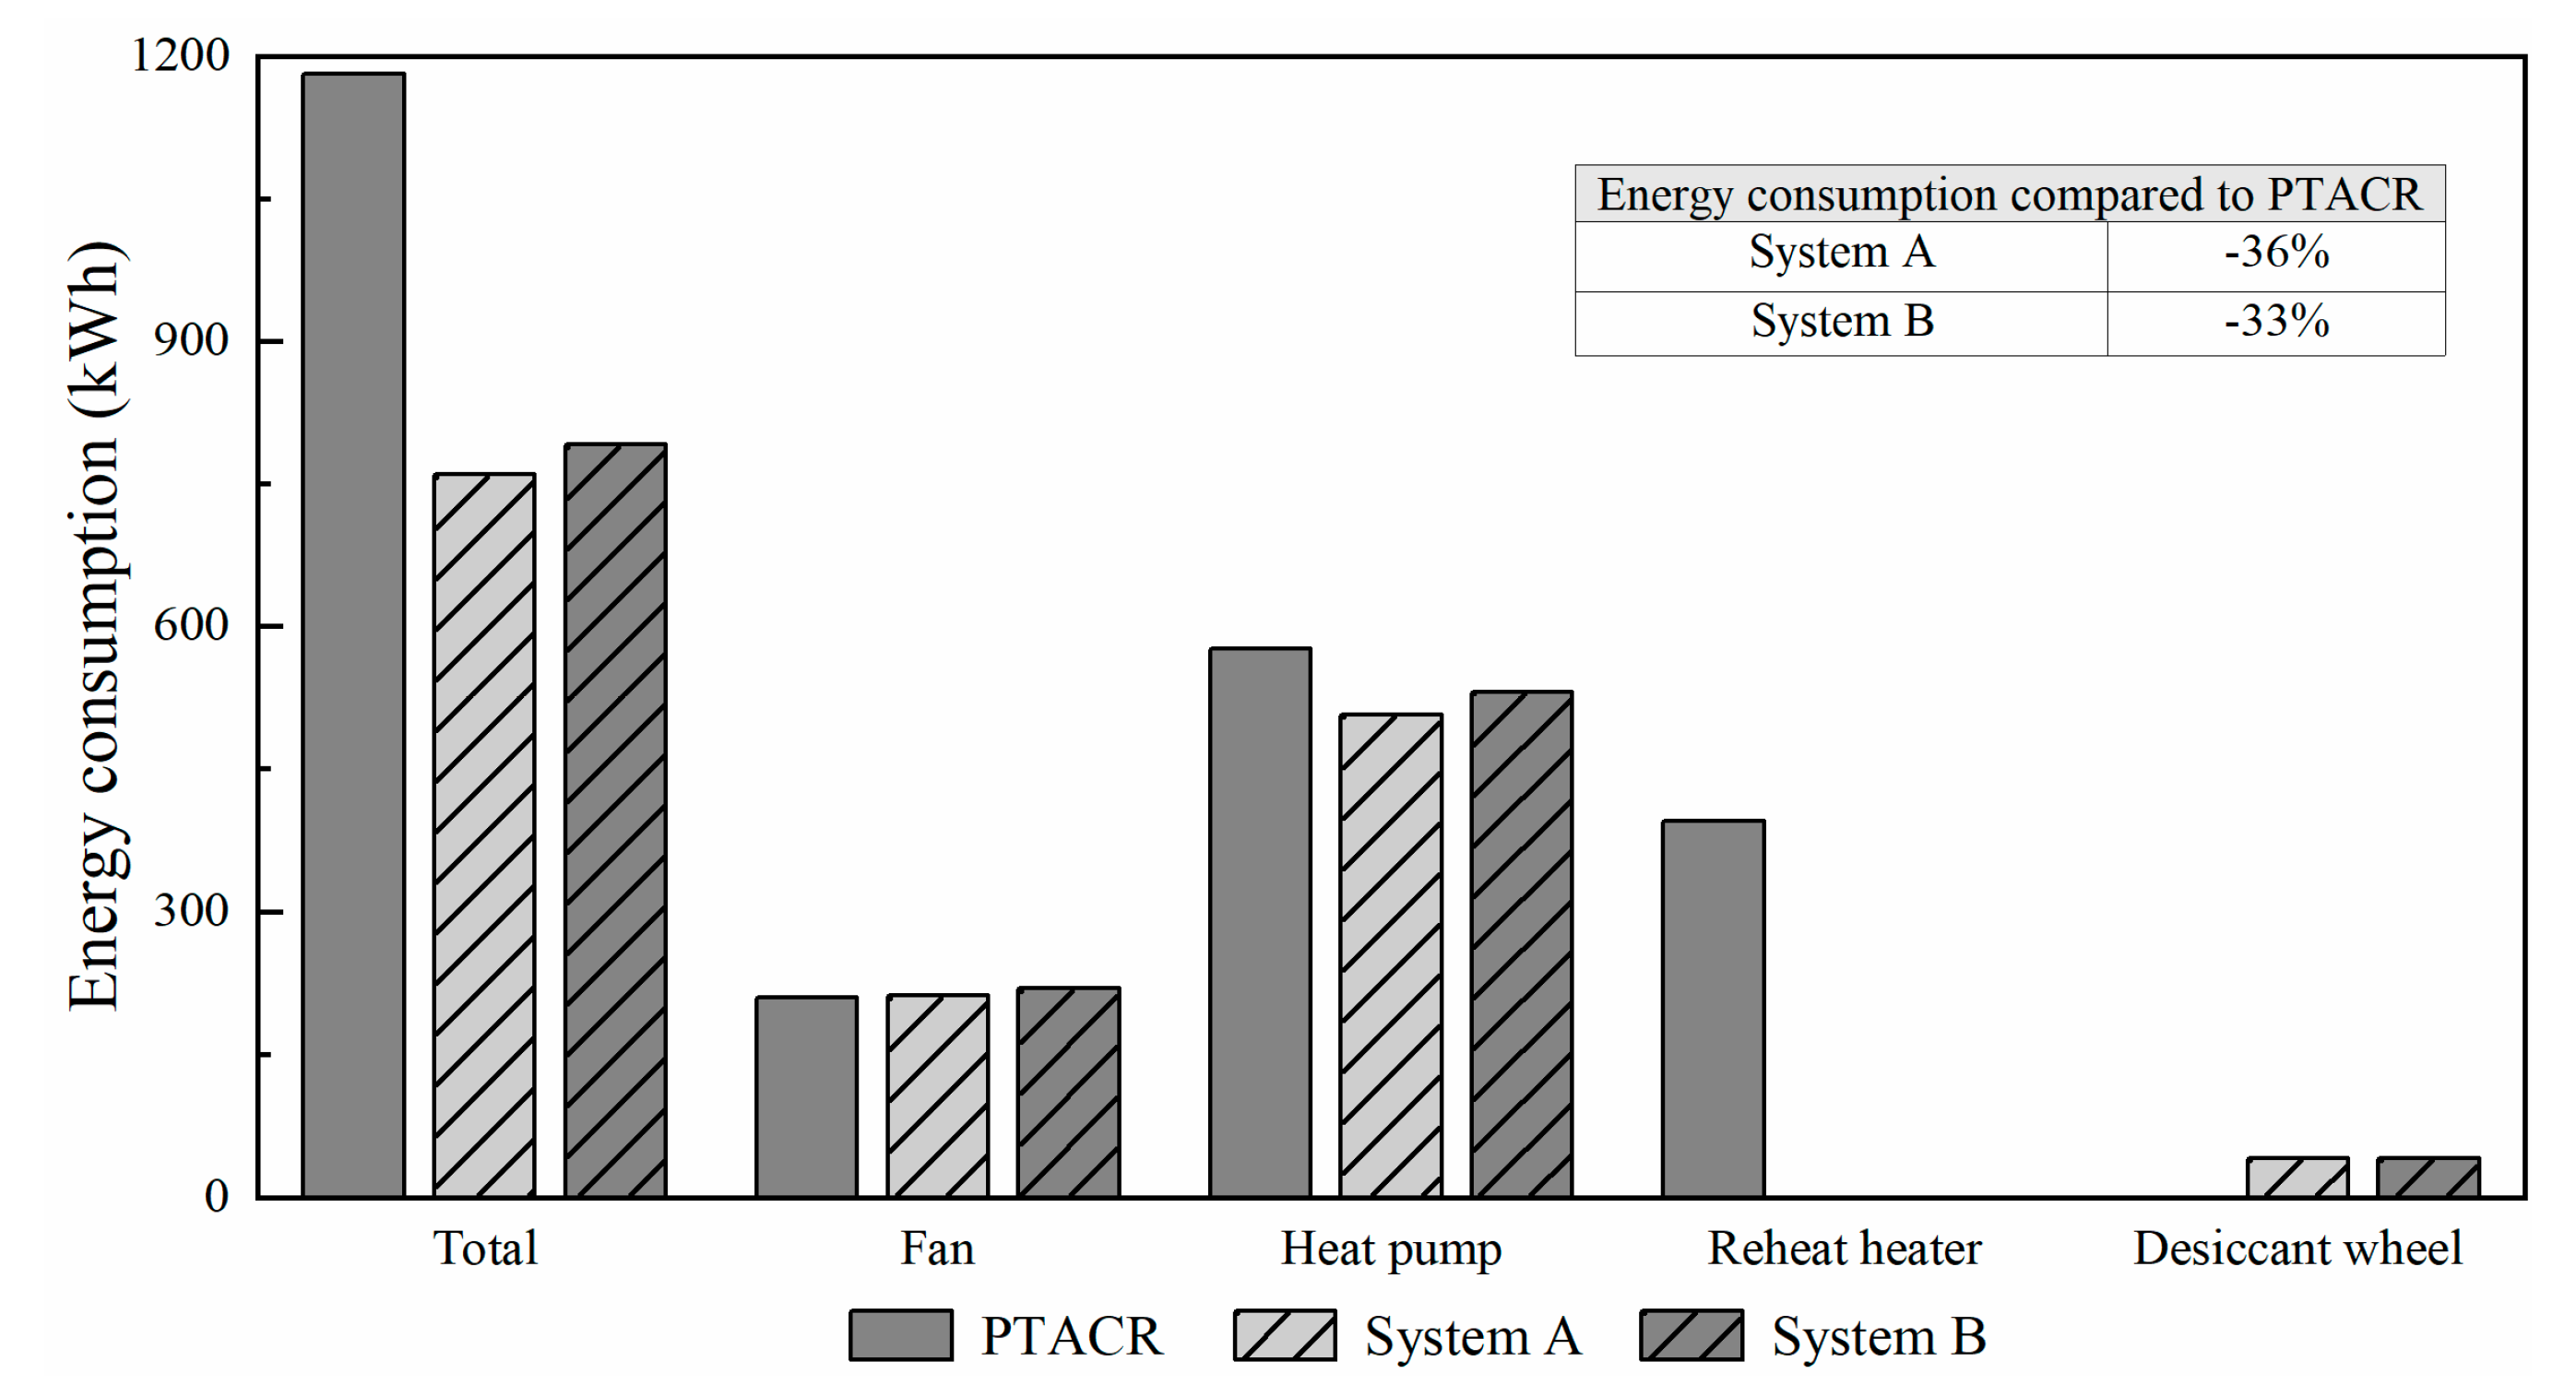
3.1.2. Energy Consumption and Performance of the HPDC Systems

Figure 8 shows the energy consumption of the three studied systems; the energy consumption of system A and system B is significantly lower than that of the PTACR system by 36% and 33%, respectively. For the PTACR system, the energy consumption of the reheat heater accounts for 33% of the total system energy consumption, whereas the HPDC system eliminates this part of the energy consumption while reducing the energy consumption of the heat pump by 12% and 8% respectively. The heat pump of System B handled more adsorption heat than that of System A, which resulted in a higher system energy consumption of the heat pump about 4.5%.
Figure 9 shows the relationship between the outdoor temperature and the system energy efficiency. The change in the ε HPDC presents two stages. For the first stage, the overall ε HPDC increases rapidly with the rise of the outdoor temperature. The corresponding ε HPDC is respectively increased by 92% and 88% with the increase in outdoor temperature from 16 °C to 26 °C (62.5% temperature increment). When the outdoor air temperature is lower than the return air temperature (26 °C), with the increase in outdoor temperature, the increase rate of the evaporating temperature of the air-cooled heat pump is higher than that of the condensing temperature, which increases heat pump performance. In addition, the desiccant wheel removes more latent load owing to the rise of the sensible heat ratio of the heat pump and to the relatively low energy consumption of the wheel motor. In contrast, when the outdoor air temperature is higher than 26 °C, the ε HPDC does not increase significantly and tends to remain stable. The overall energy efficiency of HPDC systems increased by only 2% between 26 and 32 °C. This occurs because the increase rate of the evaporating temperature is lower than that of the condensing temperature, which results in the performance drop of the heat pump. Although the desiccant wheel treats most of the latent load, the sensible load treatment efficiency is reduced. Therefore, there is no clear improvement in the ε HPDC . Conversely, the ε HPDC decreases when the outdoor temperature is higher than 32 °C. The highest ε HPDC values for System A and System B were 3.8 and 3.7, respectively. For the latter, although the adsorption heat in the dehumidification process further raised the evaporating temperature, the effective cooling capacity of the entire system did not increase. Moreover, the ε HPDC of System B was slightly lower than that of System A owing to higher heat pump energy consumption.
The ε HPDC is positively correlated with the outdoor humidity ratio, that is, with system inlet air humidity ratio, as shown in Figure 10. The corresponding ε HPDC is respectively increased by 42% and 35% with the increase in outdoor humidity ratio from 0.012 kg/kg DA to 0.02 kg/kg DA and has reached 4.1 and 3.9 at 0.02 kg/kg DA. Owing to the increase in the outdoor humidity ratio, more latent load was treated by the desiccant wheel, which contributed to the rise of the system total cooling capacity. The energy consumption of the desiccant wheel in HPDC systems was significantly smaller than that of the other system components; therefore, the overall ε HPDC showed an upward trend. Unlike outdoor temperature, which affects the increase rate of energy efficiency, the increase of outdoor humidity can stably improve the energy efficiency of the system. Fenghua Ge et al. [22] has proposed from the exergy point of view that the exergy of the system will increase with the increase in the system inlet air humidity, and this paper proved that it has the same trend in terms of energy efficiency. In contrast, for the PTACR system, the energy consumption of the deep-cooling and reheating processes increased due to the increase in outdoor humidity, which resulted in a continuous decrease in the energy efficiency of the PTACR system. The above analysis shows that HPDC systems can improve indoor comfort; their energy consumption is significantly lower than that of the PTACR system. The system performance of HPDC systems is positively correlated with the outdoor temperature and humidity ratio.

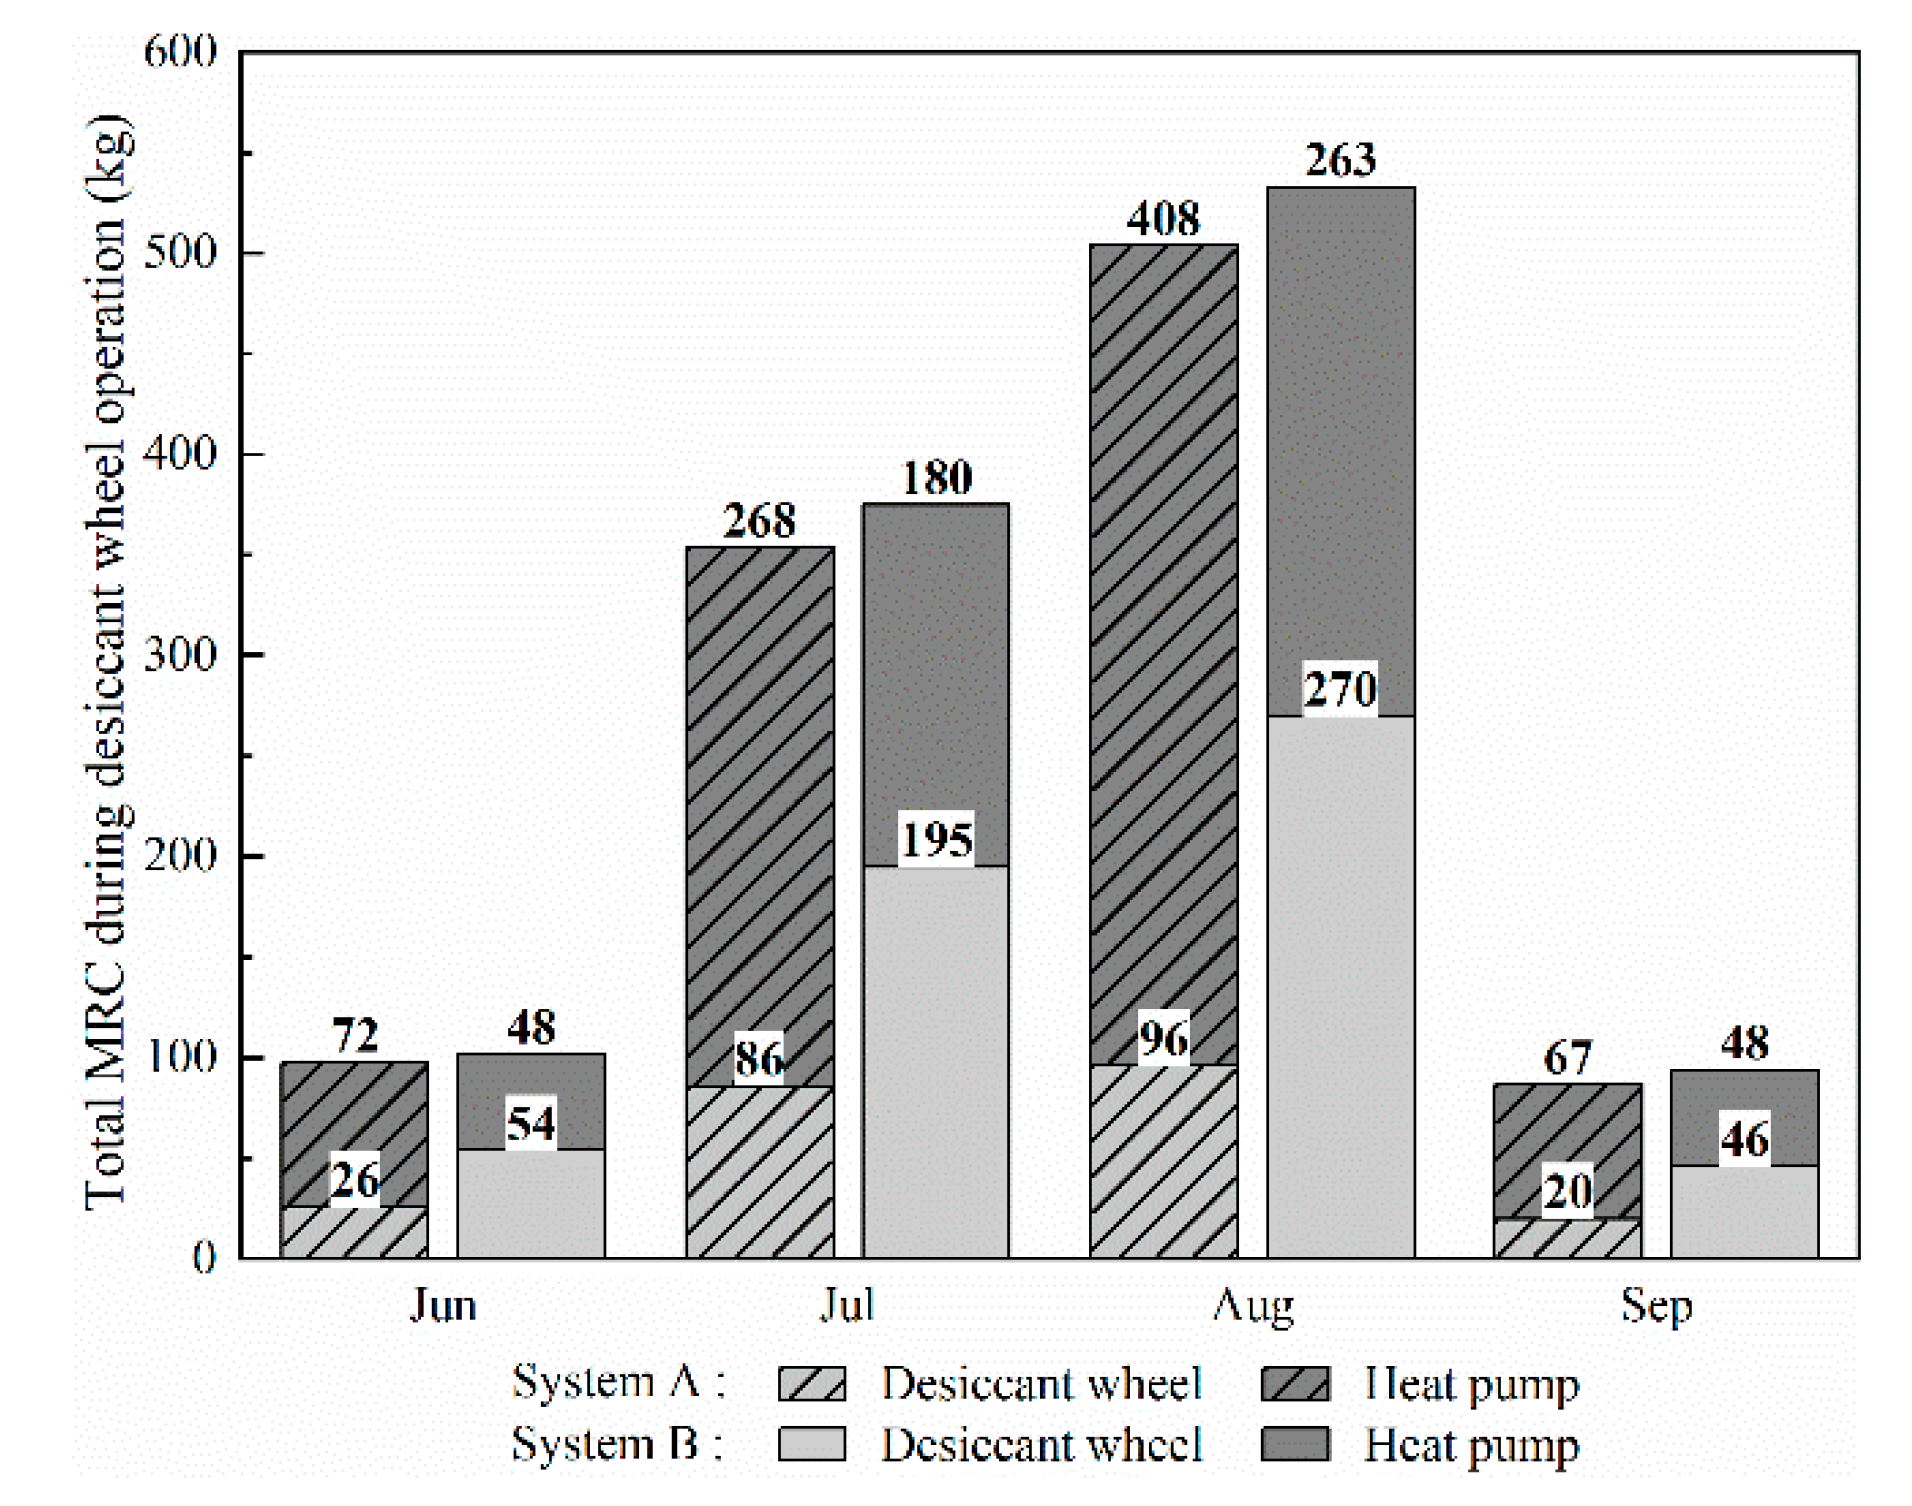
3.2. Dehumidification Characteristics of the HPDC System

Figure 11 shows the operation time percentage of the desiccant wheel in each month. The outdoor humidity in Seoul increases in July and August; therefore, during these months, the operation time percentages of the desiccant wheels of System A and System B were over 60% and 80%, respectively, which proves that the dehumidification system has a high utilisation rate in residential buildings, even in high-latitude regions.
Figure 12 shows the total MRC of each of the components of the two HPDC systems when the desiccant wheel was operating; it can be known that the monthly total MRC of each component rises with the increase in outdoor humidity and the monthly system total MRC is highest in August, reaching 504 kg and 533 kg for Systems A and B, respectively. In System A, the evaporator treats the latent load while regulating the air temperature, which has demonstrated in the research of Pedro J. Martínez et al. [23] under the condition listed in the Table 9 of their article (evaporator outlet temperature: 19 °C). The evaporator outlet temperature in the simulation case of this paper is between 17 °C and 19 °C, lower than the aforementioned condition, for 40% of the time in July and August. Therefore, the heat pump in system A handled 75.7% and 81% latent load in July and August respectively. The remaining 24.3% and 19% latent load is treated by the desiccant wheel. In the range of the heat pump latent load capacity, the change in outdoor climate conditions had a relatively small impact on the desiccant wheel MRC, which resulted in the part-load operation of the desiccant wheel. Therefore, System A has a significant potential moisture removal capacity. For System B, the monthly total desiccant wheel MRC was significantly larger than that of System A, and in August, the total MRC of the former was 2.8 times that of the latter, which means that more adsorption heat was generated in the dehumidification process and more condenser heat was needed for desiccant regeneration under the same outdoor temperature and humidity conditions. This is not conducive to energy saving. Whether the condenser heat is sufficient to regenerate the desiccant wheel also needs further study in other high-humidity climates.
The desiccant wheel in System B should remove the entire latent load of the system. However, the MRC of the desiccant wheel in this system is 55% and 54% less than the total MRC of System A of total MRC in July and August, respectively, which means that the moisture removal capacity of the desiccant wheel in System B is insufficient with under low regeneration temperature and that the dehumidification performance should be improved. Therefore, the remained 24.3% and 19% latent load in System B is handled by the heat pump when cooling the dehumidified air.
As shown in Figure 13, although the MRC of the desiccant wheels of the two HPDC systems are different, according to the fitting formula with R2 values of 0.966 and 0.998, there is a positive power function relationship between the MRC and the condenser heat required to regenerate the desiccant wheel. Chih-Hao Chen et al. [22] proposed a linearly proportional relationship between regeneration temperature and MRC and this paper has defined the relationship between MRC and required regeneration heat. Moreover, as the MRC is related to the outdoor humidity ratio, it can be concluded that the DCOP of the desiccant wheel in HPDC systems decreases with increasing the outdoor humidity ratio, as shown in Figure 14. Pedro J. Martínez and Chih-Hao Chen et al. [23,24] have used dehumidification capacity to analyse dehumidification performance. Moreover, this paper evaluated dehumidification performance from the perspective of thermal energy efficiency and proposed that the performance of the desiccant wheel will deteriorate with increase in humidity ratio (dehumidification capacity) due to the increase in the demand for regeneration heat. However, the HPDC system which is different from general dehumidification cooling systems uses condenser waste heat to provide regenerative heat, which reflects its excellent economic efficiency.

3.3. Characteristics of the HPDC Systems under Different Climate Conditions

To verify the applicability of the HPDC systems with different evaporator positions to other high-humidity climatic conditions and further analyse the problems of indoor temperature rise and insufficient condenser heat during System A operation, the proposed HPDC systems were simulated under a humid subtropical and a tropical rainforest climate. The cities of Shanghai and Singapore were respectively selected to represent the aforementioned climates. In Shanghai, the outdoor temperature fluctuates greatly, and the average humidity is higher than that in Seoul. Conversely, the temperature and humidity in Singapore are highly stable.
Figure 15 shows the indoor temperature when System A is operated in the climates of Shanghai and Singapore. The indoor temperature mainly fluctuates between 26 °C and 26.5 °C, and the maximum indoor temperatures for the cases of Shanghai and Singapore are respectively 0.6 °C and 0.7 °C higher than the corresponding indoor design temperatures, which does not significantly affect indoor comfort. Moreover, the indoor operative temperature can be controlled within the comfort zone throughout the cooling season as shown in Figure 16. The indoor operating temperature is mainly distributed between 26.7 °C and 27 °C. The situation in which the indoor relative humidity exceeds the design value owing to insufficient condenser heat is still observed and only accounted for 1.7% of the entire operating period. The indoor humidity is higher than the upper limit of the comfort zone for only 2 h, as shown in Figure 16a. Overall, System A can effectively control the thermal comfort of the indoor environment.
System B can successfully eliminate the influence of the adsorption heat on the indoor temperature. However, as discussed in Section 3.3, under the climates of Shanghai and Singapore, the condenser heat is insufficient to regenerate the desiccant when the MRC further increases. Therefore, the indoor relative humidity exceeded the design value, as shown in Figure 17; the durations of this situation for the two aforementioned high-humidity climates account for 32% and 23% of the operation time of System B, respectively. The probabilities of the indoor relative humidity being higher than the design value are 90% and 95%, respectively, when the outdoor temperature is lower than the design indoor temperature (26 °C). The increase in indoor relative humidity also leads to humidity discomfort, as shown in Figure 16. The humidity discomfort times account for 14% and 3.6% of the system operation time for the cases of Shanghai and Singapore, respectively. Owing to the higher outdoor temperatures in Singapore, the humidity discomfort time rate in this city is lower than that in Shanghai.
To calculate the additional regeneration heat required for System B operating in Shanghai and Singapore, an electric heater was added between the condenser and the regeneration side of the desiccant wheel to ensure that the desiccant wheel was fully regenerated. It was found that, for Shanghai and Singapore, heaters with rated heating capacities of 700 W and 450 W, respectively, can compensate for the insufficient condenser heat. In this case, System B can maintain the indoor relative humidity below 50%, as shown in Figure 17. As seen in Figure 18, the energy consumption of the reheat heater in PTACR system is 1970 kWh and 2430 kWh respectively under two high humidity areas, which are five times and six times that of operating in Seoul, and account for 57.8% of the total system energy consumption. The deep-cooling process causes the energy consumption of the heat pump in PTAC system to be respectively 39.5% and 24.3% higher than that in system A in the aforementioned climates while 33.4% and 18% higher than that for system B in the same climates. Therefore, the HPDC system has a better energy saving effect compared with the PTACR system. Among them, System A saves more than 60% in energy consumption on average, and System B with reheating can also reduce energy consumption by more than 50% on average.

4. Conclusions

This study has established and verified the model of HPDC systems with different evaporator positions, and studied the performance of HPDC systems in indoor comfort control. The energy efficiency characteristics and dehumidification characteristics have been summarized by a comparative analysis of different HPDC system configurations. The energy-saving effect of the HPDC system have been proven by comparison with the PTACR system. In addition, operational stability and energy consumption changes have been validated under different high-humidity climatic conditions. The main conclusions emerging from the present work are as follows:
  • In high latitude areas, the HPDC system can control the indoor temperature and humidity within the thermal comfort zone throughout the cooling season. It should be noted that the dehumidification capacity of the system B is insufficient under the low regeneration temperature provided by condensation heat. The remaining 24.3% and 19% of the latent heat were therefore handled by the heat pump in July and August.
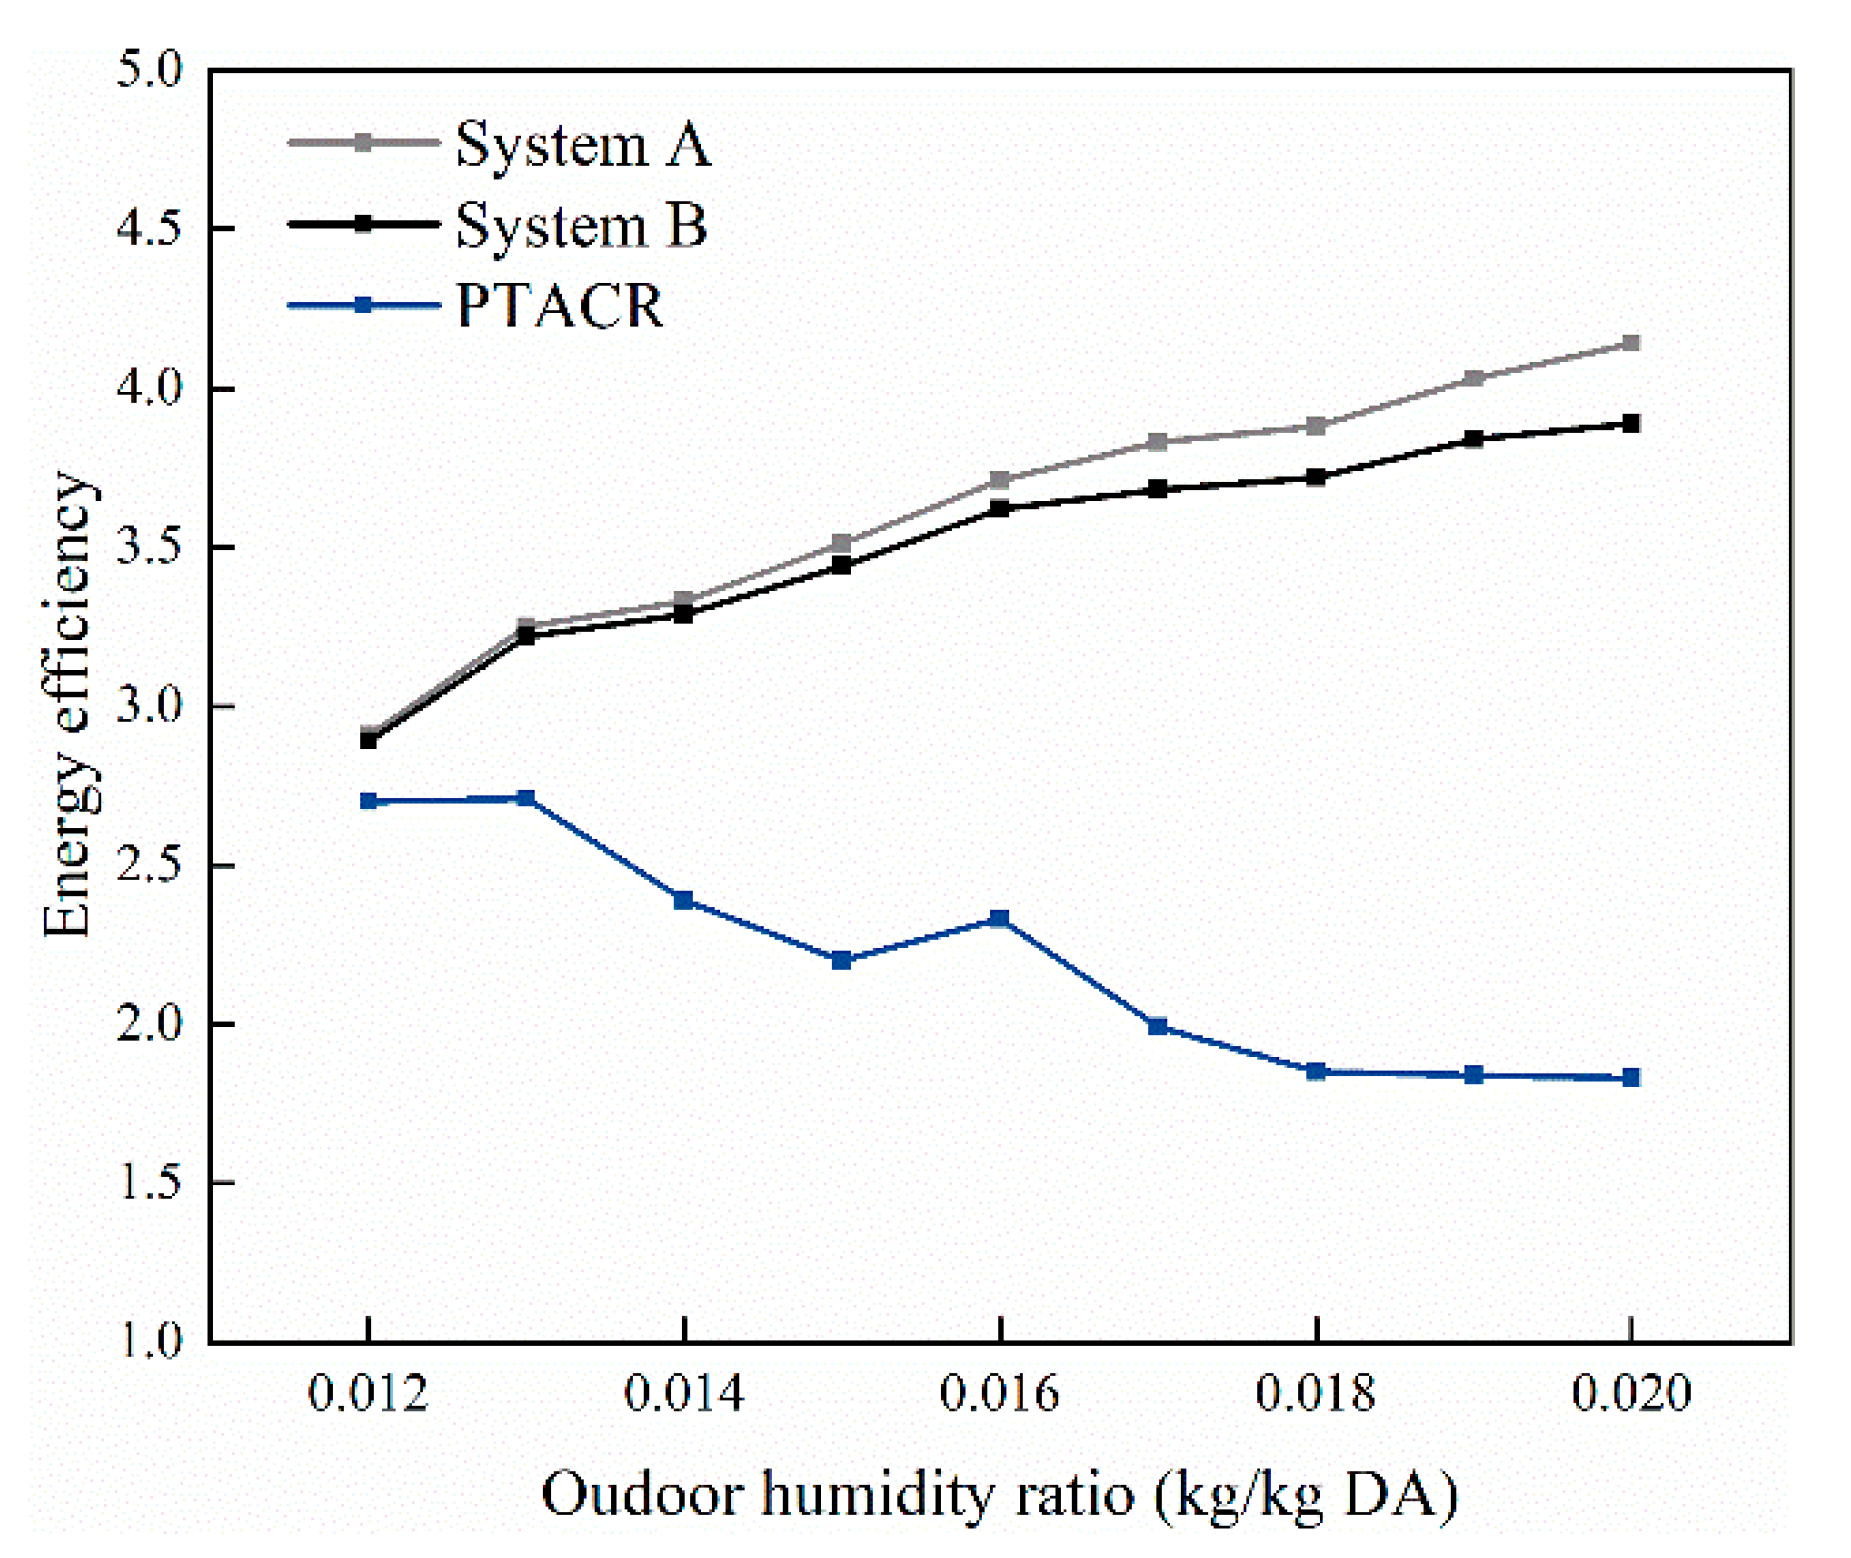
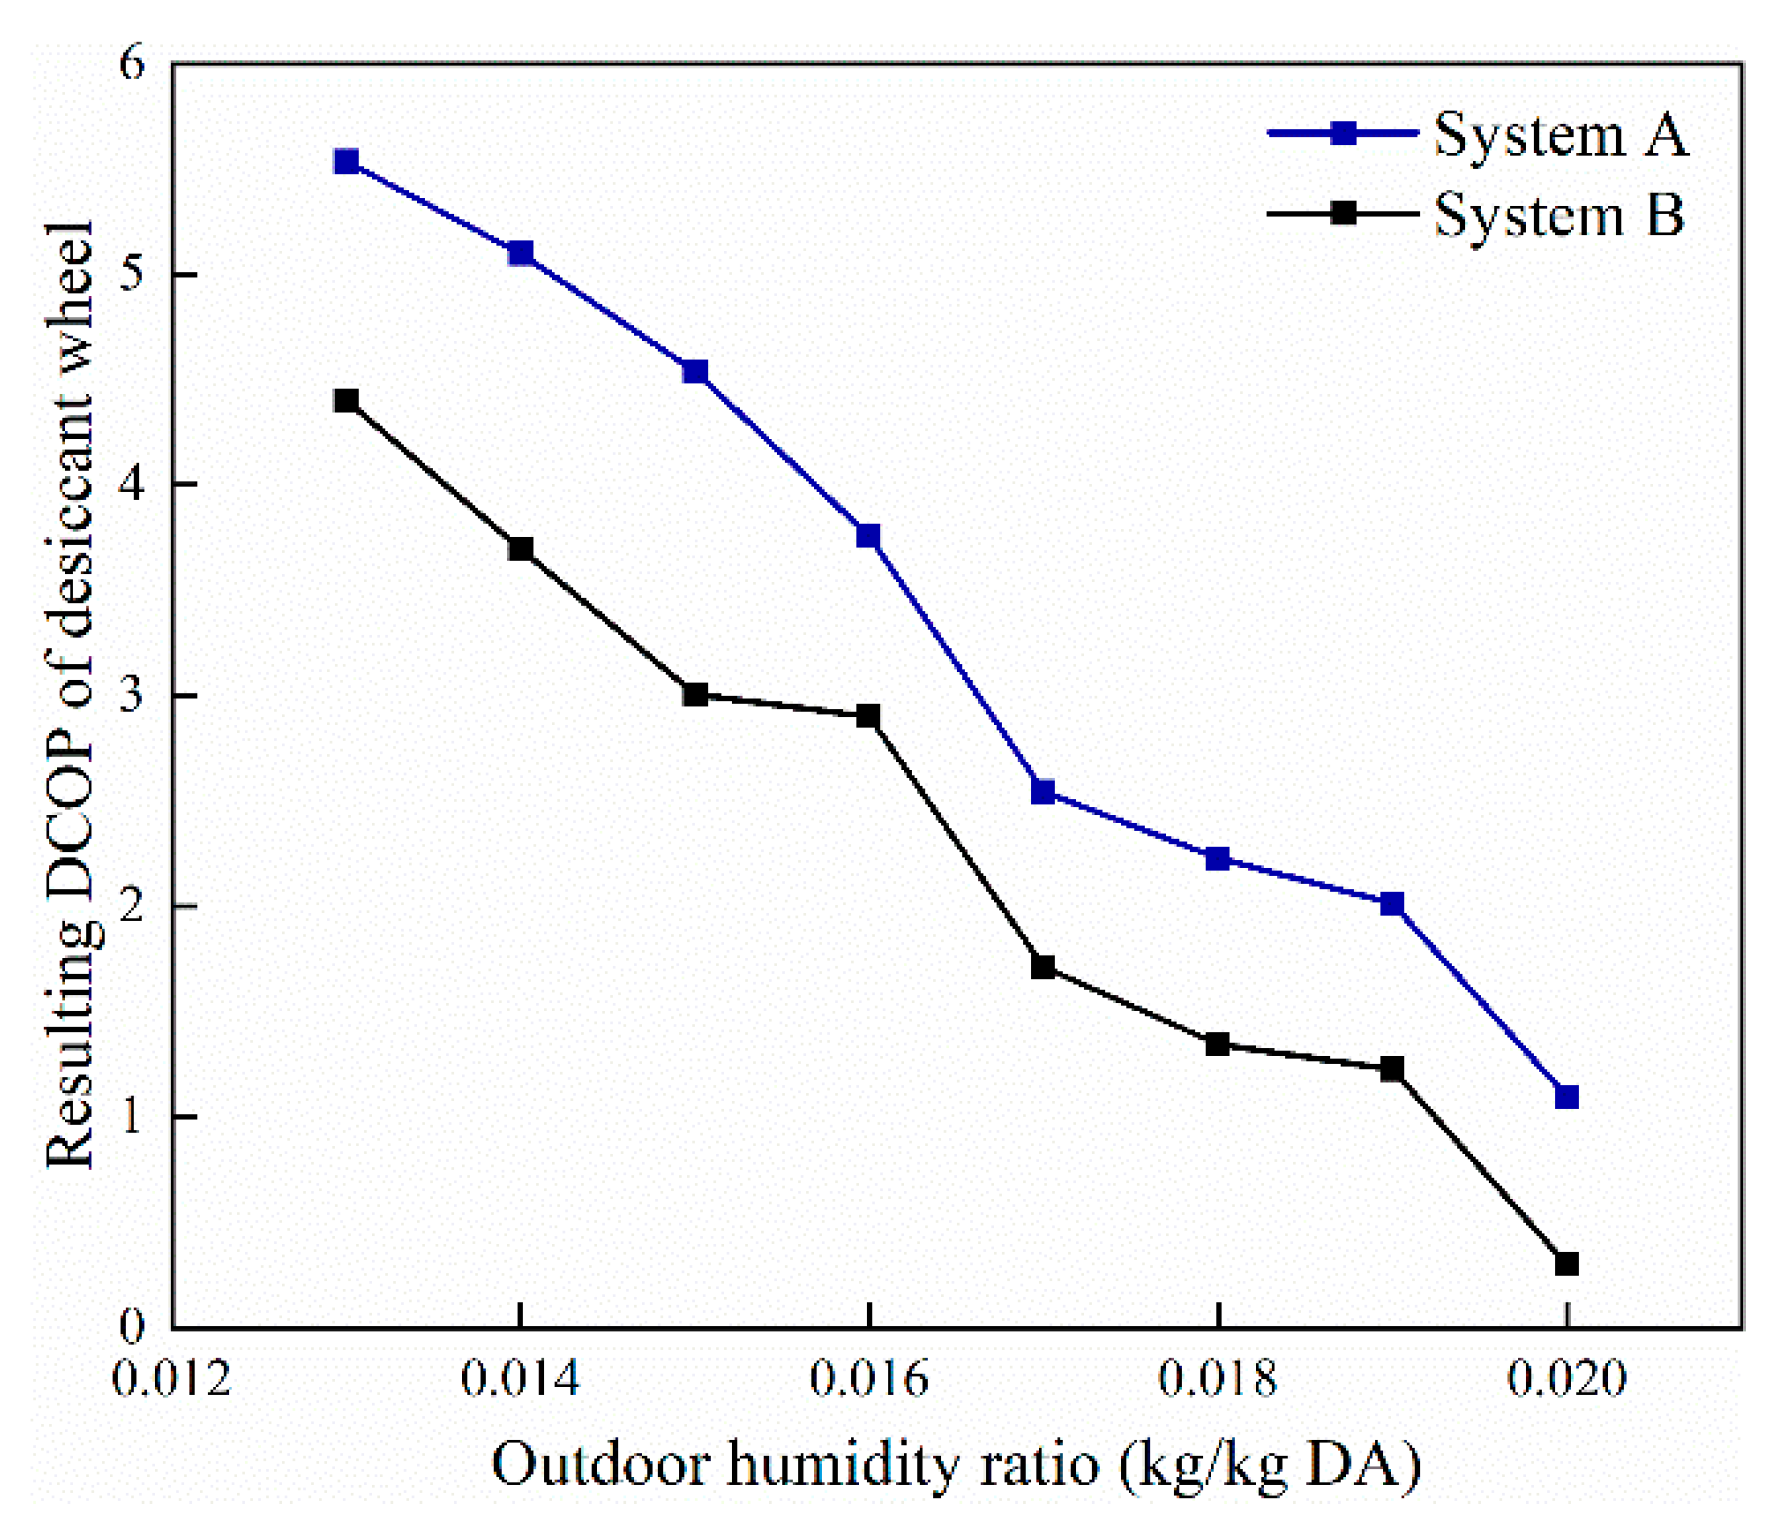
  • The dehumidification capacity of the HPDC system has improved with the increase in outdoor humidity. On the contrary, the DCOP of the desiccant wheel will decrease due to the increase in the demand for regeneration heat.
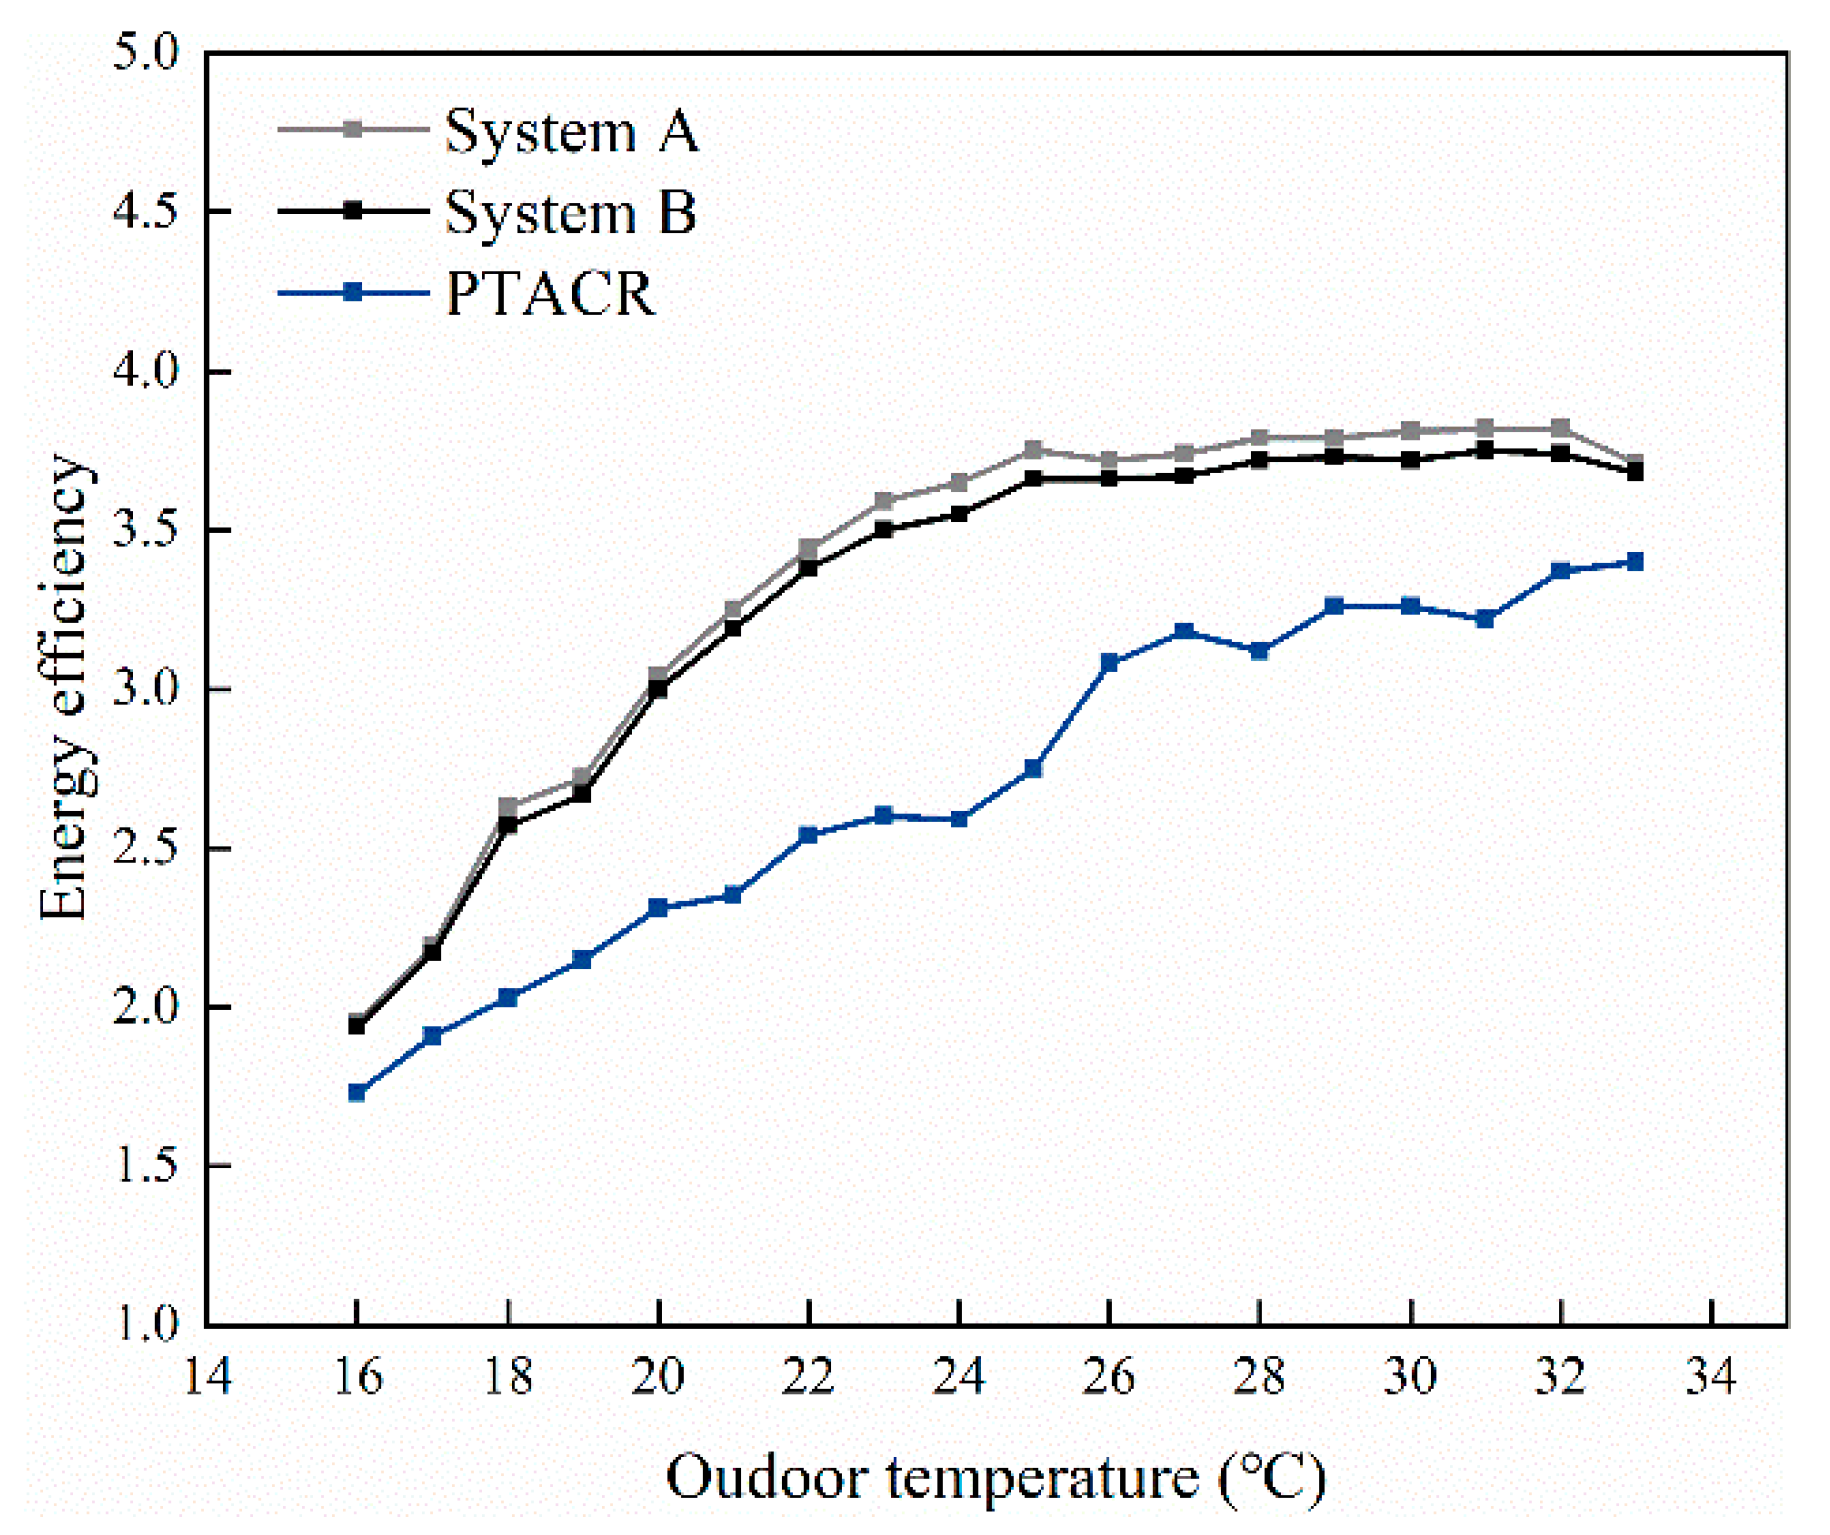
  • The ε HPDC increases with the rise in outdoor temperature and humidity. When outdoor temperature exceeds the return air temperature, an increase in outdoor humidity is more conducive to the improvement of system performance and the ε HPDC can respectively reach 4.1 and 3.9 at 0.02 kg/kg DA. On the contrary, the energy efficiency of the PTACR system drops to 1.8.
  • The condensation heat is insufficient for system B when the outdoor temperature is lower than the indoor design temperature under two high humidity climates, which causes the indoor humidity discomfort in the 14% and 3.6% system operation time. However, system A can regenerate the desiccant completely from condensation heat and achieve comfort indoor environment.
  • In the aforementioned high-humidity climate, the energy consumption of the reheat heater in the PTACR system has increased by five times and six times compared with operating in Seoul. Therefore, the HPDC system has a better energy-saving effect. Compared with the PTACR system, system A reduces the energy consumption by more than 60%. System B with the auxiliary regeneration heat source can also reduce energy consumption by more than 50%.
Through the above conclusions, it can be indicated that this study has the following innovations and contributions different from existing research:
  • This study discussed the effect of HPDC systems on indoor temperature and humidity control in different climates.
  • Through the analysis of energy efficiency, it is found that the low temperature and high humidity climate is more conducive to improving the performance of the HPDC system.
  • System A is more suitable for applications in high humidity areas when only the condenser heat is used for regeneration.
However, the simulation approach has two limitations. It does not consider the radial heat exchange between the regeneration and dehumidification sides of the desiccant wheel, and it cannot simulate the influence of the high-temperature-reactivated desiccant on the heat and mass exchange between the desiccant and the air after the reactivated desiccant rotates to the dehumidification side. Therefore, the actual cooling capacity and energy consumption of the heat pump could be higher than the simulation results, whereas the effective cooling capacity of the system could be lower. It is planned to verify the above problems through experimental research and the axial heat transfer mathematical model of the desiccant wheel. In addition, the author will formulate and evaluate the low-energy operation strategy of the HPDC system through optimization algorithms, and study the performance when it used in multiple zones and in combination with other systems.

Author Contributions

Conceptualization, methodology, software, and writing—original draft preparation, S.L.; conceptualization, writing–review and editing, supervision, C.-H.J. and M.-S.Y. All authors have read and agreed to the published version of the manuscript.

Funding

This research was supported by the Architecture & Urban Development Research Program funded by the Ministry of Land, Infrastructure and Transport of the Korean Government [grant number 20AUDP-B147683-06].

Conflicts of Interest

The authors declare no conflict of interest.

Nomenclature

Latin Symbols
C p specific heat (J/kg K)
DCOPdehumidification coefficient of performance
εenergy efficiency
Eelectrical consumption (W)
f m mass fraction of desiccant in the wheel (kg/kg)
hconvection heat transfer coefficient (W/m2 K)
h D mass transfer coefficient (kg/m2 s)
i v latent heat of evaporation (J/kg)
m . air mass flow (kg/s)
MCmodifier curve
Nnumber of desiccant-air heat transfer units
PLpart load fraction
Qcooling capacity of system (W)
Tdry-bulb temperature (°C)
uair velocity (m/s)
V the actual airflow fraction
Whumidity ratio (kg/kg DA)
Ywater content in the desiccant material (kg/kg)
Greek symbols
αspecific surface area of desiccant wheel
ρdensity(kg/m3)
εporosity of desiccant
λtime constants of explicit analytic solution
τdimensionless time
κrelative thermal capacity of desiccant wheel to air
θwet-bulb temperature (°C)
Subscript
a air
c i condenser inlet
d desiccant layer
e i evaporator inlet
EIR energy input ratio
f fan
h p heat pump
m motor of desiccant wheel
o a outdoor air
p process side of desiccant wheel
p i process side inlet air
p o process side outlet air
r regeneration side of desiccant wheel
r h reheat heater
r i regeneration side inlet air
r o regeneration side outlet air
sys entire system
tcc total cooling capacity
v vapour
w water

References

  1. O’Kelly, M.; Walter, M.E.; Rowland, J.R. Simulated hygrothermal performance of a desiccant-assisted hybrid air/water conditioning system in a mixed humid climate under dynamic load. Energy Build. 2015, 86, 45–57. [Google Scholar] [CrossRef]
  2. Li, Z.; Chen, W.; Deng, S.; Lin, Z. The characteristics of space cooling load and indoor humidity control for residences in the subtropics. Build. Environ. 2006, 41, 1137–1147. [Google Scholar] [CrossRef]
  3. Fong, K.F.; Lee, C.K.; Chow, T.T.; Fong, A.M.L. Investigation on solar hybrid desiccant cooling system for commercial premises with high latent cooling load in subtropical Hong Kong. Appl. Therm. Eng. 2011, 31, 3393–3401. [Google Scholar] [CrossRef]
  4. Dong, C.; Qi, R.; Zhang, L.; Lu, L. Performance enhancement of solar-assisted liquid desiccant dehumidifiers using super-hydrophilic surface. Energy Build. 2019, 199, 461–471. [Google Scholar] [CrossRef]
  5. Cho, H.J.; Jeong, J.W. Evaluation of thermal comfort in an office building served by a liquid desiccant-assisted evaporative cooling air-conditioning system. Energy Build. 2018, 172, 361–370. [Google Scholar] [CrossRef]
  6. Liu, S.; Jeong, J.W. Energy performance comparison between two liquid desiccant and evaporative cooling-assisted air conditioning systems. Energies 2020, 13, 522. [Google Scholar] [CrossRef] [Green Version]
  7. Jani, D.B.; Mishra, M.; Sahoo, P.K. Investigations on effect of operational conditions on performance of solid desiccant based hybrid cooling system in hot and humid climate. Therm. Sci. Eng. Prog. 2018, 7, 76–86. [Google Scholar] [CrossRef]
  8. Kashif Shahzad, M.; Ali, M.; Ahmed Sheikh, N.; Qadar Chaudhary, G.; Shahid Khalil, M.; Rashid, T.U. Experimental evaluation of a solid desiccant system integrated with cross flow Maisotsenko cycle evaporative cooler. Appl. Therm. Eng. 2018, 128, 1476–1487. [Google Scholar] [CrossRef]
  9. Narayanan, R.; Halawa, E.; Jain, S. Performance characteristics of solid-desiccant evaporative cooling systems. Energies 2018, 11, 2574. [Google Scholar] [CrossRef] [Green Version]
  10. Narayanan, R.; Halawa, E.; Jain, S. Dehumidification potential of a solid desiccant based evaporative cooling system with an enthalpy exchanger operating in subtropical and tropical climates. Energies 2019, 12, 2704. [Google Scholar] [CrossRef] [Green Version]
  11. Ge, T.S.; Dai, Y.J.; Wang, R.Z. Analysis on integrated low grade condensation heat powered desiccant coated vapor compression system. Appl. Therm. Eng. 2018, 138, 307–318. [Google Scholar] [CrossRef]
  12. Hua, L.J.; Ge, T.S.; Wang, R.Z. Extremely high efficient heat pump with desiccant coated evaporator and condenser. Energy 2019, 170, 569–579. [Google Scholar] [CrossRef]
  13. Vivekh, P.; Bui, D.T.; Kumja, M.; Islam, M.R.; Chua, K.J. Theoretical performance analysis of silica gel and composite polymer desiccant coated heat exchangers based on a CFD approach. Energy Convers. Manag. 2019, 187, 423–446. [Google Scholar] [CrossRef]
  14. Erkek, T.U.; Gungor, A.; Fugmann, H.; Morgenstern, A.; Bongs, C. Performance evaluation of a desiccant coated heat exchanger with two different desiccant materials. Appl. Therm. Eng. 2018, 143, 701–710. [Google Scholar] [CrossRef]
  15. Yao, Y.; Dai, L.; Jiang, F. Photo-crosslinked nanofibrous membranes as advanced low-temperature regenerative desiccant. Polym. Test. 2019, 78. [Google Scholar] [CrossRef]
  16. Asadi, A.; Roshanzadeh, B. Improving performance of two-stage desiccant cooling system by analyzing different regeneration configurations. J. Build. Eng. 2019, 25, 100807. [Google Scholar] [CrossRef]
  17. Chaudhary, G.Q.; Ali, M.; Sheikh, N.A.; Gilani, S.I.U.H.; Khushnood, S. Integration of solar assisted solid desiccant cooling system with efficient evaporative cooling technique for separate load handling. Appl. Therm. Eng. 2018, 140, 696–706. [Google Scholar] [CrossRef]
  18. Angrisani, G.; Roselli, C.; Sasso, M.; Tariello, F.; Vanoli, G.P. Performance assessment of a solar-assisted desiccant-based air handling unit considering different scenarios. Energies 2016, 9, 724. [Google Scholar] [CrossRef] [Green Version]
  19. Luo, W.J.; Faridah, D.; Fasya, F.R.; Chen, Y.S.; Mulki, F.H.; Adilah, U.N. Performance enhancement of hybrid solid desiccant cooling systems by integrating solar water collectors in Taiwan. Energies 2019, 12, 3470. [Google Scholar] [CrossRef] [Green Version]
  20. Li, H.; Dai, Y.J.; Köhler, M.; Wang, R.Z. Simulation and parameter analysis of a two-stage desiccant cooing/heating system driven by solar air collectors. Energy Convers. Manag. 2013, 67, 309–317. [Google Scholar] [CrossRef]
  21. Hwang, W.B.; Choi, S.; Lee, D.Y. In-depth analysis of the performance of hybrid desiccant cooling system incorporated with an electric heat pump. Energy 2017, 118, 324–332. [Google Scholar] [CrossRef]
  22. Ge, F.; Wang, C. Exergy analysis of dehumidification systems: A comparison between the condensing dehumidification and the desiccant wheel dehumidification. Energy Convers. Manag. 2020, 224, 113343. [Google Scholar] [CrossRef]
  23. Martínez, P.J.; Llorca, C.; Pla, J.A.; Marténez, P. Experimental validation of the simulation model of a DOAS equipped with a desiccant wheel and a vapor compression refrigeration system. Energies 2017, 10, 1330. [Google Scholar] [CrossRef] [Green Version]
  24. Chen, C.H.; Hsu, C.Y.; Chen, C.C.; Chiang, Y.C.; Chen, S.L. Silica gel/polymer composite desiccant wheel combined with heat pump for air-conditioning systems. Energy 2016, 94, 87–99. [Google Scholar] [CrossRef]
  25. Kang, H.; Lee, G.; Lee, D.Y. Explicit analytic solution for heat and mass transfer in a desiccant wheel using a simplified model. Energy 2015, 93, 2559–2567. [Google Scholar] [CrossRef]
  26. Kang, H.; Choi, S.; Lee, D.Y. Analytic solution to predict the outlet air states of a desiccant wheel with an arbitrary split ratio. Energy 2018, 153, 301–310. [Google Scholar] [CrossRef]
  27. Ruivo, C.R.; Carrillo-Andrés, A.; Costa, J.J.; Domínguez-Muñoz, F. A new approach to the effectiveness method for the simulation of desiccant wheels with variable inlet states and airflows rates. Appl. Therm. Eng. 2013, 58, 670–678. [Google Scholar] [CrossRef]
  28. Ruivo, C.R.; Costa, J.J.; Figueiredo, A.R.; Kodama, A. Effectiveness parameters for the prediction of the global performance of desiccant wheels—An assessment based on experimental data. Renew. Energy 2012, 38, 181–187. [Google Scholar] [CrossRef]
  29. Niemann, P.; Richter, F.; Speerforck, A.; Schmitz, G. Desiccant-assisted air conditioning system relying on solar and geothermal energy during summer and winter. Energies 2019, 12, 3175. [Google Scholar] [CrossRef] [Green Version]
Figure 1. System configurations studied herein: (a) PTACR system (b) System A (c) System B (d) psychrometric chart.
Energies 13 05918 g001
Figure 2. HPDC system control strategies.
Energies 13 05918 g002
Figure 3. Building selected for the simulation.
Energies 13 05918 g003
Figure 4. Floor plan of the selected dwelling.
Energies 13 05918 g004
Figure 5. Photographs and schematic diagram of the desiccant wheel: (a) Structure of the SDP desiccant wheel. (b) Data point related to model establishment.
Energies 13 05918 g005
Figure 6. Accuracy validation of the coefficients obtained with the analytic solution by Lee [27]: (a) B1–B8. (b) C1–C8.
Energies 13 05918 g006
Figure 7. Indoor thermal comfort results for the HPDC systems.
Energies 13 05918 g007
Figure 8. Energy consumption of the three studied systems.
Energies 13 05918 g008
Figure 9. Variation of the ε HPDC and ε PTACR with the outdoor temperature.
Energies 13 05918 g009
Figure 10. Variation of the ε HPDC and ε PTACR with the outdoor humidity ratio.
Energies 13 05918 g010
Figure 11. Desiccant wheel operation time percentage in the HPDC systems.
Energies 13 05918 g011
Figure 12. MRC during desiccant wheel operation.
Energies 13 05918 g012
Figure 13. Relationship between the MRC of the desiccant wheel and the condenser heat.
Energies 13 05918 g013
Figure 14. Relationship between the DCOP of the desiccant wheel and the outdoor humidity ratio.
Energies 13 05918 g014
Figure 15. Indoor air temperature when System A operates under different climatic conditions.
Energies 13 05918 g015
Figure 16. Indoor thermal comfort when HPDC systems operate under different climatic conditions: (a) Shanghai’s climate. (b) Singapore’s climate.
Energies 13 05918 g016
Figure 17. Indoor relative humidity before and after adding the heater in system B.
Energies 13 05918 g017
Figure 18. Energy-saving effect of HPDC systems.
Energies 13 05918 g018
Table 1. Summary of input data for simulation.
ItemsInput Data
Design parametersDesign indoor temperature26 °C
Indoor relative humidity50%
Outdoor environmentMeteorological data of Seoul
System volumetric flow rate360 m3/h
Outdoor air volumetric flow rate108 m3/h
Internal LoadsNumber of occupants4 people
People120 W/person
Light6.19 W/m2
EquipmentSensible heat: 160 W
Cooking15 W (Sensible heat 11.25 W, Latent heat 3.75 W)
Table 2. Coefficients of the dehumidification performance curve.
12345678
B i 10.73864113.27390.65711,192.462176.8742940.002073−20,705.70
C i −0.003760.982038 × 10−5−6.070838−0.0703094.62 × 10−58.8537290
Table 3. Coefficients of cooling capacity and EIR modifier curve.
M C t c c _ T ( a i ) M C t c c _ F ( b i ) M C E I R _ T ( c i ) M C E I R _ F ( d i ) C P L ( e i )
10.9425877930.80.3424144091.15520.85
20.0095433470.20.034885008−0.18080.15
30.000683770−0.00062370.02560
4−0.011042676-0.004977216--
50.000005249-0.000437951--
6−0.00000972-−0.000728028--
Publisher’s Note: MDPI stays neutral with regard to jurisdictional claims in published maps and institutional affiliations.

