Assessment of PV Hosting Capacity in a Small Distribution System by an Improved Stochastic Analysis Method

Abstract
:
1. Introduction
- Impact on voltage quality—PV installation on the end of the feeder, such as the concentrated rooftop-type PV in the residential area, may cause various voltage problems. The problem of voltage rise is often given more attention by grid utility since most of the electric grids have been designed based to the assumption that the voltage may drop from the substation to the end of the feeder with the increased load demand [2]. Instead of restraining this voltage drop by the operation of PV power generation, when too much PV installation is improperly planned it may result in unacceptable overvoltage effect. PV power output may rapidly and unpredictably change due to the weather condition, thus producing voltage fluctuation in electric grids. The fluctuation response may sometimes be quicker than the typical voltage regulation controls used in systems. It thus affects the quality of supply voltage for electricity customers and increases the operational complexity of the voltage regulation equipment likes capacitor banks and transformers’ tap changers [3]. In addition, when PV deployment is excessively aggregated on a certain electrical phase, voltage imbalance problem may occur [4].
- Thermal loading and protection limit—it is a problem related to the net load demand on the electric feeder. When high-penetration PV occurs at peak power generation period and the electric feeders reduce net load demand at that time, it can potentially cause a considerable reverse power flow on the electric feeders. This condition may affect the setting of protection coordination devices and the operation of line voltage regulator; furthermore, when fault events occur, they may lead to congestion problems in the electric feeders. Islanding operation is another noteworthy issue; it may arbitrarily form when traditional generation units interrupt from any one of electric feeders. Once islanding forms, there might not be sufficient change in the voltage amplitude or frequency at the point of PV interconnection due to activated reference for anti-islanding protection that is provided by inverter functionality (or other grid facilities); further electrical risks may possibly be caused [5].
- Effect of the power quality distortion—voltage distortion may generally be amplified by harmonic distortion caused by harmonic current injection from used power conversion technologies in PV power generation. Both operation behavior of PV power generation and the characteristics of the different distribution feeders are influential factors in this problem. Most of current studies mainly focus on investigating low-order characteristic harmonics, interharmonics and supraharmonics problems [6,7,8].
2. Methodologies for PVHC Analysis
2.1. Sketch of PV Hosting Capacity
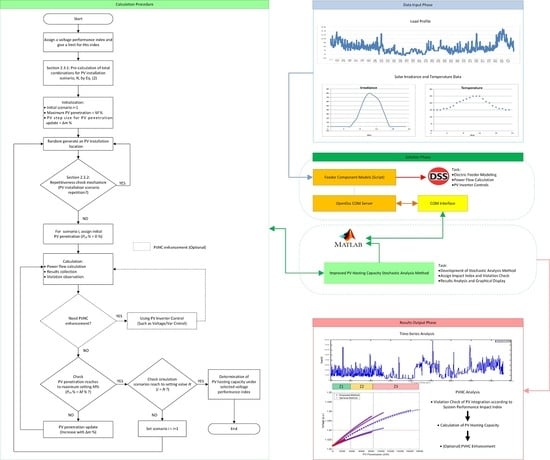
2.2. General Stochastic Analysis Method (GSAM)
- Step 1: assign a system performance index and its limit; here, overvoltage, voltage fluctuation, and voltage imbalance are in sequence used in this study;
- Step 2: initialization to set initial scenario value (i = 1) and total scenarios values (N), maximum PV penetration (M%) and PV step size (Δm%); meanwhile, PV penetration ( in (1) defined as the ratio of peak PV installation capacity to peak loads on distribution feeders is used to determine current PV installation capacity [25]:
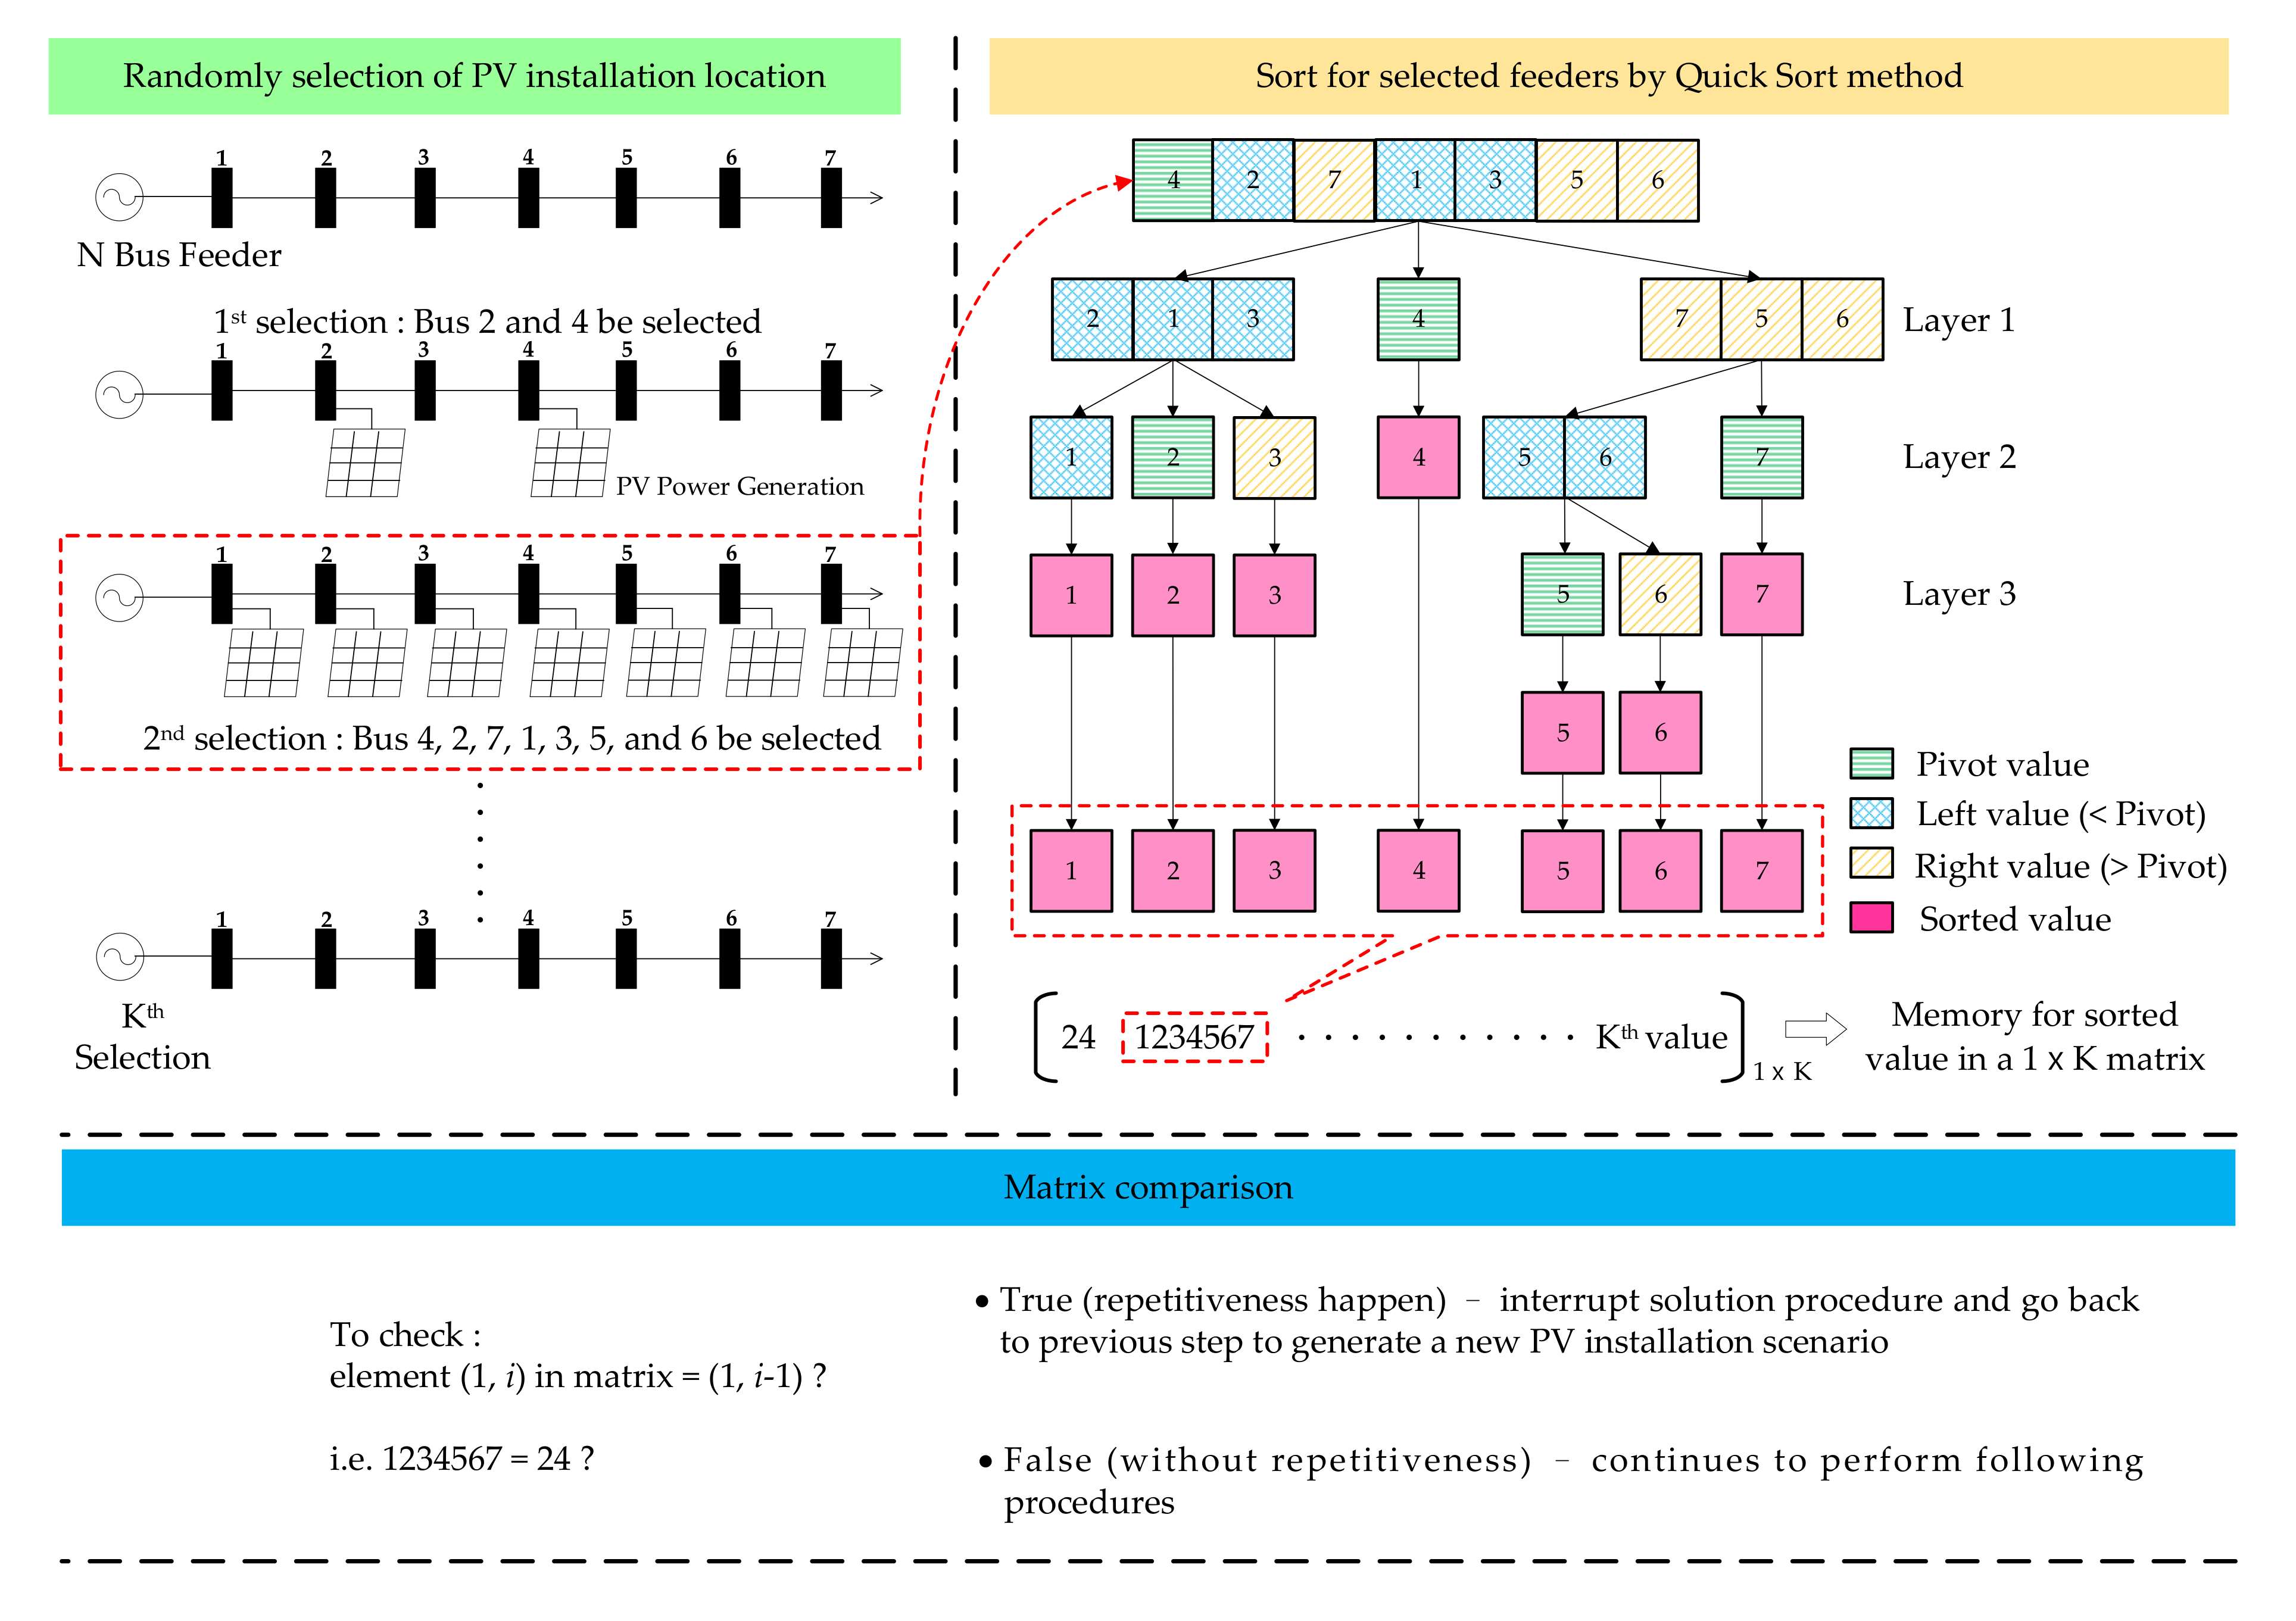
- Step 3: a PV installation location is randomly produced by the program;
- Step 4: for scenario i, assign an initial PV penetration value for the calculation, here 0% is used;
- Step 5: calculation, power flow analysis are performed according to setting of PV deployment, and calculation results are collected and the voltage violations on distribution feeders are checked;
- Step 6: check if the reaches the maximum M%; if true, go to next step; otherwise, update PV size with increasing Δm% capacity, then repeat power following the calculation in step 3;
- Step 7: check if the reaches maximum penetration M%; if true, go to next step; otherwise, update PV penetration with PV step size Δm% capacity, then repeat power following the calculation in step 5;
- Step 8: check if iteration number reaches maximum scenario N; if true, PVHC is determined; otherwise, randomly generate new scenario and repeat steps 3 to 7.
2.3. Proposed Stochastic Analysis Method (PSAM)
2.3.1. Calculations of PV Installation Scenario Combinations
2.3.2. Repetitiveness Check Mechanism
2.4. Used Voltage Performance Indices and Their Limits
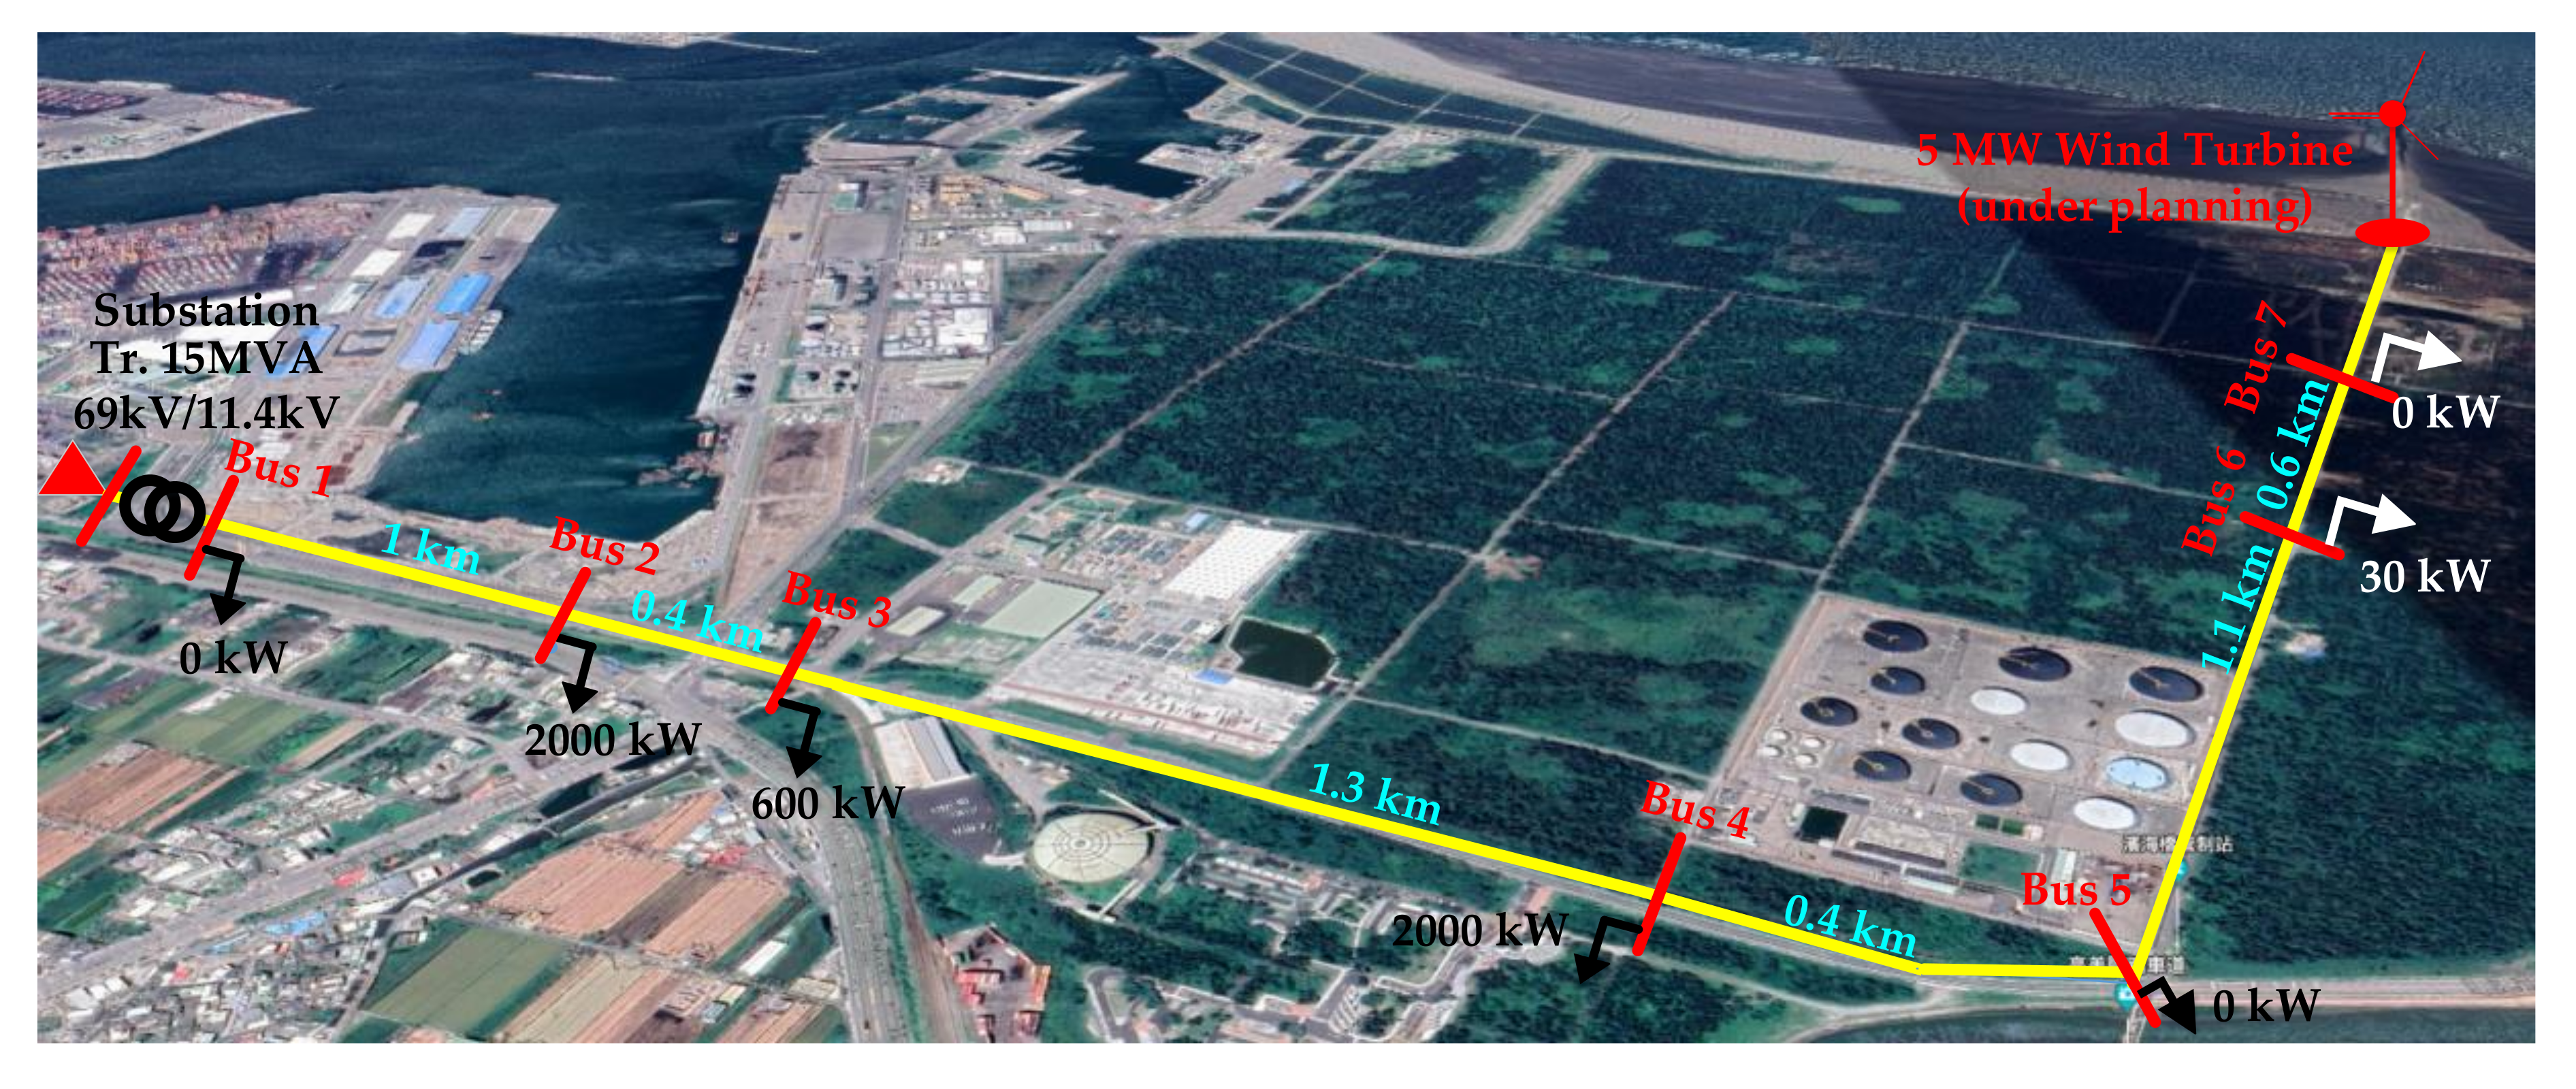
2.5. Modelling of Testing Distribution Feeder
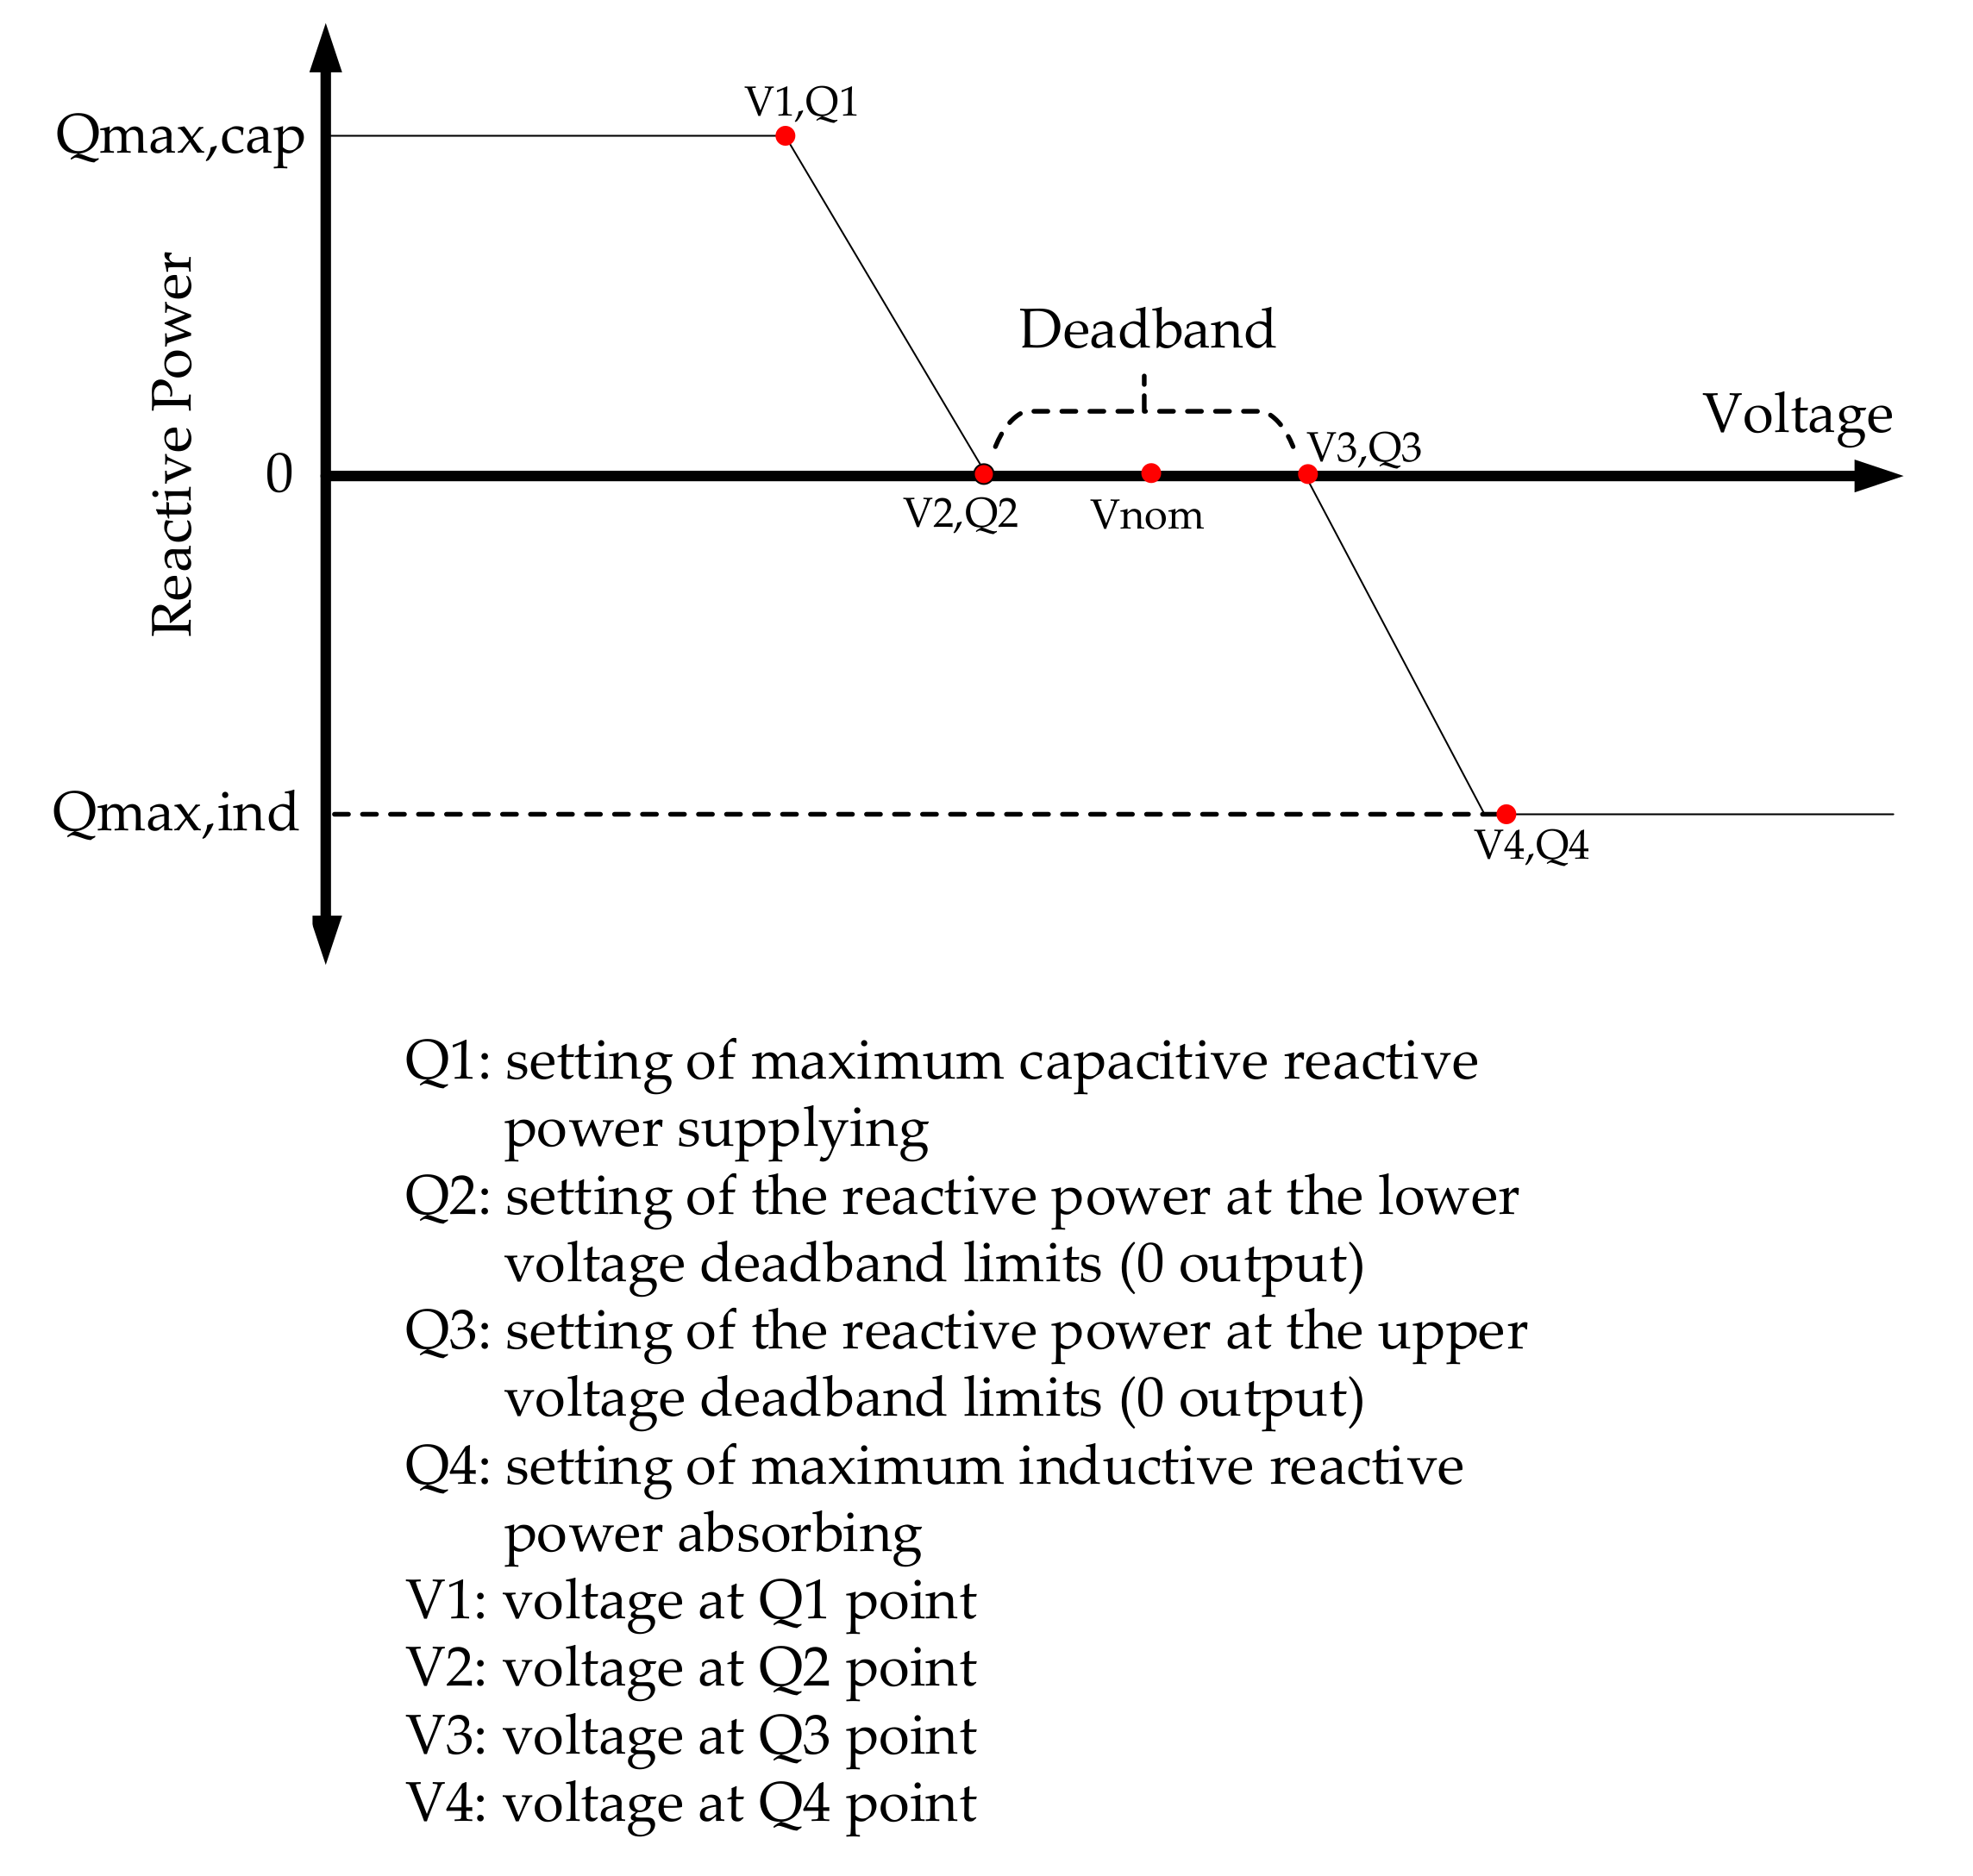
2.6. PVHC Enhancement by PV Inverter Control
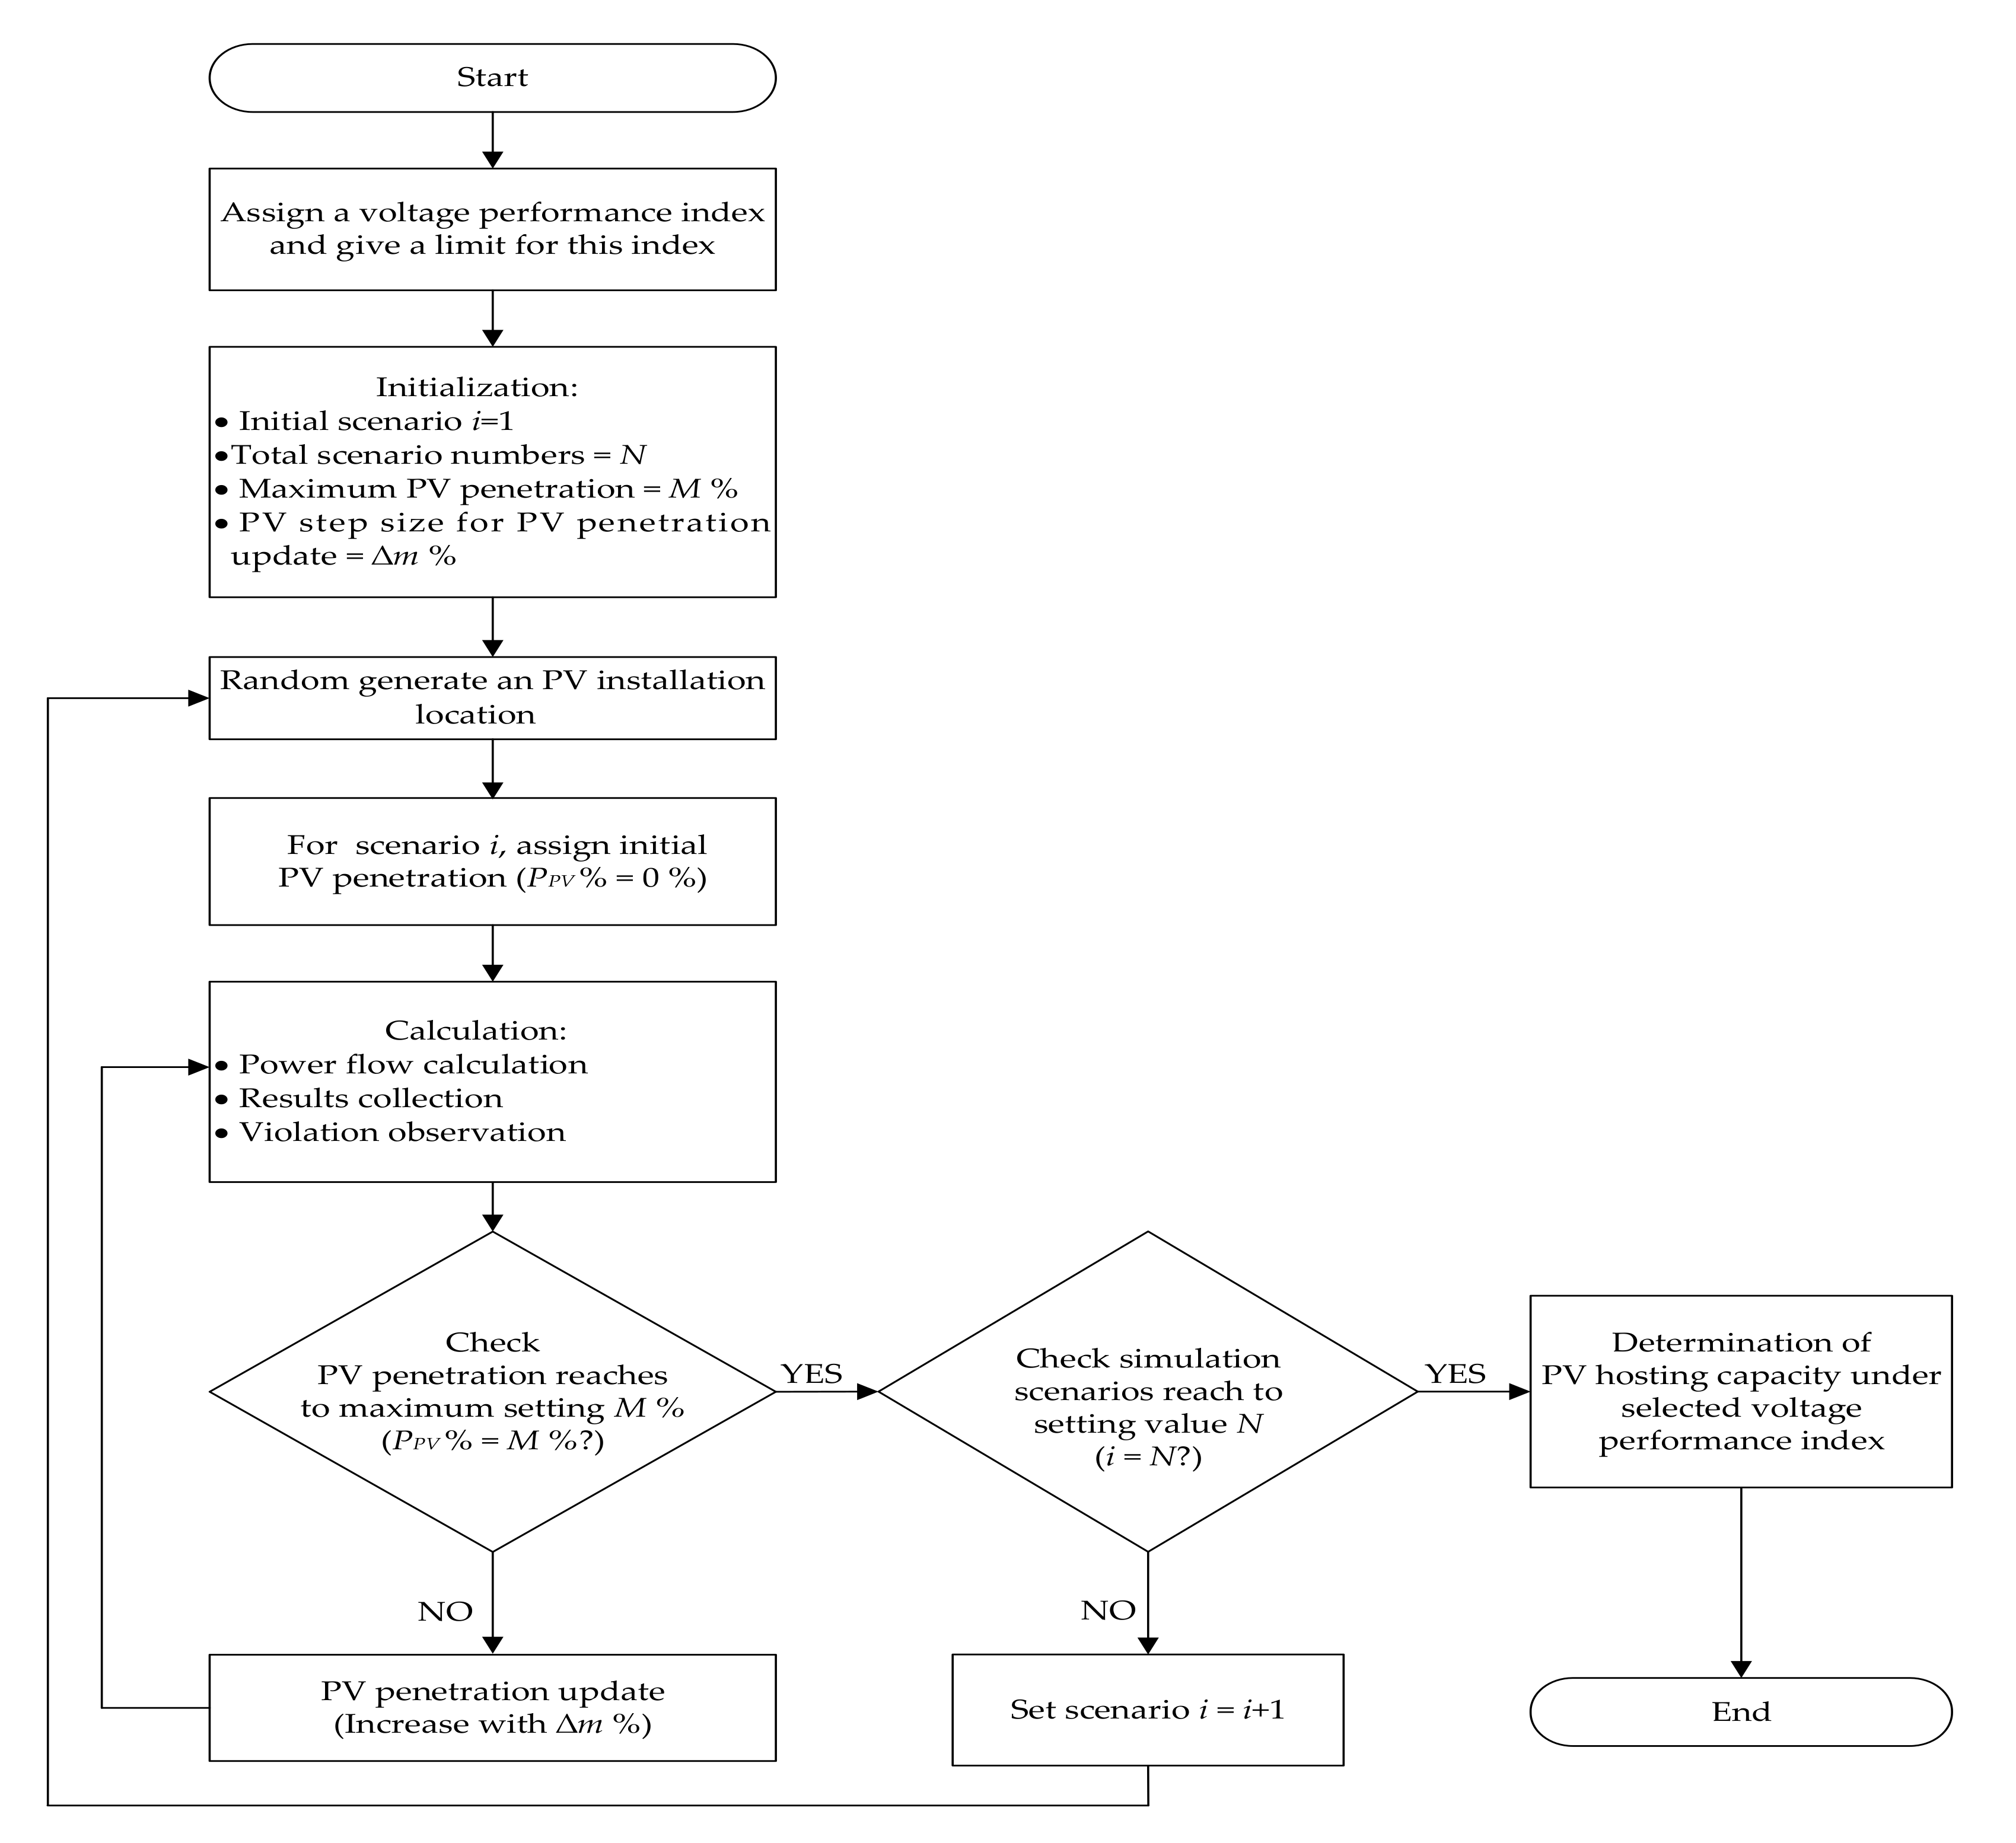
2.7. MATLB and OpenDSS Co-Simulation Mechanism
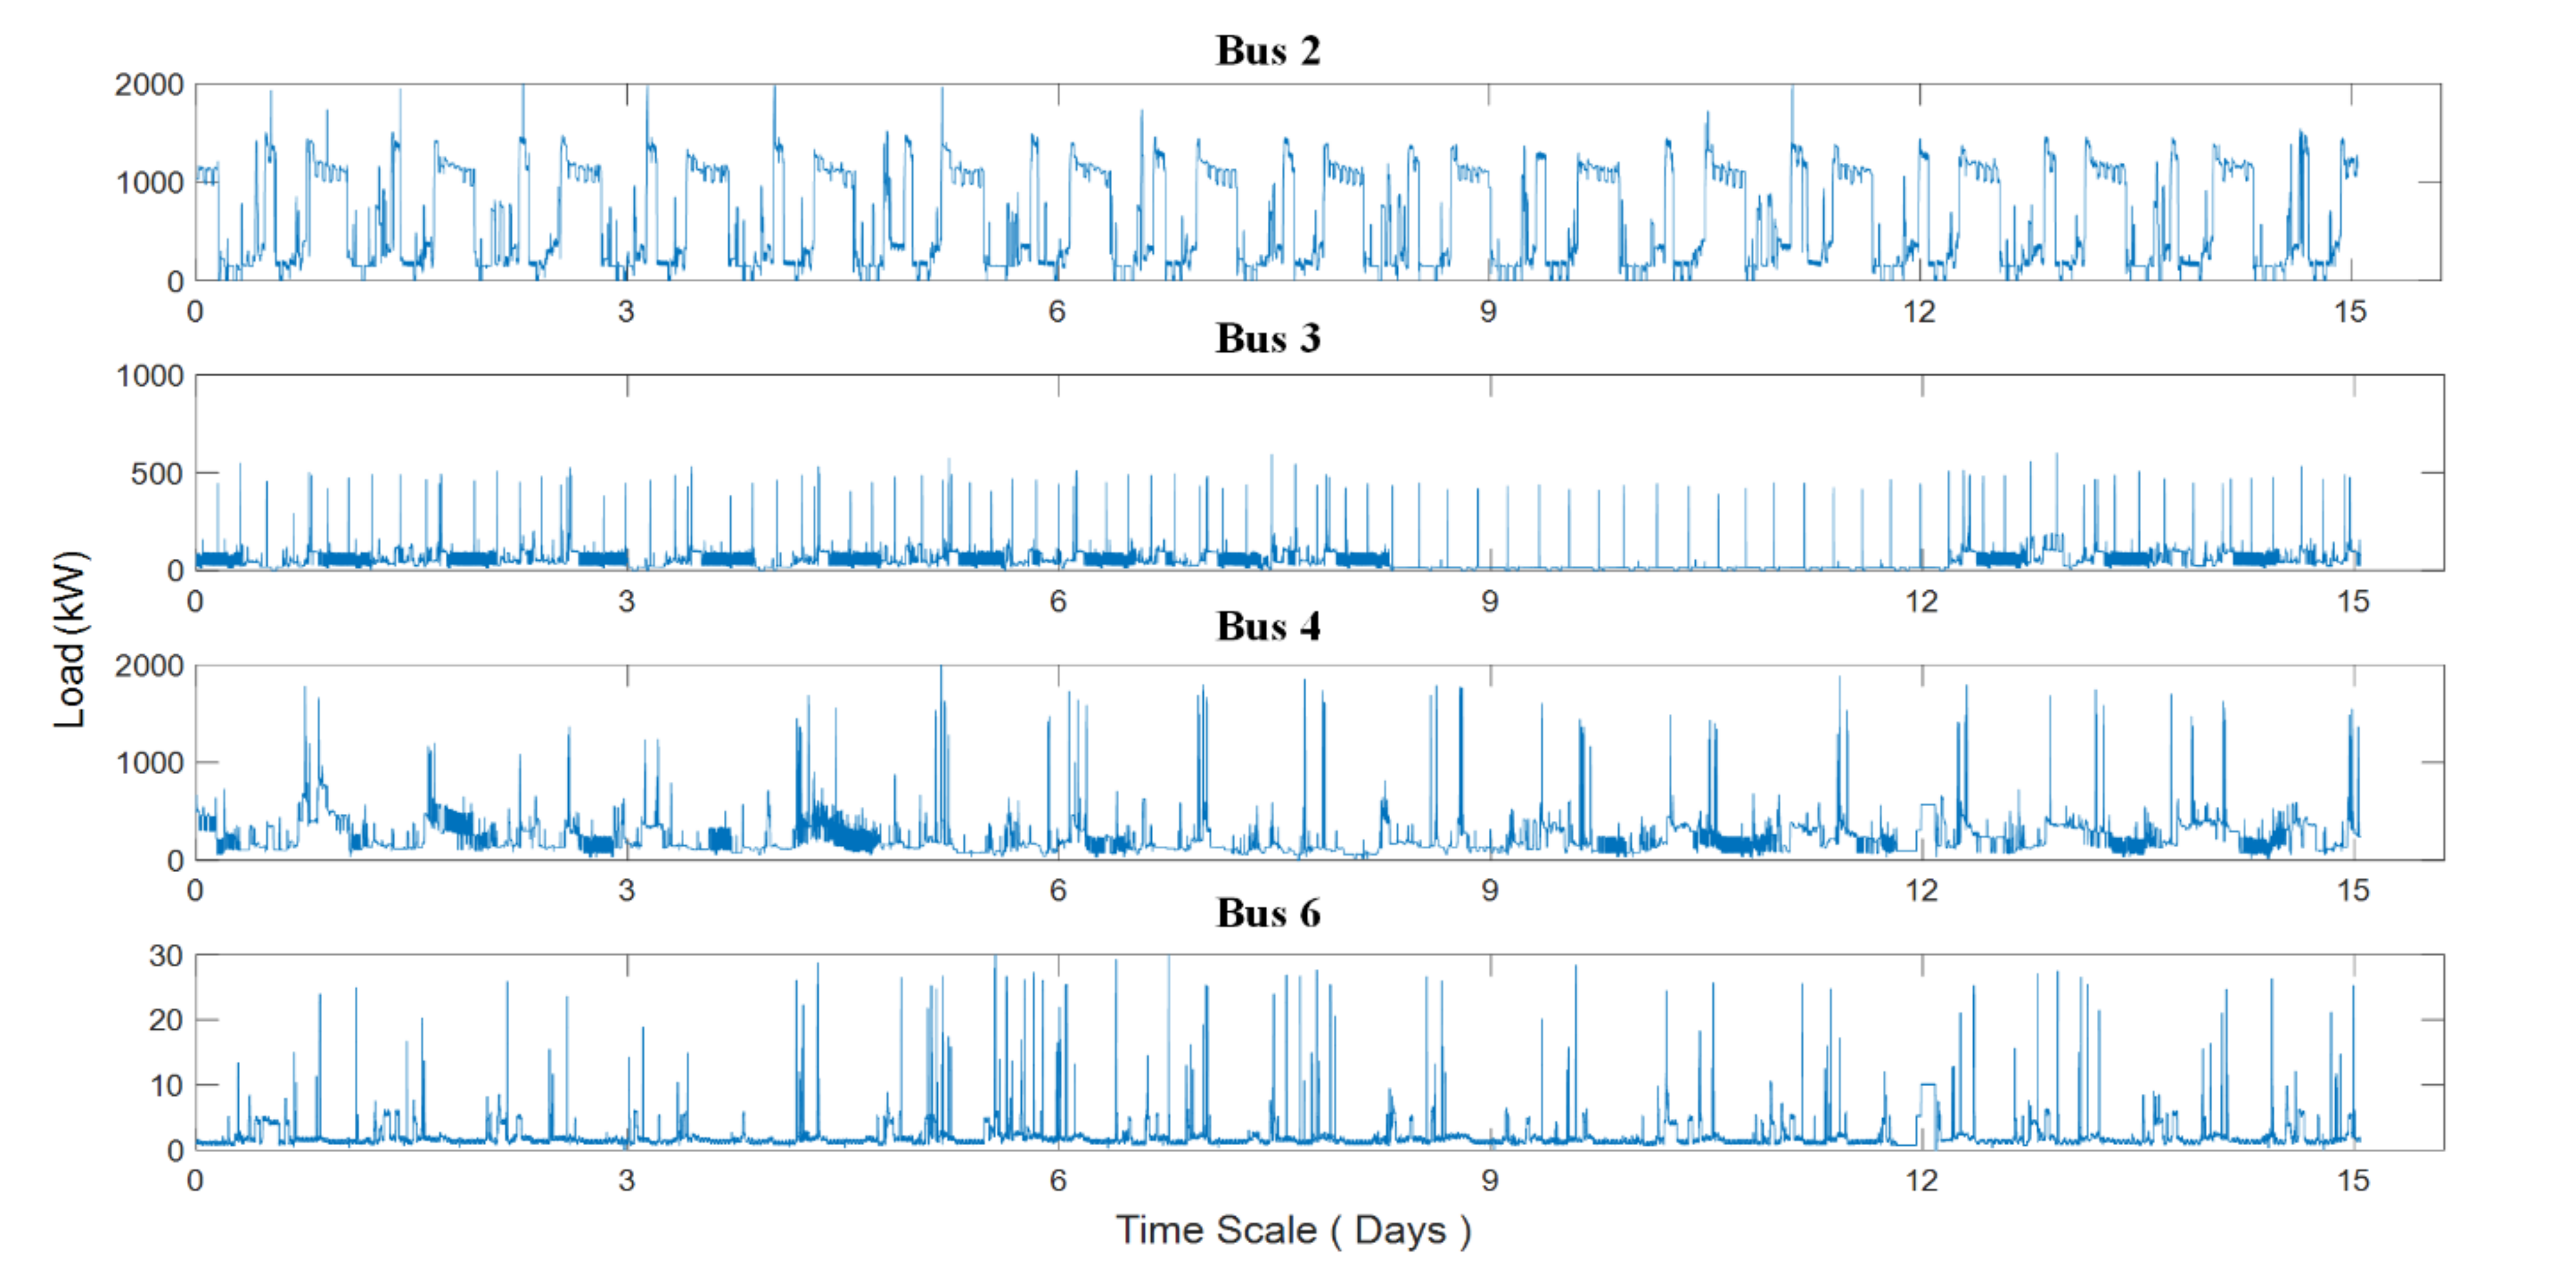
- Data input phase—in this phase, data of load profile and considered solar irradiance and temperature for PV are collected. These data can come from measurements of on-site metering facilities or records of supervisory control and data acquisition (SCADA) system, and the former is used in this study.
- Solution phase—first, OpenDSS script is used to build models for distribution feeders, PV power generations, and PV inverter controls based on test feeder parameters, received solar irradiance and temperature from the previous phase and designed control curves, respectively. Then, the implementation of GSAM/PSAM is achieved by MATLAB M-file program. MATLAB calculated results, i.e., PV deployments, are updated in OpenDSS by component object model (COM) interface for updated power flow execution.
- Result output phase—steady-state stochastic analysis results can be provided for PV impact study. It takes a large-scenario simulation for various PV deployments; meanwhile, the “worst case” response that occurs on the feeders is presented.
3. Simulations and Discussions
3.1. Case 1: PVHC Assessment under the PV Installations without Enhancement Techniques
- PVHC assessment under “Overvoltage” index—minimum PVHC of about 3800 kW (82% penetration) for GSAM and 3945 kW (85% penetration) for PSAM in Zone 1, respectively. Maximum PVHC of about 8000 kW (173% penetration) for GSAM and 8153 kW (176% penetration) for PSAM in Zone 2, respectively.
- PVHC assessment under “Voltage Deviation” index—minimum PVHC of about 2020 kW (44% penetration) for GSAM and 2080 kW (45% penetration) for PSAM in Zone 1, respectively. Maximum PVHC of about 4650 kW (100% penetration) for GSAM and 4808 kW (104% penetration) for PSAM in Zone 2, respectively. In this analysis, the permitted PV installation capacity on the distribution feeder may be less than that in “Overvoltage” index. It means the distribution feeder meets a higher impact to voltage deviation problem.
- PVHC assessment under “Voltage Imbalance” index—under the limitation of using 400% PV penetration setting, minimum PVHC is about 16,000 kW (346% penetration) for GSAM and 16,120 kW (348% penetration) for PSAM in Zone 1, respectively. Maximum PVHC is about 16,668 kW (360% penetration) for GSAM and 17,020 kW (368% penetration) for PSAM in Zone 2, respectively. The voltage imbalance problem in this analysis has a minor impact to the distribution feeder with high PV penetration.
3.2. Case 2: PVHC Assessment under the PV Installation with Enhancement Technologies
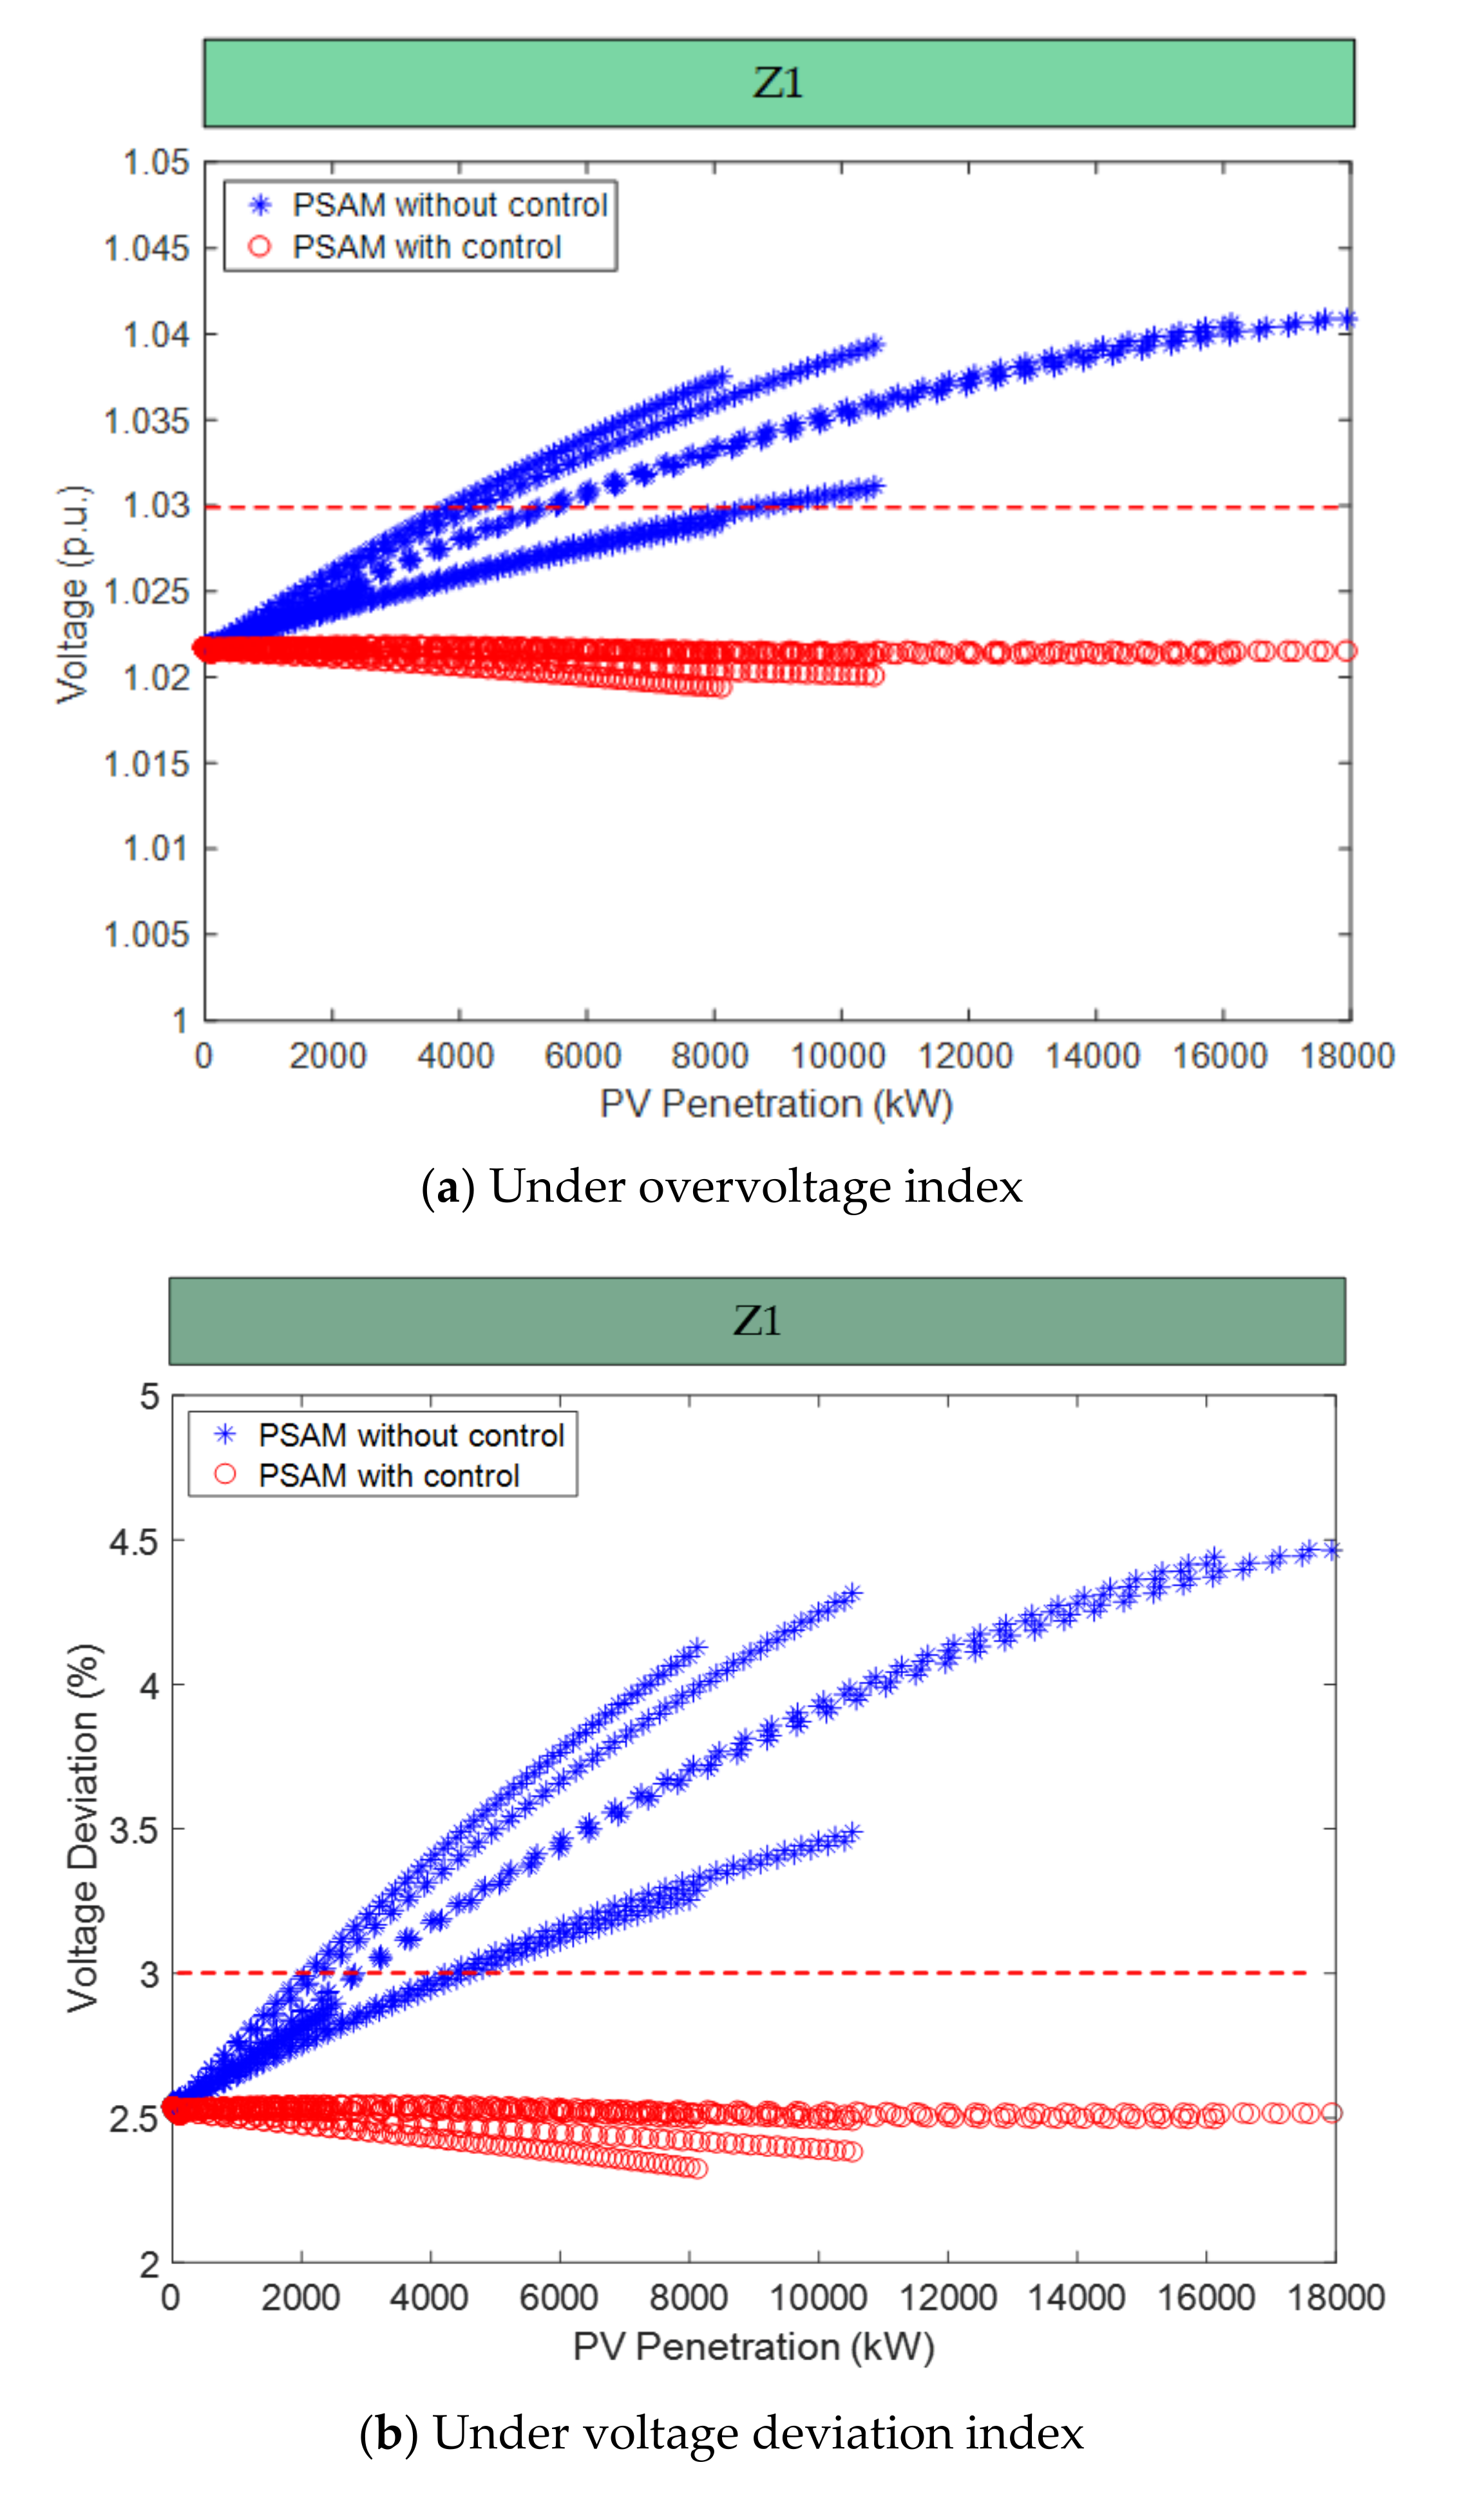
- PVHC enhancement under “Overvoltage” index—minimum and maximum PVHC of about 3945 kW (85% penetration) and 8153 kW (176% penetration) are respectively given from PSAM without using any control. With VVC control, PVHC enhances to 18,520 kW, which allows for all considered PV installation capacities, i.e., 400% penetration, to be installed to testing distribution feeder and without causing any violation on overvoltage.
- PVHC enhancement under “Voltage Deviation” index—minimum and maximum PVHC of about 2080 kW (45% penetration) and 4808 kW (104% penetration) are respectively given from PSAM without using any control. With VVC control, PVHC enhances to 18,520 kW, which allows for all considered PV installation capacities, i.e., 400% penetration, to be installed to testing distribution feeder and without causing any violation on voltage deviation.
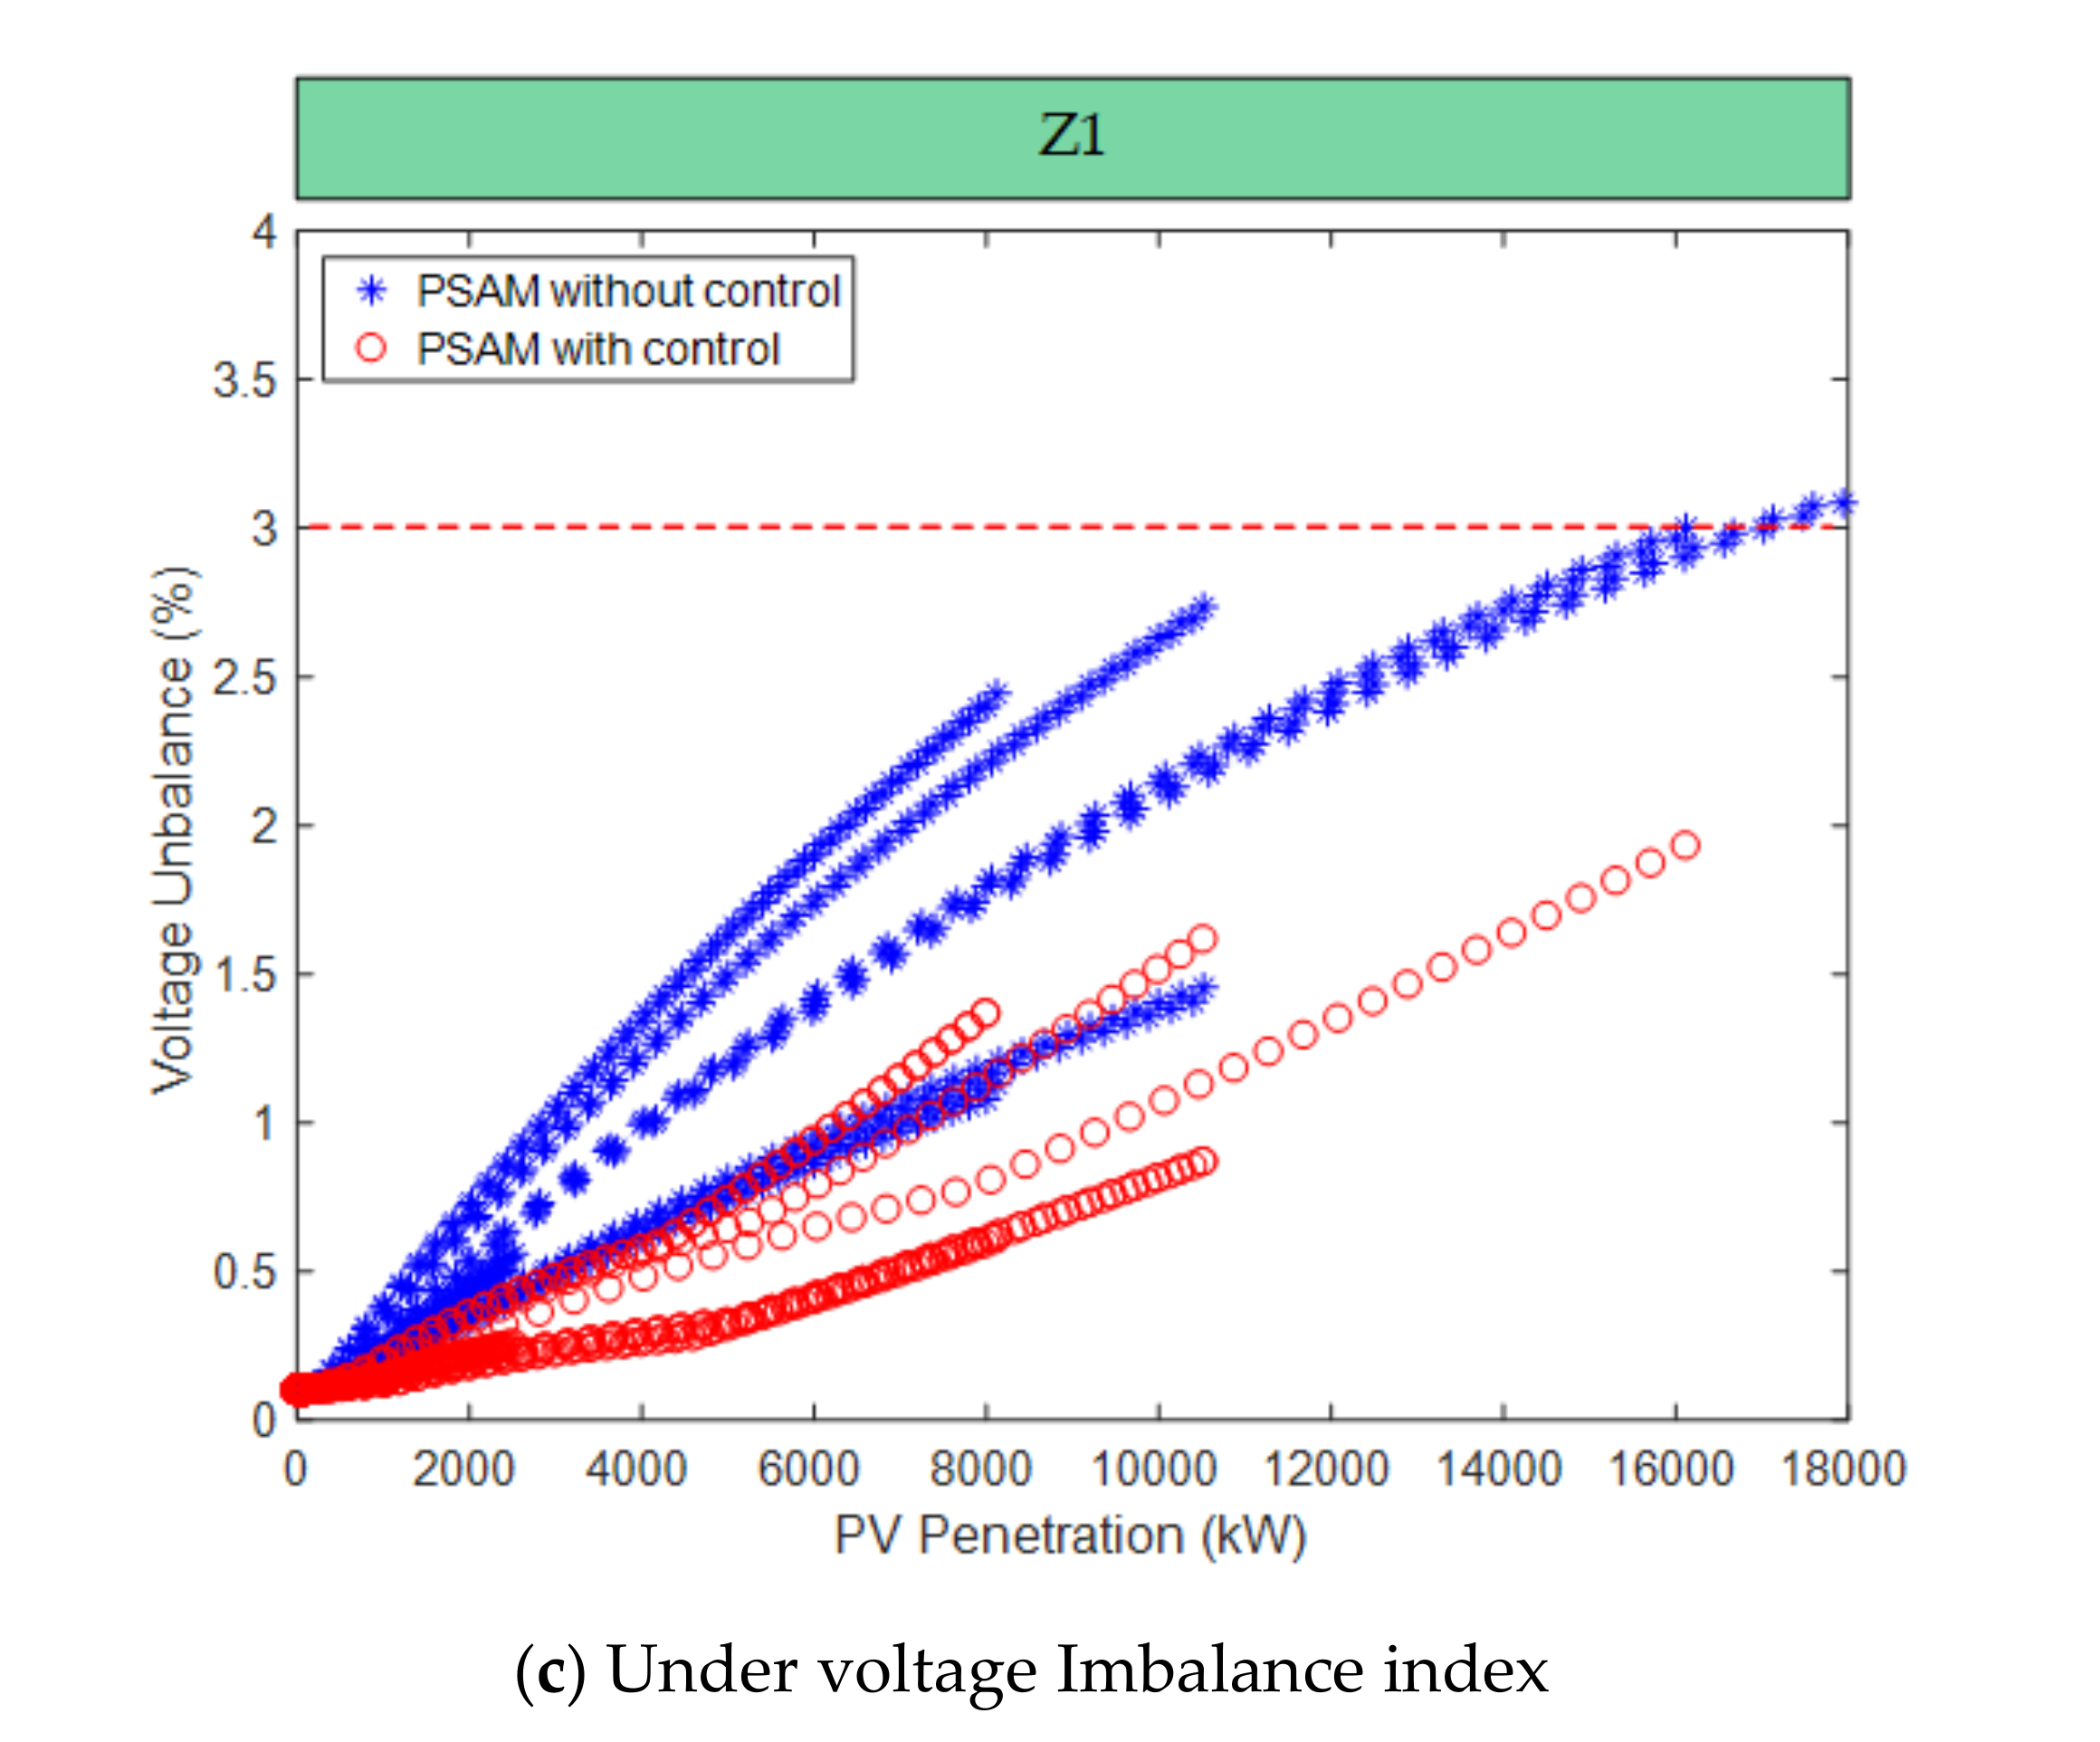
- PVHC enhancement under “Voltage Imbalance” index—minimum and maximum PVHC of about 16,120 kW (348% penetration) and 17,020 kW (368% penetration) are respectively given from PSAM without using any control. With VVC control, PVHC enhances to 18,520 kW, which allows for all considered PV installation capacities, i.e., 400% penetration, to be installed to testing distribution feeder and without causing any violation on voltage imbalance.
3.3. Discussion
- To create a more robust technique for the large-scale renewable energy integration applications;
- To investigate the sensitivity analysis study in order to find the affected factors and uncertainties in PVHC results;
- To develop optimization algorithms for prior elimination of unsuitable bus locations for PV installations, then speed up the performance on PVHC assessment;
- To investigate advanced PVHC enhancement techniques, such as implementation of various flexible AC transmission system (FACTS) equipment and energy storage and use of system reconfiguration;
- To study other hosting capacity analysis techniques, such as dynamic PVHC methods.
4. Conclusions
Author Contributions
Funding
Conflicts of Interest
Abbreviations
| PV | Photovoltaic |
| PVHC | Photovoltaic Hosting Capacity |
| RE | Renewable Energy |
| LV | Low-Voltage |
| MV | Medium-Voltage |
| EPRI | Electric Power Research Institute |
| SCE | Southern California Edison |
| SDG&E | San Diego Gas and Electric Company |
| PG&E | Pacific Gas and Electric |
| DERs | Distribution Energy Resources |
| GSAM | General Stochastic Analysis Method |
| PSAM | Proposed Stochastic Analysis Method |
| S/S | Secondary Substation |
| VVC | Voltage/Var Control |
| SCADA | Supervisory Control and Data Acquisition |
| COM | Component Object Model |
| AM 1.5G | Air Mass 1.5 Global |
| FACTS | Flexible AC transmission system |
Nomenclature
| PV penetration (%) | |
| i | scenario number |
| N | total scenario number |
| M | maximum PV penetration (%) |
| Δm | PV step size (%) |
| C | PV installation scenario combinations |
| n | total bus number with loads in the distribution feeder |
| m | number of bus selected from the total bus number n for PV installation |
| ΔV | voltage deviation rate (%) |
| V | bus voltage after PV installed into the distribution feeder (V) |
| original bus voltage without PV installation (V) | |
| VI | voltage Imbalance rate (%) |
| the magnitudes of phase voltages (V) | |
| the average of the three-phase voltages (V) |
References
- Executive Yuan, Two-Year Plan for Promoting Solar Photovoltaic Power Generation. Available online: https://energywhitepaper.tw/upload/201711/151080022394587.pdf (accessed on 8 September 2020).
- Kenneth, A.P.; Folly, K. Voltage rise issue with high penetration of grid connected PV. In Proceedings of the 19th World Congress of the International Federation of Automatic Control, Cape Town, South Africa, 24–29 August 2014. [Google Scholar]
- Long, C.; Ochoa, L.F. Voltage control of PV-rich LV networks: OLTC-fitted transformer and capacitor banks. IEEE Trans. Power Syst. 2016, 31, 4016–4025. [Google Scholar] [CrossRef]
- Zolkifri, N.I.; Gan, C.K.; Khamis, A.; Baharin, K.A.; Lada, M.Y. Impacts of residential solar photovoltaic systems on voltage unbalance and network losses. In Proceedings of the 2017 IEEE Region 10 Conference, Penang, Malaysia, 5–8 November 2017. [Google Scholar]
- Zhan, H.; Wang, C.; Wang, Y.; Yang, X.; Zhang, X.; Wu, C.; Chen, Y. Relay protection coordination integrated optimal placement and sizing of distributed generation sources in distribution networks. IEEE Trans. Smart Grid 2016, 7, 55–65. [Google Scholar] [CrossRef]
- Liang, X. Emerging power quality challenges due to integration of renewable energy sources. IEEE Trans. Ind. Appl. 2017, 53, 855–866. [Google Scholar] [CrossRef]
- Mithulananthan, N.; Saha, T.K.; Chidurala, A. Harmonic impact of high penetration photovoltaic system on unbalanced distribution networks-learning from an urban photovoltaic network. IET Renew. Power Gener. 2016, 10, 485–494. [Google Scholar]
- Heimbach, C.B.; Desmet, S.R.J.; Meyer, S.R.J. Power quality and electromagnetic compatibility. In Proceedings of the 25th International Conference on Electricity Distribution, Madrid, Spain, 3–6 June 2019. [Google Scholar]
- IEEE Standards for Interconnection and Interoperability of Distributed Energy Resources with Associated Electric Power System Interfaces. IEEE Std. 1547–2018, February 2018. Available online: https://standards.ieee.org/standard/1547a-2020.html (accessed on 10 September 2020).
- Standard for Inverter, Converter, Controllers and Interconnection System Equipment for Use with Distributed Energy Resources. UL 1741 SA, September 2016. Available online: https://standardscatalog.ul.com/ProductDetail.aspx?productId=UL1741 (accessed on 10 September 2020).
- Quintero-Molina, V.; Romero-L, M.; Pavas, A. Assessment of the hosting capacity in distribution networks with different DG location. In Proceedings of the 12th IEEE PowerTech Conference, Manchester, UK, 18–22 July 2017. [Google Scholar]
- San Diego Gas & Electric Company. Demonstration of Grid Support Functions of Distributed Energy Resources (DER). Electric Program Investment Charge (EPIC), EPIC-1, Project 4, December 2017. Available online: https://www.sdge.com/sites/default/files/EPIC-1%20Project%204_Module%203_Final%20Report_0.pdf (accessed on 10 September 2020).
- Pacific Gas and Electric Company. Demonstration A—Enhanced Integration Capacity Analysis, PG&E ICA Methodology Details and Technical Assumptions; Technical Report; Pacific Gas and Electric Company: San Francisco, CA, USA, 2016; Available online: https://drpwg.org/wp-content/uploads/2016/07/ICAWG_PGE_DemoA_Interim_Report_30-Sept-2016-1.pdf (accessed on 10 September 2020).
- Al-Alamat, F.; Faza, A. Distributed PV hosting capacity estimation and improvement: 33kV distribution system case study. Jordan J. Electr. Eng. 2017, 3, 224–234. [Google Scholar]
- Arshad, A.; Lindner, M.; Lehtonen, M. An analysis of photo-voltaic hosting capacity in Finnish low voltage distribution networks. Energies 2017, 10, 1702. [Google Scholar] [CrossRef] [Green Version]
- Zio, E.; Delfanti, M.; Giorgi, L.; Olivieri, V.; Sansavini, G. Monte Carlo simulation-based probabilistic assessment of DG penetration in medium voltage distribution networks. Electr. Power Energy Syst. 2015, 64, 852–860. [Google Scholar] [CrossRef] [Green Version]
- Apostolopoulou, D. Effect of solar and wind generation integration of feeder hosting capacity. In In Proceedings of the IEEE PES Transmission and Distribution Conference and Exposition, Dallas, TX, USA, 3–5 May 2016. [Google Scholar]
- Dubey, A.; Santoso, S. On estimation and sensitivity analysis of distribution circuit’s photovoltaic hosting capacity. IEEE Trans. Power Syst. 2017, 32, 2779–2789. [Google Scholar] [CrossRef]
- Torquato, R.; Salles, D.; Pereira, O.C.; Meira, M.C.P.; Fretas, W. A comprehensive assessment of PV hosting capacity on low-voltage distribution systems. IEEE Trans. Power Deliv. 2018, 33, 1002–1012. [Google Scholar] [CrossRef]
- Wang, S.; Dong, Y.; Yan, B. Interval overvoltage risk based PV hosting capacity evaluation considering PV and load uncertainties. IEEE Trans. Smart Grid 2020, 11, 2709–2721. [Google Scholar] [CrossRef]
- Smith, J.W.; Dugan, R.; Rylander, M.; Key, T. Advanced distribution planning tools for high penetration PV deployment. In In Proceedings of the IEEE Power and Energy Society General Meeting, San Diego, CA, USA, 22–26 July 2012. [Google Scholar]
- Coogan, K.; Reno, M.J.; Grijalva, S.; Broderick, R.J. Locational dependence of PV hosting capacity correlated with feeder load. In In Proceedings of the IEEE Power and Energy Society T&D Conference and Exposition, Chicago, IL, USA, 14–17 April 2014. [Google Scholar]
- Jonsson, D.O. Conservative Estimation of Overvoltage-Based PV Hosting Capacity. Master’s Thesis, The University of Texas at Austin, Austin, TX, USA, August 2014. [Google Scholar]
- Chang, G.W.; Tang, N.C. A stochastic approach for determining PV hosting capacity of a distribution feeder considering voltage quality constraints. In In Proceedings of the 18th International Conference on Harmonics and Quality of Power, Ljubljana, Slovenia, 13–16 May 2018. [Google Scholar]
- Hoke, A.; Bulter, R.; Hambrick, J.; Kroposki, B. Steady-state analysis of maximum photovoltaic penetration levels on typical distribution feeders. IEEE Trans. Sustain. Energy 2013, 4, 350–357. [Google Scholar] [CrossRef]
- Keller, T.M.; Trotter, T.W. Applied Combinatorics. Chapter 2. 2017. Available online: https://www.rellek.net/book-2017/app-comb-2017.pdf (accessed on 2 November 2020).
- Arshad, A.; Püvi, V.; Lehtonen, M. Monte carlo-based comprehensive assessment of PV hosting capacity and energy storage impact in realistic Finnish low-voltage networks. Energies 2018, 11, 1467. [Google Scholar] [CrossRef] [Green Version]
- Ding, F.; Nagarajan, A.; Chakraborty, S.; Baggu, M.; Nguyen, A.; Walinga, S.; McCarty, M.; Bell, F. Photovoltaic Impact Assessment of Smart Inverter Volt-Var Control on Distribution System Conservation Voltage Reduction and Power Quality; Technical Report, NREL/TP-5D00-67296; National Renewable Energy Laboratory: Golden, CO, USA, 2016. [Google Scholar]
- IEEE Recommended Practice for Electric Power Distribution for Industrial Plants. IEEE Std. 141-1993, April 1994. Available online: https://doi.org/10.1109/IEEESTD.1994.121642 (accessed on 17 September 2020).
- Taiwan Power Company, Renewable Energy Power Generation System Interconnection Technology Act. 2016. Available online: http://www.taipower.com.tw (accessed on 17 September 2020).


| Index | Description | Limits |
|---|---|---|
| Overvoltage | Feeder voltages exceed nominal 1.0 p.u. | 1.03 p.u. |
| Voltage Deviation | Deviation in voltage from no PV installation to full PV installation | 3% |
| Voltage Imbalance | Unbalanced PV installation on different phase | 3% |
| Index | Overvoltage | Voltage Deviation | Voltage Imbalance | |
|---|---|---|---|---|
| Method | ||||
| GSAM | 616 s | 2366 s | 633 s | |
| PSAM | 592 s | 2350 s | 615 s | |
| Controls | Without Control | With VVC | |
|---|---|---|---|
| Index | |||
| Overvoltage | Min PVHC: 3945 kW (85% penetration) Max PVHC: 8153 kW (176% penetration) | 18,520 kW (400% penetration) | |
| Voltage Deviation | Min PVHC: 2080 kW (45% Penetration) Max PVHC: 4808 kW (104% penetration) | 18,520 kW (400% penetration) | |
| Voltage Imbalance | Min PVHC: 16,120 kW (348% Penetration) Max PVHC: 17,020 kW (368% penetration) | 18,520 kW(400% penetration) | |
Publisher’s Note: MDPI stays neutral with regard to jurisdictional claims in published maps and institutional affiliations. |
© 2020 by the authors. Licensee MDPI, Basel, Switzerland. This article is an open access article distributed under the terms and conditions of the Creative Commons Attribution (CC BY) license (http://creativecommons.org/licenses/by/4.0/).
Share and Cite
Liu, Y.-J.; Tai, Y.-H.; Lee, Y.-D.; Jiang, J.-L.; Lin, C.-W. Assessment of PV Hosting Capacity in a Small Distribution System by an Improved Stochastic Analysis Method. Energies 2020, 13, 5942. https://doi.org/10.3390/en13225942
Liu Y-J, Tai Y-H, Lee Y-D, Jiang J-L, Lin C-W. Assessment of PV Hosting Capacity in a Small Distribution System by an Improved Stochastic Analysis Method. Energies. 2020; 13(22):5942. https://doi.org/10.3390/en13225942
Chicago/Turabian StyleLiu, Yu-Jen, Yu-Hsuan Tai, Yih-Der Lee, Jheng-Lung Jiang, and Chen-Wei Lin. 2020. "Assessment of PV Hosting Capacity in a Small Distribution System by an Improved Stochastic Analysis Method" Energies 13, no. 22: 5942. https://doi.org/10.3390/en13225942