Abstract
The measurement and analysis of partial discharges (PD) are like medical examinations, such as Electrocardiogram (ECG), in which there are preestablished criteria. However, each patient will present his particularities that will not necessarily imply his condemnation. The consolidated method for PD processing has high qualifications in the statistical analysis of insulation status of electric generators. However, although the IEEE 1434 standard has well-established standards, it will not always be simple to classify signals obtained in the measurement of the hydro generator coupler due to variations in the same type of PD incidence that may occur as a result of the uniqueness of each machine subject to staff evaluation. In order to streamline the machine diagnostic process, a tool is suggested in this article that will provide this signal classification feature. These measurements will be established in groups that represent each known form of partial discharge established by the literature. It was combined with supervised and unsupervised techniques to create a hybrid method that identified the patterns and classified the measurement signals, with a high degree of precision. This paper proposes the use of data-mining techniques based on clustering to group the characteristic patterns of PD in hydro generators, defined in standards. Then, random forest decision trees were trained to classify cases from new measurements. A comparative analysis was performed among eight clustering algorithms and random forest for choosing which is the superior combination to make a better classification of the equipment diagnosis. R2 was used for assessing the data trend.
1. Introduction
Due to the increasing demand for electric energy currently signaled by the market, generators are operating close to their maximum capacities for longer periods. This operating condition causes additional stress to generators and, consequently, they are more susceptible to failures [1]. In this context, failures in stator windings become a real possibility and come from four main factors, which are named TEAM factor in IEC 60505 standard (International Electrotechnical Commission): high temperatures, high electrical stress, inadequate environment conditions around windings, and mechanical reasons. All these factors have a great potential to generate partial discharges and decisively influence winding lifespan reduction [2,3].
Partial discharges’ measurements are widely used to establish a diagnosis concerning the equipment’s electrical insulation. Deterioration caused by the mentioned factors can be traced by monitoring the discharge evolution and, consequently, it can act in the insulation as preventive maintenance, when the problem is still at the beginning, reducing the risks of a possible unexpected failure [3].
Although the methods based on partial discharges’ measurement are widely used, the diagnostics presented regarding stator winding insulation have yet a very empirical basis. It is necessary for an expert to analyze all graphical results obtained from the measurements, to determine in which patterns each discharge fits and how severe it is to the equipment security, considering also trend curves of PD levels for the specific equipment. The main forms of graphical analysis are phase-resolved partial discharge (PRPD) and pulse height analysis (PHA) [2,3].
Facilitating the process of PDs’ analysis interpretation will certainly speed up maintenance programs and preventive actions on the equipment before it presents a severe defect that can generate problems of greater proportion, thus reducing the equipment time unavailability. So, it is important to develop tools and methods that allow a better evaluation of equipment condition. Several proposals have been proposed in the literature addressing the interpretation of partial discharges’ results, and worth mentioning are those based on machine-learning (ML) and data-mining (DM) techniques as viable solutions due to their capacity of systematically and automatically processing a large volume of information [4,5].
Based on exhaustive offline studies, ML and DM usually discover relations between attributes and objectives in a given database. Several ML and DM techniques need different data treatment, generally known as data preprocessing. This step involves acts such as standardization and spurious data treatment, among others [1,4,5]. Several applications based on DM and ML have been proposed in power system issues [6,7,8].
Over the years, many researchers have proposed methods for partial discharges’ patterns’ automatic classification or made relevant contributions to perform the obtained data analysis more accurately. In 2008, decision-tree (DT) and data-mining methods were used to identify partial discharges’ patterns, but only three pattern types were mapped, namely, corona, internal discharges, and surface discharges [9]. In 2010, the same authors as in [9] made advances in research and continued to use DM to analyze raw data measurements and validated the proposed method by using the techniques of back propagation neural network, self-organizing map, and support vector machine to obtain a predictive model [10].
An overview on partial discharges in high voltage equipment using PD raw data was performed in [11] using k-means techniques to cluster signals. In another approach, neural networks were applied to classify partial discharges’ signals into six types using real measurement data from high-voltage motors [12]. In [13], a preliminary technique to identify simultaneous PDs’ sources was proposed, also comparing the identification performance for different input features and different combinations of ML techniques.
A simulation-based software proposal for PDs’ recognition using backpropagation neural network was presented in 2015, in which five noise signals and four partial discharges were simulated, making random combinations of these signals, whose results generated a database, so that possible patterns’ recognition and analyses could be done [14]. A bibliographic survey until 2016 on the advances of neural network (NN) applications for PDs’ automatic classification in high-voltage equipment was carried out in [15]. This work raised several suggestions to improve the way neural networks’ training is performed, highlighting also difficulties faced by researchers in developing neural networks’ models, making comments on new techniques for results’ optimization.
A proposal for automatic PD classification in hydro generators’ windings using NN based on the concept of image projection resulted in the identification of only four patterns [16]. Another approach, in [17], used machine-learning techniques to classify a database composed of 352 PRPD measurements obtained from a generator of 37.5 MW and 12.5 kV, in which 96 attributes were extracted for the computational process of obtaining clusters. Despite the high accuracy, of 95%, the proposed system managed to obtain only four clusters, three corresponding to known patterns (slot discharges, internal discharges, and delamination) and the fourth cluster categorized another measurement not fitted in the previously mentioned.
One way to classify PDs was proposed in [18] based on visual data analysis to create a PD source classifier with minimal labeled data. Trying to work around the problem of lack of database labeling, the proposal is based on the PDs’ positive and negative signals’ symmetry using a convolutional variational autoencoder to determine the best database for training and improving the classifier. However, the overall hit rate was not higher than 65% in the clusters’ formation. One problem was the massive high dimensionality of unlabeled data, which is a difficulty for using several DM and ML techniques [18,19].
Considering the great difficulty of characterizing PD signals and the large amount of data that is generated in permanent monitoring systems, this article proposes to establish a methodology based on DM techniques for automatic diagnosis of incipient failures in hydro generators’ stator windings.
The main contributions of this article are: (1) a database creation approach with real cases of PDs’ measurement, applying clustering techniques in the pulse height analysis to create labels for the PDs’ types, (2) using the created database to train a random forest (RF) tree to quickly classify new cases, and (3) it was proposed to use the determination coefficient (R2) to monitor the PDs’ variation trends, to update the clusters and RF training database. In developing the proposed procedures, real PDs’ measurements acquired from hydro generators in the Tucurui Hydroelectric Power Plant were used. The clustering results were compared with standards and patterns of partial discharges already predetermined using IEC 60270 and IEEE 1434 standards [20,21].
This paper is structured as follows. In Section 2 an introduction to partial discharges in hydro generators is presented. In Section 3 a brief introduction about RFs and clustering is presented. In Section 4 the details of the proposed approach are described. The results are presented in Section 5, testing and comparing the proposed approach using eight clustering algorithms, and the quality of generated ML models is also evaluated. In Section 6 conclusions are presented.
2. Partial Discharges
Partial discharges can be understood as “sparks” involved in a flow of electrons and ions in small air volumes encapsulated in cavities, configuring themselves as defects in the insulation material. These defects are characterized as a space not impregnated by insulating material and that can enclose gases [22]. Thus, if there is a cavity inside or in the surface of an insulator, it can provoke partial discharges, as it will imply a potential difference through it [23].
Therefore, norms are established and must be followed for the basis of concepts and patterns of partial discharges in rotating machines. Among these norms, IEC 60270, IEC 60034-27-2, and IEEE 1434 are highlighted. These standards establish patterns and procedures for graphical analysis of PDs.
Graphic analyses are established in two focuses. The first encompasses an analysis of the magnitude and quantization of partial discharges’ pulses as a function of the AC phase position PRPD. The second establishes an analysis criterion according to the number of pulses recorded per second in each magnitude interval [23]. This second chart was chosen in order to simplify the reading and organization of PDs’ data.
Pulse height analysis’ charts have a logarithmic division of discharge pulses on their vertical axis and division into 17 points of magnitude on the horizontal axis. These established divisions provide information about the intensity and type of occurrence. Each horizontal axis point displays an average of the amount of pulses at a given axis magnitude. In this way, curves will be formed that will determine the standards required for the analysis [23,24].
Phase-resolved partial discharge presents all pulses of partial discharges captured by the coupler, showing the phases in which they are occurring. This set of factors will establish the severity and type of partial discharge. When dealing with these two analysis forms, both will provide the magnitude and pattern, which are the objects of study in this research, with the difference that in PHAs’ analysis the information is condensed [23,24].
The partial discharges’ measurement establishes the degradation conditions of the stator windings’ insulation and, therefore, new measurement systems are created and/or improved in order to have clearer and more reliable measurement results. These measurements are performed through a computer connected through coaxial cables to the machine terminals. This coupling is the way to communicate with capacitive couplers installed in the hydro generator stator that pick up the partial discharge signal.
Through the intensive measuring tool, installed in each generator for a monthly period, continuous measurements are carried out. This makes it possible to analyze the intensity of the generator partial discharges over time. The results of measurements are PRPD, which, for this work, was transformed into PHAs. It is emphasized that the chosen hydro generator had 864 slots, 24 sensors distributed at eight per phase. Figure 1 shows the typical measurement arrangement employed, presenting, highlighted on the screen, the statistical map of magnitude and characteristic phase of a PD under analysis.
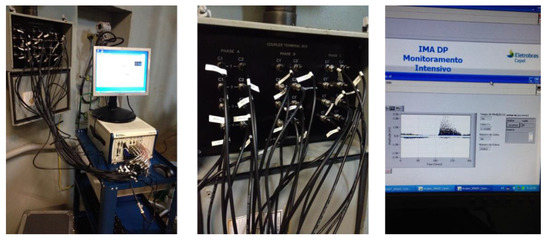
Figure 1.
Measurement arrangement and screen displaying a PRPD resulting from the partial discharge measurement.
Figure 1 shows, on the left side, a general overview of the measurement arrangement, highlighting, in the middle picture, the terminal box, which is accessing the partial discharge signals emitted by the couplers installed along the stator windings. The coaxial cables make contact at these terminals and the other ends are inserted in an oscilloscope. The oscilloscope output is connected to the computer where the software performs the signals’ filtering. On the right of Figure 1, a PRPD map of the partial discharge signal from one of the measuring terminals is presented.
2.1. Test Circuit
To perform the test shown in Figure 1, capacitive couplers must be installed parallel to the stator winding and, by means of a measuring impedance, it is possible to capture the partial discharge signal, through the contact terminals and coaxial cables, and it is computationally treated so that there is fidelity and clarity in the data obtained.
In this way, PD signals are measured through capacitive couplers, so 80 pF capacitors are used in the Hydro Power Plant (HPP) machines in Tucuruí. The number of couplers to be installed depends on the type of installation chosen, machine model, and history of incidents. In the generator under study, 24 sensors were used (12 pairs), but it is recommended to use one pair of couplers per phase when performing the differential installation, which implies noise rejection achieved based on the time of arrival of pulses from the two couplers. This method is described in the IEEE 1434-2000 standard [21,25].
The coupler’s location along the stator windings is shown in Figure 2, which is an image taken from the Eletronorte Eletrobras Electric Generation Utility installation manual, together with the differential installation model presented in the IEEE 1434-2014 standard. However, although the type of installation already had noise removal, it was still necessary to perform other computational filtering to obtain the signal as established by the standards, as described in Section 2.2.
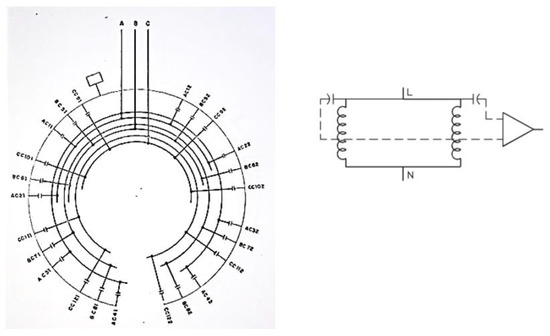
Figure 2.
Coupler installation model along the stator and schematic drawing of the IEEE 1434-2014 standard [21,25].
2.2. Digital Partial Discharge Measurement System
A digital measurement system (shown in Figure 3) for partial discharges receives two input signals: a partial discharge signal and a voltage corresponding to the test voltage applied to the object, in this case the voltage to which the generator is subjected.
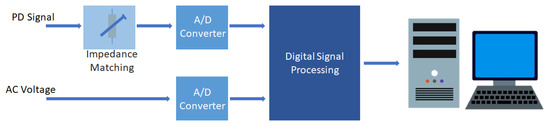
Figure 3.
Basic diagram of a digital measurement system [26].
This data acquisition system records for each pulse its amplitude, phase angle, and applied voltage. The PD signal, after going through an analog circuit designed to match impedances, will be digitized together with the applied voltage signal.
In the digital signal processing step, signal filtering operations are performed according to the selected measurement band and detection of the PD signal peak amplitude, in which the pulse and pulse screening algorithms’ [20,26] waveform is processed and created. This step is crucial for the noise suppression performance.
High processing speed is essential to establish accuracy and this is established using FPGA (field programmable gate array) devices, in which the functionalities are defined by the user.
The digital signal processing used by IMA-DP, a PD acquisition system developed by CEPEL [26], can be described in seven distinct steps in order to remove noise and obtain a partial discharge signal as accurately as possible, reproducing the electric machine operating condition, according to [26,27]. In these steps, two processes are established: the digital signal conditioning through filters and the measurement completion provided to the user, shown in Figure 4.
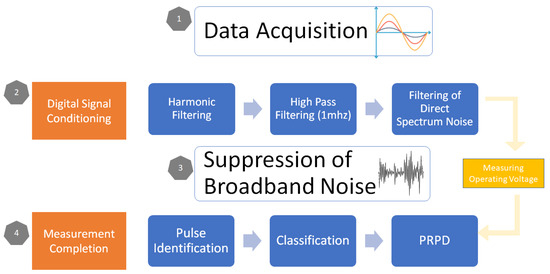
Figure 4.
Digital processing of PD signals.
- Harmonic filtering to eliminate harmonic noise from the electric network-applied voltage.
- Signals’ high pass filtering at 1 MHz.
- Filtering of direct spectrum noise.
- Broadband noise filtering.
- Peak identification and detection of individual PD pulses.
- Pulses’ classification.
- Representing information on the PRPD map.
3. Data Mining
The effectiveness of machine-learning algorithms depends primarily on the database and the type of metric used to assess the distance or similarity measure between vectors in the input space. [17,18,19]. The proposed process here of identifying patterns is known as data mining [28], a strategy for finding useful information embedded in large volumes of data. DM is an integral part of a larger process, known as knowledge discovery in databases (KDD), which, in turn, consists of a series of steps [29]. Basically, DM has two types of tasks. Predictive tasks predict the value of a given attribute based on the values of its characteristics. Supervised classification is an example of predictive tasks. Descriptive tasks establish correlations, trends, anomalies, and even groupings within large volumes of data. Clustering is a typical descriptive task example.
In this article, a hybrid approach was used between predictive and descriptive tasks, as it performs clustering for grouping patterns and decision trees, known as random forest, for prediction purposes.
3.1. Clustering
Clustering is intended to group similar records by creating new classes. It is an extremely useful mining task, given that people instinctively visualize segmented data in discrete groups, such as types of cars or motorcycles. Clustering provides unsupervised classification of patterns into groups called clusters. Clusters are established by data with similar characteristics, from the relationships that measure the distance between a pair of patterns in a space of characteristics and can be measured by the Euclidean distance. In this work the technique used was K-MEANS, where the following steps are made [28,29,30]:
- Choose k points, within the characteristic space, representing the k clusters’ centers in which it is desired to divide the dataset.
- Assign each pattern to the nearest center based on the similarity function.
- Recalculate cluster centers using the member data for each cluster.
- Repeat the algorithm from item two until the stop criterion is reached.
The K-Means technique has variations, which were used in this article, in order to find the best performance for partial discharges’ classification.
- Bregman divergences for K-means using the square Euclidean distance: Bregman divergence is a set of loss or distortion functions. It uses the same K-means method, being the Bregman divergence or distance, having similarities to the metric, but does not satisfy triangular inequality or symmetry, but has the property of minimizing the distance between the test point and the mean. One of the applicable forms used is the square Euclidean distance. As an example, for a single dimension the equation would reduce to the squared difference between points x and y, the function φ(x) = hx, x is convex, differentiable in Rd, such as in Equation (1) [17,18,19].
- Numerical measurements using Euclidean distance: In this method, the K-means’ algorithm is followed as described previously, but uses for the calculation the Euclidean distance, which seeks the direct distance between the metrics and, by definition, is the sum of the square root of the difference between x and y in their respective dimensions. This is a general method without restriction [31]. Equation (2) presents this distance.
- Numerical measurements using dynamic time distortion distance (DTW): This method applies in the calculations of k-means’ distances the DTW that is used to find the optimal nonlinear alignment between two sequences of numerical values. In this way, it is possible to find patterns between measurements of events with different sequences and different lengths. So, DTW can align any type of data that conform temporal order [32], given by Equation (3):
- Numerical measurements using Euclidean kernel distance: Kernel mapping is used. It computes the distance of Mahalanobis parameterized in the space of characteristics, known as feature space. The essential idea encompassed by the algorithm is to explore data nonlinearity, defining the clusters’ formation in the space of characteristics. The distance of the points in the characteristic space must be expressed in terms of a kernel function and, thus, it is possible to evaluate the distance of each vector x to a given center c [17,18,19].
- Numerical measurements using cosine similarity: In this type of metric similarity analysis, the angular distance between two vectors from the origin is evaluated in an established two-dimensional or multidimensional space. The smaller the angle between these points, the greater the cosine value obtained and, consequently, the greater the similarity between them [33]. Equation (4) presents this distance.
- Numerical measurements using Manhattan distance: In this metric, the absolute distance between two coordinate points in the system is established. This method can offer a performance superior to the Euclidean distance when it comes to high-dimension data, since they can result in the improvement of the results of distance-based algorithms, such as clustering [34]. Equation (5) presents this distance.
- Numerical measurements using Chebyshev distance: In this type of metric evaluated, the distance between two vectors is determined within a bi- or multidimensional space, which is the biggest of the differences between their coordinate dimensions, that is, the maximum value of the modules of the differences in points [34], as presented in Equation (6).
- Numerical measurements using correlation similarity: In this metric there is a linear correlation between the attribute of two vectors, and it is recommended for the grouping between variables. It establishes the reading of data that are statistically corresponding or incompatible between them, causing the level of similarity between them to be provided [35]. Equation (7) shows this distance.
3.2. Random Forest
Random forest is a method that combines Breiman’s bagging sampling approach and the random selection of features to create an ensemble learning. Usually, RF is applied to classification and regression problems [36]. In this method, a collection of decision trees is constructed based on database replacement sampling. Further, randomization is used to reduce the correlation between the decision trees and, consequently, reduce the variance of the predictions (i.e., the average of decision trees). Due to the ensemble creation of several DTs, it is necessary to elect the result by majority voting to classify each instance. Since each tree acts as a unique classifier, the classification result will be that one class label more voted among all DTs [37,38]. Figure 5 summarizes the RF workflow.
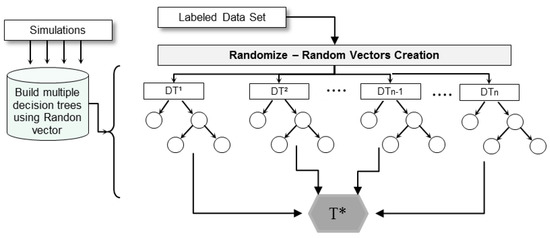
Figure 5.
Random forest schematic example. Where T* is majority voting to classify each instance [36,37,38].
Advantages of both RF and DTs are good accuracy and they can be faster than bagging or boosting approaches. They are simple and easily parallelized. In addition, RF can be used for both classification tasks and regression purposes and can provide interpretability according to RF size [28,29,30,31,39].
4. Data-Mining Application in Partial Discharge on Hydro Generator
Currently, PDs’ monitoring is carried out through measurement campaigns, in which their results are analyzed and discussed by engineers and maintainers. However, the trend of continuous measurement processes is a premise for maintenance based on the equipment condition. The large amount of data to visualize from PRDPs’ maps or PHAs in this measurement process continues to become a massive task and can often make it inaccurate.
To improve this task, this article is proposing a methodology that consists of developing a procedure to aid in the analysis of partial discharges’ data in hydro generators. This proposal is based on a chain of data-mining tasks to provide standards and classify them among those defined by standards automatically. Thus, it is possible to gain agility in the process of identification, monitoring, and analysis of the problems encountered. In the following sections will be described the steps to carry out the proposed methodology.
4.1. Preprocessing and Database Creation
The partial discharges’ data acquisition is performed by the measurement system (IMA-DP) [40]. The acquired data can be viewed as static maps in the IMA-DP’s own interface. However, PRPDs are complex for analysis and patterns’ extraction. Therefore, these PDs’ signals are transformed to the PHA form of partial discharges. PHAs are built according to IEC 60270, IEC 60034-27-2, and IEEE 1434, grouping 17 points of magnitudes on the horizontal axis for the positive phase and, consequently, the same division is performed for the negative phase. The grouping of magnitudes is done on a logarithmic scale. In this way, it is possible to establish information about the intensity and type of occurrence. Each point of the horizontal axis displays an average of the amount of pulses at a given axis magnitude. With this information, the curve to determine standards required for the analysis is formed. The PHAs created in the data acquisition and preprocessing step have no labeling, that is, no identification of what type of discharge is occurring, a usual way is to visually identify patterns and then label. This task is massive and requires time and experience from engineers.
4.1.1. Labeling Dataset—Descriptive Task
The descriptive data-mining tasks characterize the general properties of data. Using cluster, it is possible for referring to a group of similar kinds of objects. Cluster analysis refers to forming groups of objects that are remarkably like each other but are highly different from the objects in other clusters. As a data-mining function, clustering analysis serves as a tool to gain insight into the data distribution to observe characteristics of each cluster. This information can be used for labeling databases, since each cluster formed is named according to a standard known to the analyst engineer [28,29,30].
The partitioning methods described in Section 3.1 were used to evaluate how they can be used to describe PDs’ problems with good accuracy. For this, it was necessary to define how many clusters are in the dataset. Many times, some specific techniques are used for these definitions, normally when there is not confidence information about the patterns. However, in this case, the number of patterns was well known and could be defined by engineers.
4.1.2. Random Forest Training—Predictive Task
The clustering process applied in Section 4.1.1 provides a multi-labeling database organized with 34 attributes and one label for each database line. With this database it was possible to train a RF for evaluating the new PDs’ measurements along the time. These new measurements were classified according to the RF model. K-fold cross-validation was used in training and testing steps of RF models [37,38]. Also, the diagnostic measure for the RF model was the confusion matrix. A confusion matrix is a way to express how many of a classifier prediction were correct and how many were incorrect. Three metrics are provided by the confusion matrix, they are:
- (1)
- Accuracy. This score measures how many labels the model correctly identified out of the total number of predictions. This is expressed as the percent of predictions that were correct.
- (2)
- Precision is the number of correctly identified members of a class divided by all the times the model predicted that class.
- (3)
- Recall is the number of members of a class that the classifier identified correctly divided by the total number of members in that class.
RF generates several decisions tree models, and the response is defined by vote. After the RFs’ models have good accuracy, these models can be used for monitoring PDs online. The RF and clustering models were trained and tested using the software package RAPIDMINER [41]. Figure 6 shows schematically the step-by-step methodology of partial discharges’ identification.
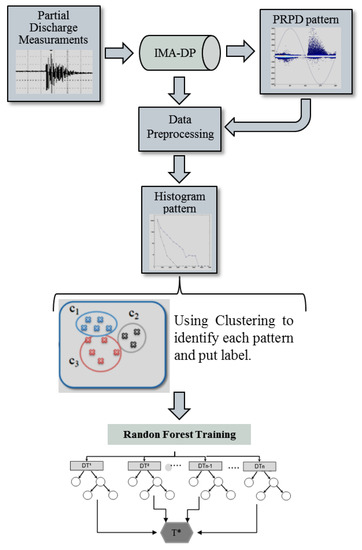
Figure 6.
Flowchart representing the step-by-step methodology of partial discharges’ identification.
4.2. Trend Analyses and Database Update
Updates of classifying models have been discussed in several applications. In the case of PDs’ monitoring, it is especially important to follow the discharge trend since this phenomenon is natural in electrical equipment. Here, a method based on R2 is proposed to assist both trend monitoring and updating the database.
Traditionally, when referring to the determination coefficient it is soon associated with the metric of how much the prediction error is eliminated when using least squares regression, being commonly associated with the evaluation of linear regression models [28,29,30]. Its value varies between 0 and 1 and the closer to these limit values, the better the regression model. The closer to 0, the worse the representation of the regression model. However, inherent characteristics of R2 in statistical analyses can be used as a parameter to evaluate the evolution of PHAs and the quality of the database, besides evaluating the need to update this database.
As it is expected that the PHAs’ behavior changes over time, evaluating this change trend and the database quality is critical. This can be accomplished by tracking the R2 value, since the clustering and RF training databases with real data present a predefined characteristic, preferably being constructed with characteristics of noncorrelation. The low R2 value tends to represent a good characterization of discharges with time, creating a search space in the database that represents the nature of discharges’ intensity and frequency in the sampled period. It is not interesting to order data in an increasing-intensity way because this ordering suppresses the importance of time in characterizing the problem.
All measured values after the RF model creation must be accumulated according to their sampling on the training database. From time to time, the R2 of this accumulated base should be calculated, its increase or decrease trend analyzed, and, from this point on, to make a new database cutout, again applying clustering and RF creation procedures for creating evaluation models.
5. Results and Discussion
The IMA-DP Software [40] was used to capture signals from couplers and create statistical maps that present magnitudes by phase. A total of 1724 measurements were collected, according to both Section 2.1 and Section 2.2, representing information from the eight couplers in phase A, of a 350 MW hydro generator from the Tucuruí Hydro Power Plant. This collection of 1724 measurements passed by preprocessing, discussed in Section 4.1, where PD measurements were transformed into PHAs. Thus, database composition comprised 34 rows and 1724 columns. The Tucuruí Hydroelectric Power Plant has installed power of 8535 MW distributed by 25 hydrogenators (two generators of 22. 5 MW, 12 generators of 350 MW, and 11 generators of 390 MW). It is in the state of Pará–Brazil, and belongs to Eletrobras Eletronorte (Tucuruí, BrazilCity, Country), electric generation and transmission company.
With these collected data, the preprocessing step was performed for the creation of HPAs on a logarithmic basis for patterns classification. However, these data did not have labels, that is, they required an individual assessment to identify the discharge type presented. To make this not necessary, the descriptive, cluster-based, data-mining task, as proposed in this article, was used.
5.1. Clustering: Tests and Analysis
Continuous clustering models were initially executed to identify how many clusters would be identified. However, based on the history knowledge of the generator studied, six discharge groups were chosen, representing five discharge patterns defined by norm and one for low levels of partial discharge, which did not present a defined pattern.
Eight different clustering techniques were applied in the database collected to find which of these techniques presents viable results for using in the database label-creation stage. For a better follow-up, each technique was named according to the description as follows:
- Model01—Bregman Divergence–Squared Euclidian Distance
- Model02—Euclidian Distance
- Model03—Chebchev Distance
- Model04—Correlation Similarity
- Model05—Cosine Similarity
- Model06—Dynamic Time Warping
- Model07—Kernel Euclidean Distance
- Model08—Manhattan Distance
The evaluation of patterns found by each model was accomplished quantitatively and qualitatively. Ideal clustering was characterized by minimal intra-cluster distance and maximal inter-cluster distance. In this work, we used two metrics. The first metric was average cluster distance, which computes the average between all examples of a cluster and the centroid. Another metric was Davies–Bouldin Index, in which we searched to minimize the intra-cluster distance and increase inter-cluster distance. Davies–Bouldin index indicated that clusters with less dispersed and good distance between other clusters had scores close to zero [28,29,30,31,32,33,34,35,41,42]. Table 1 shows the index values for each model.

Table 1.
Clustering measurements.
Based on data of Table 1, it is possible to verify that model01, model02, model05, and model08 show better numerical results than model03, model04, model06, and model07, although there was no threshold value that defined whether a set of centroids by the algorithm would be better or worse. The evaluation is usually carried out by comparing the indexes of each model. Therefore, it is possible to state that four models had good clustering characteristics.
To better assess whether the centroids of model01, model02, model05, and model08 were good, graphic analyses of centroids were performed. Figure 7 presents the analysis of model02 centroids (with good metrics) and model04 (with bad metrics).
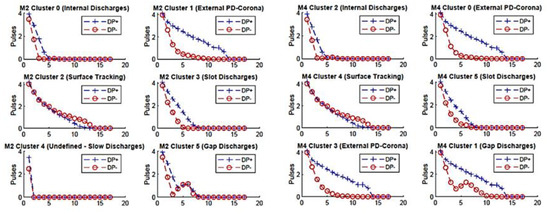
Figure 7.
Partial discharges’ centroids.
Comparing patterns shown in Figure 5 with standards (IEC 60270, IEC 60034-27-2, and IEEE 1434), it is noted that the centroids (each centroid represents a discharge pattern) found by model02 satisfactorily represented the patterns of each PD that were recurrent in phase “A” of the studied hydro generator, while for model04 the centroid formed did not achieve satisfactory performance. The pattern of type Undefined-Slow Discharges, not found by model02, possibly must have been grouped with that of Internal Discharges, while the External PD-Corona standard was created twice. Another highlight feature is the pattern formed for Gap Discharges, which was not completely adherent to the standard. Comparing the Gap Discharges’ standards of model02 and model04, it was noted that there was a sensible difference in the centroids formed in both cases.
Model01, model05, model07, and model08 exhibited centroids’ patterns very similar to model02. The remaining models had certain inconsistencies in the formed patterns when compared with standards (IEC 60270, IEC 60034-27-2, and IEEE 1434), like what is presented by model02. Model03 and model06 did not identify the Gap pattern. However, all these models were used for labeling the database and training and testing an RF-based automatic classifier model.
5.2. Random Forest for Automatic Classification
With labels created by the clustering models, it was possible to train a partial discharges’ classifier through a random forest. Each database was associated with the label generated by the clustering model. Thus, eight RFs were trained and tested from a database of 1724 samples. RFs were trained using 100 random trees with Gini Index criterion for splitting. Validation was done by the K-fold cross-validation method, assuming K = 10.
Figure 8 shows the results of the eight trained RFs, also presenting the RFs’ models hit percentages in the test-training stage. It was possible to note that the RFs that were trained with labels generated by the models that presented better results in the indexes for clustering evaluation also presented hit percentages higher than 99%, while the hit percentages of RFs that resulted from labels in which the clustering stage presented lower results also presented lower hit percentages (as, for example, model06 with a hit percentage of 94.28%). One case to be analyzed more carefully is model07. This model presented initially poor clustering-related indexes. However, in the patterns’ graphical analysis generated by model07 all patterns of PDs were present.
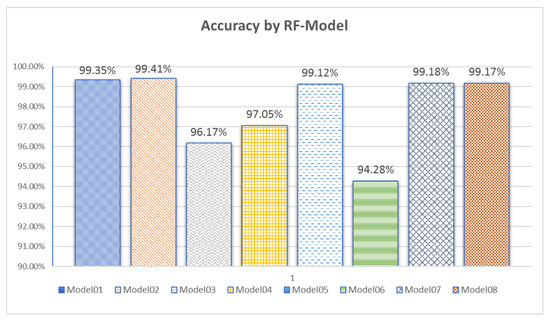
Figure 8.
Hit results of RFs’ models with labels created by the eight clustering models.
Table 2 presents the results of Precision and Recall for each RF, considering the patterns generated, being highlighted the worst results in the model identification. This implies the low quality of centroids generated in model03, model04, and model06. It is important to make it clear that these models did not feature centroids that characterize gap discharges. Therefore, all cases that were, in fact, of gap type were classified as any other type of PD. This reduced the RF efficiency classification.
Table 2.
Results of the confusion matrices generated for each case.
5.3. Trend Analysis With R2
For trend analysis, two synthetic databases were created from the original database. The first synthetic database was created with the characteristic of increase of 5%, 10%, and 15%, emulating a linear growth for partial discharges’ intensity.
The other database was synthesized to represent a random decrease behavior. This was done with a random variation increase of 5%. That is, for each database value, a random variation of up to 5% was applied. Similarly, variations of 10% and 15% were performed.
Figure 9 shows the results of the R2 analysis when analyzing the first PHA variable for model02, for an External-Corona PD. The low value characteristic of R2 = 0.0713 is remarkable. This characteristic comes from the nature of the data collected for the database creation. Analyzing the R2 characteristics of the other variables for the corona pattern, the low value of R2 is noted. However, when adding the characteristic of increased PD intensity, it is possible to notice the growth in the R2 value. With linear increase, the R2 increases significantly when compared to R2 in the initial database. It is also remarkable that the case R2 = 0.1314 with random variation is notably higher, with an increase rate of approximately 46% compared to R2 of the original database.
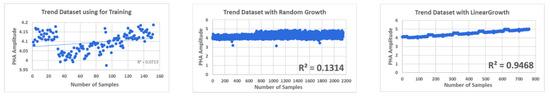
Figure 9.
R2 analysis.
The traditional method of analyzing PDs is to analyze the partial discharges’ pattern and intensity. The clustering-random forest-based method automatically evaluates the PD type with a high degree of accuracy. The intensity is evaluated indirectly since the confidence of the model results are strongly linked to the database. When the hit rate begins to reduce it is important to update the database because, for the problem of partial discharges, there is a tendency to vary the intensities of PDs. Based on this premise, the R2 analysis captures trends in a numerical index of simple understanding. Therefore, it is possible to set an optimal time for updating the database.
Figure 10 shows the online use of the proposed method. The monitoring system is divided into two zones. The Data Acquisition Zone is responsible for the steps for acquiring PD measurements. In this zone, the steps presented in Section 2.1 and Section 2.2 are performed. It is important to note that there are two stages of noise suppression in the data acquisition area. The first is due to the way in which the couplers are installed and the second is based on digital filters.
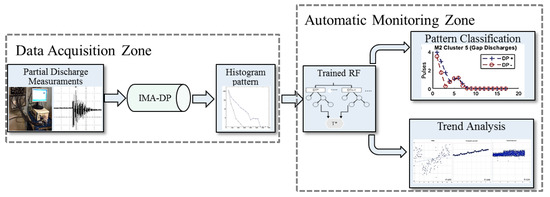
Figure 10.
Flowchart representing the steps of online application.
The Automatic Monitoring Zone was made up of the RF trained in Section 5.2 to classify each discharge that occurs in the monitored generator, indicating automatically the type of discharge that occurred. Consequently, the trend evaluation based on R2 provided not only a view of the machine conditions regarding partial discharges, but it was also used as a trigger to update the database and RF training.
6. Conclusions
Failures in the electrical insulation of hydro generators’ stator windings are very common and, due to this factor, there was an increase in the periodicity of partial discharge measurements. Therefore, there is a need to improve diagnoses established through these machine tests. In this way, an intelligent tool was developed that will allow the identification of partial discharges’ types as presented in the standards. This will facilitate a diagnosis by investigating the PD severity. A methodology based on the determination coefficient was also presented to evaluate the need to update the database and monitor the trend of partial discharges over time because, according to the literature, monitoring the equipment history is crucial to establish the health of its electrical insulation.
Using the pulse height analysis plots, which are simpler and facilitate the pattern recognition, data-mining techniques were applied. This choice of representation in positive and negative curves was also made because of the large amount of data that would be originally used in the system training.
The use of real data was crucial to ensure the applicability of the method because, in the analyses performed, all patterns were present, except for the delamination pattern. Eight clustering algorithms combined with random forest were tested. The clustering models of the type Bregman Divergence, Distance Euclidian, Cosine Similarity, Kernel Euclidean Distance, and Manhattan Distance obtained results with hit rates higher than 99% and with analysis of the patterns generated with high similarity to the standards used. Therefore, these five mentioned methods can be used in combination with RF to evaluate and monitor partial discharges in hydro generators.
The models based on Chebyshev distance, Correlation Similarity, and Dynamic time warping for clustering did not have good performance. The hit rates were lower than 97% and discharge patterns were not all recognized. Therefore, these clustering algorithms are not good options for this type of application. R2 analysis proved to be efficient to evaluate the patterns trends, since a 15% increase in the amplitude of discharges resulted in a 46% increase in the R2 value.
The results presented indicate that the proposed methodology can be applied in monitoring partial discharges in hydro generators. Clustering algorithms combined with RF allowed us to identify partial discharge patterns in a very fast manner. It is important to highlight that each generator had particular characteristics; that is, for each generator one must train its own evaluation models.
Author Contributions
Conceptualization, A.C.N.P., U.H.B., and W.D.O.; methodology, A.C.N.P., U.H.B., and W.D.O.; validation, A.C.N.P., T.P.N., M.R.S.S., U.H.B., and W.D.O.; formal analysis, A.C.N.P., U.H.B., and W.D.O.; data curation, A.C.N.P., T.P.N., and W.D.O.; writing—original draft preparation, A.C.N.P., T.P.N., M.R.S.S., U.H.B., and W.D.O.; visualization, A.C.N.P., T.P.N., M.R.S.S., U.H.B., and W.D.O.; supervision, U.H.B. and W.D.O. All authors have read and agreed to the published version of the manuscript.
Funding
This research received no external funding.
Acknowledgments
This work was supported by Eletrobras Eletronorte and CAPES.
Conflicts of Interest
The authors declare no conflict of interest.
References
- Oliveira, W.D.; Vieira, J.P.; Bezerra, U.H.; Martins, D.A.; Rodrigues, B.D.G. Power system security assessment for multiple contingencies using multiway decision tree. Electr. Power Syst. Res. 2017, 148, 264–272. [Google Scholar] [CrossRef]
- International Electrotechnical Commission. Evaluation and Qualification of Electrical Insulation Systems; IEC 60505; International Electrotechnical Commission: Geneva, Switzerland, 2017. [Google Scholar]
- Kuppuswamy, R.; Rainey, S. Facilitating Proactive Stator Winding Maintenance Using Partial Discharge Patterns. In Proceedings of the 2018 IEEE Electrical Insulation Conference (EIC), San Antonio, TX, USA, 17–20 June 2018; pp. 566–571. [Google Scholar] [CrossRef]
- Harrington, P. Machine Learning in Action; Manning Publications Co.: Shelter Island, NY, USA, 2012. [Google Scholar]
- Pyle, D. Data Preparation for Data Mining; Morgan Kaufmann: Burlington, MA, USA, 1999; Volume 1. [Google Scholar]
- Shakerighadi, B.; Peyghami, S.; Ebrahimzadeh, E.; Blaabjerg, F.; Leth Back, C. A New Guideline for Security Assessment of Power Systems with a High Penetration of Wind Turbines. Appl. Sci. 2020, 10, 3190. [Google Scholar] [CrossRef]
- Liu, R.; Verbič, G.; Ma, J. A new dynamic security assessment framework based on semi-supervised learning and data editing. Electr. Power Syst. Res. 2019, 172, 221–229. [Google Scholar] [CrossRef]
- Monteiro, M.R.; Alvarenga, G.F.; Rodrigues, Y.R.; de Souza, A.Z.; Lopes, B.I.L.; Passaro, M.C.; Abdelaziz, M. Network partitioning in coherent areas of static voltage stability applied to security region enhancement. Int. J. Electr. Power Energy Syst. 2020, 117, 105623. [Google Scholar] [CrossRef]
- Lai, K.X.; Phung, B.T.; Blackburn, T.R. Descriptive Data Mining of Partial Discharge Using Decision Tree with Genetic Algorithm. Aust. J. Electr. Electron. Eng. 2009, 6, 249–259. [Google Scholar] [CrossRef]
- Lai, K.X.; Phung, B.T.; Blackburn, T.R. Application of Data Mining on Partial Discharge. Part I: Predictive Modelling Classification. IEEE Trans. Dielectr. Electr. Insul. 2010, 17, 846–854. [Google Scholar] [CrossRef]
- Zhong, Z.W.; Li, X.; Thong, K.W.; Zhou, J.H. Characterization of Partial Discharge Signals. In Proceedings of the 2010 IEEE/ASME International Conference on Mechatronic and Embedded Systems and Applications, Qingdao, China, 15–17 July 2010. [Google Scholar]
- Asiri, Y.; Vouk, A.; Renforth, L.; Clark, D.; Shuttleworth, R.; Copper, J. Neural Network Based Classification of Partial Discharge in HIV Motors. In Proceedings of the 2011 Electrical Insulation Conference (EIC), Annapolis, MD, USA, 5–8 June 2011; pp. 333–339. [Google Scholar]
- Tang, J.; Liu, F.; Meng, Q.; Zhang, X.; Tao, J. Partial Discharge Recognition through an Analysis of SF6Decomposition Products Part 2: Feature Extraction and Decision Tree-based Pattern Recognition. IEEE Trans. Dielectr. Electr. Insul. 2012, 19, 37–44. [Google Scholar] [CrossRef]
- Suprayogi, B.; Khayam, U. Design of Partial Discharge Location Identifier Software for High Voltage Generator Using Artificial Neural Network. In Proceedings of the Joint International Conference on Electric Vehicular Technology and Industrial, Mechanical, Electrical and Chemical Engineering (ICEVT & IMECE), Surakarta, Indonesia, 4–5 November 2015. [Google Scholar]
- Mas’ud, A.A.; Albarracín, R.; Rey, J.A.A.; Sukki, F.M.; Illias, H.A.; Bani, N.A.; Munir, A.B. Artificial Neural Network Application for Partial Discharge Recognition: Survey and Future Directions. Energ. Open Access J. Energy Res. 2016, 9, 574. [Google Scholar] [CrossRef]
- Oliveira, R.M.S.; Araújo, R.C.F.; Barros, F.J.B.; Segundo, A.P.; Zampolo, R.F.; Fonseca, W.; Dmitriev, V. A System Based on Artificial Neural Networks for Automatic Classification of Hydro-Generator Stator Windings Partial Discharges. J. Microw. Optoelectron. Electromagn. Appl. 2017, 16, 628–645. [Google Scholar] [CrossRef]
- Herath, H.M.M.G.T.; Kumara, J.R.S.S.; Fernando, M.A.R.M.; Bandara, K.M.K.S.; Serina, I. Comparison of supervised machine learning techniques for PD classification in generator insulation. In Proceedings of the 2017 IEEE International Conference on Industrial and Information Systems (ICIIS), Peradeniya, Sri Lanka, 15–16 December 2017; pp. 1–6. [Google Scholar] [CrossRef]
- Zemouri, R.; Lévesque, M.; Amyot, N.; Hudon, C.; Kokoko, O.; Tahan, S.A. Deep Convolutional Variational Autoencoder as a 2D-Visualization Tool for Partial Discharge Source Classification in Hydrogenerators. IEEE Access 2020, 8, 5438–5454. [Google Scholar] [CrossRef]
- Gerón, A. Hands-on Machine Learning with Scikit-Learn, Keras, and TensorFlow: Concepts, Tools, and Techniques to Build Intelligent Systems, 2nd ed.; O’Reilly Media, Inc.: Sebastopol, CA, USA, 2019; ISBN 9781492032649. [Google Scholar]
- International Eletrotechnical Commision. IEC 60270 High Voltage Test Techniques—Partial Discharges Measurements; Suíça: Geneva, Switzerland, 2000. [Google Scholar]
- Institute of Electrical and Electronic Engineers. IEEE Std 1434 Guide to Measurement of Partial Discharge in Rotating Machinery; IEEE: New York, NY, USA, 2014. [Google Scholar]
- Stone, G.C. Theory of The Partial Discharge Analyser Test. In Proceedings of the EPRI/CEA Workshop on the PDA and RF Monitoring, Toronto, ON, Canada, 22–24 September 1986. [Google Scholar]
- Stone, G.C.; Culbert, I.; Boulter, E.A.; Dhirani, H. Rotor Winding Insulation Systems. In Electrical Insulation for Rotating Machines: Design, Evaluation, Aging, Testing, and Repair; IEEE: New York, NY, USA, 2014; pp. 133–141. [Google Scholar] [CrossRef]
- Dehlinger, N.; Stone, G. Surface partial discharge in hydrogenerator stator windings: Causes, symptoms, and remedies. IEEE Electr. Insul. Mag. 2020, 36, 7–18. [Google Scholar] [CrossRef]
- Eletrobras Eletronorte. Technical Collection: Installation Manual of Couplers in Hydro Generator of Tucurui HPP; Eletrobras Eletronorte: Brasília, Brazil, 1990.
- Cunha, C.F.; Carvalho, A.T.; Petraglia, M.R.; Lima, A.C. A new wavelet selection method for partial discharge denoising. Electr. Power Syst. Res. 2015, 125. [Google Scholar] [CrossRef]
- Cunha, C.D.C.; Carvalho, A.T.D.; Petraglia, M.R.; Lima, A.C. An improved scale dependent wavelet selection for data denoising of partial discharge measurement. In Proceedings of the 2013 IEEE International Conference on Solid Dielectrics (ICSD), Bologna, Italy, 30 June–4 July 2013; pp. 100–104. [Google Scholar] [CrossRef]
- Fayyad, U.M. Data Mining and Knowledge Discovery in Databases: Applications in Astronomy and Planetary Science. In Proceedings of the Association for Advancement of Artificial Intelligence (AAAI), Portland, OR, USA, 4–8 August 1996. [Google Scholar]
- Dilly, R. Data Mining: An introduction; Parallel Computer Centre, Queens University: Belfast, UK, 1999. [Google Scholar]
- Addrians, P.; Zantinge, D. Data Mining; Addison-Wesley: Harlow, UK, 1996. [Google Scholar]
- Deza, M.M.; Deza, E. Encyclopedia of Distances; Springer: Berlin/Heidelberg, Germany, 2009. [Google Scholar]
- Geler, Z.; Kurbalija, V.; Radovanović, M.; Ivanović, M. Impact of the Sakoe-Chiba Band on the DTW Time Series Distance Measure for kNN Classification. In Knowledge Science, Engineering and Management. KSEM 2014; Lecture Notes in Computer Science; Buchmann, R., Kifor, C.V., Yu, J., Eds.; Springer: Cham, Switzerland, 2014; Volume 8793. [Google Scholar]
- Rahutomo, F.; Kitasuka, T.; Aritsugi, M. Semantic Cosine Similarity. In Proceedings of the 7th International Student Conference on Advanced Science and Technology ICAST 2012, Seoul, Korea, 29–30 October 2012. [Google Scholar]
- Singh, A.; Yadav, A.; Rana, A. K-means with three different Distance Metrics. Int. J. Comput. Appl. 2013, 67, 13–17. [Google Scholar] [CrossRef]
- Thomas, R.; Judith, J.E. Correlation and Probability Based Similarity Measure for Detecting Outliers in Categorical Data. Int. J. Innov. Technol. Explor. Eng. (IJITEE) 2020, 9, 2577–2582. [Google Scholar]
- Breiman, L. Bagging predictors. Mach. Learn. 1996, 24, 123–140. [Google Scholar] [CrossRef]
- Fawagreh, K.; Gaber, M.M.; Elyan, E. Random forests: From early developments to recent advancements. Syst. Sci. Control Eng. 2014, 2, 602–609. [Google Scholar] [CrossRef]
- Tyralis, H.; Papacharalampous, G.; Langousis, A. A Brief Review of Random Forests for Water Scientists and Practitioners and Their Recent History in Water Resources. Water 2019, 11, 910. [Google Scholar] [CrossRef]
- Nogueira, J.; Rodrigues, B.; Fernandes, A.T.; de Oliveira, W.D.; Bezerra, U. Comparison between decision tree and optimal power flow techniques applied to voltage corrective control in electric systems. JETIA 2020, 6, 4–12. [Google Scholar] [CrossRef]
- CEPEL—Eletrobras: R&D Center in Electrical Energy: IMA-DP: Instrumentation for Monitoring and Analysis of Partial Discharges. Available online: http://www.cepel.br/en_us/products/ima-dp-instrumentation-for-monitoring-and-analysis-of-partial-discharges.htm (accessed on 7 August 2020).
- RapidMiner Manual. Available online: https://docs.rapidminer.com/downloads/RapidMiner-v6-user-manual.pdf (accessed on 10 October 2020).
- Available online: http://danshiebler.com/2017-06-25-metrics/ (accessed on 2 March 2020).


Publisher’s Note: MDPI stays neutral with regard to jurisdictional claims in published maps and institutional affiliations. |
© 2020 by the authors. Licensee MDPI, Basel, Switzerland. This article is an open access article distributed under the terms and conditions of the Creative Commons Attribution (CC BY) license (http://creativecommons.org/licenses/by/4.0/).