Improving the Quality of Electricity in Installations with Mixed Lighting Fittings


Abstract
1. Introduction
2. The Power Theory According to the IEEE Standard 1459
3. Results
4. The Use of Passive Filter Systems to Improve Power Quality
4.1. Software and Its Functional Features
4.2. Luminaires and Lighting Installations with Passive Filter Systems
5. Conclusions
- Research, selection of parameters, and the use of a hybrid filtering-separation device allows for effective operation of sources, modules, and lighting fittings.
- It can be concluded that the use of a passive filter in the tested cases is the optimal solution due to the simplicity of both the system configuration used and the possibility of selecting elements.
- The developed computer program effectively and efficiently enables the analysis and carries out the selection of parameters of passive filters that are dedicated to the tested installation, which results in a quick and effective reduction of harmonic content in lighting installations.
- In accordance with the regulations, LED lighting fixtures may have a PF power factor not lower than 0.9, which is equivalent to a tan value not greater than 0.48. Unfortunately, the current normative regulations do not take into account the fact that semiconductor power supply systems used in LED luminaires mean flows of capacitive reactive energy, i.e., the value of tg may be negative (e.g., for PF = 0.9 then tg = −0.48). Electronic control and regulation systems do not have a specific allowable power factor, which may cause a further increase in the value of capacitive reactive energy. Based on the measurement results, it can be concluded that replacing the previously used luminaires with luminaires with only LED sources will mean additional costs that result from the flows in the capacitive reactive energy network.
Author Contributions
Funding
Conflicts of Interest
Appendix A


References
- EN 61000-3-2 Electromagnetic compatibility (EMC)—Part 3-2: Permissible Levels—Permissible Levels of Harmonic Current Emissions (Phase Current Supply of the Receiver <or = 16 A. Available online: https://webstore.iec.ch/publication/67329 (accessed on 13 November 2012).
- EN 61000-3-12 Electromagnetic Compatibility (EMC)—Part 3-12: Permissible Levels—Permissible Levels of Harmonic Currents Caused by the Operation of Receivers to be Connected to the Public Low-Voltage Power Supply Network with a Phase Current Supplying the Load Greater than 16 A and Less than or Equal to 75 A. Available online: https://webstore.iec.ch/publication/4144 (accessed on 13 November 2012).
- Kurkowski, M.; Mirowski, J.; Popławski, T.; Pasko, M.; Białoń, T. Measurements of reactive energy in low voltage installations. Prz. Elektrotechniczn. 2016, R.92, 144–147. [Google Scholar]
- Lange, A.; Pasko, M. Reactive power compensation and filtration of higher harmonics using LC passive filters. Prz. Elektrotechniczn. 2010, R.86, 126–129. [Google Scholar]
- Lange, A.; Pasko, M. Selected issues concerning the quality of electricity in mines and steel mills. Prz. Elektrotechniczn. 2012, R.88, 150–153. [Google Scholar]
- Mirowski, J. Analysis of Operating Parameters of Lighting Luminaires in Mixed Systems. Ph.D. Dissertation, Energo-Bud Sp. Z o.o., Czestochowa, Poland, 2020. Not published. [Google Scholar]
- Maciążek, M.; Pasko, M. Selected Applications of Numerical Algorithms in Optimization of Operating Conditions of Voltage Sources; Publishing House of the Silesian University of Technology: Gliwice, Poland, 2007. [Google Scholar]
- Rockhill, A.A.; Liserre, M.; Teodorescu, R.; Rodriguez, P. Grid-filter design for a multimegawatt medium-voltage voltage-source inverter. IEEE Trans. Ind. Electron. 2011, 58, 1205–1217. [Google Scholar] [CrossRef]
- Gabe, I.J.; Montagner, V.F.; Pinheiro, H. Design and implementation of a robust current controller for VSI connected to the grid through an LCL filter. IEEE Trans. Power Electron. 2009, 24, 1444–1452. [Google Scholar] [CrossRef]
- Turkay, B.E.; Telli, A.Y. Economic analysis of standalone and grid connected hybrid energy systems. Renew. Energy 2011, 36, 1931–1943. [Google Scholar] [CrossRef]
- Jufri, F.H.; Oh, S.; Jung, J. Development of Photovoltaic abnormal condition detection system using combined regression and Support Vector Machine. Energy 2019, 176, 457–467. [Google Scholar] [CrossRef]
- Dhimish, M.; Holmes, V.; Mehrdadi, B.; Dales, M.; Mather, P. Photovoltaic fault detection algorithm based on theoretical curves modelling and fuzzy classification system. Energy 2017. [Google Scholar] [CrossRef]
- Silvestre, S.; da Silva, M.A.; Chouder, A.; Guasch, D.; Karatepe, E. New procedure for fault detection in grid connected PV systems based on the evaluation of current and voltage indicators. Energy Convers. Manag. 2014, 241–249. [Google Scholar] [CrossRef]
- Yu, Y.; Li, H.; Li, Z.; Zhao, Z. Modeling and analysis of resonance in LCL-type grid-connected inverters under different control schemes. Energies 2017, 10, 104. [Google Scholar] [CrossRef]
- Liserre, M.; Blaabjerg, F.; Hansen, S. Design and control of an LCL-filter-based three-phase active rectifier. IEEE Trans. Ind. Appl. 2005, 41, 1281–1291. [Google Scholar] [CrossRef]
- Cha, H.; Vu, T.K. Comparative analysis of low-pass output filter for single-phase grid-connected photovoltaic inverter. In Proceedings of the Twenty-Fifth Annual IEEE Applied Power Electronics Conference and Exposition (APEC), Palm Springs, CA, USA, 21–25 February 2010; pp. 1659–1665. [Google Scholar]
- Iman, L.; Hossein, A.; Mehdi, S.; Alireza, B.; Josep, M. Capacitor Current Feedback-Based Active Resonance Damping Strategies for Digitally-Controlled Inductive-Capacitive-Inductive-Filtered Grid-Connected Inverters. Energies 2016, 9, 642. [Google Scholar] [CrossRef]
- Sharon, D. Reactive power definitions and power factor improvement in nonlinear systems. Proc. Inst. Electr. Eng. 1973, 120, 704–706. [Google Scholar] [CrossRef]
- Dzhankhotov, V.; Pyrhonen, J.; Passive, L.C. Filter Design Considerations for Motor Applications. IEEE Trans. Ind. Electron. 2013, 10, 4253–4259. [Google Scholar] [CrossRef]
- Meenakshi, J.; Sreedevi, V.T. Power Quality Improvement in a Cascaded Multilevel Inverter Interfaced Grid Connected System Using a Modified Inductive–Capacitive–Inductive Filter with Reduced Power Loss and Improved Harmonic Attenuation. Energies 2017, 10, 1834. [Google Scholar] [CrossRef]
- Bhonsle, D.C.; Kelkar, R.B. Design and Analysis of Composite Filter for Power Quality improvement of Electric Arc Furnace. In Proceedings of the 3rd International Conference on Electric Power and Energy Conversion Systems, Istanbul, Turkey, 2–4 October 2013. [Google Scholar]
- Li, L.; Guo, Y.; Zhang, X. Analysis and Application of Passive Damping LLCL Filter in Active Power Filter. In Proceedings of the IEEE International Conference on Cybertechnology in Automation, Control and Intelligent Systems, Shenyang, China, 8–12 June 2015; pp. 751–755. [Google Scholar] [CrossRef]
- Buła, D.; Pasko, M. Stbility analysis of hybrid active power filter. Bull. Half. Acad. Sci. Tech. Sci. 2014, 62, 286–297. [Google Scholar]
- Penning, J.; Stober, K.; Taylor, V.; Yamada, M. Energy Savings Forecast of Solid-State Lighting in General Illumination Applications; Navigant Consulting, Inc.: Washington, DC, USA, 2016. [Google Scholar]
- Pracki, P.; Jägerbr, A. Application of road lighting energy efficiency evaluation system in practice. In Proceedings of the CIE Centenary Conference: Towards a New Century of Light, Paris, Italy, 15–16 April 2013. [Google Scholar]
- Zajkowski, M. The SOWA program for the modernization of road lighting in the commune. Prz. Elektrotechniczn. 2015, R.91, 85–88. [Google Scholar]
- Weżgowiec, M.; Popławski, T.; Kurkowski, M. Forecasting energy consumption for lighting purposes in the years 2018–2030 in the aspect of the resolution of Polish Networks Progressive Cities. Rynek Energii 2019, nr.1, 20–24. [Google Scholar]
- IEEE Std 1459-2010 Standard Definitions for the Measurement of Electric Power Quantities Under Sinusoidal, Nonsinusoidal, Balanced, or Unbalanced Conditions; IEEE: New York, NY, USA, 2010.
- EN 50160 Voltage Characteristics of Electricity Supplied by Public Distribution Systems. Available online: https://www.se.com/ww/library/SCHNEIDER_ELECTRIC/SE_LOCAL/APS/204836_1312/DraftStandard0026rev2-DraftEN501602005-05.pdf (accessed on 13 November 2012).
- Commission Regulation (EC) No 244/2009 of 18 March 2009 Implementing Directive 2005/32/EC of the European Parliament and of the Council with Regard to Ecodesign Requirements for Non-Directional Household Lamps. Available online: https://eur-lex.europa.eu/legal-content/EN/TXT/PDF/?uri=CELEX:32009R0244&from=EN (accessed on 13 November 2012).
- Commission Regulation (EU) No 1194/2012 of 12 December 2012 Implementing Directive 2009/125/EC of the European Parliament and of the Council with Regard to Ecodesign Requirements for Directional Lamps, Light Emitting Diode Lamps and Related Equipment. Available online: https://eur-lex.europa.eu/legal-content/EN/TXT/PDF/?uri=CELEX:32012R1194&from=EN (accessed on 13 November 2012).


| Harmonic Order | I * |
|---|---|
| h | % |
| 2 | 2 |
| 3 | 30 PF ** |
| 5 | 10 |
| 7 | 7 |
| 9 | 5 |
| 11 ≤ h ≤ 39 | 3 |
| (only odd ones) |
| Harmonic order | I *** |
|---|---|
| h | mA/W |
| 2 | 3.4 |
| 3 | 1.9 |
| 5 | 1.0 |
| 7 | 0.5 |
| 9 | 0.35 |
| 11 ≤ h ≤ 39 | 3.85/h |
| (only odd ones) |
| PF | |
|---|---|
| Functional requirements | |
| for other directional lamps (luminaires) | ≥0.5 dla P ≤ 25 W |
| (except lamps: LED, CFL | ≥0.90 dla P > 25 W |
| and high intensity discharge lamps) | |
| Functional requirements | P ≤ 2 W no requirement |
| for non-directional | 2 W < P ≤ 5 W; PF > 0.4 |
| and directional | 5 W < P ≤ 25 W; PF > 0.5 |
| (luminaires) LED lamps | P > 25 W; PF > 0.9 |
| Symbol | Name | Power |
|---|---|---|
| W | ||
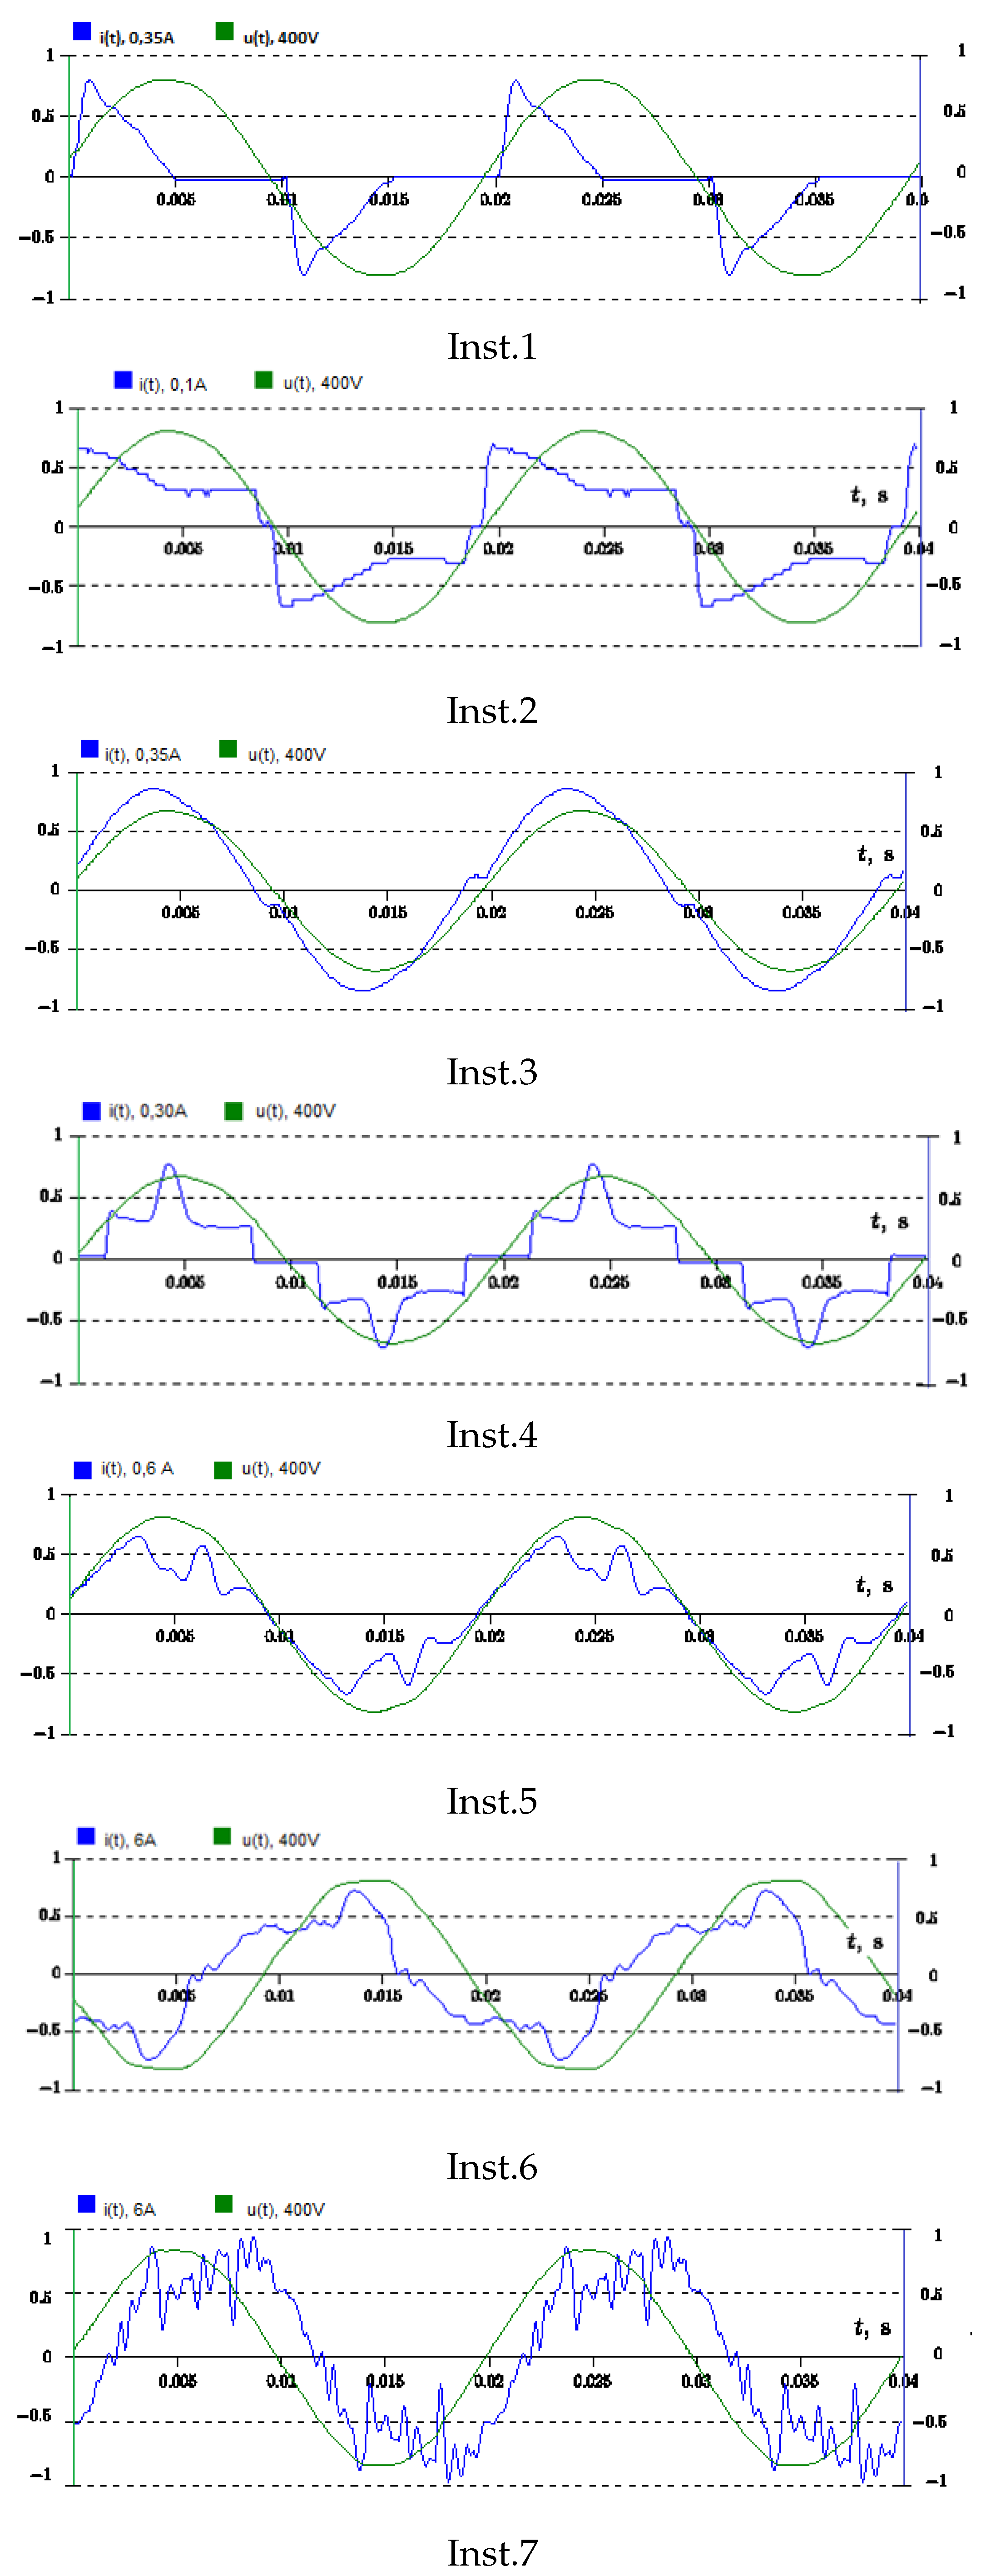
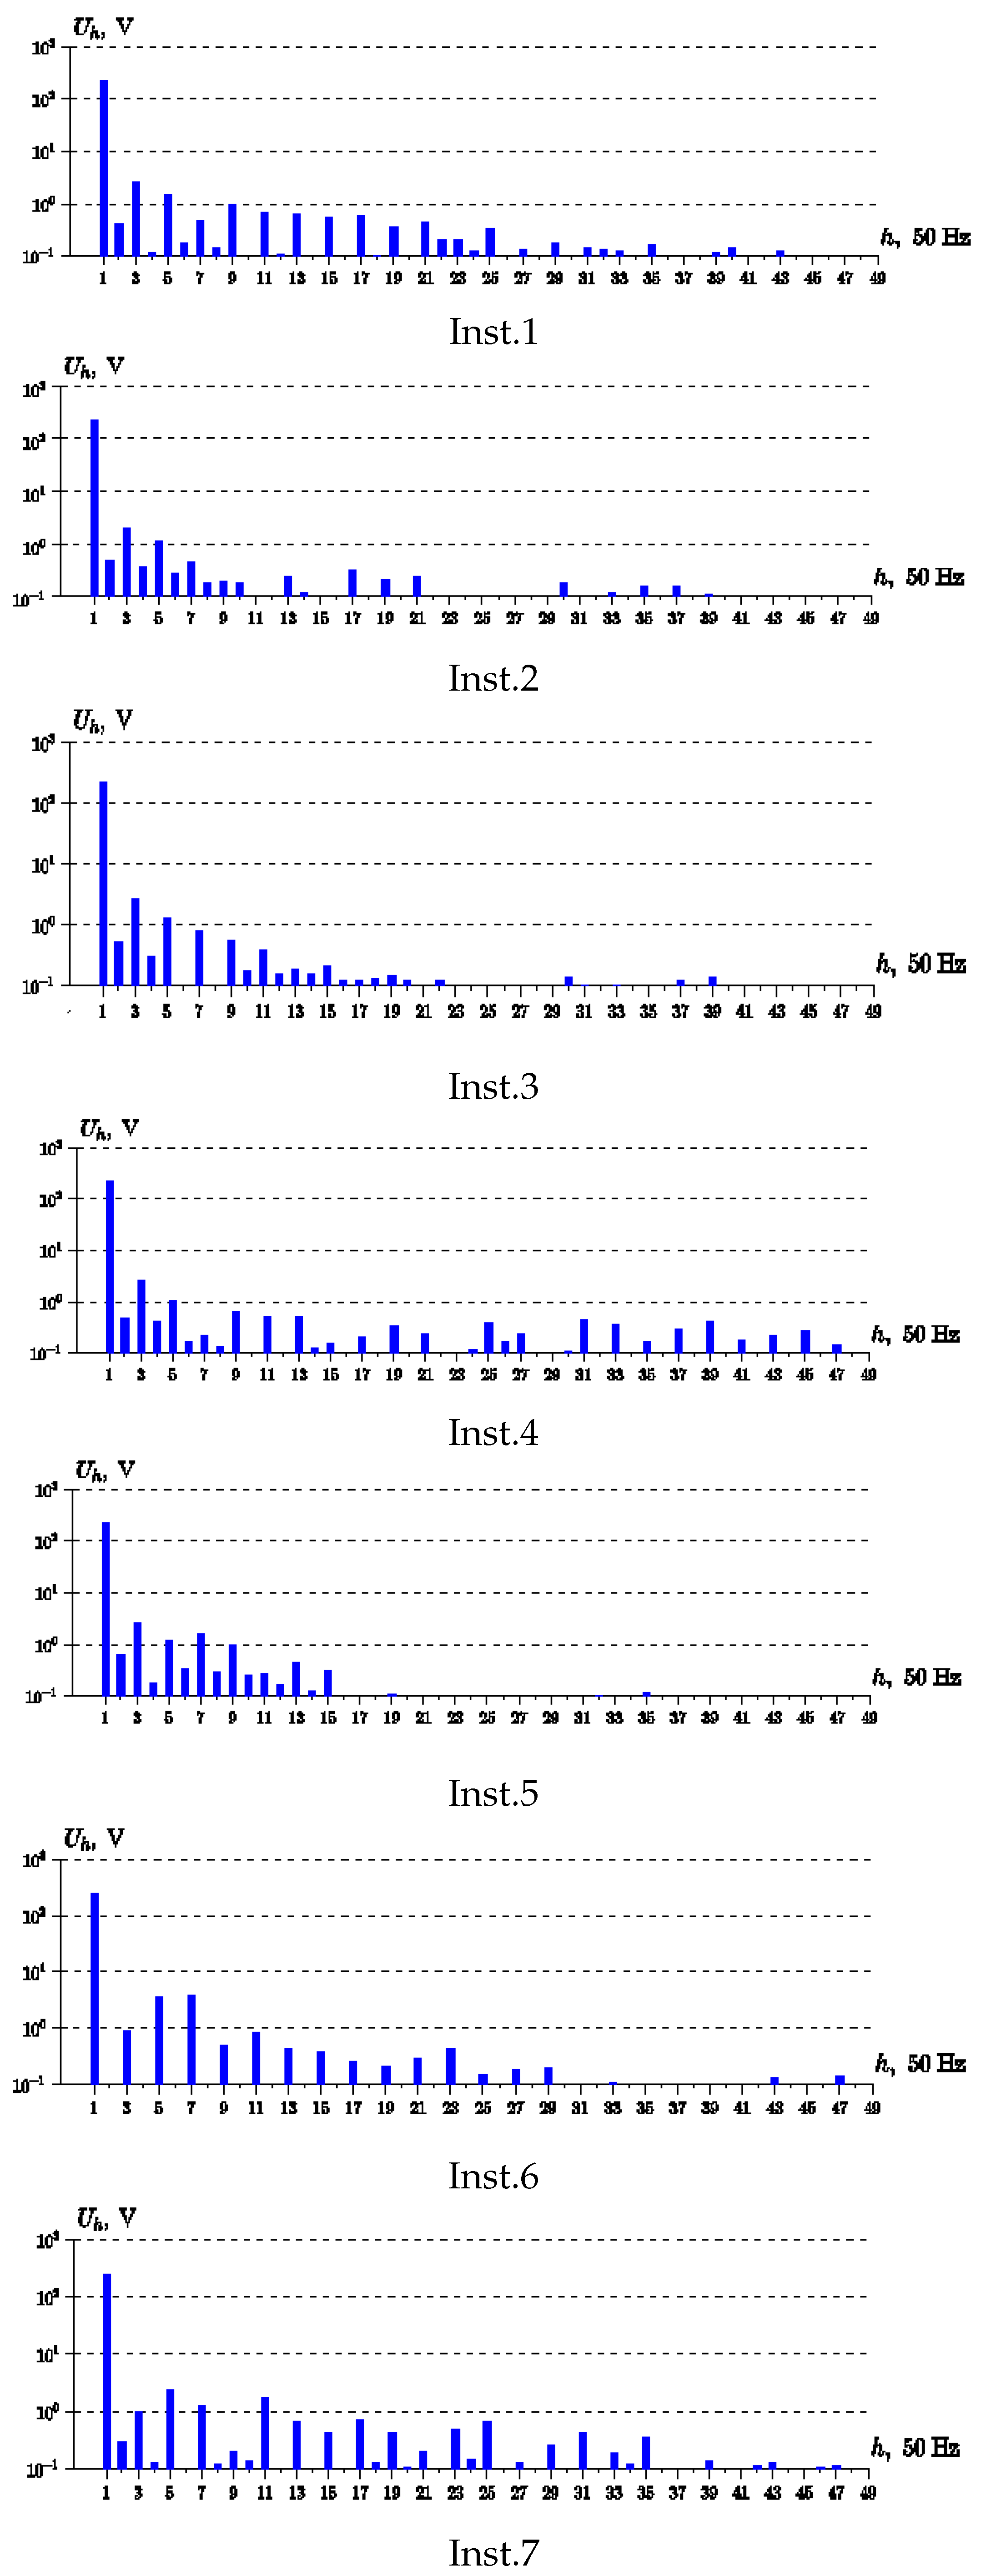
| Inst.1 | LED light fixture no.1 | 42 |
| Inst.2 | LED lighting fixture set no.2 | 15 |
| Inst.3 | LED lighting fixture no.3 | 78 |
| Inst.4 | Lighting fitting with induction source no.4 | 42 |
| Inst.5 | Lamp holder with metal halide source no.5 | 78 |
| Inst.6 | Mixed installation with discharge sources and LED no.6 | 700 |
| Inst.7 | Mixed lighting installation with discharge and LED sources no.7 | 1000 |
| Electrical Parameters | ||||||||
|---|---|---|---|---|---|---|---|---|
| U | P | I | Q | S | PF | THD | THD | |
| V | W | A | var | VA | % | % | ||
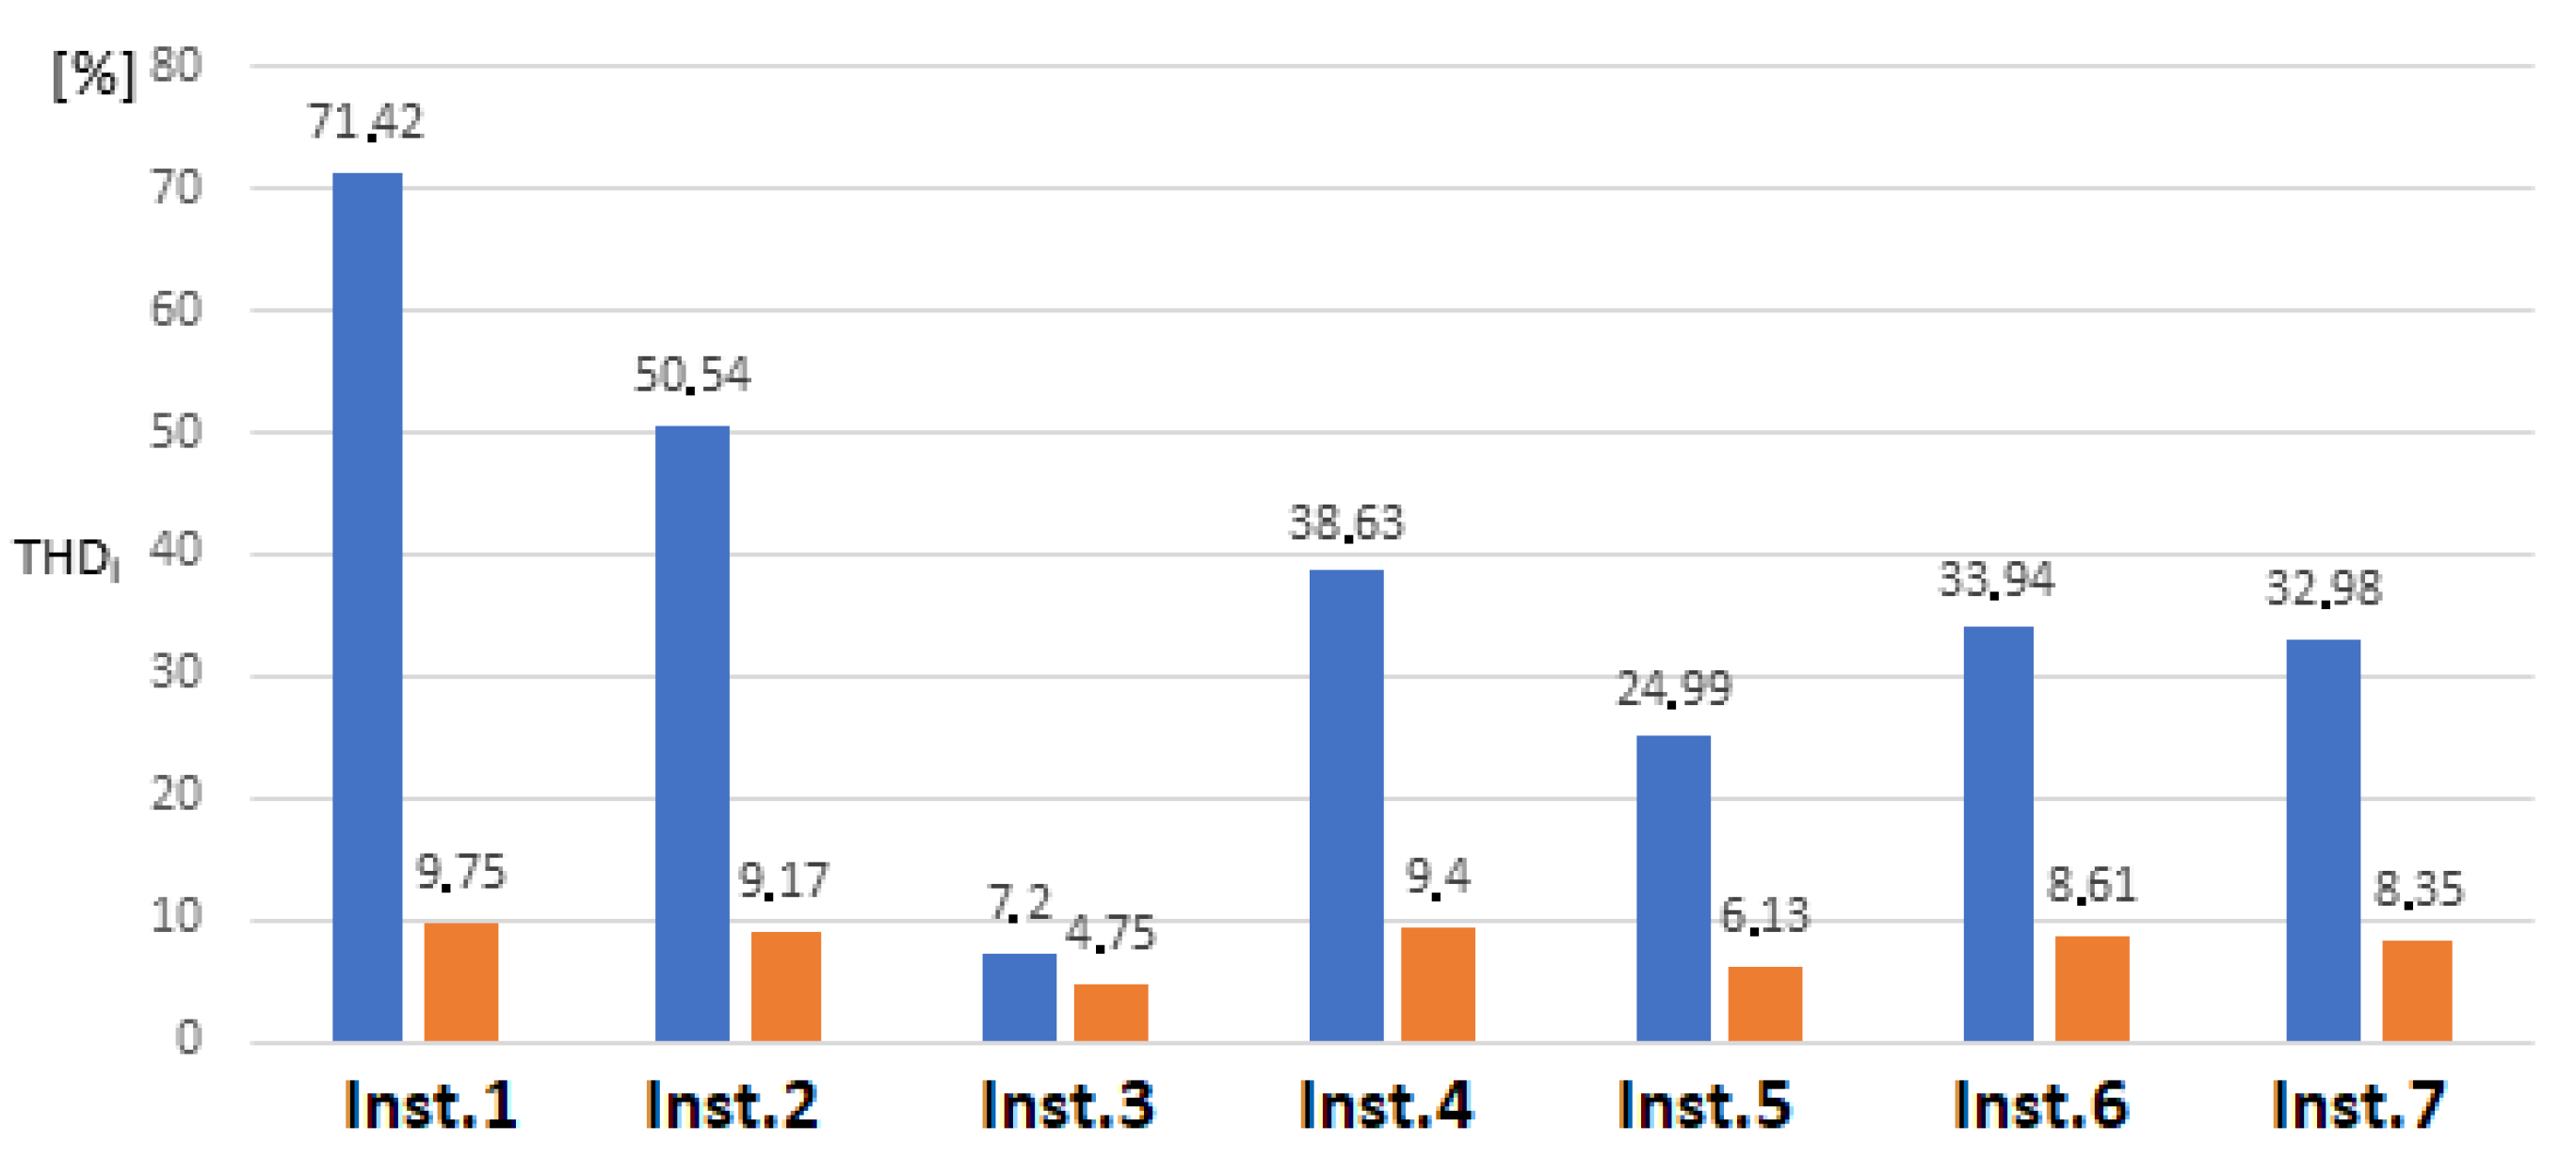
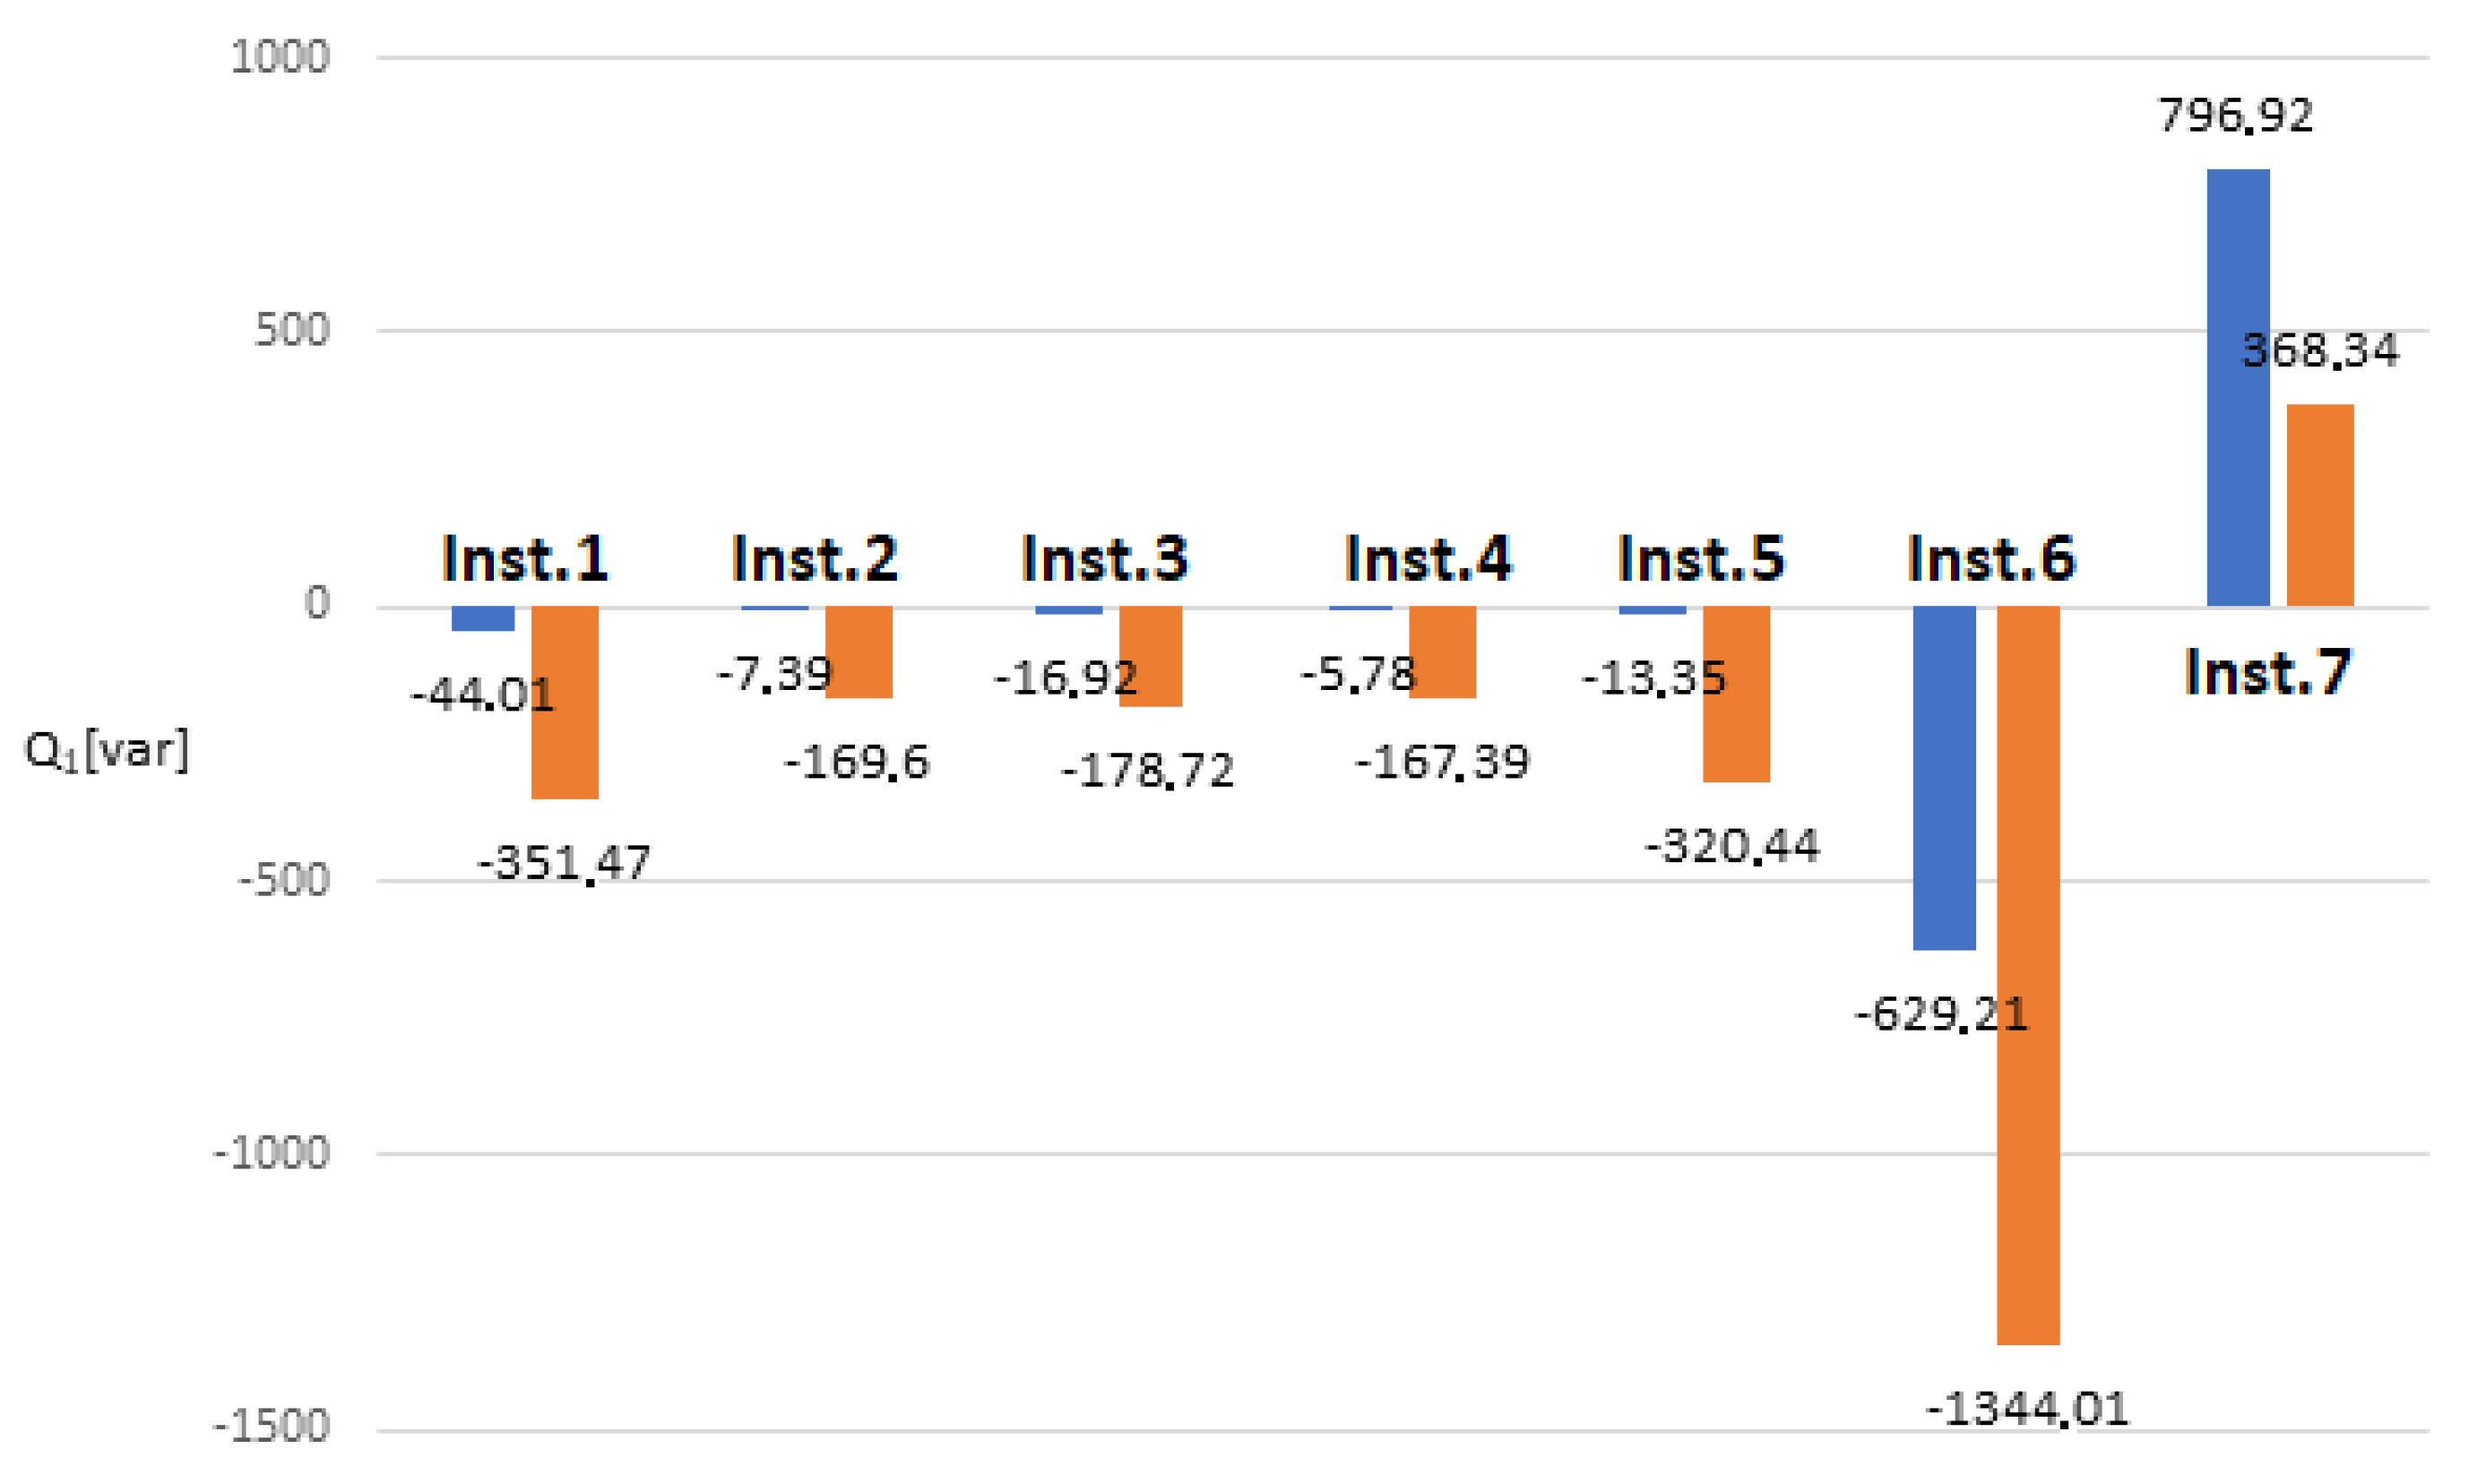
| Inst.1 | 230.78 | 42.83 | 0.32 | −44.01 | 75.68 | 0.56 | 1.68 | 71.42 |
| Inst.2 | 231.2 | 15.66 | 0.08 | −7.39 | 19.36 | 0.8 | 1.25 | 50.54 |
| Inst.3 | 231.3 | 78.08 | 0.34 | −16.92 | 80.13 | 0.97 | 1.57 | 7.20 |
| Inst.4 | 230.9 | 41.94 | 0.19 | −5.78 | 45.5 | 0.92 | 1.58 | 38.63 |
| Inst.5 | 231.02 | 86.54 | 0.39 | −13.35 | 90.19 | 0.95 | 1.96 | 24.99 |
| Inst.6 | 231.02 | 708.89 | 4.24 | 629.21 | 1004.89 | 0.7 | 2.4 | 33.94 |
| Inst.7 | 240.01 | 1050.07 | 5.78 | 796.92 | 1388.19 | 0.75 | 1.65 | 32.98 |
| Designated Quantities | Inst.1 | Inst.2 | Inst.3 | Inst.4 | Inst.5 | Inst.6 | Inst.7 | |
|---|---|---|---|---|---|---|---|---|
| P | W | 53.38 | 20.68 | 83.01 | 46.84 | 98.15 | 708.89 | 1050.08 |
| S | VA | 357.28 | 171.58 | 197.35 | 174.64 | 335.84 | 1004.35 | 1388.18 |
| N | var | 353.27 | 170.33 | 179.04 | 168.24 | 321.17 | 711.47 | 907.97 |
| P | W | −0.28 | 0.02 | −0.08 | −0.14 | −0.11 | −3.93 | 0.09 |
| S | VA | 0.58 | 0.19 | 0.14 | 0.25 | 0.34 | 7.72 | 7.20 |
| S | VA | 35.19 | 15.81 | 9.88 | 16.58 | 21.31 | 323.58 | 435.34 |
| D | var | 5.96 | 2.13 | 3.10 | 2.75 | 5.66 | 22.77 | 21.84 |
| D | var | 34.67 | 15.67 | 9.38 | 16.35 | 20.54 | 322.66 | 434.73 |
| D | var | 0.50 | 0.19 | 0.11 | 0.21 | 0.32 | 6.64 | 7.20 |
| P | W | 53.66 | 20.66 | 83.10 | 46.98 | 98.26 | 712.83 | 1049.98 |
| S | VA | 355.54 | 170.86 | 197.1 | 173.86 | 335.16 | 950.8 | 1318.16 |
| Q | var | −351.47 | −169.60 | −178.72 | −167.39 | −320.44 | −1344.01 | 368.34 |
| PF | 0.14 | 0.12 | 0.42 | 0.26 | 0.29 | 0.70 | 0.75 |
Publisher’s Note: MDPI stays neutral with regard to jurisdictional claims in published maps and institutional affiliations. |
© 2020 by the authors. Licensee MDPI, Basel, Switzerland. This article is an open access article distributed under the terms and conditions of the Creative Commons Attribution (CC BY) license (http://creativecommons.org/licenses/by/4.0/).
Share and Cite
Popławski, T.; Kurkowski, M.; Mirowski, J. Improving the Quality of Electricity in Installations with Mixed Lighting Fittings. Energies 2020, 13, 6017. https://doi.org/10.3390/en13226017
Popławski T, Kurkowski M, Mirowski J. Improving the Quality of Electricity in Installations with Mixed Lighting Fittings. Energies. 2020; 13(22):6017. https://doi.org/10.3390/en13226017
Chicago/Turabian StylePopławski, Tomasz, Marek Kurkowski, and Jarosław Mirowski. 2020. "Improving the Quality of Electricity in Installations with Mixed Lighting Fittings" Energies 13, no. 22: 6017. https://doi.org/10.3390/en13226017
APA StylePopławski, T., Kurkowski, M., & Mirowski, J. (2020). Improving the Quality of Electricity in Installations with Mixed Lighting Fittings. Energies, 13(22), 6017. https://doi.org/10.3390/en13226017