Abstract
Carbonated water injection (CWI) is a technology with significant sweep efficiency advantages in enhanced oil recovery (EOR), but the mechanism of the microscopic diffusion of CO2 is still unclear. In this study, the diffusion mechanism of CO2 from the aqueous phase to the oleic phase in a carbonated water (CW)–decane system was investigated by the molecular dynamics simulation method. This investigation also explored the diffusion capacity and interface properties of the CW–decane system. We found that the movement of CO2 from the aqueous phase to the oleic phase can be divided into two processes: the accumulation behavior of CO2 moving from the aqueous phase to the interface, and the dissolution behavior of CO2 moving from the interface to the decane phase. The increase in the temperature and CO2 concentration in carbonated water can improve the decane phase’s diffusion ability and reduce the water–decane interfacial tension. The difference in the interactions between water–CO2 and decane–CO2 provides a driving force for the diffusion of CO2 between aqueous and oleic phase. The temperature increase intensifies the degree of diffusion and improves the diffusion rate of CO2 from the aqueous phase to the oleic phase. The diffusion coefficient results show that CO2 significantly enhances the oleic phase’s diffusion properties. In addition, the affinity of water for CO2 is increased by the hydrogen bond, and it provides a mechanism for the accumulation behavior of CO2. Further, the temperature significantly improves the CO2 diffusion ability at the interface, which promotes CO2 leaving the interface and weakens the accumulation behavior. This work provides useful information for guiding carbonated water injection to improve the recovery mechanism of enhanced oil.
1. Introduction
Injecting CO2 into depleted oil and gas reservoirs is a common method to enhance crude oil recovery [1]. However, CO2 has unfavorable properties, such as a higher mobility than crude oil, a density difference from crude oil, and gravity separation, which causes a higher residual oil saturation and lower sweep efficiency [2,3,4,5,6,7]. To overcome the above deficiencies in the process of pure CO2 injection, methods such as water alternating gas, CO2 foam flooding, simultaneous water alternating gas, and carbonated water injection (CWI) have been proposed [3,8,9].
Unlike other methods, CWI technology uses saturated CO2 water to displace formed crude oil, which has the advantages of gas injection and water injection (WI). CWI is less affected by reservoir heterogeneity, which leads to a higher sweep efficiency [10,11], and it significantly reduces the residual oil saturation and improves the oil recovery [12]. In addition, the traditional CO2 injection and WAG require continuous injection for a large amount of CO2, which leads to the economic decline of many reservoir projects. In contrast, the amount of CO2 required by CWI is relatively small, which provides a feasible strategy for many reservoirs [13].
The first CWI commercial application was the K&S project in Oklahoma in the 1960s [14]. However, due to the economic reduction of the CO2 acquisition’s costs, it was eventually terminated. Recently, CWI has received attention because it provides additional oil recovery and CO2 utilization. The feasibility of CWI technology has been verified in theory and through pilot tests. By studying sand-packs and core samples, the final recovery of crude oil was determined to be higher than water injection (WI) when CWI is used in secondary or tertiary injections [15,16]. Moreover, CO2 is gradually dissolved in crude oil during the displacement process, which is conducive to the storage of CO2 [16]. However, the unclear mechanism of enhanced oil recovery (EOR) and the potential of increasing production have restricted the popularization and application of this technology. Thus, the key scientific issues, which include the change in the basic physical properties and the diffusion process of CO2 between phases, should be addressed urgently. These problems largely determine the effect on the EOR and CO2 storage. Presently, it is generally believed that the main mechanism by which CWI improves the recovery is that which involves CO2 diffusion causing the crude oil to become more mobilized. The flow of the reservoir fluid is strongly affected by the CO2 diffusion, resulting in changes in the fluid properties, especially mobility, density, and interfacial tension (IFT), which reduces the residual oil saturation. Mostafa et al. [5] measured the interfacial tension between the different types of crude oil and CW, and they determined that the CO2 reduces the pH of the system, which enhances the ionization of the alkaline surfactants in crude oil. Seyyedi et al. [17,18] conducted a series of experiments at high temperatures and high pressures, and found that, during the contact of CW with live oil, the transfer of CO2 leads to the formation of a new phase. These new phases reconnect the captured oil, thereby increasing the recovery factor.
However, the current observation methods are not very clear in terms of the microscopic mechanism of CO2 migration, changes of the oleic phase properties, and factors that affect the water–oil interface. Comprehensive descriptions of the microscopic mechanism after the CW contacts the oleic phase are scarce. In addition, the current mathematical model cannot accurately describe the CWI process [13,19].
As a fast-developing emerging technique, molecular dynamics simulation (MD) is used increasingly in the study of CO2 geological storage and EOR [20,21,22,23]. It can help us better understand the interaction between the substances at the micro level. Zhang et al. [24] found that the swelling coefficient for CO2-saturated octane is linearly related to the solubility of CO2. Zhang et al. identified this by studying the solubility of CO2 in the CO2–octane system and the swelling of octane. Yang et al. [25] used direct interface simulation technology to analyze the interfacial tension of the NaCl–CO2–water system and explored the variation of the interfacial tension in regard to temperature, pressure, and salinity. Dai et al. [26] studied the CO2–water–butane system with MD to predict the phase equilibrium, and the calculated results agreed well with the experimental results. Liu et al. [27] studied the distribution of supercritical CO2 in the water–oil system and determined that CO2 was enriched at the interface. Although MD techniques have been used to detect the microscopic behavior of CO2–water–oil systems under reservoir conditions, research on the phase behavior and interface characteristics of CW and oil systems is very limited. In addition, the microscopic process of CW contacting oil and the diffusion process of CO2 from the aqueous phase to the oleic phase have not been reported on.
Therefore, this study uses MD to investigate the microscopic behavior of CW when it is in contact with oil. This study aims to further understand the transport mechanism of CO2 during the CWI process, the effect of CO2 on the CW–oil interface’s characteristics, and the effect of CW–oil contact on the mobility of the oleic phase. The rest of this paper is structured as follows: Section 2 describes the details of MD and the calculation method. Then, Section 3 discusses the diffusion and distribution of CO2 in the system after the CW–oil contact, and explains the microscopic mechanism through the diffusion properties, interface characteristics, and molecular interactions of the system. Section 4 presents the conclusion of this study. This work is helpful in better understanding the mechanism of CWI in the reservoir that enhances the recovery and provides a basis for scientific and industrial research.
2. Simulation Method
2.1. Simulation Details
The open source package “LAMMPS” [28] was used to perform parallel computing. The simulation system contains three substances: water, CO2 and decane (an alkane widely used to simulate the oleic phase). The water, CO2, and decane were modeled using SPC/E [29], EPM2 [30], and OPLS-AA force field [31]. SPC/E is a widely recognized model for water molecules, and it has excellent predictive capabilities for the thermodynamic properties, time-varying properties, and phase equilibrium. The EPM2 model describes the thermodynamic properties of CO2, especially in the near-critical region. OPLS-AA force field is suitable for the condensed nature of organic solvents. Additional model parameters are described in detail in Table S1 (in the supplementary material). The energy form of the system is described as follows:
where is the total energy, is the bond stretching interaction, is the angle bending interaction, is the dihedral torsioning interaction, is the van der Waals (vdW) interaction, and is the coulomb interaction. Water molecules and CO2 molecules are treated as rigid bodies by the SHAKE algorithm [32]. The non-bonding vdW interaction when using the Lennard-Jones 12-6 function and the coulomb interaction are described as follows:
where is the distance between atom i and atom j, and represent the vdW interaction parameter, and q is the atomic charge. The particle-particle particle-mesh (PPPM) algorithm [33] was used for the long-range Coulombic interaction, while the cutoff for the short-range interaction was set to 14 Å. The parameters between dissimilar molecules were mixed with geometric rules, as follows:
The initial configuration of the simulation box consists of three parts, including two CW regions and one oil region, as shown in Figure 1. Each CW region includes 4000 water molecules and 0, 34, and 68 CO2 molecules, which corresponds to a CW flow with a CO2 mass fraction (ωCO2) of 0.0%, 2.0%, and 4.0%, respectively. The oleic phase includes 400 decane molecules. Each region is set as an orthogonal box in which the dimensions are Lx × Ly × Lz, where Lx = Ly = 4 nm, and Lz is determined by the density of the solution, which is about 8 nm. Periodic boundaries were used in all of the dimensions. The box is large enough to completely observe the CO2 diffusion between the phases.
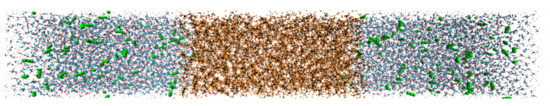
Figure 1.
Perspective drawing of the CW–decane system at 353 K and 20 MPa. C (decane), H (decane), O (water), and H (water) are represented by black, orange, blue, and red spheres, respectively. C and O in CO2 are represented by green spheres.
At the initial configuration of the system, each region was separately relaxed by 2 ns to reach the set temperature and pressure to ensure a uniform distribution of the system, then the three regions were spliced according to the interface (a more detailed relaxation process is described in the supplementary material). According to the Gaussian distribution, the initial atomic velocity of the spliced system was reset to the desired temperature. By modifying the random number of the atomic velocity, three repeated experiments were carried out in each condition. Thereafter, the CW–decane system was simulated for 30 ns under the isothermal–isobaric ensemble (NPT), with the Nose–Hoover method [34]. The simulation runs with a time step of 1 fs, and atom trajectories were dumped once per 1000 fs for the required statistical results.
2.2. Calculation Methods
The density profile was calculated by dividing the simulation box into slices with a thickness of 1Å along the z-axis, as shown in Figure 2a. We determined the interface of the CW–decane according to the Gibbs dividing surface (GDS) [35], where the atom number of excess decane in the aqueous phase was almost the same as the atom number of excess water in the oleic phase. Owing to the discontinuity at the CW–decane interface, the density profile at the interface could be fitted as an empirical hyperbolic tangent function (tanh) [36] as follows:
where and represent the density of the water and oleic phase away from the interface, represents the position of the water–decane interface, and is a fitting parameter related to the interface width. The “10–90” rule [37] was used to determine the interface width , i.e., .
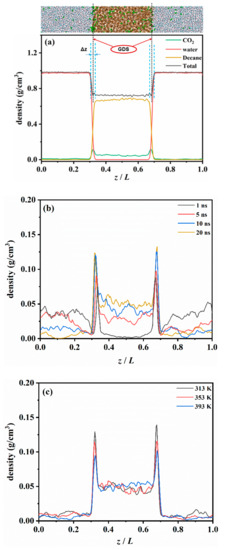
Figure 2.
Density profile along the interface direction (z axis) of the CW-decane system with 4% ωCO2. (a) Equilibrium distribution of each component at 353 K and 20 MPa. (b) Time-varying distribution of CO2 at 353K and 20 MPa. (c) The effect of temperature on the CO2 distribution after the CW–decane system reaches equilibrium at 20 MPa.
The interfacial tension (IFT), which is an important property of the phase interface, can be calculated by the diagonal element of the pressure tensor , , and as follows:
where is the size of the box in the z-axis direction, ⟨ ⟩ represents an ensemble average. The time period after system equilibrium is divided into several blocks to estimate the uncertainty of the results.
The diffusion coefficient () can be obtained by calculating the mean square displacement as follows:
where is the coordinate of the atom i at time t, and is the coordinate of the i atom at time 0.
The interaction energies between two components can be calculated by Equation (8):
where is the total energy of the whole system containing components A and B, and and are the energy of components A and B, respectively.
3. Results and Discussion
3.1. CO2 Diffusion Behavior after Phases Contact
3.1.1. Diffusion Process and Distribution of CO2
To quantitatively describe the distribution of CO2 in the diffusion process, the density profiles of each component along the vertical interface direction (z axis) were calculated. The results of the water–decane binary system were compared with the National institute of standards and technology (NIST) database to prove the reliability of the calculation results (see Table S1 in the Supplementary Materials for more details).
Figure 2b shows the diffusion of CO2 from the aqueous phase to the oleic phase after the phases contact each other. The figure illustrates that, at 1 ns, basically no CO2 exists in the oleic phase. However, the density curve has a noticeable peak at the interface, which implies that a large amount of CO2 is accumulated at the water–oil interface. As the contact time progressed, the amount of CO2 in the oleic phase continued to increase, and the peak value at the interface also increased. In addition, the peak growth rate was rapid at the beginning and then gradually slowed down. This implies that the CO2 at the interface gradually reached saturation. Finally, the peak value fluctuated slightly within a certain range before the system reached equilibrium. The above phenomenon shows that the diffusion of CO2 from the aqueous phase to the oleic phase can be divided into two processes. The first process is the accumulation behavior of the CO2 in the CW’s move towards the interface. The second one is the dissolution behavior of the CO2 at the interface moving towards the oleic phase. This can be observed from the accumulation rate of CO2 at the interface. During the initial stage of diffusion, the diffusion of CO2 was mainly based on the accumulation behavior. The increase in the concentration of CO2 at the interface also enhanced the dissolution of CO2 into the oil, and the two processes were mostly synchronized in time thereafter.
Figure 2a shows the density profile of the CW–decane system after equilibrium. The density profile results show that the peak of the CO2 curve at the water–oil interface was about 0.114g/cm3, while in the aqueous and decane phases, it was 0.008 and 0.047 g/cm3, respectively. When the system is in equilibrium, the distribution of CO2 in the CW–decane system has the order of interface > oleic phase > aqueous phase. A large number of CO2 molecules tend to accumulate at the CW–decane interface, which will have a significant effect on the interface properties. In addition, the distribution of CO2 in the CW–decane system also demonstrates that the solubility of CO2 in the oleic phase is stronger than in the aqueous phase. When the system reaches equilibrium, even if the solubility of CO2 in the oleic phase is not saturated (CO2 concentration is far from saturated solubility), the CO2 in the aqueous phase will not continue to move to the oleic phase. The CO2 distribution between the aqueous and oleic phases according to a certain partition coefficient () [11], which reflects the diffusion degree of CO2 to the oleic phase, is presented in Table 1. The calculation results are in good agreement with the previous experiments [11,38,39]. When the temperature rose from 313 K to 393 K, increased from 4.22 to 7.25. This implies that the increase in temperature enhanced the diffusion degree of CO2 from the aqueous phase to the oleic phase, which is beneficial to transferring CO2 to the oleic phase.

Table 1.
Partition coefficients of CO2 in the CW–decane system with 4% ωCO2 at 20 MPa.
3.1.2. Mechanism of CO2 Diffusion Process
The diffusion of CO2 in the CW–decane system could be described by the changing intermolecular interaction; thus, the interaction energy of water–CO2 (Ewater-CO2) and decane–CO2 (Edecane-CO2) was calculated. Figure 3 shows how the Ewater-CO2 and Edecane-CO2 change with time at different temperatures. At 1 ns, the Ewater-CO2 at 313 K was −713 kcal/mol, which is much greater than the –121.825 kcal/mol for Edecane-CO2. The results show that, in the initial stage, the interaction between decane and CO2 was very weak. At this stage, CO2 mainly depends on its self-diffusion ability to move in the aqueous phase. When CO2 moves to the near-interface area, it will accumulate at the interface due to the combined action of water and decane. In the next 2–20 ns, the Ewater-CO2 decreased rapidly, while Edecane-CO2 increased significantly. This was the main period for the diffusion of CO2 from CW to decane. The concentration of CO2 on the front edge of the aqueous phase decreased, which caused the CO2 in the aqueous phase to move continuously to the region near the interface. Finally, the Ewater-CO2 and Edecane-CO2 no longer changed, but a small fluctuation existed, which showed that the CO2 was in equilibrium in the system. After equilibrium, the Edecane-CO2 was larger than the Ewater-CO2, which shows that the water and decane remained attractive to CO2, which caused the CO2 to be distributed into two phases. However, the interaction between CO2 and decane was stronger; thus, the CO2 preferred to dissolve in the oleic phase. In addition, the temperature rise reduced the Ewater-CO2 after the system reached equilibrium, and this increased the Edecane-CO2. This implies that the temperature promoted the diffusion of CO2 from the aqueous phase to the oleic phase. This clarifies the reason why the partition coefficient increased with temperature from the micro level.
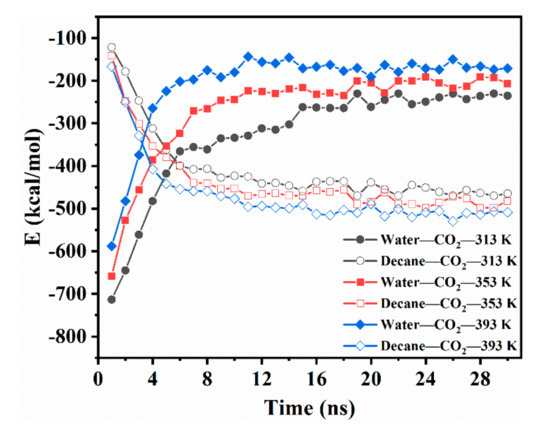
Figure 3.
Intermolecular energetic interactions for the CW–decane system with 4% ωCO2 at 20 MPa as a function of time.
From the microscopic contact process of the CW–decane system, it can be observed that after contact, the CO2 in the aqueous phase tended to diffuse into the oleic phase, and a large amount of CO2 accumulated at the water–oil interface during the diffusion process. This has an important effect on the properties of the oleic phase and the CW–decane interface. In addition, this further affects the oil recovery in the process of CO2–EOR.
3.2. CO2 Diffusion Coefficient and Its Effect on Phase Diffusivity
Determining the diffusion coefficient (D) for each component in a multi-component system is a challenge. However, by using MD techniques, we can directly determine the transport properties of each component under a variety of thermodynamic conditions in a complex system. To further study the diffusion ability of CO2 after phase contact, DCO2 under different temperature conditions was explored.
3.2.1. The DCO2 along the Vertical Interface Direction
While considering the anisotropy of CO2 diffusion in the system, the one-dimensional diffusion of CO2 in the direction vertical to the interface (z axis) was studied. As shown in Figure 4, DCO2 had an increasing trend at the beginning. This implies that the accumulation behavior of the initial stage promotes the diffusion of CO2. With the continuous transfer of CO2 in the medium-term of diffusion, DCO2 shows a downward trend. During this period, a large amount of CO2 dissolves into decane, and the deepening of the diffusion gradually weakens the driving force. Finally, the CO2 reaches a dynamic equilibrium in the system and DCO2 is unchanged. The temperature increase causes an evident rise in the initial diffusivity of CO2 between the two phases. In addition, the higher the temperature, the earlier the curve falls, and the system reaches equilibrium sooner. At a temperature of 393 K, the diffusion curve drops rapidly, and the system reaches equilibrium at 16 ns. At 353 K, equilibrium is reached at 25 ns. At a temperature of 313 K, the DCO2 decreased slowly with time. Compared to 353 K, the equilibrium time at 393 K was reduced by 36%. In summary, we believe that CO2 is affected by the difference in the interaction between water–CO2 and decane–CO2, and causes CO2 to continue diffusing into the oleic phase. Because the movement of CO2 during the initial stage of diffusion enhances the interaction between CO2 and decane, the initial diffusion rate increases. Then, with the continuous diffusion of CO2, the driving force caused by the interaction difference is weakened, and the diffusivity gradually decreases until the system reaches equilibrium.
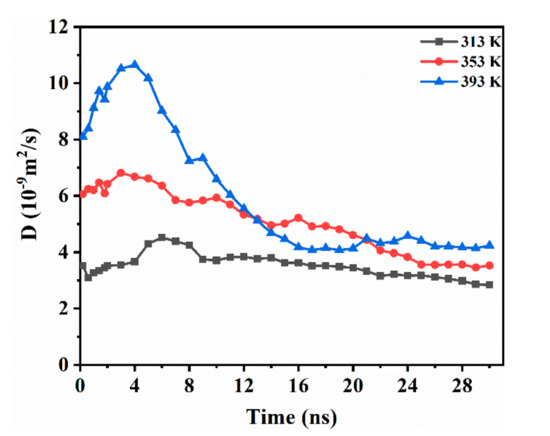
Figure 4.
DCO2 along the interface direction (z axis) while varying with time for the CW–decane system with 4% ωCO2 at 20 MPa.
3.2.2. The DCO2 in Different Regions of the CW–Decane System
It is worth noting that the concentration of CO2 starts to decrease from the front edge of the aqueous phase during diffusion (Figure 2b); however, the CO2 at this position is not completely exhausted. This indicates that CO2 has a good transport capacity in the aqueous phase during diffusion [40]. This allows CO2 in the aqueous phase to diffuse to the interface continuously. We determined that, when the CO2 leaves the interface under the attraction of decane, it diffuses rapidly in the oleic phase. This makes the distribution of CO2 in the oleic phase more uniform than in the aqueous phase, indicating that the diffusion capacity of CO2 in oil may be stronger in the aqueous phase. Therefore, the diffusion capacity of the different locations in the system was evaluated.
The DCO2 in the aqueous phase, the interface, and the oleic phase was calculated by selecting different regions in the system. The thickness of each calculation region in the aqueous and oleic phases was 3 nm, and that of the calculation area at the interface was Δz, which is provided in Table 2. The results are presented in Figure 5. It can be observed that the DCO2 in the oleic phase was significantly higher than that in the aqueous phase. Fang [41] indicated that there are voids in the oleic phase that are not occupied by decane molecules due to the entanglement of the alkane chains, which is defined as a free volume. CO2 can rapidly penetrate into the free volumes, which are larger than the molecular volume of CO2. Adjacent free volume connections can form tiny channels in the oleic phase, which helps CO2 move rapidly into the oleic phase [41]. In addition, there is an extra hydrogen bond (H-bond) interaction between water and CO2, which will weaken the diffusion capacity of CO2 in water [42]. Furthermore, the temperature effect on the DCO2 at the interface was more noticeable. At 313 K, DCO2 at the interface was similar to that in the oleic phase, and when the temperature rose to 393 K, the DCO2 at the interface was greater than that in the oleic phase. This implies that, at high temperatures, the activity of CO2 at the interface is stronger, which will promote CO2 to leave the interface and transfer to the oleic phase.
Table 2.
Calculated results of the diffusion coefficient and the interfacial properties after the CW–oil system equilibrium at 20 MPa.
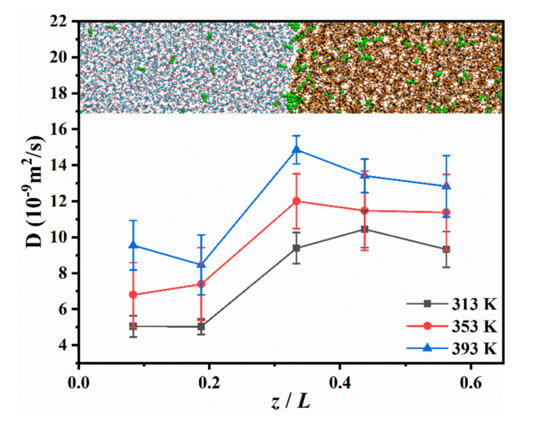
Figure 5.
DCO2 at different locations in the CW–decane system with 4% ωCO2 at 20 MPa.
3.2.3. Effect of CO2 on Diffusivity of Oleic Phase
The self-diffusion coefficients of the aqueous phase and the oleic phase were calculated and the effect of temperature and CO2 concentration were explored on the diffusion capacity of the CW–decane system. The results are displayed in Table 2. The results of the comparison with others’ experiments are shown in Figures S1 and S2 [43,44,45].
The increase in temperature renders the thermal motion of the molecules more intense and enhances the diffusion ability of the molecules. The temperature has a significant effect on the diffusivity of the water phase and the oleic phase. When the temperature increased from 313 K to 393 K, the diffusion coefficient of the water phase increased from 3.367 × 10⁻⁹ m2/s to 7.970 × 10⁻⁹ m2/s, while the oleic phase increased from 0.954 × 10⁻⁹ m2/s to 2.142 × 10⁻⁹ m2/s. Meanwhile, as the concentration of CO2 in carbonated water increased, the diffusivity of the oleic phase also increased. The CW of 4% ωCO2 increased the oleic phase’s diffusion coefficient from 1.329 × 10⁻⁹ m2/s to 1.497 × 10⁻⁹ m2/s, an increase of approximately 12%. However, the change in the diffusion capacity of the aqueous phase was very small. From this, it is seen that increasing the CO2 concentration in CW will not have a significant impact on the mobility of CW; however, diffusing CO2 into the oleic phase can reduce the viscosity of the oleic phase and improve the mobility of the oleic phase.
3.3. CO2 Accumulation and Its Effect on the CW–Decane Interface
During the diffusion of CO2 from the aqueous phase to the oleic phase, it will not be precipitated as free gas, and the phenomenon of accumulation at the interface will be observed. This will change the nature of the water–oil interface and affect the efficiency of CWI. Sohaib [46] demonstrated that the difference in the IFT between water–CO2 and water–decane results in the accumulation of CO2. However, its microscopic mechanism has not yet been elucidated. Therefore, the mechanism of CO2 accumulation behavior and its impact on the interface properties was studied in this work.
3.3.1. Interfacial Tension of the CW–Decane Interface
The IFT of the CW–decane interface was analyzed to express the effect of the CO2 concentration and temperature on the IFT through five sets of experiments. As indicated in Table 2, the IFTs agree well with the previous studies [47,48].
Compared with pure water, the CW with 2% ωCO2 reduced the IFT from 52.51 mN/m to 50.29 mN/m at 353 K. With a higher CO2 concentration, there was a more noticeable decrease in the IFT. When the CW was 4% ωCO2, it dropped to 49.16 mN/m. This shows that CWI has less IFT after contact with oil than WI, which provides a higher recovery potential. The increase in temperature will also reduce the IFT of CW–oil, and similar conclusions have been reported [49]. We determined that as the temperature increases, the peak CO2 at the interface decreases, as shown in Figure 2c. The increase in temperature weakens the CO2 accumulation behavior. This is because the increase in temperature significantly increases the diffusion capacity of CO2 in the interfacial region. This also enhances the CO2 leaving the interface as it diffuses into the oleic phase, thus reducing the peak CO2. The reduction in CO2 concentration at the interface weakens the effect of CW to reduce the interfacial tension. However, the CO2 accumulation behavior at the CW–decane interface is similar to that of aromatic hydrocarbons [50], which act as a surfactant. The increase in temperature increases the activity of CO2, which promotes the reduction of IFT.
Due to the strong hydrophobicity of alkanes, there is a clear interface between the aqueous and oleic phases. Therefore, the variation for the CW–decane interface width, Δz, was explored, as shown in Table 2. The calculation results show that when CO2 accumulates at the water–oil interface, the interface becomes wider under the influence of CO2. In addition, the increase in the CO2 concentration and temperature makes the Δz increase more noticeable. The increase in Δz implies that the two-phase molecules penetrate each other, which is beneficial for reducing IFT.
3.3.2. Structural Properties of CW–Decane Interface
The change in the IFT is a result of the change in the interface structural properties; thus, we explore the structural properties in the interface region to explain the IFT change.
Figure 6 describes the radial distribution function (RDF) of the water–decane molecules at the interface at 353 K and 20 MPa. It can be observed that the two curves have only one peak, and no second peak appears. This implies that, at the interface, the water–decane molecules showed a loose and disordered structure. When the CO2 concentration was 0%, the first peak of the RDF was located at 4.35 Å with an amplitude of 21.5. When the CO2 concentration was 4%, the first peak of the RDF was located at 4.75 Å with an amplitude of 19.4. The presence of CO2 at the interface made the amplitude lower and the position of the peak increased. The RDF describes the probability that a decane molecule is present at a distance r from a water molecule. The possibility decreases with an increasing CO2 concentration. This shows that the accumulation behavior increases the average relative distance between the water and decane molecules. The solution structure at the interface was looser, which had an important effect on the reduction of the interfacial tension.
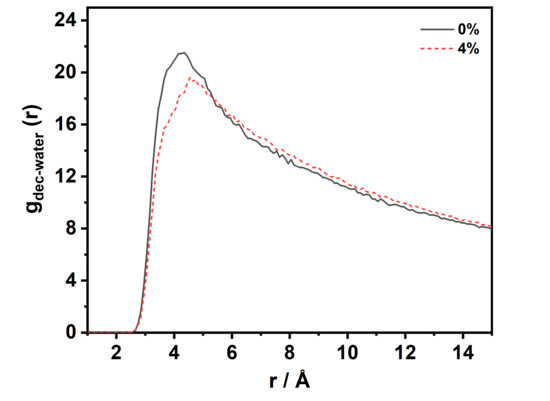
Figure 6.
RDF of C (decane)–O (water) at the interfacial in the CW–decane system with a different CO2 concentration at 353 K and 20 MPa.
The hydrogen bonds (H–bond) between the water molecules have an important influence on the structural strength of the solution. In liquid water, a dynamic H bond network can be formed, which also forms clusters of water molecules. This makes the connection between the water molecules closer, which affects the interfacial tension. Therefore, we explored the H bond number at the CW–decane interface. Given that the lifetime of H bonds is generally between 1–20 ps, 200 configurations were counted after system equilibrium and the time interval between each configuration was 10 ps. As shown in Figure 7, more H bonds were generated between water and CO2 as the CO2 concentration in the CW increased. Meanwhile, the number of H bonds between water molecules gradually decreased since the H bonds reached saturation. When the H bonds between the oxygen molecules in CO2 and the hydrogen in water form, due to the mutual repulsion between the negative ions, the oxygen atom is more difficult to access for other water molecules. The above shows that the network structure between the water molecules at the interface is weakened by the influence of the CO2 molecules, which reduces the interaction between the water molecules and promotes the mutual penetration of molecules at the interface. H bonds enhance the interaction and make the structure between water and CO2 more stable, which is conducive to the accumulation behavior of CO2.
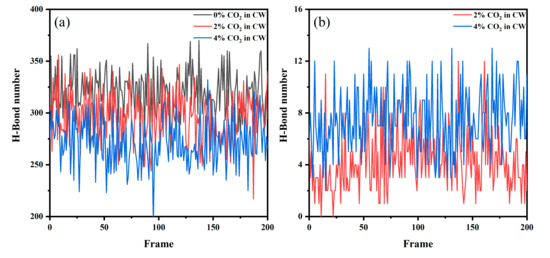
Figure 7.
The number of H–bonds at the CW–decane interface at 353 K and 20 MPa: (a) between hydrogen (water) and oxygen (water) and (b) between hydrogen (water) and oxygen (CO2).
3.3.3. Intermolecular Interactions
As shown in Table 3, we assessed the structural and energy change at the interface of the CW–decane system by determining the interaction between CO2, water and decane with different CO2 concentrations. When the CW was 0% ωCO2, the Ewater-water was higher than the Edecane-decane; however, both were larger than the Ewater–decane. This implies that the attraction of water and decane is weaker, which makes it difficult for water and decane to be miscible and form a stable interface. As the concentration of CO2 increased, the Ewater–decane decreased, while the Ewater-CO2 and Edecane-CO2 increased. This shows that the CO2 at the interface does not play a role in enhancing the Ewater–decane to reduce the interfacial tension, but it acts as a bridge at the interface by enhancing the Ewater-CO2 and Edecane–CO2. In addition, the Ewater-CO2 was slightly larger than the Edecane-CO2. This is because the effect of the H bonds at the interface gives the water at the interface a stronger affinity for CO2, which inhibits the movement of CO2 to the oleic phase.
Table 3.
Intermolecular energetic interactions (kcal/mol) in the interfacial region at 353 K and 20 MPa.
In summary, the H bond effect makes the affinity of water for CO2 stronger than for decane, which inhibits the diffusion of CO2 to the oleic phase, causing an accumulation of CO2 at the interface. Due to the saturation of the H bonds, the affinity of water for CO2 is very limited. When the concentration of CO2 at the interface gradually increases, CO2 diffuses into the oleic phase. In addition, the formation of H bonds between CO2 and water destroys the stable network structure of water. As such, decane can be further extended to the aqueous phase through CO2 that is accumulated at the interface, which enhances the mutual permeability of water and decane, making the interface wider and reducing the IFT.
4. Conclusions
The molecular dynamics simulation method was used to study the CO2 diffusion process in the CW–decane contact process. The effects of the CO2 in the CW on the system’s diffusion capacity and the water–oil interfacial properties were also investigated. The results of the system density profile show that the diffusion of CO2 from the aqueous phase to the oleic phase is mainly divided into two processes: the accumulation behavior of CO2 moving from the aqueous phase to the interface, and the dissolution behavior of CO2 moving from the interface to the oleic phase. The accumulation behavior was dominant at the start of the simulation. In most instances thereafter, the two behaviors were observed simultaneously. Once the system is in equilibrium, due to the fact that interaction of water with CO2 is stronger than that of decane with CO2, the partition coefficients of CO2 in the oleic phase are higher than in the aqueous phase. Furthermore, the partition coefficients increase as the temperature rises.
By evaluating the diffusion properties of the system, the diffusion coefficients of the two phases were changed by CO2. Compared with WI without CO2, a CW with 4% ωCO2 increased the diffusion capacity of the oleic phase by 12%; however, water phase enhancement was not evident. Specifically, the temperature has a significant effect on the CO2 diffusion capacity of the system. The equilibrium time of the system at 353 K was 25 ns, whereas at 393 K, the equilibrium time was 16 ns, which is a reduction of nearly 36%. The diffusion coefficients of CO2 in the oleic phase were stronger than those in the water phase. The reason is that the hydrogen bonds between CO2 and water weaken the diffusion capacity of CO2 in the aqueous phase, as well as the fact that the free volume in the oleic phase is beneficial for CO2 diffusion.
Research on the properties of the CW–oil interface shows that the accumulation behavior of CO2 during the diffusion process is caused by the hydrogen bonds between water and CO2 enhancing water’s affinity for CO2. This inhibits the diffusion of CO2 to the oleic phase, which causes CO2 to accumulate at the interface. Due to the saturation of the hydrogen bonds, the attraction of the interface to CO2 is limited. When the concentration of CO2 at the interface increases, it continuously diffuses to the oleic phase. The formation of hydrogen bonds between water and CO2 destroys the water network structure at the interface, and the decane molecules can further extend into the water phase through the CO2 that is accumulated at the interface. This causes the structure within the interface to be looser and the mutual permeability of the two-phase molecules to be enhanced. As such, the interface width increases and the interface tension decreases. In addition, the temperature significantly improves the diffusion capacity of CO2 in the interface region. It promotes the CO2 moving from the interface into the oleic phases, and weakens the accumulation behavior of CO2.
In summary, this study describes the dynamic process of CO2 diffusion during CW–oil contact. This research describes important details about the transport properties and interface characteristics of the CWI process, which helps with the application of CWI to improve the recovery. However, in addition to aliphatic hydrocarbon chains, crude oil contains a large number of complex components such as aromatic hydrocarbons, resins, asphaltenes, and dissolved gases. Therefore, the effect of CW on multicomponent oil systems will be further considered in the future.
Supplementary Materials
The following are available online at https://www.mdpi.com/1996-1073/13/22/6031/s1, Figure S1: Water diffusion coefficient, Figure S2: Decane diffusion coefficient, Figure S3: Interface tension of water/decane, Table S1: Interatomic interaction parameters, Table S2: The density values of water phase and oil phase.
Author Contributions
Conceptualization, L.Y. and Y.Z.; methodology, L.Y.; software, L.Y.; validation, L.Y., C.Z. and Y.X.; formal analysis, Y.X.; investigation, L.Y.; resources, L.Y.; data curation, C.Z.; writing—original draft preparation, L.Y.; writing—review and editing, L.Y.; visualization, Y.X.; supervision, Y.Z.; project administration, Y.Z.; funding acquisition, Y.Z. All authors have read and agreed to the published version of the manuscript.
Funding
This research was funded by the National Natural Science Foundation of China (Grants 51976024), and the National Key R&D Program of China (Grants 2016YFB0600804).
Conflicts of Interest
The authors declare no conflict of interest.
References
- Bui, M.; Adjiman, C.S.; Bardow, A.; Anthony, E.J.; Boston, A.; Brown, S.; Fennell, P.S.; Fuss, S.; Galindo, A.; Hackett, L.A.; et al. Carbon capture and storage (CCS): The way forward. Energy Environ. Sci. 2018, 11, 1062–1176. [Google Scholar] [CrossRef]
- Riazi, M. Pore Scale Mechanisms of Carbonated Water Injection in Oil Reservoirs. Ph.D. Thesis, Heriot Watt University, Edinburgh, UK, 2011. [Google Scholar]
- Nevers, N.H. Carbonated waterflooding: Is it a lab success and a field failure. World Oil 1966, 163, 93–96. [Google Scholar]
- Seyyedi, M.; Mahzari, P.; Sohrabi, M. A comparative study of oil compositional variations during CO2 and carbonated water injection scenarios for EOR. J. Pet. Sci. Eng. 2018, 164, 685–695. [Google Scholar] [CrossRef]
- Lashkarbolooki, M.; Riazi, M.; Ayatollahi, S. Effect of CO2 and natural surfactant of crude oil on the dynamic interfacial tensions during carbonated water flooding: Experimental and modeling investigation. J. Pet. Sci. Eng. 2017, 159, 58–67. [Google Scholar] [CrossRef]
- Esene, C.; Rezaei, N.; Aborig, A.; Zendehboudi, S. Comprehensive review of carbonated water injection for enhanced oil recovery. Fuel 2019, 237, 1086–1107. [Google Scholar] [CrossRef]
- Song, Y.; Zhao, C.; Chen, M.; Chi, Y.; Zhang, Y.; Zhao, J. Pore-scale visualization study on CO2 displacement of brine in micromodels with circular and square cross sections. Int. J. Greenh. Gas Control 2020, 95. [Google Scholar] [CrossRef]
- Kulkarni, M.M.; Rao, D.N. Experimental investigation of miscible and immiscible Water-Alternating-Gas (WAG) process performance. J. Pet. Sci. Eng. 2005, 48, 1–20. [Google Scholar] [CrossRef]
- Sohrabi, M.; Riazi, M.; Jamiolahmady, M.; Kechut, N.I.; Ireland, S.; Robertson, G. Carbonated Water Injection (CWI)—A productive way of using CO2 for oil recovery and CO2 storage. In Proceedings of the 10th International Conference on Greenhouse Gas Control Technologies, Amsterdam, The Netherlands, 19–23 September 2010; Gale, J., Hendriks, C., Turkenberg, W., Eds.; Elsevier: Amsterdam, The Netherlands, 2011; Volume 4, pp. 2192–2199. [Google Scholar]
- Mosavat, N.; Torabi, F. Micro-optical analysis of carbonated water injection in irregular and heterogeneous pore geometry. Fuel 2016, 175, 191–201. [Google Scholar] [CrossRef]
- Shu, G.; Dong, M.; Chen, S.; Hassanzadeh, H. Mass transfer of CO2 in a carbonated water-oil system at high pressures. Ind. Eng. Chem. Res. 2017, 56, 404–416. [Google Scholar] [CrossRef]
- Mosavat, N.; Torabi, F. Experimental evaluation of the performance of carbonated water injection (CWI) under various operating conditions in light oil systems. Fuel 2014, 123, 274–284. [Google Scholar] [CrossRef]
- Kechut, N.I.; Jamiolahmady, M.; Sohrabi, M. Numerical simulation of experimental Carbonated Water Injection (CWI) for improved oil recovery and CO2 storage. J. Pet. Sci. Eng. 2011, 77, 111–120. [Google Scholar] [CrossRef]
- Hickok, C.W.; Ramsay, H.J., Jr. Case histories of carbonated waterfloods in Dewey-Bartlesville field. Case histories of carbonated waterfloods in Dewey–Bartlesville field. In Proceedings of the SPE Secondary Recovery Symposium, Wichita Falls, TX, USA, 7–8 May 1962. [Google Scholar]
- Riazi, M.; Sohrabi, M.; Jamiolahmady, M.; Ireland, S.; Brown, C. Oil Recovery improvement using CO2-enriched water injection. In Proceedings of the EUROPEC/EAGE Conference and Exhibition, Amsterdam, The Netherlands, 8–11 June 2009. [Google Scholar]
- Mosavat, N.; Torabi, F. Application of CO2-saturated water flooding as a prospective safe CO2 storage strategy. In Proceedings of the 12th International Conference on Greenhouse Gas Control Technologies, Ghgt-12, Austin, TX, USA, 5–9 October 2014; Dixon, T., Herzog, H., Twinning, S., Eds.; Elsevier: Amsterdam, The Netherlands, 2014; Volume 63, pp. 5408–5419. [Google Scholar]
- Seyyedi, M.; Mahzari, P.; Sohrabi, M. An integrated study of the dominant mechanism leading to improved oil recovery by carbonated water injection. J. Ind. Eng. Chem. 2017, 45, 22–32. [Google Scholar] [CrossRef]
- Seyyedi, M.; Sohrabi, M. Pore-scale investigation of crude Oil/CO2 compositional effects on oil recovery by carbonated water injection. Ind. Eng. Chem. Res. 2017, 56, 1671–1681. [Google Scholar] [CrossRef]
- Hasanvand, M.Z.; Ahmadi, M.A.; Shadizadeh, S.R.; Behbahani, R.; Feyzi, F. Geological storage of carbon dioxide by injection of carbonated water in an Iranian oil reservoir: A case study. J. Pet. Sci. Eng. 2013, 111, 170–177. [Google Scholar] [CrossRef]
- Seyyedattar, M.; Zendehboudi, S.; Butt, S. Molecular dynamics simulations in reservoir analysis of offshore petroleum reserves: A systematic review of theory and applications. Earth Sci. Rev. 2019, 192, 194–213. [Google Scholar] [CrossRef]
- Chen, C.; Wan, J.; Li, W.; Song, Y. Water contact angles on quartz surfaces under supercritical CO2 sequestration conditions: Experimental and molecular dynamics simulation studies. Int. J. Greenh. Gas Control 2015, 42, 655–665. [Google Scholar] [CrossRef]
- Hu, H.; Li, X.; Fang, Z.; Wei, N.; Li, Q. Small-molecule gas sorption and diffusion in coal: Molecular simulation. Energy 2010, 35, 2939–2944. [Google Scholar] [CrossRef]
- Ma, Z.; Ranjith, P.G. Review of application of molecular dynamics simulations in geological sequestration of carbon dioxide. Fuel 2019, 255. [Google Scholar] [CrossRef]
- Zhang, J.; Pan, Z.; Liu, K.; Burke, N. Molecular simulation of CO2 solubility and its effect on octane swelling. Energy Fuels 2013, 27, 2741–2747. [Google Scholar] [CrossRef]
- Liu, Y.; Lafitte, T.; Panagiotopoulos, A.Z.; Debenedetti, P.G. Simulations of vapor–liquid phase equilibrium and interfacial tension in the CO2-H2O-NaCl system. Aiche J. 2013, 59, 3514–3522. [Google Scholar] [CrossRef]
- Makimura, D.; Kunieda, M.; Liang, Y.; Matsuoka, T.; Takahashi, S.; Okabe, H. Application of molecular simulations to CO2-enhanced oil recovery: Phase equilibria and interfacial phenomena. SPE J. 2013, 18, 319–330. [Google Scholar] [CrossRef]
- Bing, L.; Shi, J.; Wang, M.; Zhang, J.; Sun, B.; Yue, S.; Sun, X. Reduction in interfacial tension of water-oil interface by supercritical CO2 in enhanced oil recovery processes studied with molecular dynamics simulation. J. Supercrit. Fluids 2016, 111, 171–178. [Google Scholar]
- Plimpton, S. Fast parallel algorithms for short-range molecular dynamics. J. Comput. Phys. 1995, 117, 1–19. [Google Scholar] [CrossRef]
- Berendsen, H.J.C.; Grigera, J.R.; Straatsma, T.P. The missing term in effective pair potentials. J. Phys. Chem. 1987, 91, 6269–6271. [Google Scholar] [CrossRef]
- Harris, J.G.; Yung, K.H. Carbon dioxide’s liquid-vapor coexistence curve and critical properties as predicted by a simple molecular model. J. Phys. Chem. 1995, 99, 12021–12024. [Google Scholar] [CrossRef]
- Jorgensen, W.L.; Maxwell, D.S.; TiradoRives, J. Development and testing of the OPLS all-atom force field on conformational energetics and properties of organic liquids. J. Am. Chem. Soc. 1996, 118, 11225–11236. [Google Scholar] [CrossRef]
- Andersen, H.C. Rattle: A “velocity” version of the shake algorithm for molecular-dynamics calculations. J. Comput. Phys. 1983, 52, 24–34. [Google Scholar] [CrossRef]
- Hockney, R.W.; Eastwood, J.W. Computer Simulation Using Particles; CRC Press: Boca Raton, FL, USA, 1988. [Google Scholar]
- Shinoda, W.; Shiga, M.; Mikami, M. Rapid estimation of elastic constants by molecular dynamics simulation under constant stress. Phys. Rev. B 2004, 69, 8. [Google Scholar] [CrossRef]
- Chattoraj, D.K.; Birdi, K.S. Adsorption and the Gibbs Surface Excess; Experimental Methods and Procedures; Springer: New York, NY, USA, 1984. [Google Scholar]
- Matsumoto, M.; Kataoka, Y. Study on liquid vapor interface of water. I. Simulational results of thermodynamic properties and orientational structure. J. Chem. Phys. 1988, 88, 3233–3245. [Google Scholar] [CrossRef]
- Rowlinson, J.S.; Widom, B. Molecular Theory of Capillarity; Courier Corporation: Honolulu, HI, USA, 1982; 327p. [Google Scholar]
- Daniel, R.; Gaddy, V.L. Natural barriers formed in the region of hydrocarbon reservoirs. Bany. Kohasz Lapok Koolaj Floidgaz 1972, 5, 37–45. [Google Scholar]
- Balint, V. Methode de prevision du comportement d’un gisement d’huile balaye par du gaz carbonique. In Proceedings of the Communication 27, Colloque ARTEP, Rueil-Malmaison, France, 7–9 June 1971. [Google Scholar]
- Shu, G.; Dong, M.; Hassanzadeh, H.; Chen, S. Effects of operational parameters on diffusion coefficients of CO2 in a carbonated water-oil system. Ind. Eng. Chem. Res. 2017, 56, 12799–12810. [Google Scholar] [CrossRef]
- Fang, T.; Shi, J.; Sun, X.; Shen, Y.; Yan, Y.; Zhang, J.; Liu, B. Supercritical CO2 selective extraction inducing wettability alteration of oil reservoir. J. Supercrit. Fluids 2016, 113, 10–15. [Google Scholar] [CrossRef]
- Mohammed, S.; Gadikota, G. The influence of CO2 on the structure of confined asphaltenes in calcite nanopores. Fuel 2019, 236, 769–777. [Google Scholar] [CrossRef]
- Harris, K.R.; Woolf, L.A. Pressure and temperature dependence of the self diffusion coefficient of water and oxygen-18 water. J. Chem. Soc. Faraday Trans. 1 Phys. Chem. Condens. Phases 1980, 76, 377–385. [Google Scholar] [CrossRef]
- Prielmeier, F.X.; Lang, E.W.; Speedy, R.J.; Lüdemann, H.-D. The pressure dependence of self diffusion in supercooled light and heavy water. Ber. Bunsenges. Phys. Chem. 1988, 92, 1111–1117. [Google Scholar] [CrossRef]
- Bachl, F.; Lüdemann, H.-D. Pressure and temperature dependence of self-diffusion in liquid linear hydrocarbons. Ztschrift Nat. A 1986, 41, 963–970. [Google Scholar] [CrossRef]
- Mohammed, S.; Mansoori, G.A. Molecular insights on the interfacial and transport properties of supercritical CO2/brine/crude oil ternary system. J. Mol. Liq. 2018, 263, 268–273. [Google Scholar] [CrossRef]
- Wiegand, G.; Franck, E.U. Interfacial tension between water and non-polar fluids up to 473 K and 2800 bar. Ber. Bunsenges. Phys. Chem. 1994, 86, 809–817. [Google Scholar] [CrossRef]
- Georgiadis, A.; Maitland, G.; Trusler, J.P.M.; Bismarck, A. Interfacial tension measurements of the (H2O + n-Decane + CO2) ternary system at elevated pressures and temperatures. J. Chem. Eng. Data 2011, 56, 4900–4908. [Google Scholar] [CrossRef]
- Honarvar, B.; Azdarpour, A.; Karimi, M.; Rahimi, A.; Karaei, M.A.; Hamidi, H.; Ing, J.; Mohammadian, E. Experimental investigation of interfacial tension measurement and oil recovery by Carbonated Water Injection: A case study using core samples from an Iranian carbonate oil reservoir. Energy Fuels 2017, 31, 2740–2748. [Google Scholar] [CrossRef]
- Kunieda, M.; Nakaoka, K.; Liang, Y.F.; Miranda, C.R.; Ueda, A.; Takahashi, S.; Okabe, H.; Matsuoka, T. Self-accumulation of aromatics at the oil-water interface through weak hydrogen bonding. J. Am. Chem. Soc. 2010, 132, 18281–18286. [Google Scholar] [CrossRef] [PubMed]


Publisher’s Note: MDPI stays neutral with regard to jurisdictional claims in published maps and institutional affiliations. |
© 2020 by the authors. Licensee MDPI, Basel, Switzerland. This article is an open access article distributed under the terms and conditions of the Creative Commons Attribution (CC BY) license (http://creativecommons.org/licenses/by/4.0/).