Article

Camera-Driven Probabilistic Algorithm for Multi-Elevator Systems

1
School of Engineering and Digital Sciences, Nazarbayev University, Nur-Sultan 010000, Kazakhstan
2
General Department, University of Thessaly, 38221 Volos, Greece
*
Author to whom correspondence should be addressed.
Energies 2020, 13(23), 6161; https://doi.org/10.3390/en13236161
Submission received: 31 August 2020 / Revised: 9 October 2020 / Accepted: 10 October 2020 / Published: 24 November 2020

Abstract

:
A fast and reliable vertical transportation system is an important component of modern office buildings. Optimization of elevator control strategies can be easily done using the state-of-the-art artificial intelligence (AI) algorithms. This study presents a novel method for optimal dispatching of conventional passenger elevators using the information obtained by surveillance cameras. It is assumed that a real-time video is processed by an image processing system that determines the number of passengers and items waiting for an elevator car in hallways and riding the lifts. It is supposed that these numbers are also associated with a given uncertainly probability. The efficiency of our novel elevator control algorithm is achieved not only by the probabilistic utilization of the number of people and/or items waiting but also from the demand to exhaustively serve a crowded floor, directing to it as many elevators as there are available and filling them up to the maximum allowed weight. The proposed algorithm takes into account the uncertainty that can take place due to inaccuracy of the image processing system, introducing the concept of effective number of people and items using Bayesian networks. The aim is to reduce the waiting time. According to the simulation results, the implementation of the proposed algorithm resulted in reduction of the passenger journey time. The proposed approach was tested on a 10-storey office building with five elevator cars and traffic size and intensity varying from 10 to 300 and 0.01 to 3, respectively. The results showed that, for the interfloor traffic conditions, the average travel time for scenarios with varying traffic size and intensity improved by 39.94% and 19.53%, respectively.

1. Introduction

As of 2018, approximately 4.2 billion people, or 55% of the world’s population, live in urban areas [1]. The fact that people tend to move from rural to urban areas, along with the overall increase in global population, will result in approximately 6.7 billion people, or 68% of the global population, residing in cities by 2050 [1]. Taking this into account, we should focus on reshaping conventional approaches towards efficient energy use, reduction of waste, and improving reliability of urban infrastructure. Given this perspective, the utilization of intelligent and eco-friendly technologies is essential for sustainable growth of urban settlements.
Some cities have already taken an attractive yet challenging path to broad adoption of smart technologies. The smart city transformation is a continuous process that requires radical changes in both technology and policy frameworks. Transformation of the transportation system is one of the core components in the context of technological renovation, since timely and efficient movement of people and goods positively affects the growth and development of the cities. Innovative solutions related to public transportation and vehicle traffic management have already been implemented in many cities around the world. For instance, the city of Pittsburgh (USA) implemented the Scalable Urban Traffic Control (SURTRAC) system that analyzes data from each street intersection and adjusts the traffic lights in real time [2]. The implementation of SURTRAC helped to reduce the intersection wait time by 41%, number of stops by 31%, travel time by 26%, and vehicle emissions by 21% [3].
Total smart city transformation will require integration of intelligent systems into both the city infrastructure and the building systems, such as heating, ventilation, air conditioning, vertical transportation, and so on. The means of public transportation in buildings, specifically elevator systems, are of particular interest to the research community since implementation of smart solutions in these systems may have similar impact as in city transportation systems.
Currently, the state-of-the-art elevator control and dispatch methods are driven by two objectives to a large extent. First-the reduction of energy consumption while keeping the same level of comfort and usability. Second-the reduction of passenger wait time by improving the elevator dispatch strategy. The growth of computer power in recent years has enabled the application of sophisticated video-aided elevator control systems based on artificial intelligence (AI).
One of the earliest works describing utilization of video cameras in conventional passenger elevators was presented in a paper by [4]. The study is limited to the people-counting problem and is not intended to address elevator control optimization. Similarly, the studies of [5,6,7,8] present different methods of video camera utilization whose main purpose was not focused on improving elevator dispatch strategies. Other works propose the application of video cameras to partially optimize elevator control and dispatch. For instance, the study by [9] proposes utilization of surveillance cameras to reduce overcrowding during emergency evacuations, whereas the study by [10] proposes utilization of in-car cameras to determine the available capacity of the elevator car and reduce the number of unnecessary stops.
Although the utilization of information obtained by the video or image acquisition systems located inside the elevator cars or in hallways may significantly improve performance of conventional passenger lifts, there is still no clear vision of how we can take maximum advantage of these data in order to improve elevator technology. In the study of [11], the authors propose an elevator control system that utilizes the information from hallway surveillance cameras and adjusts the dispatching function using a generic algorithm. The study uses the information from cameras to predict the number of passengers going in upward and downward directions. However, the passenger direction prediction algorithm is rather simple and is based on an assumption that all passengers are going the same direction as the passenger who last pressed the call button. The reported results show that the information obtained from the surveillance cameras helped to reduce the average waiting time by over 8% when the average crowding was 55%. The study also reports that utilization of cameras in scenarios with very low and very high passenger load (e.g., less than 45% or higher than 75% of total capacity) resulted in insignificant wait time reduction. In a study by [12], the authors propose an elevator group control algorithm that uses information from the passenger detection and tracking system. The algorithm utilizes Haar-like feature-based passenger detection, while the passenger motion tracking is achieved through utilization of the unscented Kalman filter. The primary goal of this algorithm is to minimize consumption of electricity by the elevator system and reduce the passenger wait time. Another elevator control algorithm utilizing the information obtained by the hallway cameras is proposed in [13]. The study focuses on minimization of the passenger wait time by taking into account the number of passengers waiting for an elevator, directions of passenger movement, and availability of the elevator cars. The gathered data are analyzed by the region-based convolutional neural network and transferred to the conventional elevator control system to perform elevator dispatch.
The aforementioned studies utilize video recording systems to determine the number of passengers and predict their movement directions in order to adjust to the present passenger traffic patterns. The main disadvantage of these approaches lies in their inability to account for uncertainties associated with the passenger flow and the video/image processing systems. The states of the passengers, in these studies, are represented as deterministic values, yet it is obvious that the predictions made by the proposed systems cannot be 100% accurate. This problem can be tackled by representation of the passenger traffic using Bayesian networks where the number of passengers waiting for an elevator as well as their movement directions are represented as probabilistic variables.
One of the first studies describing the implementation of Bayesian network (BN) theory in elevator control and dispatch was a paper by Provan [14]. The paper presents a BN framework for stochastic discrete-event control applications. The author claims that the proposed hybrid variable-based BN representation of the stochastic discrete-event system is more compact and efficient compared to traditional probabilistic finite state machine. In a study by Cheng et al. [15], the authors propose a Bayesian reinforced learning algorithm for optimal scheduling of the elevator group control (EGC) systems. The proposed algorithm reduces the state space of the dispatch optimization problem by constructing a low-dimension abstract state space. The authors use a BN to conduct inference and obtain values for each of the abstract states. The final step of the proposed algorithm, involved utilization of a neural network to calculate the optimal state-action value function on the basis of the results obtained by the BN. The study assumes that the elevator loading time follows a 20th order truncated Erlang distribution.
The contribution and novelties of this study are as follows: In the present work we did not make a prediction following one statistical/machine learning method. We used real-time information with uncertainly that it was supposed to be generated by cameras and image recognition software to drive an intelligent decision about the motion of a multi-elevator system with the aim of reducing the waiting time.
Novel combination of conventional algorithm for the “closed car approach” together with probabilistic code was generated by BayesiaLab software integrated in Python.
The rest of this paper is organized as follows: Section 2 describes the proposed methodology and provides some comparison between the existing and proposed EGC methods, Section 3 provides a discussion on the results of the case study, and finally Section 4 presents the conclusion.

2. Model Description

It should be noted that all elevators discussed in this paper are conventional lifts cabins with collective control strategy and one up and down pushbuttons.

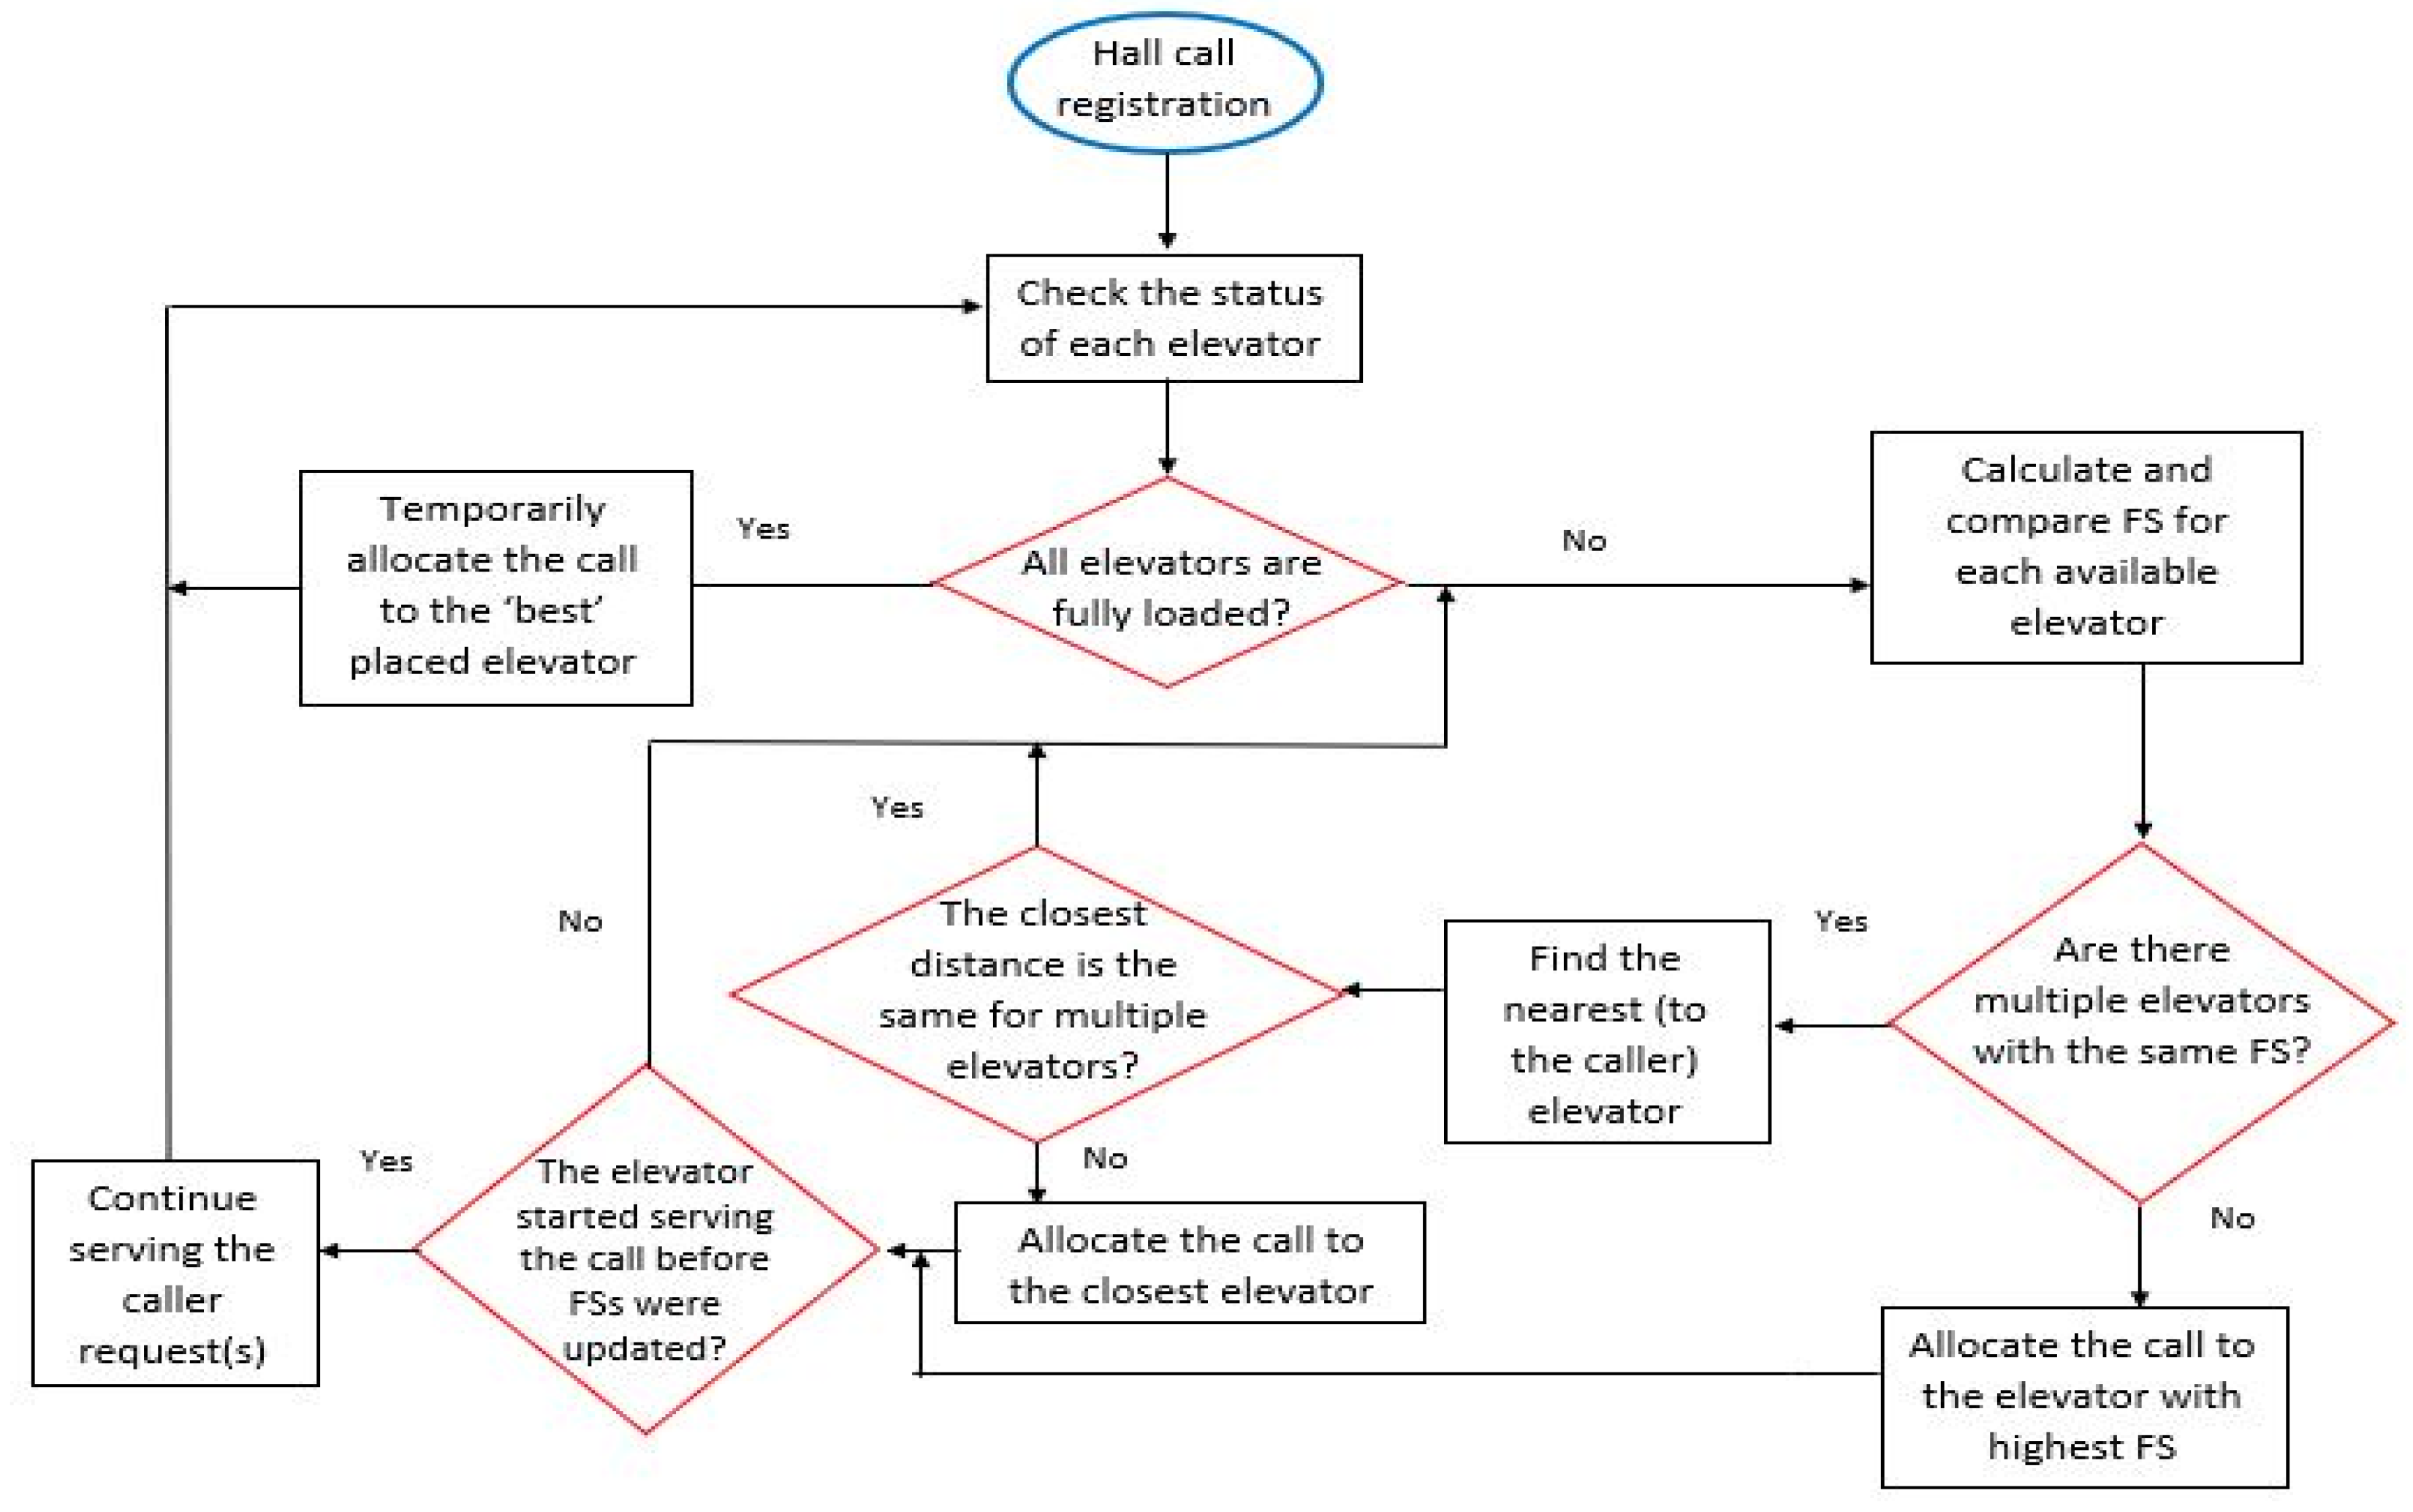
2.1. EGC with Conventional Nearest Car Algorithm

The main disadvantage of existing conventional EGC algorithms lies in their inability to account for uncertainties associated with passenger traffic. For instance, let us take a look at the conventional nearest car (NC) algorithm. The NC control policy is suitable for 2–3 elevator cars working in a building that is around 7 floors [16]. After call registration, the NC algorithm constantly searches for the best elevator car until the call is served. The search for the best option to serve the call is performed by calculating the figure of suitability (FS) according to the following rules:
(1)
When the elevator is moving towards the passenger and its’ direction as well as the passenger’s desired direction are the same, the algorithm gives a position bias to this elevator, as if the elevator was one floor nearer to the passenger. In this case, the FS is calculated as follows:
FS = (N + 1) − (d − 1) = (N + 2) − d
where (N + 1) is the number of floors in a building, and d is the number of floors between the passenger and the elevator car.
(2)
If the elevator is committed to moving towards the passenger whose desired direction is opposite to that of the elevator, then
FS = (N + 1) − d
Similarly, Equation (2) can be applied to calculate FS for an idle elevator car.
(3)
If the elevator is committed to moving away from the passenger, the algorithm sets FS to a value that does not depend on the distance.
The algorithm allocates the call to the elevator with highest FS value; if there are several elevators with the same FS, the algorithm allocates the call to the closest car. The flowchart of conventional NC algorithm is presented in Figure 1.
As reported by reference [16], the main disadvantage of the conventional NC algorithm is its inability to adequately handle downpeak and uppeak traffic conditions. Thus, this algorithm can only be applied to the low-rise buildings where distribution of elevator cars is not very important.

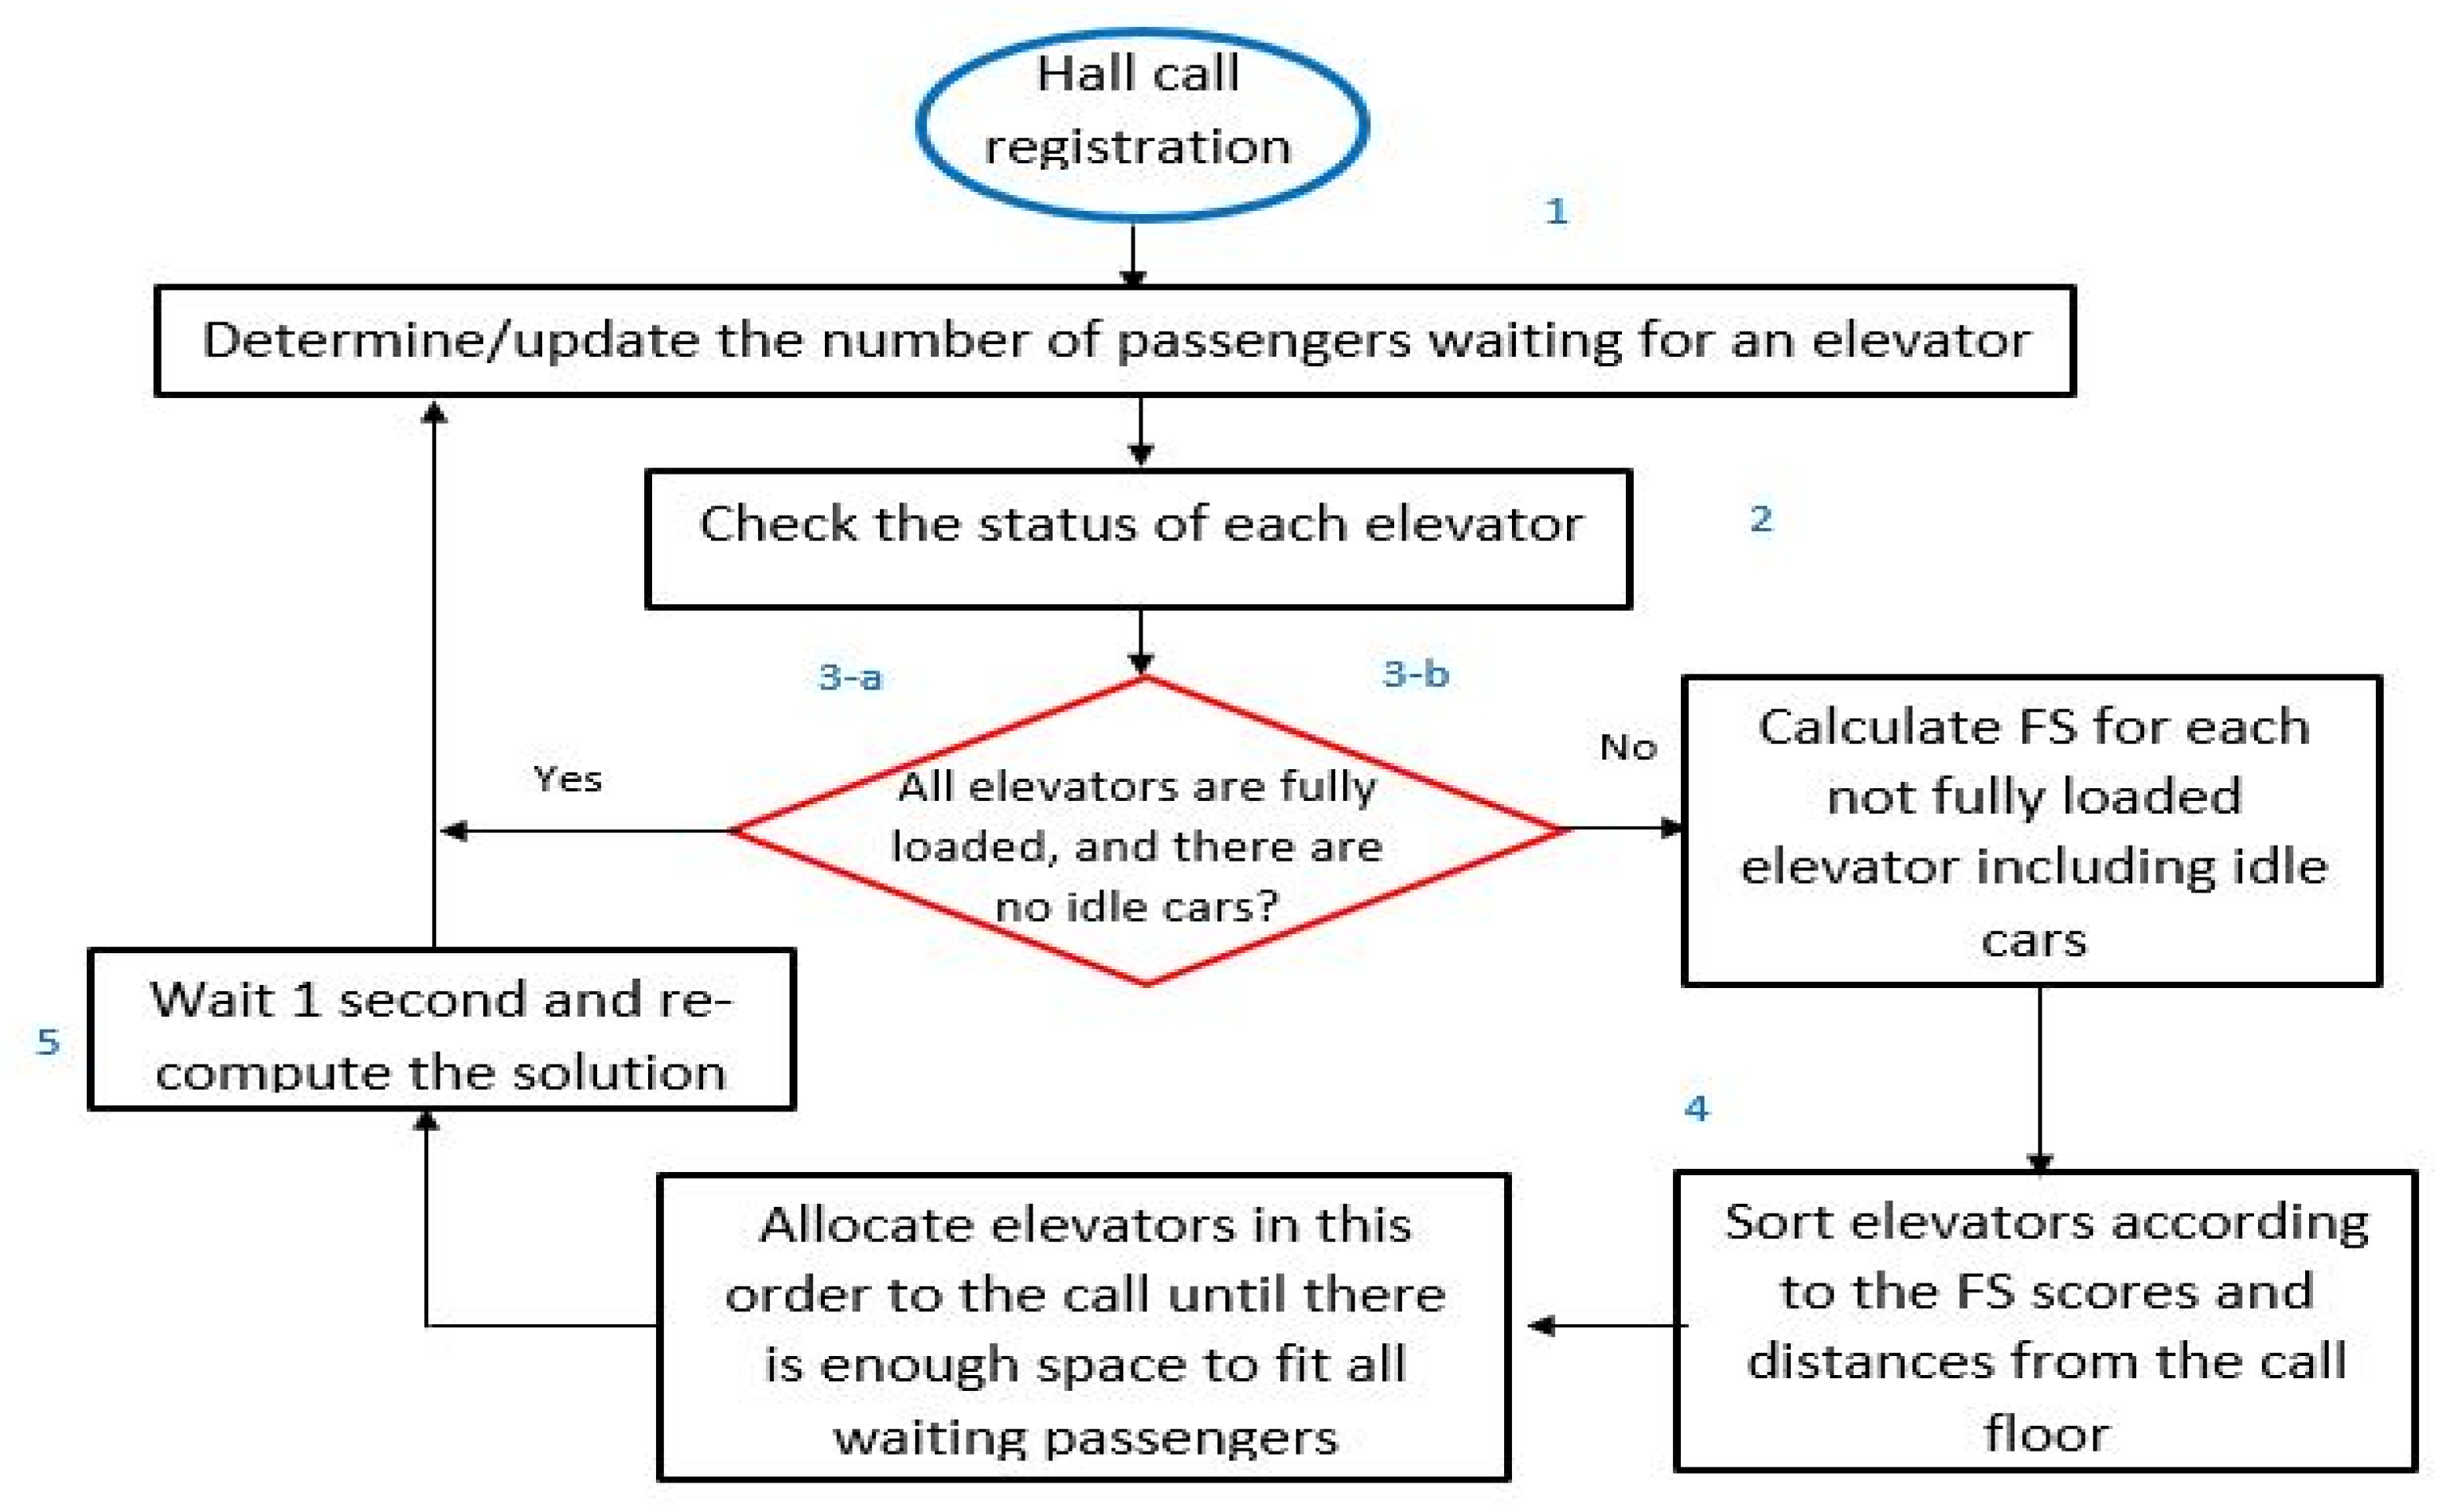
2.2. Proposed EGC with Modified NC Algorithm

As opposed to conventional EGC with traditional NC algorithm, the proposed EGC uses surveillance cameras for the purpose of determining the number of passengers waiting in the hallways and riding the elevator cars.
The algorithm allocates the call to a single car or multiple elevator cars depending on the number of passengers waiting for an elevator and the number of available spaces inside the elevator cars. The system updates the statuses of each elevator car and every floor every 1 second. In other words, the elevator control system determines the locations and available capacity of each elevator car, as well as the number of passengers on every floor every 1 second (we need to figure out how to deal with movement direction of every passenger).
  • Once the call is registered, the system determines how many passengers are waiting on the floor where the call was made.
  • Next, the system checks the status of each elevator car (location, available capacity, movement direction).
  • (a) When all elevator cars are fully loaded, the system checks the status of each elevator car again after 1 second.
    (b) When there is at least one elevator car available, the system orders elevators from highest FS to lowest; elevators with equal FS are ordered by distance to the landing floor, with the closest first.
  • The system allocates the call to the elevators according to the order in 3B (Figure 2) until all passengers of the registered floor fit into the elevator cars.
  • The system will loop through the whole elevator allocation procedure every second looking for a better solution until all passengers get inside the elevator cars.

2.3. Proposed EGC with BN Subroutine

The algorithm presented in the previous section utilizes the information from surveillance cameras, yet this information is considered to be deterministic. In other words, the previous algorithm assumes that the number of people provided by the image recognition system is 100% certain. However, in reality, an image recognition system would not always provide the actual number of passengers waiting in a hallway or standing inside the elevator car. There is always a possibility for an error caused by people movements or objects that the system recognizes as humans (balloons, luggage, dogs, etc.). Thus, we have worked under the assumption that the image recognition software can provide us the number of adults, children, and small and big items with one associated probability that expresses certainty.
Therefore, in this subsection we present an algorithm that can utilize such uncertain information. The only appropriate way (that is mathematically consistent) to deal with this uncertainty is to utilize BNs. It follows is the general description of the pseudocode of the non-probabilistic part of the BN subroutine.
First of all, we define N as the effective number of “people” waiting for an elevator in one floor. If N is lower or equal than 3, we run the previous algorithm. If N is greater than 3, then N1 idle cars go to these floors (choosing first the floor with larger N), where
N 1 = N E C
with Ec being the capacity of an elevator car.
If there are no idle cars, then N2 cars are sent to this floor. These cars are selected from the elevators that move towards the landing floor.
The following pseudocode represents the remaining part of the non-probabilistic BN subroutine, where N2 is the number of loops of the code.
If (capacity of one car—effective number of people inside the closest approaching car i) > N then send this car and go to the end line of this code
If (capacity of one car—effective number of people inside the closest approaching car j) < N then send this car and go to the next line
If (capacity of one car—effective number of people inside the second closest approaching car j+1) < N—(capacity of one car—effective number of people inside the previous closest approaching car j) then go to the next line.
Count loops = N2
End.
The probabilistic part of the BN subroutine generates the effective number of “people” waiting for an elevator on the Nth floor. It is evaluated by the BN presented in Figure 3. The effective number (EN) of people inside an elevator car is also evaluated by a same BN but with a different number of states and with a different maximum number of people.
The BNs consist of the following nodes where the elevator car maximum capacity is assumed to be equal to 10 people, and the maximum capacity of the hall where people are waiting for an elevator is equal to 20. Here, with the word “people” we mean adults, children, and small or big items (passenger belongings).
  • Number of Adults (A)
    -
    for the cameras on each floor—21 states from 0 to 20;
    -
    for the cameras inside an elevator car—11 states from 0 to 10.
  • Number of Children (C)
    -
    for the cameras on each floor—21 states from 0 to 20;
    -
    for the cameras inside an elevator car—11 states from 0 to 10.
  • Number of Small Items (SI)
    -
    for the cameras on each floor—21 states from 0 to 20;
    -
    for the cameras inside an elevator car—11 states from 0 to 10.
  • Number of Big Items (BI)
    -
    for the cameras on each floor—21 states from 0 to 20;
    -
    for the cameras inside an elevator car—11 states from 0 to 10.
Children and small items are supposed to weigh 0.5 units, while adults and big items are supposed to count as a weight of 1 unit.
The hypothetical camera image recognition software provides a probability for all the states for one node. For example, the image recognition will generate the following output for one specific floor: 9 adults with a certainty of 70%, 8 adults with a certainty of 20%, and 10 adults with a certainty of 10%, with 0% for all other possible states/numbers of adults. In addition, the probability it is provided for one big item with a certainty of 65% and no big items with a 35% certainty, no children with a certainty of 100%, 2 small items with a certainty of 80%, and one small item with a certainty of 20%, etc.
The decision node suggests a decision for the effective number of people. This number is a real variable from 0 to the sum of the maximum values of the weights of each of the four categories. Thus, in our implementation, a maximum of 20 adults is allowed, or a maximum of 20 kids who carry a maximum of 20 big or small items (children and small items have a weight of 0.5 units and adults and big items have a weight of 1 unit).
Thus, it is an integer but with steps 0.5. A decision that gives 13.5 means that the largest expected utility “observes” 13 adults and 1 child waiting, or 10 adults and 6 children and 1 small item, or any other combination. Note that the effective number of people means people together with items.
The prior probabilities of the nodes are completed automatically and with equal values for all states. The utility values are estimated by the following formulae:
U = anX1 + knX0.5 + bnX1 + snX0.5.
where an is the adult state number, kn is the child state number, bn is the big item number, and sn is the small item number.
The expected utility EU(Ai, Hj) for the decision node is given by the formula:
E U ( A i )   =   a = 1 4 j = 1 N U ( A i ,   H j a )   p ( H j a )
where Ai is the mutually exclusive variable and i = 1,…, n, represents action commands along with four variables Ha with possible states Hj, where j = 2,…, m represents the hypothesis influencing the decision. Another important feature of the proposed algorithm is that the action commands do not have any correlation with the determining variables H. Here, we have four determining variables: C, A, SI, and BI.
The BN is updated with new evidence from cameras every second. An example of evidence is that there are 10 adults with a probability of 69%, 3 children with a probability of 45%, and 1 item with a probability of 95%, etc.
The flowchart of the modified NC algorithm with BN is illustrated in Figure 4.
If information coming from experts or from historic data suggest that children have a priority compared to items (this can be due to the fact that adults with children enter the elevator with priority compared with adults with items due to a fair/polite attitude) then the designer of the BN can enlarge the utility of these cases. A combination of 2 children and 1 adult effectively weighs more than 2 small items and 1 adult or 1 big item and one adult. Thus, for the case with 1 adult and 1 child, the resulting number of effective passengers will be bigger compared to 1 adult and 1 small item. This strategy was not implemented in this study, rather, it is mentioned at this point in order to exhibit the role of utility.
In this section, first, the conventional NC algorithm; second, the modified NC algorithm assuming an image recognition software that provides a deterministic number of people (does not distinguish among kids and adults and if they carry any items); and, finally, a third probabilistic NC algorithm with BNs generating an effective number of waiting “passengers/units” are compared.
First, the camera associates probabilities to 4 different categories of passengers (adults, children, or small big items). Second, the effective number (a chosen decision state) is the one that has the maximum expected utility that counts the probability value of each state and in addition the utility priority weight that is set by the designer of the BN.
A general comparison of EGC algorithms based on NC, modified NC, and probabilistic NC with BNs shows that the later EGC algorithm has higher performance compared to the other two. The comparison would require conducting the quantitative evaluation of each EGC algorithm and comparing their performance regarding waiting time on similar set of scenarios.

3. Results

3.1. Elevator Performance Metrics and Traffic Patterns

This section presents a case study performed on a 10-storey office building with five elevators. The main goal of this case study was to quantify and compare the following elevator performance metrics for the EGC algorithms presented in Section 2:
Passenger average travel time (ATT) is the time, measured in seconds, spent by a passenger travelling in an elevator car, starting from the moment of boarding the lift until the moment of stepping on the destination floor.
Passenger average journey time (AJT) is the time, measured in seconds, spent by a passenger starting from the moment of pressing the call button, or joining other people who already pressed the call button, until the time when an elevator opens the doors at the destination floor.
Passenger average waiting time (AWT) is the time, measured in seconds, spent by a passenger starting from the moment of pressing the call button, or joining other people who already pressed the call button, until the time when an elevator opens the doors at the boarding floor.
The calculation of the elevator performance metrics was conducted for three sets of scenarios, each representing the following passenger traffic patterns:
Uppeak traffic is the traffic pattern that occurs when people mostly move in an upward direction. In office buildings, this pattern occurs in the morning when people come to work and, to a lesser extent, when people return at the end of their lunch break.
Downpeak traffic is the traffic pattern that occurs when people mostly move in a downward direction. As opposed to the uppeak pattern, the downpeak occurs at the end of the business day, when people leave the office and, to a lesser extent, at the beginning of the lunch break.
Random interfloor traffic is the traffic pattern that exists when there is no distinctive pattern of passenger movement. A random interfloor traffic pattern usually occurs due to normal circulation of people in the building during a business day.
It was also assumed that 30% of the people are children and 50% of adults carry baggage, half of which are small bags, with the other half being large items.
The conventional EGC algorithms (NC and modified NC) were simulated in Python (Version 3.7, manufacturer: Python Software Foundation, Wilmington, Delaware, United States) [17], whereas the proposed EGC algorithm was implemented in Python and Bayesialab (Version: 9.1 PE-L 00000, manufacturer: Bayesia S.A.S., Changé, France) [18].
The python simulation was written using a discrete event simulation framework SimPy. A number of scenarios were randomly generated with various passenger spawn rates, total passenger numbers, and traffic patterns. The base system was implemented by adding event triggers to events such as passenger arrivals, button presses, and elevator car arrivals. Individual algorithms were then written and added as callbacks to the event triggers. This allowed for seamless interchangeability between multiple elevator control algorithms.

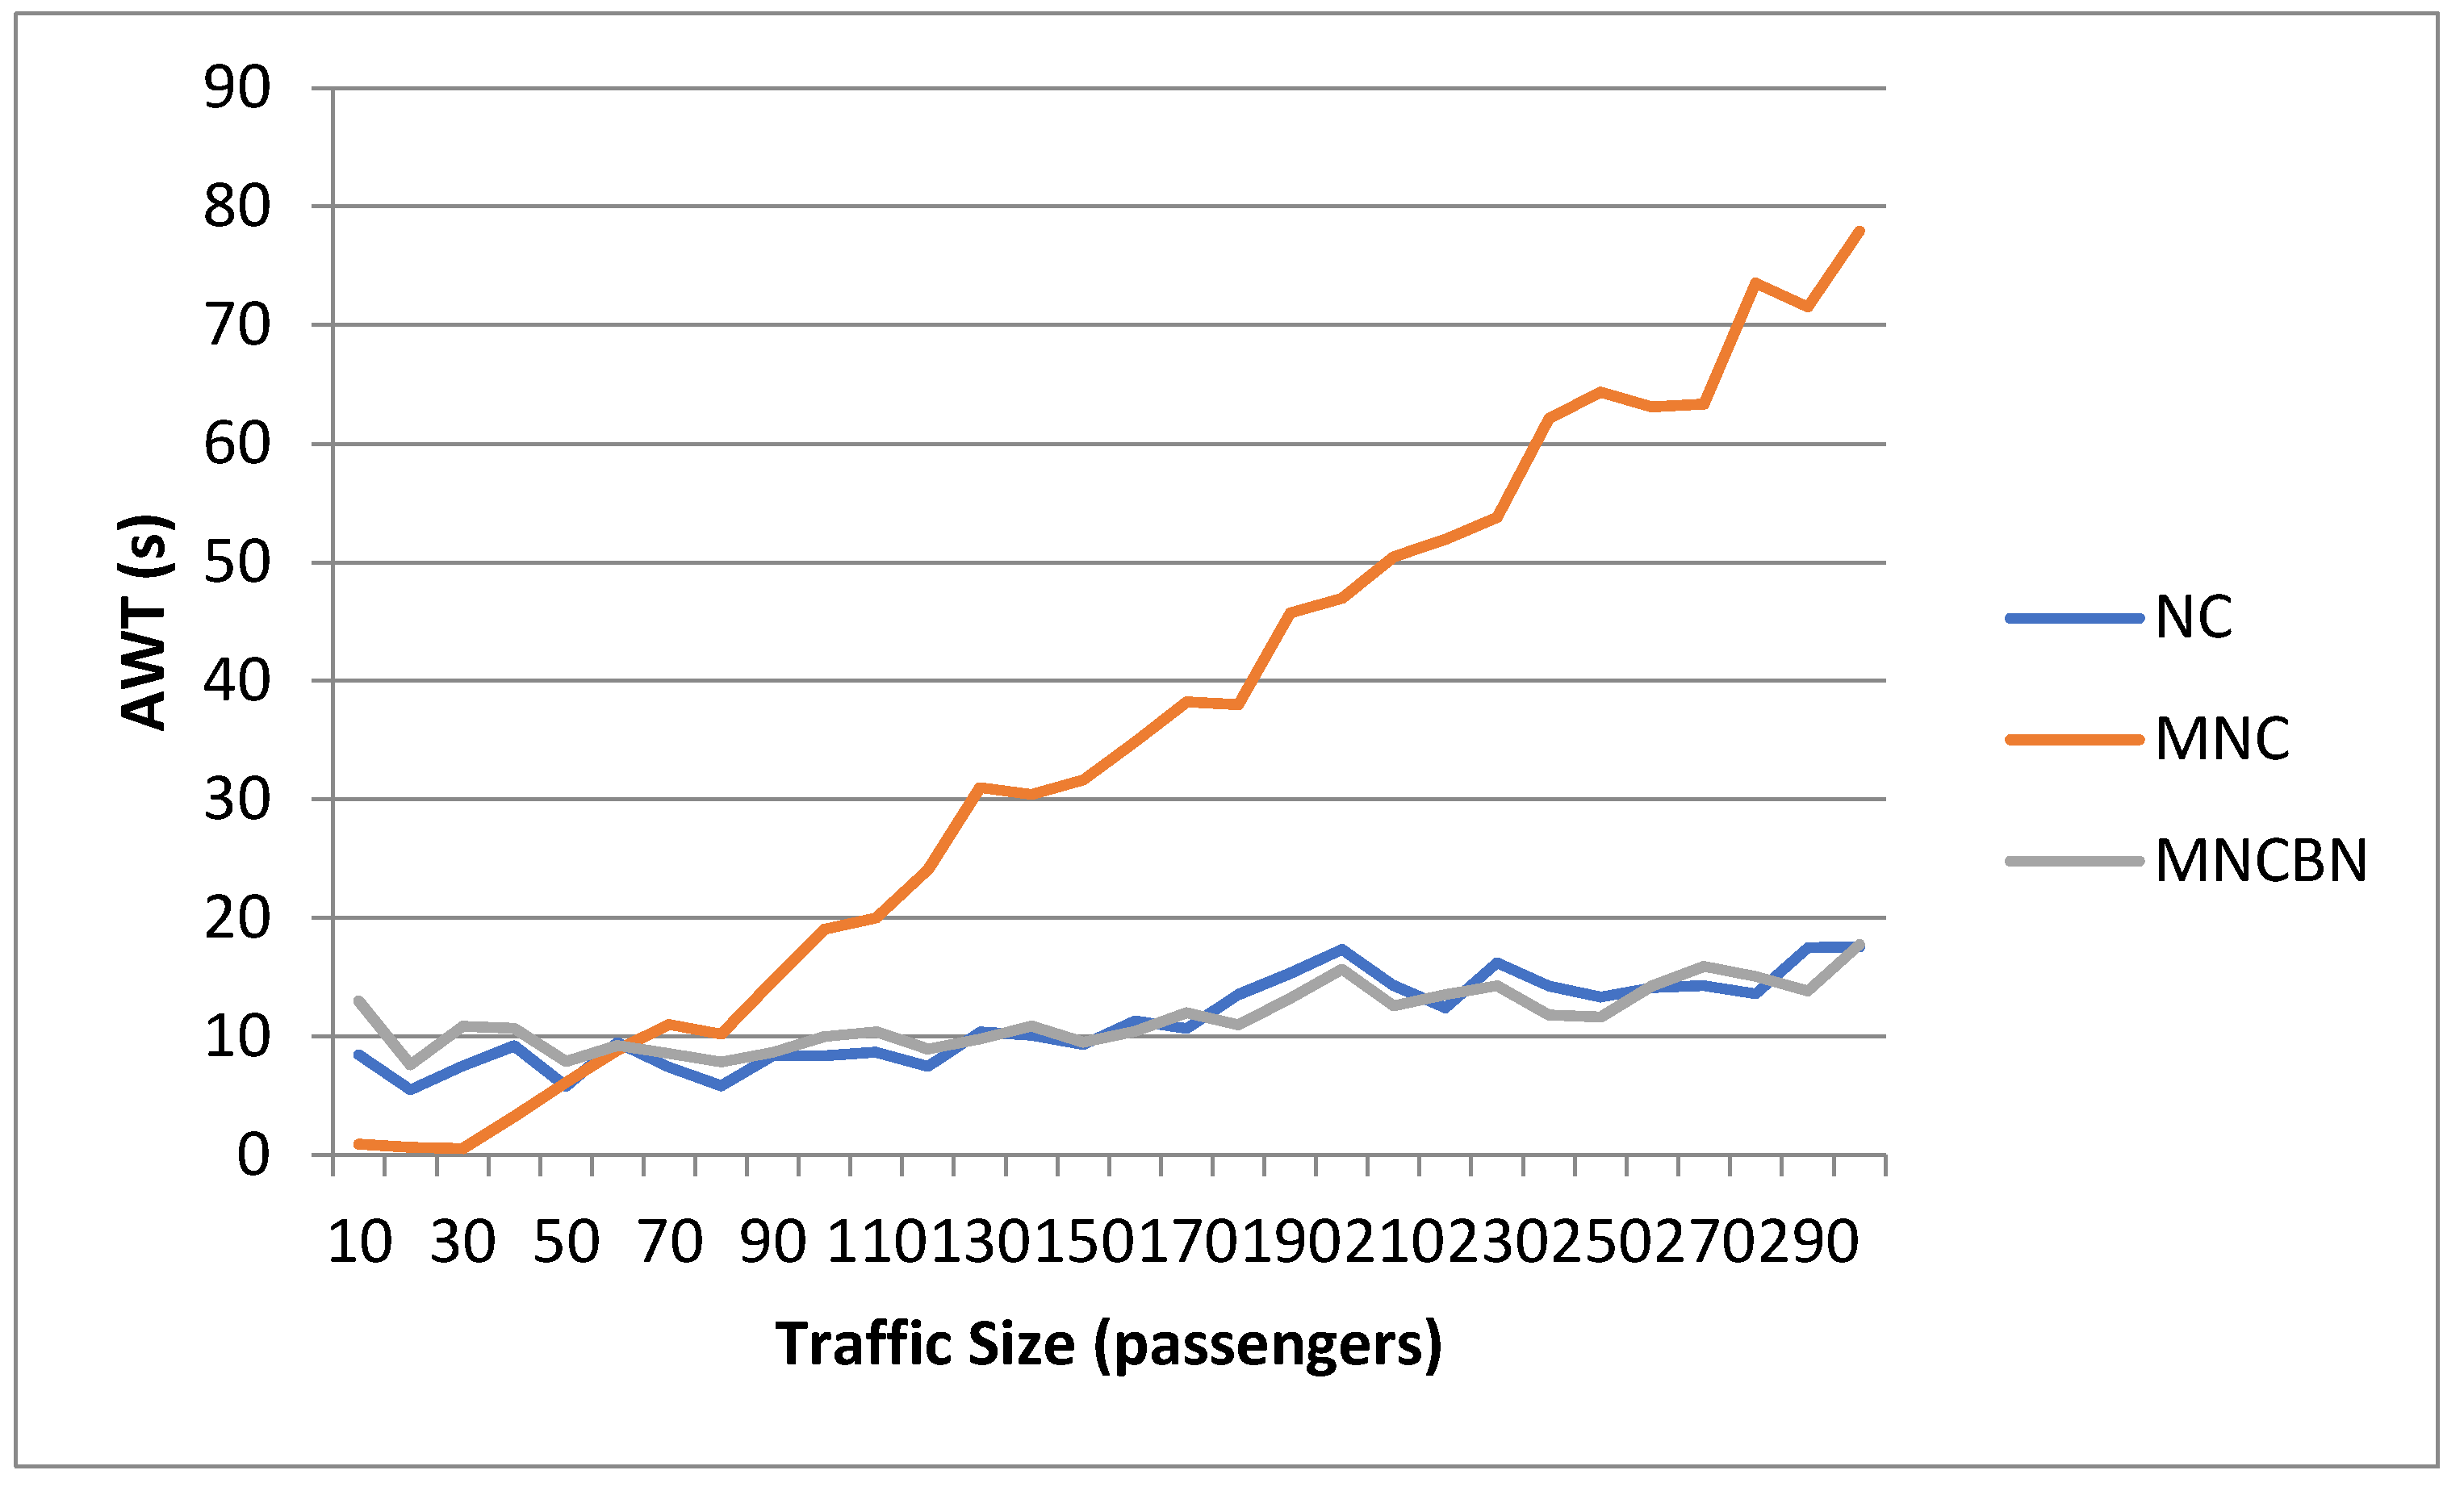
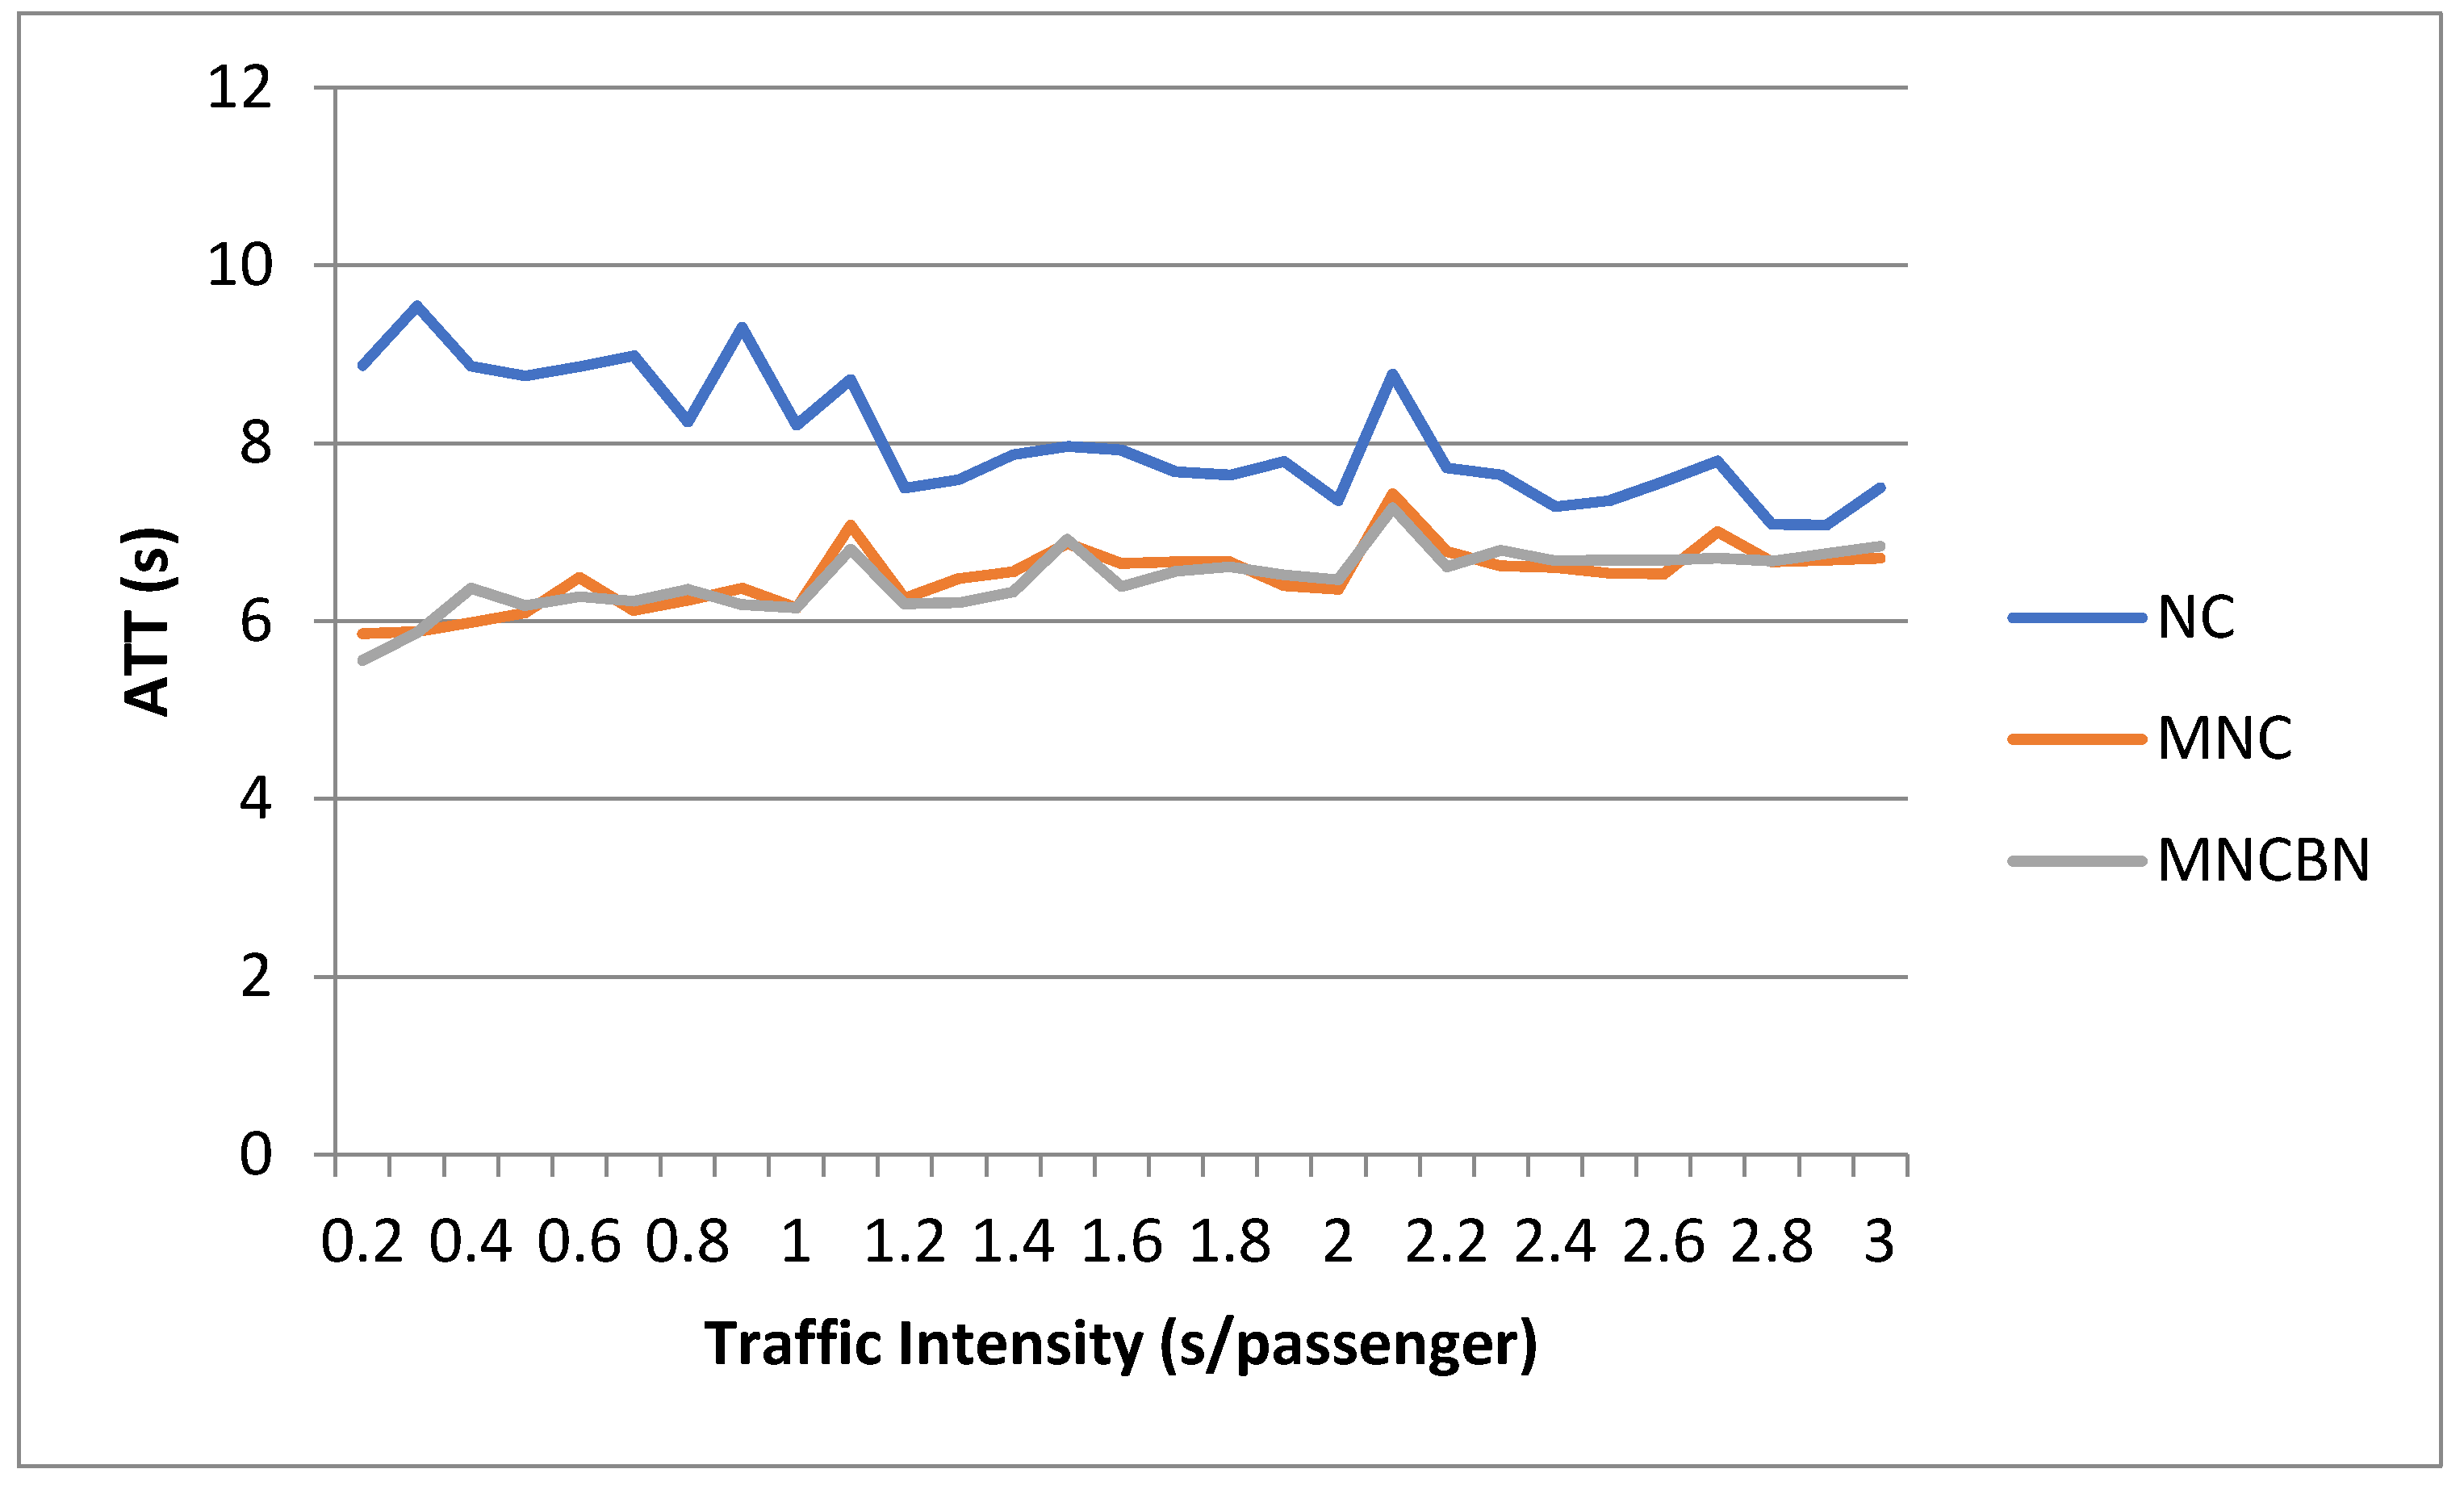
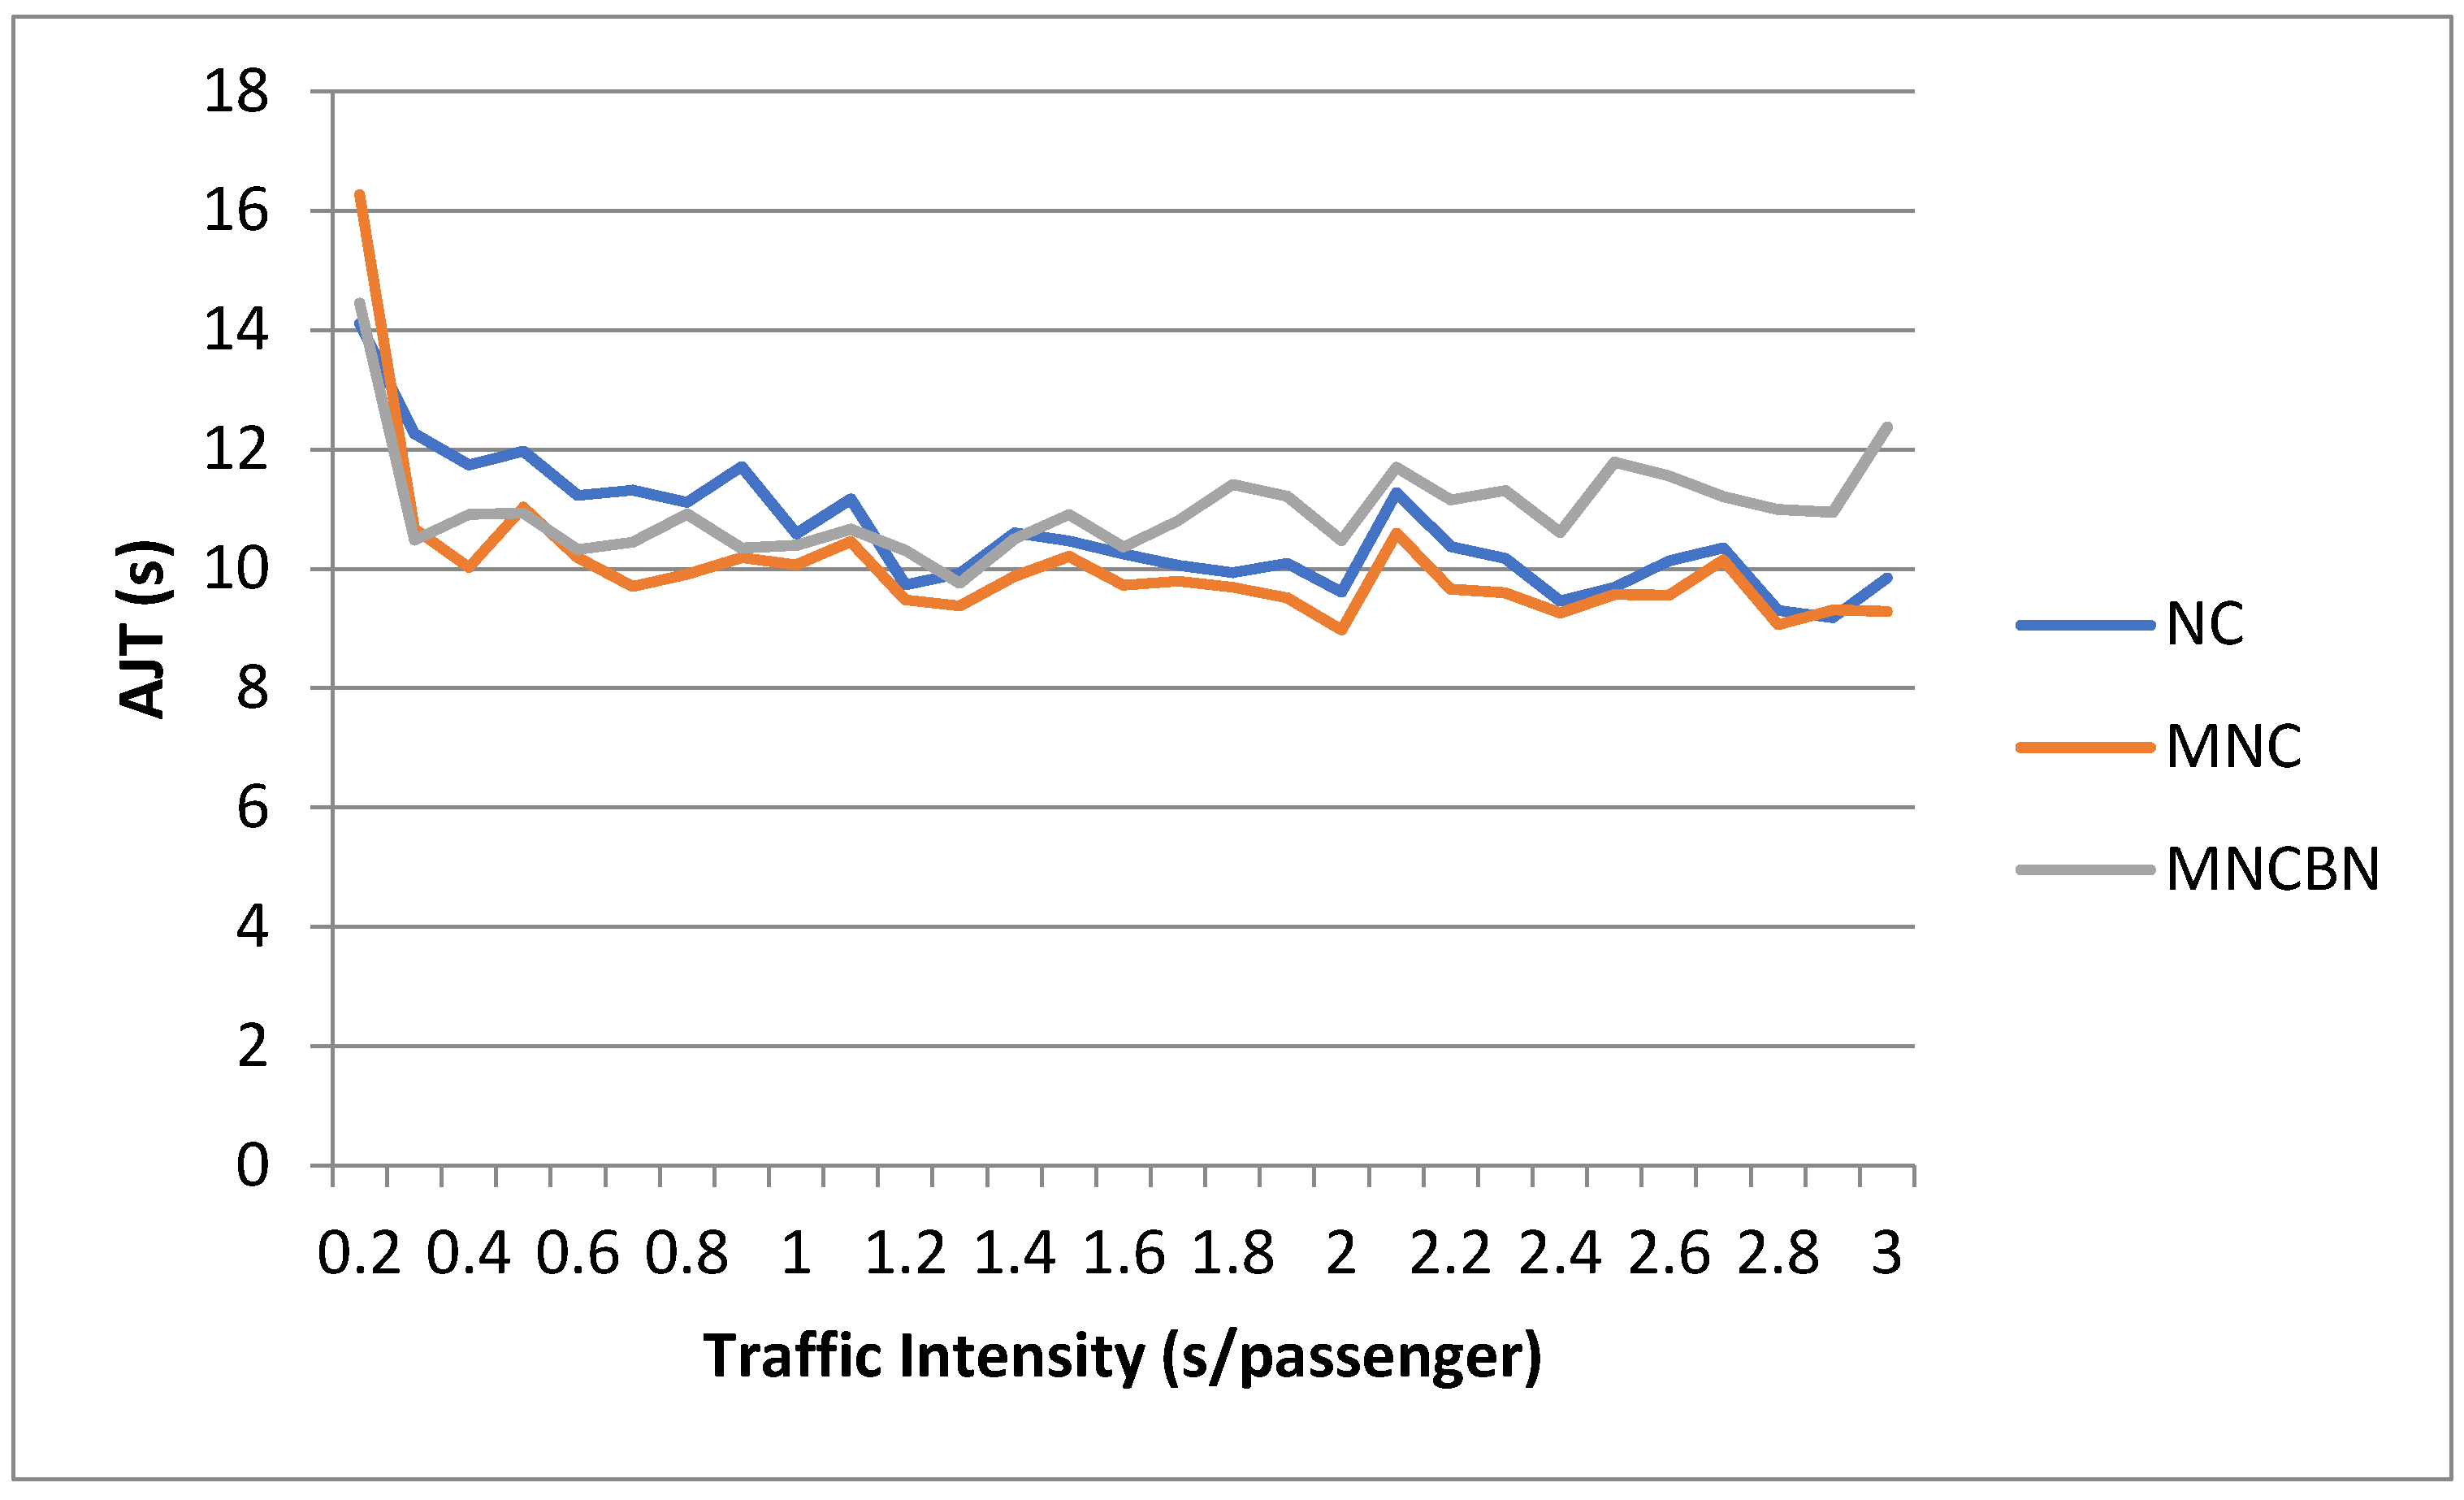
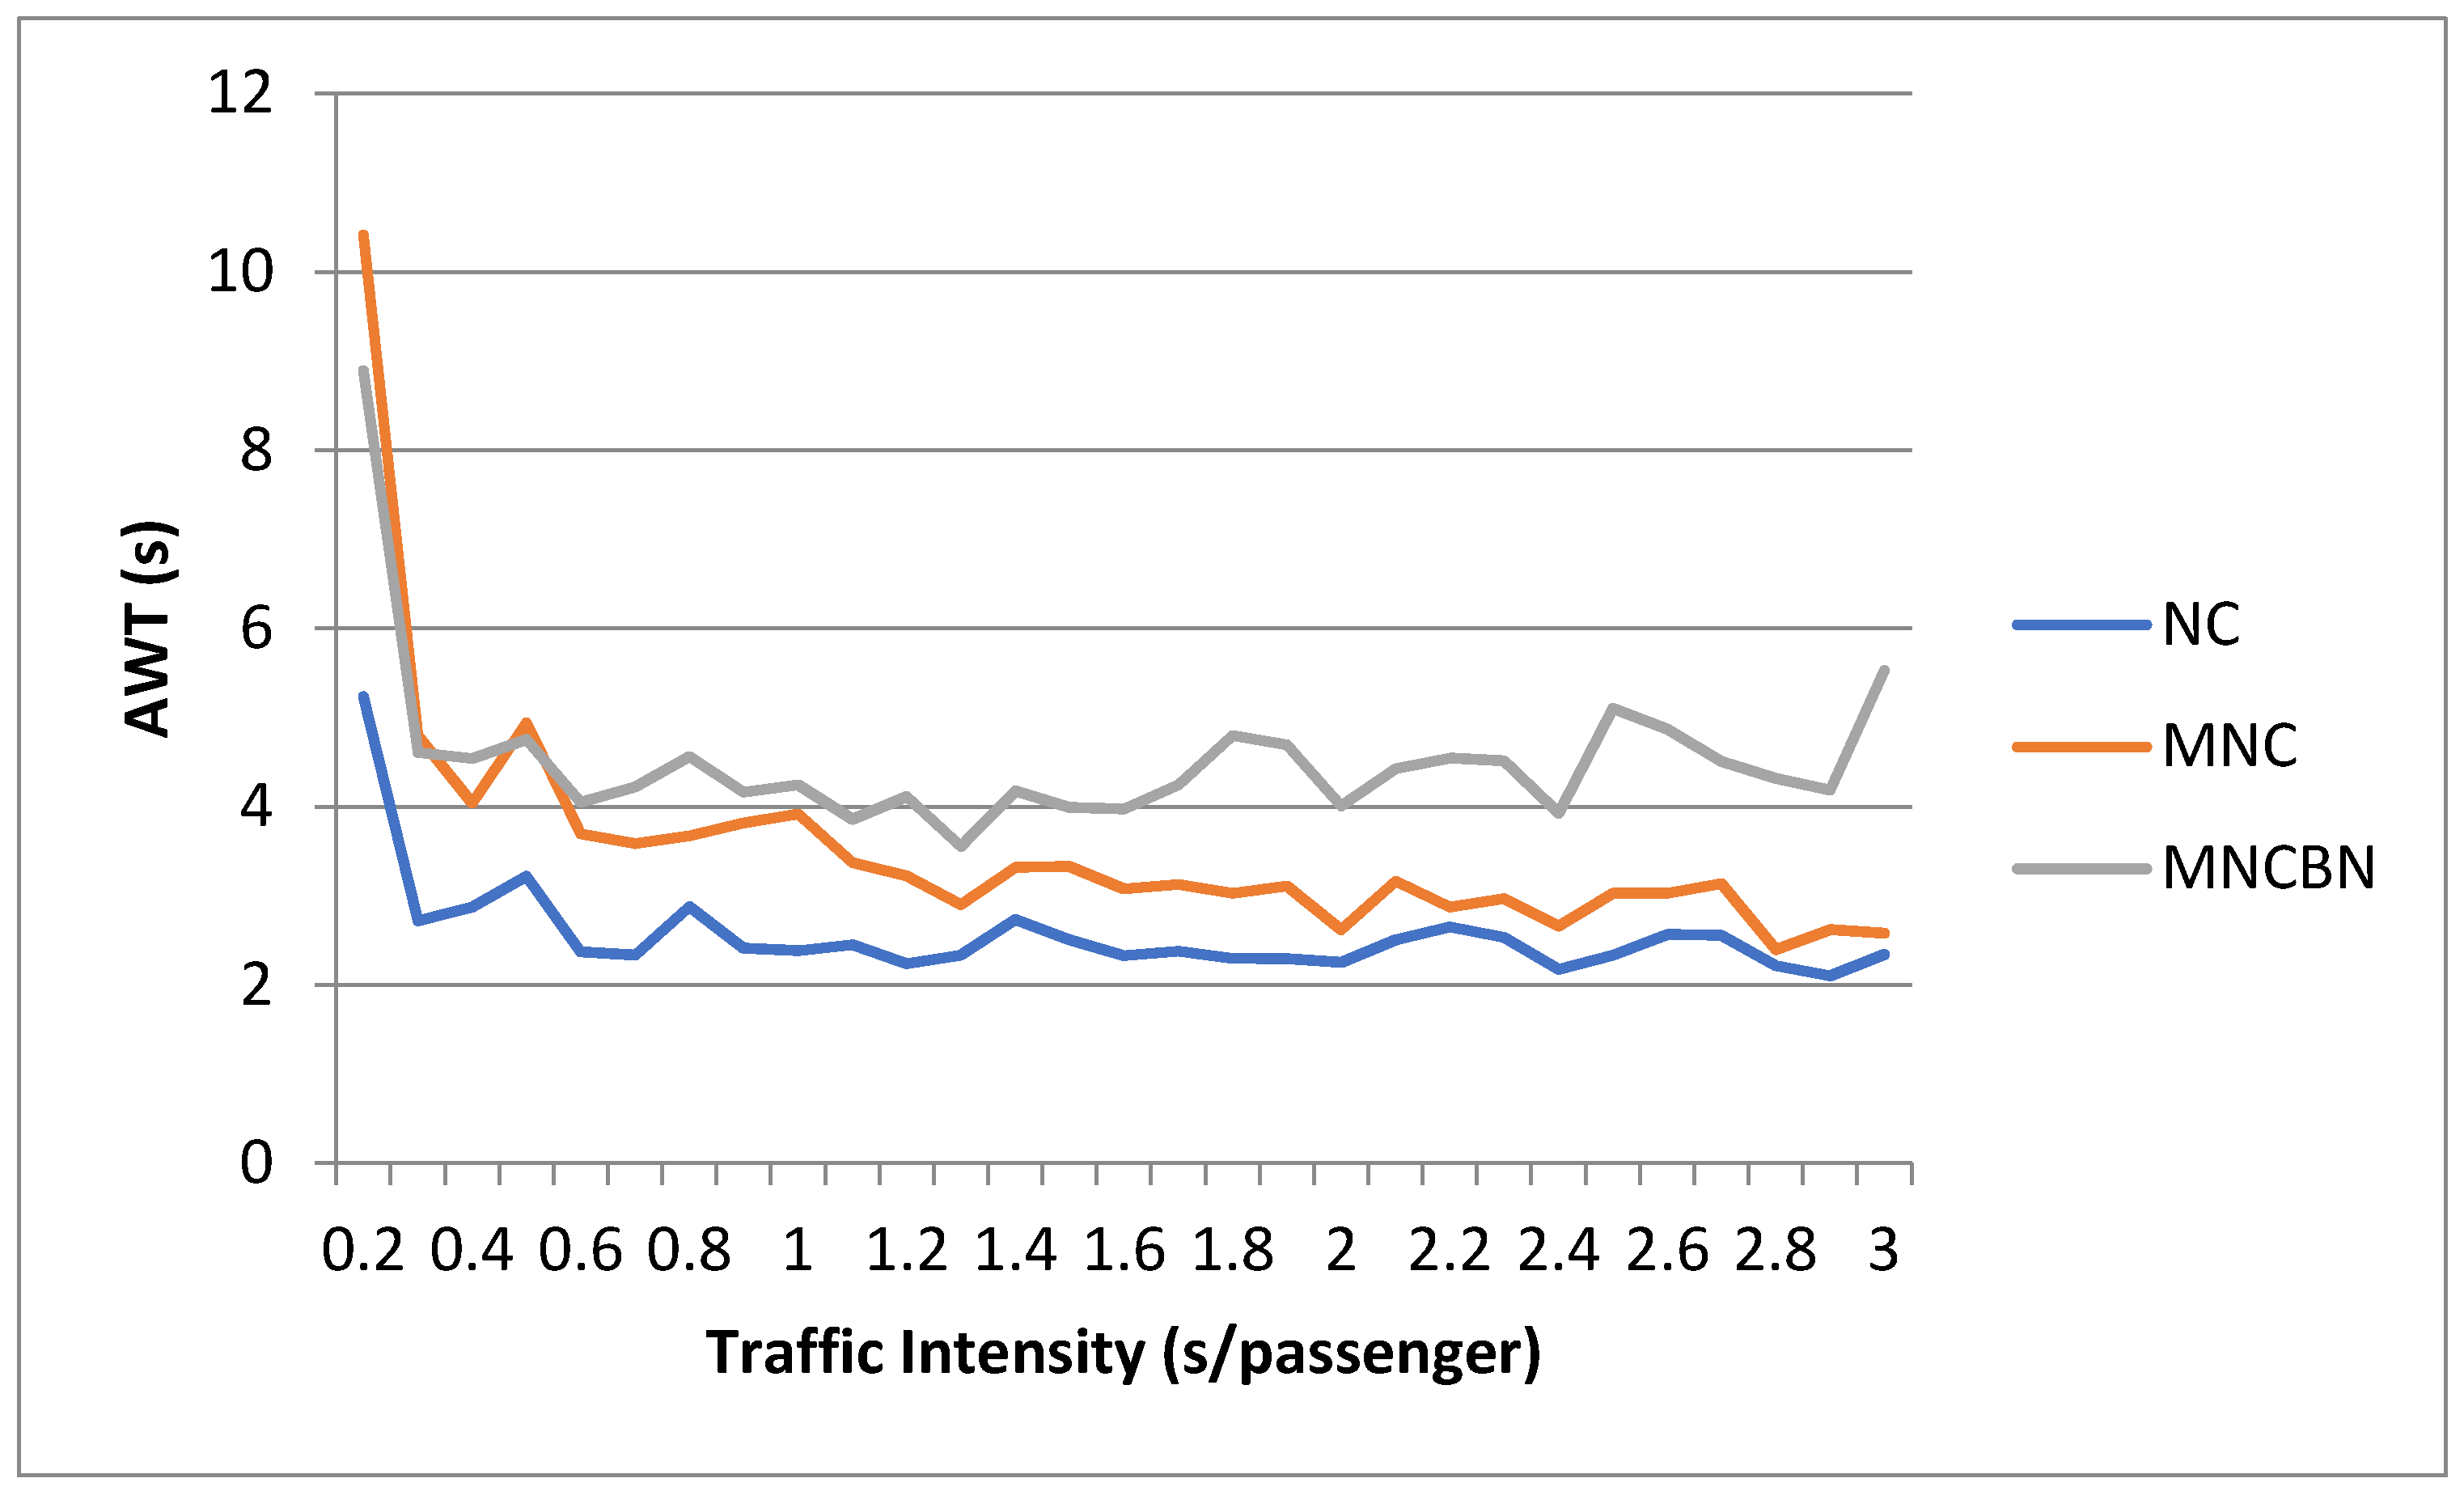
3.2. Dependence on Traffic Size and Intensity

Testing of EGC algorithms was conducted on scenarios with different traffic sizes and intensity. The traffic size or the total number of passengers varied from 100 to 300. The traffic intensity or the average interval of passenger arrival varied from 0.01 to 2 seconds. Table 1 presents the results of the simulations.
Table 1 presents the simulation results obtained for the uppeak traffic pattern. As can be seen from the table, NC showed the best performance in terms of ATT in cases with high traffic intensity. Modified nearest car EGC algorithm (MNC) and modified nearest car EGC algorithm with BN (MNCBN), on the other hand, show better performance in terms of AJT and AWT in scenarios with low passenger arrival interval. All algorithms tended to show somewhat similar performance when the traffic intensity was very low.
Table 2 presents the results obtained for the downpeak traffic pattern. The results of the NC algorithm under downpeak conditions were the worst in terms of every elevator performance index. The MNC and MNCBN showed similar results, especially in terms of AJT and AWT. Similarly, as in the previous case, all algorithms tended to show similar results with increasing passenger arrival interval.
Table 3 presents the simulation results obtained for the random interfloor traffic pattern. Conventional NC showed the worst results, except for the case traffic size equal to 200 people. In most of the scenarios, MNC and MNCBN showed similar scenarios for ATT and AJT. However, MNCBN outperformed NC and MNC in terms of AWT in scenarios with 100 and 300 people.
As it was mentioned before, in office buildings, the uppeak and downpeak traffic patterns usually occur twice a day each, with total duration of 2–3 hours/day. The random interfloor traffic pattern prevails throughout the day, and we thus focused more on analyzing the performance of EGC algorithms in this traffic condition.
As can be seen from Figure 5, MNCBN showed the best results in terms of average travel time for traffic size with total number of people varying from 10 to 300 and average passenger arrival time equal to 0.1. On the other hand, MNC and NC showed somewhat similar results with slight overperformance of MNC.
Dependence of the average journey time and average waiting time on the traffic size are presented in Figure 6 and Figure 7, respectively. Similarly, as in the previous case, both AJT and AWT of the proposed MNCBN were lower than those of the other two algorithms. However, in this case, the curves of the MNC algorithm were much steeper than the curves of NC and MNCBN. Both MNCBN and NC resulted in somewhat similar values with slight overperformance of the MNCBN algorithm.
Figure 8 illustrates the dependence of the average waiting time on the traffic intensity. As can be seen from the figure, both MNC and MNCBN showed somewhat similar performances, whereas the ATT of the conventional NC was higher. However, it is noticeable that the curves tend to approach each other with increasing traffic intensity, which means that both MNC and MNCBN tended to outperform in cases with highly intense interfloor traffic.
Dependence of the average journey time and average waiting time on the traffic intensity is presented in Figure 9 and Figure 10, respectively. Notice that these results were obtained under the same conditions as described previously. Interestingly, the average journey and waiting times of the proposed MNCBN tended to increase with increasing traffic intensity, whereas the AJT and AWT of NC and MNC tended to decrease, meaning that the performance of the proposed MNCBN algorithm worsened with increasing interfloor traffic intensity.
On the basis of the results presented in Figure 10, the performance of NC, in terms of the average waiting time, was better during high interfloor traffic intensity.

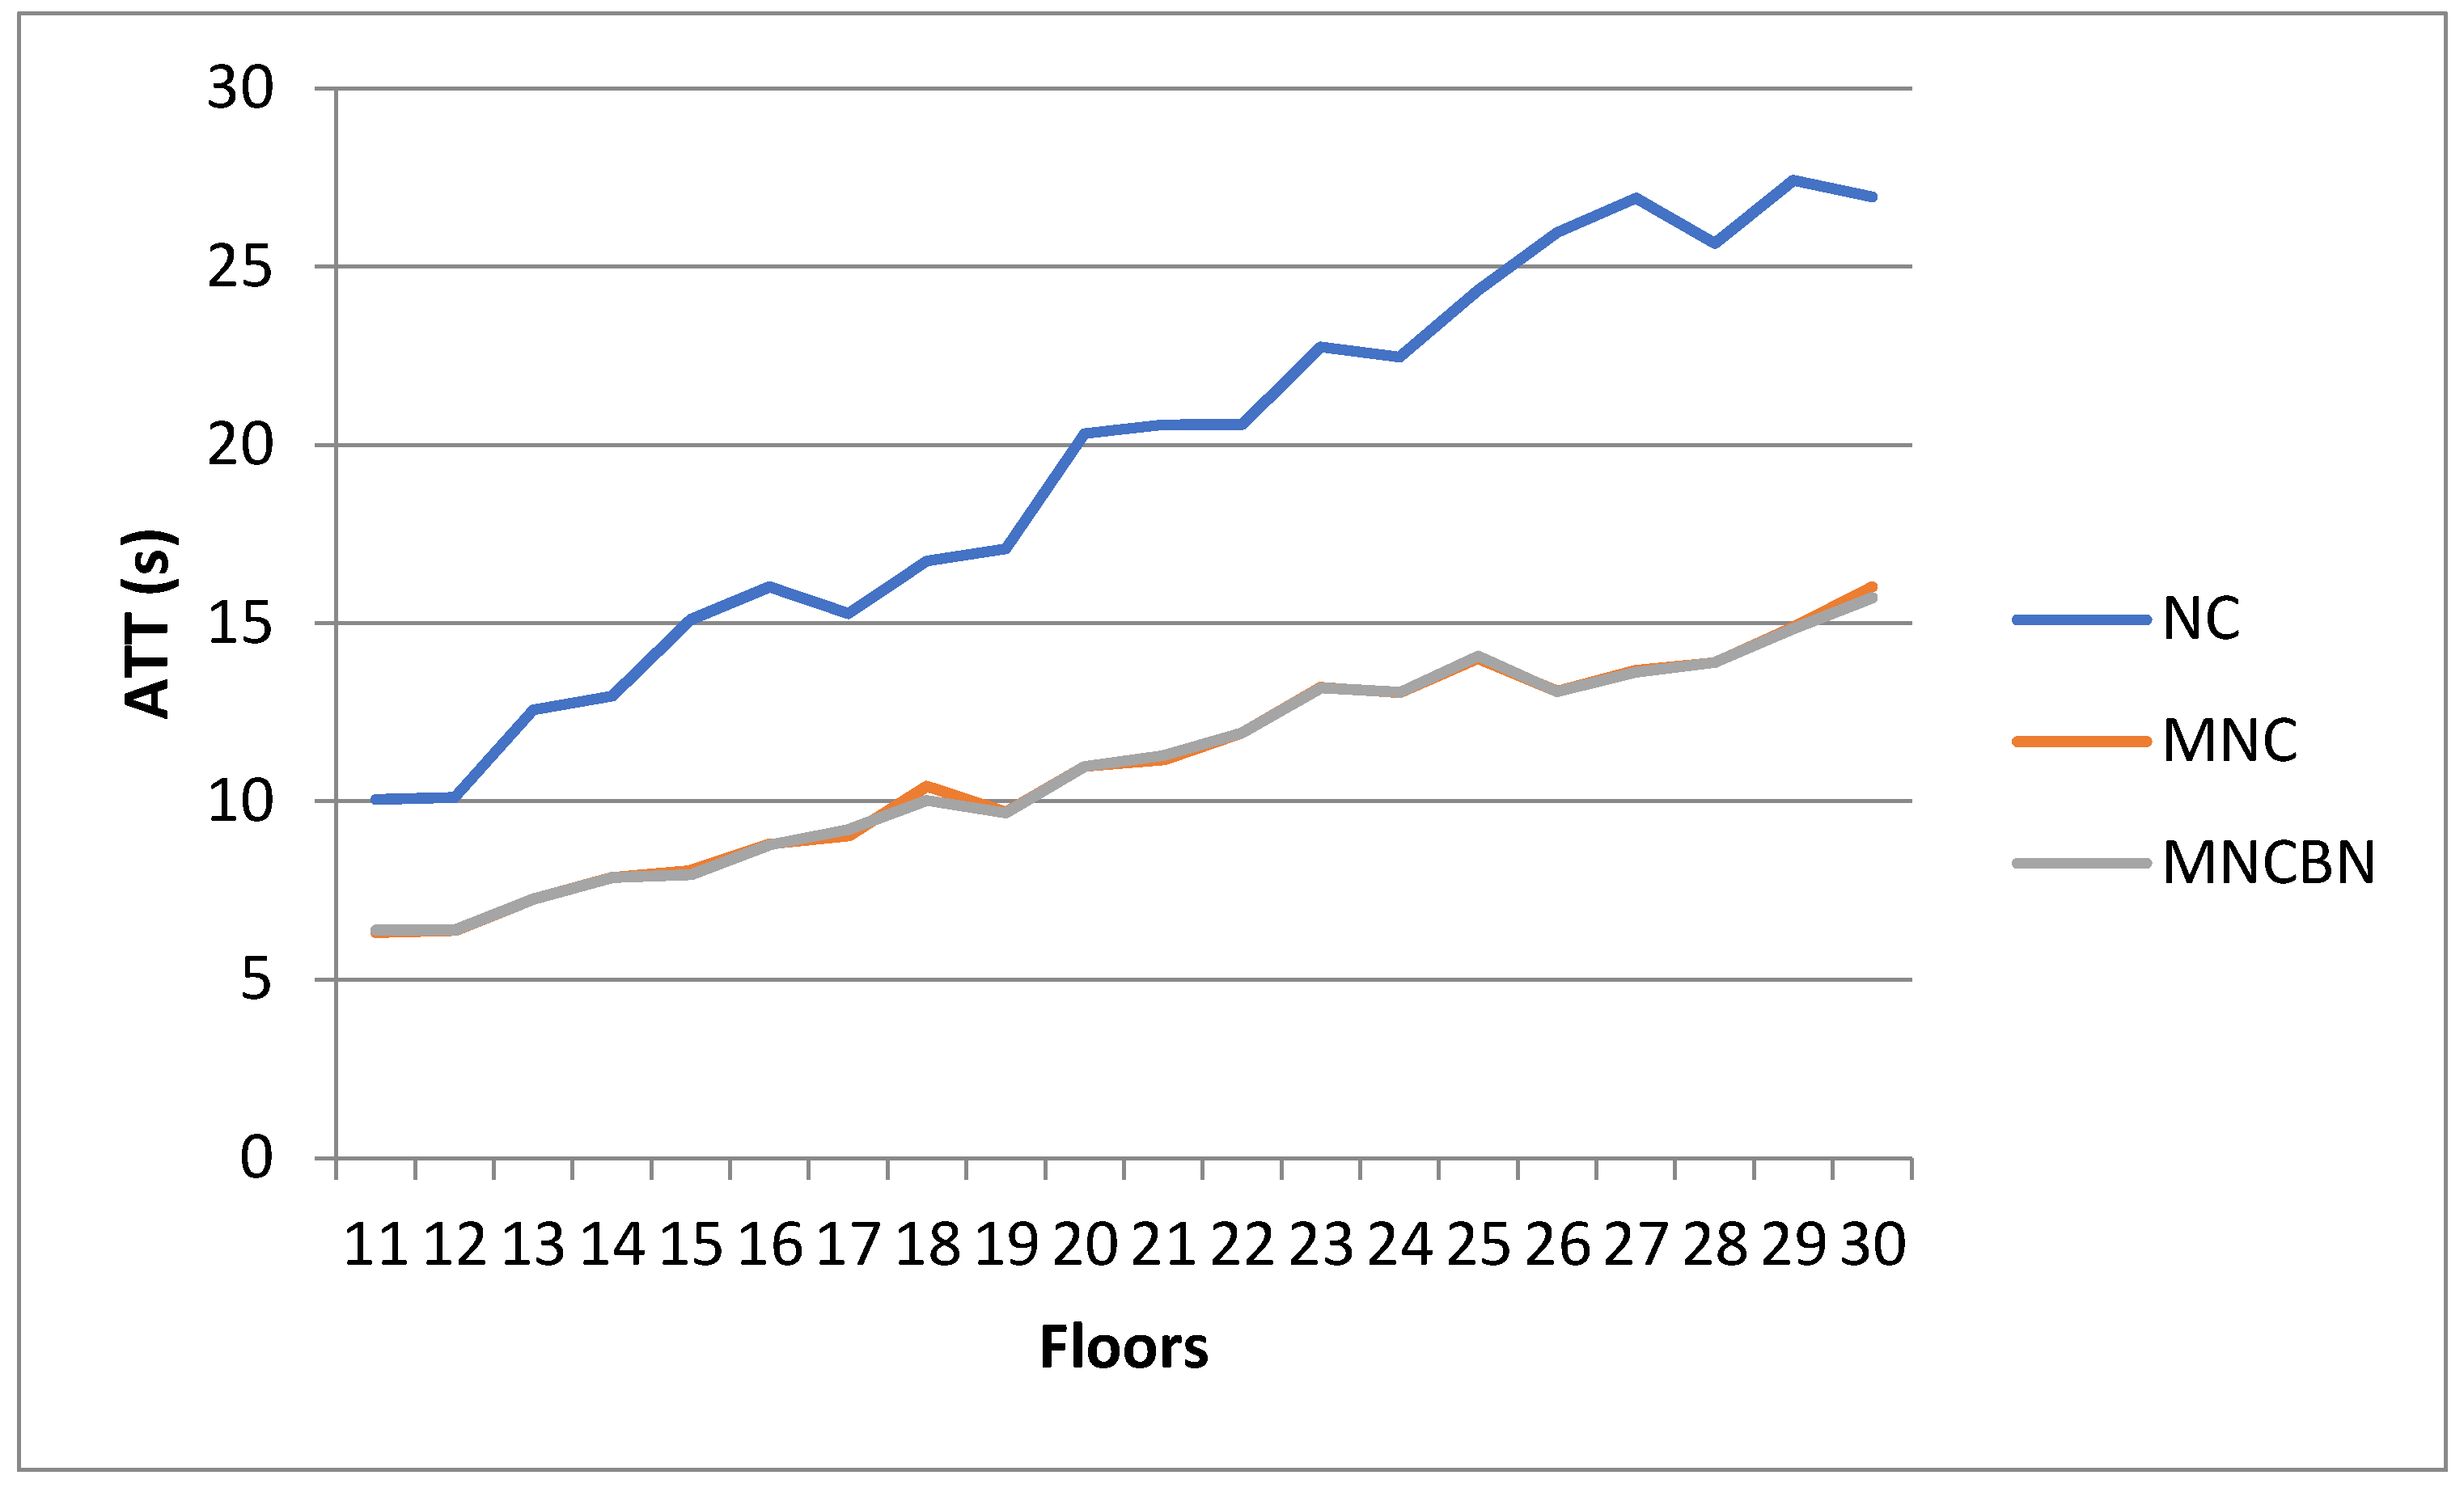
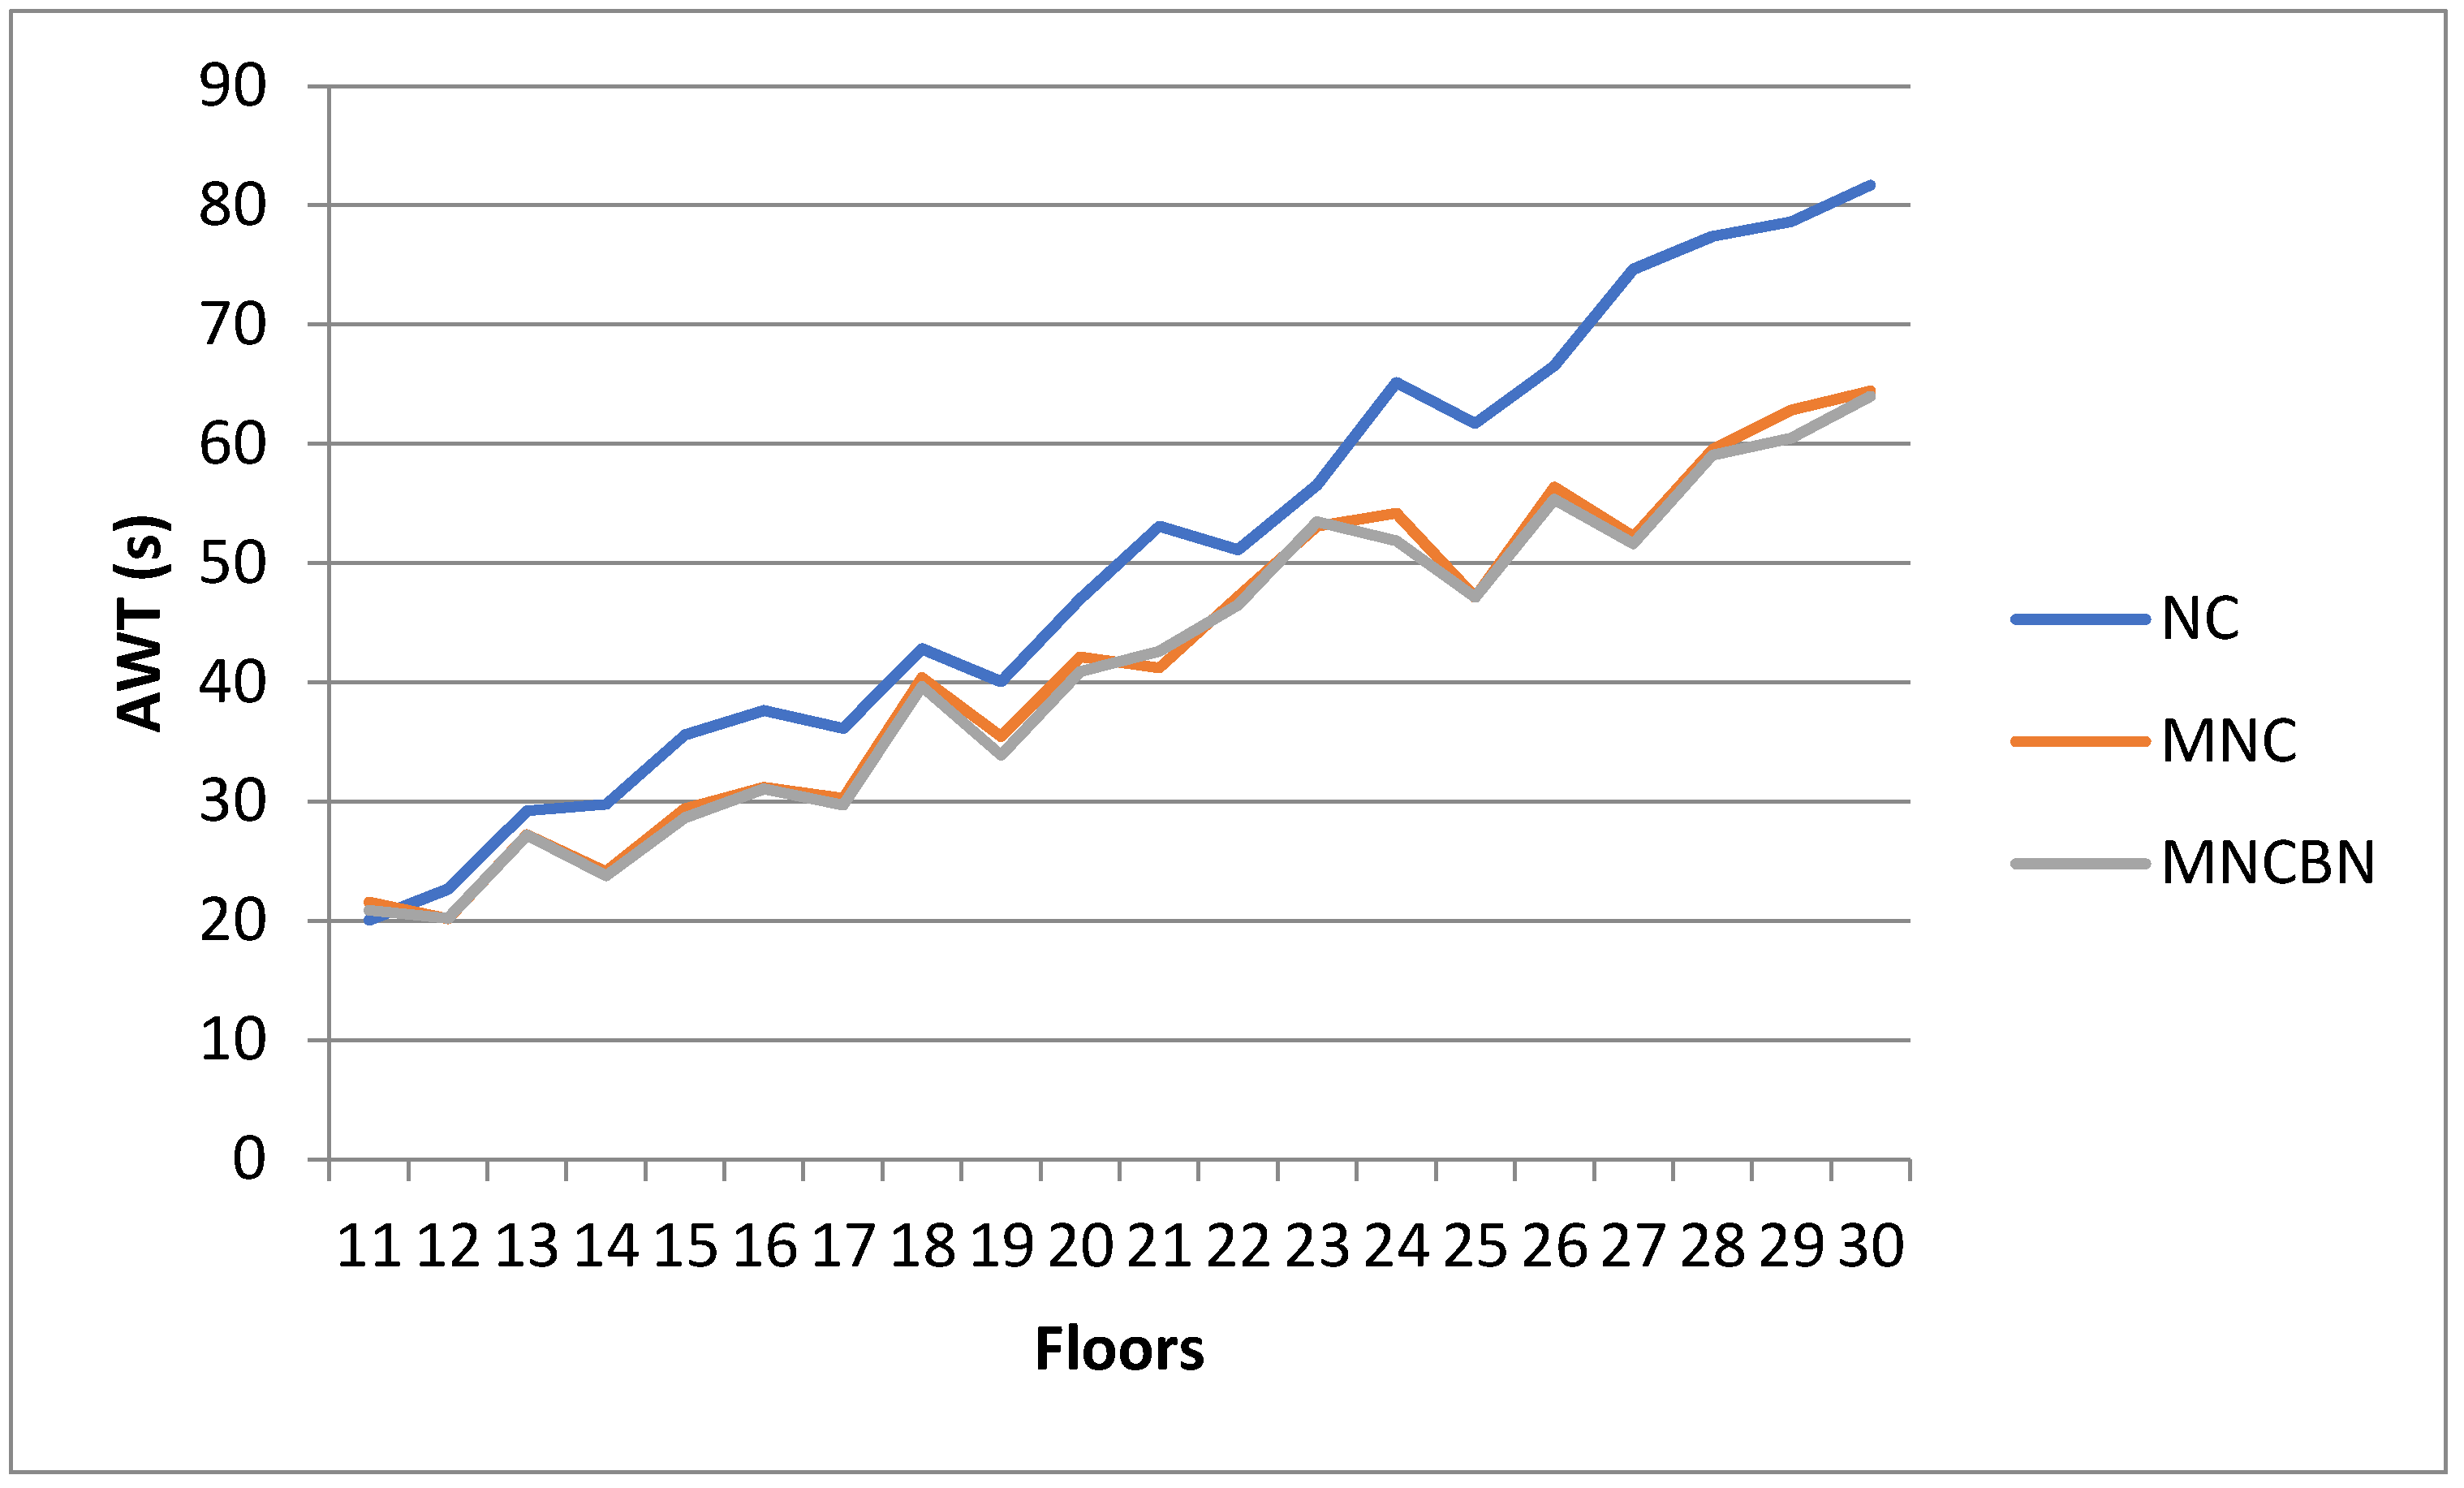
3.3. Dependence on the Building Height

Building height is an important factor that plays a key role in an EGC algorithm performance. For instance, according to [16], the conventional NC algorithm is suitable for mid-rise buildings (7–10 floors). In this section, the performance of MNC and MNCBN EGC algorithms is evaluated for buildings with 11–30 floors and 5 elevators and is compared to the performance of the conventional NC EGC algorithm. Similarly, as in the previous section, the case in which the total number of 300 people arrived with an interval of 0.1 seconds was taken into consideration. Figure 11 illustrates the dependence of ATT on the building height.
ATT of all three algorithms increased with increasing building height. However, the curve of the conventional NC has a higher gradient as compared to those of MNC and MNCBN. The same can be observed in AJT and AWT, which are presented in Figure 12 and Figure 13, respectively.
Similarly, as in the case of ATT, we found that AJT and AWT increased with an increasing number of building floors, yet in this case, the MNC and MNCBN curves are steeper. This fact leads to a reasonable conclusion that the conventional NC algorithm is not suitable for a high-rise building. In fact, a conventional approach for improving the performance of an NC algorithm in high-rise buildings is to implement building clustering.

3.4. Comparison of Results

A statistical analysis was performed to compare ATT, AJT, and AWT among the three different algorithms. For the interfloor traffic pattern test case (values of Table 3), we display the comparisons in Table 4.
The Friedman’s test revealed that there were statistically significant differences among the three algorithms for ATT and AJT, but not for AWT.

4. Conclusions

This paper presented a probabilistic EGC algorithm based on the nearest car elevator dispatch strategy. The proposed algorithm uses information obtained from hypothetical surveillance cameras located in the hallways and in elevator cars. The elevator control system uses the information on the number of people waiting in hallways or riding the elevator cars together with their associated probabilities. This information is updated every second and is utilized for optimal elevator dispatch.
The optimization of elevator dispatching is conducted via combination of calculations of the figure of suitability and determining the nearest elevator car. The proposed algorithm dispatches the elevator cars such that the maximum number of people is collected from the crowded floors. Moreover, the algorithm takes into account the size of each person and whether or not they carry any baggage. BNs generate a value that is called the effective number of passengers, which is further used for optimization of elevator dispatch. The goal of the proposed algorithm is to minimize the average travel, journey, and waiting time.
The case study implemented on a 10-storey office building containing five elevator cars showed that the proposed algorithm performs the best in scenarios with small traffic size (less than 200 people). The proposed algorithm mainly underperforms in uppeak traffic conditions with high traffic intensity and a large number of people. The best performance of the proposed algorithm was determined for scenarios with random interfloor conditions. According to the results, the average travel time for scenarios with varying traffic size and intensity improved by 39.94% and 19.53%, respectively.
Comparison of results obtained for the interfloor traffic pattern using the related samples Friedman’s two-way analysis of variance by ranks showed that ATT and AJT are different among all the algorithms, whereas AWT is not different.
The future work will be focused on the integration of a camera-driven probabilistic BN-based algorithm into the fixed and dynamic sectoring elevator control strategies.

Author Contributions

Conceptualization, V.Z. and Y.B.; methodology, Y.B. and V.Z.; software, K.A.; writing—original draft preparation, Y.B.; writing—review and editing, V.Z. and Y.B.; supervision, V.Z. All authors have read and agreed to the published version of the manuscript.

Funding

This research received no external funding.

Acknowledgments

The authors are thankful to the administration of Nazarbayev University for the support provided.

Conflicts of Interest

The authors declare no conflict of interest.

References

  1. United Nations Organization. World Urbanization Prospects: The 2018 Revision (Key Facts); United Nations: New York, NY, USA, 2019. [Google Scholar]
  2. Smith, S.F.; Barlow, G.J.; Xie, X.-F.; Rubinstein, Z.B. SURTRAC: Scalable Urban Traffic Control. In Proceedings of the TRB 2013 Annual Meeting, Washington, DC, USA, 13–17 January 2013. [Google Scholar]
  3. Rapid Flow Technologies LLC. RAPID FLOW BLOG. Rapid Flow Technologies LLC, 30 August 2018. Available online: https://www.rapidflowtech.com/blog/surtrac-deployment-at-urban-grid-networks-in-pittsburgh-neighborhoods (accessed on 5 August 2020).
  4. Bapin, Y.; Zarikas, V. Smart building’s elevator with intelligent control algorithm based on Bayesian networks. Int. J. Adv. Comput. Sci. Appl. 2019, 10, 16–24. [Google Scholar] [CrossRef] [Green Version]
  5. Amrin, A.; Zarikas, V.; Spitas, C. Reliability analysis and functional design using Bayesian networks generated automatically by an “Idea Algebra” framework. Reliab. Eng. Syst. Saf. 2018, 180, 211–225. [Google Scholar] [CrossRef]
  6. Zarikas, V.; Papageorgiou, E.; Pernebayeva, D.; Tursynbek, N. Medical decision support tool from a fuzzy-rules driven Bayesian network. In Proceedings of the 10th International Conference on Agents and Artificial Intelligence, Funchal, Portugal, 16–18 January 2018. [Google Scholar]
  7. Yu, D.C.; Nguyen, T.; Haddawy, P. Bayesian Network Model for Reliability Assessment of Power Systems. IEEE Trans. Power Syst. 1999, 14, 426–432. [Google Scholar] [CrossRef] [Green Version]
  8. Yongli, Z.; Limin, H.; Liguo, Z.; Yan, W. Bayesian Network Based Time-sequence Simulation for Power System Reliability Assessment. In Proceedings of the Seventh Mexican International Conference on Artificial Intelligence, Atizapan de Zaragoza, Mexico, 27–31 October 2008. [Google Scholar]
  9. Ebrahimi, A.; Daemi, T. A Novel Method for Constructing the Bayesian Network for Detailed Reliability Assessment of Power Systems. In Proceedings of the International Conference on Electric Power and Energy Conversion Systems, Sharjah, UAE, 10–12 November 2009. [Google Scholar]
  10. Shofield, A.; Stonham, T.; Mehta, P. Automated people counting to aid lift control. Autom. Constr. 1997, 6, 437–445. [Google Scholar] [CrossRef]
  11. Shao, H.; Li, L.; Xiao, P.; Leung, M.K. ELEVIEF: An Active Elevator Video Surveillance System. In Proceedings of the Workshop on Human Motion, Austin, TX, USA, 7–8 December 2000. [Google Scholar]
  12. Lee, Y.; Song, T.; Kim, H.; Han, D.K.; Ko, H. Hostile Intent and Behaviour Detection in Elevators. In Proceedings of the 4th International Conference on Imaging for Crime Detection and Prevention 2011 (ICDP 2011), London, UK, 3–4 November 2011. [Google Scholar]
  13. Zou, J.; Zhao, Q. Occupancy Detection in Elevator Car by Fusing Analysis of Dual Videos. In Proceedings of the 13th IEEE Conference on Automation Science and Engineering (CASE), Xi’an, China, 20–23 August 2017. [Google Scholar]
  14. Sun, Z.; Xu, B.; Wu, D.; Lu, M.; Cong, J. A real-time video surveillance and state detection approach for elevator cabs. In Proceedings of the International Conference on Control, Automation and Information Sciences (ICCAIS), Chengdu, China, 23–26 October 2019. [Google Scholar]
  15. Ding, N.; Luh, P.B.; Chen, T.; Zhang, H. Optimization of Elevator Evacuation Considering Potential Over-Crowding. In Proceedings of the 11th World Congress on Intelligent Control and Automation, Shenyang, China, 29 June–4 July 2014. [Google Scholar]
  16. Barney, G.; Al-Sharif, L. Elevator Traffic Handbook Theory and Practice; Routledge: New York, NY, USA, 2016. [Google Scholar]
  17. Python 3.7–Python Releases for Windows. Available online: https://www.python.org/downloads/windows/ (accessed on 16 August 2020).
  18. Bayesialab 8–Bayesian Networks for Research, Analytics, and Reasoning. Available online: https://www.bayesia.com/introduction?__hstc=221168007.d6327a006492fd03c47179bdedf277c4.1549810675300.1549810675300.1565871411196.2&__hssc=221168007.17.1565871411196&__hsfp=1049575405 (accessed on 24 August 2020).
Figure 1. Flowchart of conventional nearest car (NC) algorithm.
Energies 13 06161 g001
Figure 2. Flowchart of modified NC algorithm.
Energies 13 06161 g002
Figure 3. Bayesian network (BN) for effective number of people.
Energies 13 06161 g003
Figure 4. Flowchart of modified NC algorithm with BN.
Energies 13 06161 g004
Figure 5. Dependence of average travel time (ATT) on change in traffic size.
Energies 13 06161 g005
Figure 6. Dependence of average journey time (AJT) on change in traffic size.
Energies 13 06161 g006
Figure 7. Dependence of average waiting time (AWT) on change in traffic size.
Energies 13 06161 g007
Figure 8. Dependence of ATT on change in traffic intensity.
Energies 13 06161 g008
Figure 9. Dependence of AJT on change in traffic intensity.
Energies 13 06161 g009
Figure 10. Dependence of AWT on change in traffic intensity.
Energies 13 06161 g010
Figure 11. Dependence of ATT on the building height for the random interfloor traffic pattern.
Energies 13 06161 g011
Figure 12. Dependence of AJT on the building height for the random interfloor traffic pattern.
Energies 13 06161 g012
Figure 13. Dependence of AWT on the building height for the random interfloor traffic pattern.
Energies 13 06161 g013
Table 1. Simulation results for the uppeak traffic pattern.
Traffic SizeIntervalNC 1MNC 2MNCBN 3
ATTAJTAWTATTAJTAWTATTAJTAWT
1000.018.5835.2026.628.6629.3620.708.6829.3020.62
2000.018.86100.9492.089.0359.9950.969.0359.8750.84
3000.017.79171.52163.738.0594.9886.938.0594.9886.93
1000.18.5435.8327.308.5928.7220.138.5328.4719.94
2000.17.87100.0292.158.0250.4942.478.0450.2042.16
3000.18.24167.53159.298.5086.8878.388.4586.3377.88
20018.1424.1816.058.2021.1912.998.2018.8410.64
10028.4515.897.448.5116.217.718.4215.937.52
20028.2818.279.998.3018.4010.118.2917.248.95
30028.1019.5611.478.1318.2810.168.0717.819.74
1 Nearest car elevator group control (EGC) algorithm. 2 Modified nearest car EGC algorithm. 3 Modified nearest car EGC algorithm with BN.
Table 2. Simulation results for the downpeak traffic pattern.
Traffic SizeIntervalNC 1MNC 2MNCBN 3
ATTAJTAWTATTAJTAWTATTAJTAWT
1000.0110.6151.0040.399.0139.8030.788.5435.7227.18
2000.019.6178.4968.898.4754.3845.918.3755.5847.21
3000.019.35107.1597.807.9086.0978.197.9281.6873.76
1000.19.6436.0026.368.8934.7225.847.6532.2424.60
2000.19.9968.2858.298.5659.4450.888.7061.1852.48
3000.19.8292.9483.128.1475.6367.498.1775.4567.27
200113.3118.355.049.9717.697.729.2716.567.29
100211.0315.844.818.3614.676.318.0816.588.50
200211.4016.064.668.1414.246.108.2115.677.46
300211.2016.345.158.2714.776.508.4616.748.28
1 Nearest car EGC algorithm. 2 Modified nearest car EGC algorithm. 3 Modified nearest car EGC algorithm with BN.
Table 3. Simulation results for the random interfloor traffic pattern.
Traffic SizeIntervalNC 1MNC 2MNCBN 3
ATTAJTAWTATTAJTAWTATTAJTAWT
1000.019.2420.9411.706.0715.739.676.3216.5110.20
2000.019.1429.3420.205.8223.7517.945.7022.3516.65
3000.018.7937.4928.706.2132.8726.665.9331.1125.18
1000.18.9916.727.736.0014.848.855.6014.278.67
2000.18.9320.7511.825.7516.9211.185.2615.9210.67
3000.18.9126.3217.415.3819.6014.225.5420.3514.80
20017.5910.082.496.069.193.135.8810.494.60
10027.319.852.546.039.163.136.4710.133.66
20027.379.672.306.139.133.006.2210.504.29
30027.7910.442.656.499.773.286.5810.974.39
1 Nearest car EGC algorithm. 2 Modified nearest car EGC algorithm. 3 Modified nearest car EGC algorithm with BN.
Table 4. Hypothesis test summary.
#Null HypothesisTestSignificance 1Decision
1Distribution of ATT_NC, ATT_MNC, and ATT_MNCBN are the sameRelated samples Friedman’s two-way analysis of variance by ranks0.001Reject the null hypothesis
2Distribution of AJT_NC, AJT_MNC, and AJT_MNCBN are the same0.027
3Distribution of AWT_NC, AWT_MNC, and AWT_MNCBN are the same0.905Retain the null hypothesis
1 The significance level is 0.05.
Publisher’s Note: MDPI stays neutral with regard to jurisdictional claims in published maps and institutional affiliations.

