Article

The Effect of Air Parameters on the Evaporation Loss in a Natural Draft Counter-Flow Wet Cooling Tower

School of Energy and Power Engineering, Shandong University, Jinan 250061, China
*
Author to whom correspondence should be addressed.
Energies 2020, 13(23), 6174; https://doi.org/10.3390/en13236174
Submission received: 22 October 2020 / Revised: 18 November 2020 / Accepted: 23 November 2020 / Published: 24 November 2020
(This article belongs to the Section F: Electrical Engineering)

Abstract

:
The measures to reduce the impact of evaporation loss in a natural draft counter-flow wet cooling tower (NDWCT) have important implications for water conservation and emissions reduction. A mathematical model of evaporation loss in the NDWCT was established by using a modified Merkel method. The NDWCTs in the 300 MW and 600 MW power plant were taken as the research objects. Comparing experimental values with calculated values, the relative error was less than 3%. Then, the effect of air parameters on evaporation loss of NDWCT was analyzed. The results showed that, with the increase of dry bulb temperature, the evaporation heat dissipation and the evaporation loss decreased, while the rate of evaporation loss caused by unit temperature difference increased. The ambient temperature increased by 1 °C and the evaporation loss was reduced by nearly 26.65 t/h. When the relative air humidity increased, the evaporation heat dissipation and evaporation loss decreased, and the rate of evaporation loss caused by unit temperature difference decreased. When relative air humidity increased by 1%, the outlet water temperature rose by about 0.08 °C, and the evaporation loss decreased by about 5.63 t/h.

1. Introduction

NDWCTs are extensively used in most electric power industries to reject waste heat in the condenser to the surrounding. The cooling process in NDWCT, as an extremely important process in power production, is realized by contact heat dissipation and evaporation heat dissipation. The water loss of the NDWCT mainly includes evaporation loss, drift loss and blowdown loss. Evaporation loss is the largest water consumption project in power plants. Moreover, the “white smoke” from the NDWCT outlet will pollute the surrounding environment. Therefore, reducing the impact of evaporation loss in NDWCT has important implications for water conservation and emissions reduction.
Water, as a heat transfer medium in NDWCTs, is the scarce resources in many areas [1,2,3]. Among many cooling methods, direct air-cooled system has significant advantage of water saving. Several elements, such as the ambient wind speed, wind direction, fan performance, and the installation angles of its blades, affect the thermal-flow characteristics of an air-cooled system tremendously [4,5,6,7,8]. However, compared with wet cooling towers, dry cooling towers only account for a very small proportion.
Evaporation loss is an important part of water consumption in power plants. Based on the heat and mass transfer equations, Kairouani et al. [9] presented a mathematical model for prediction of the evaporation loss for cooling towers, and obtained an optimal water loss which was equivalent to 4% of the total water flow rate. Xia et al. [10] used the Merkel method, the Poppe approach and empirical equation to numerically calculate the evaporation loss for NDWCT. Their results showed that neither the Merkel method nor the empirical equation can predict the evaporation loss as accurately as the Poppe approach. Facao and Oliveira [11] established a computational fluid dynamics (CFD) model to analyse the mass and heat transfer in the cooling tower. Qureshi and Zubair [12,13] proposed an empirical relation for studying the evaporation losses in wet cooling towers based on the ASHRAE’s rule of thumb, and the results showed that the percentage of water evaporation obtained from the empirical relation agreed well with experimental data. Hajidavalloo et al. [14] developed a conventional mathematical model to study the effect of wet bulb temperature on the thermal performance of cross flow cooling towers, and found that the approach, range and evaporation loss gradually increased with the increase of wet bulb temperature. Moreover, the variation between ratio of evaporation loss to circulating water and Variation was obtained. Based on the Poppe approach and mixed-integer nonlinear programming, Rubio-Castro et al. [15] presented an optimal design algorithm for a mechanical ventilation cooling tower. Similarly, for optimal designing the mechanical draft cooling tower, Rao and More [16] developed a self-adaptive Jaya algorithm. The optimal total cost of tower geometry obtained by the Merkel method, Poppe approach, artificial bee colony algorithm, and this self-adaptive Jaya algorithm were compared with each other. The result showed that the optimal total cost of tower geometry obtained by the method of the self-adaptive Jaya algorithm was the least. Naik et al. [17] obtained the thermal performances of mechanical ventilation cooling tower by developing a simple analytical model and discovered that the operating parameters had important effect on heat and mass transfer of cooling tower. Based on the effectiveness- number of transfer unit (e-NTU) method, Mansour and Hassab [18] developed a new correlation which was adopted to study the thermal performance of wet counterflow cooling tower. Picardo and Variyar [19] established a new methodology for studying the packed height in a cooling tower, and found that packed height of the cooling tower had nothing to do with mass flow rate of circulating water and tower diameter, but was related to excess air flow. Fisenko et al. [20] developed a new mathematical model of a mechanical draft cooling tower performance, the precision of which is about 3%. It was found that the average cube of the droplet radius practically determines thermal efficiency. Chen et al. [21] adopted a transient one-dimensional mathematical model to study the adsorption chiller. The results showed that the cooling power and coefficient of performance (COP) could be calculated by the model given the following conditions, including the hot water inlet temperature, the chilled water inlet temperature, the air inlet wet bulb temperature, and dry bulb temperature.
So far, the mathematical model of evaporation loss mainly lays a lot of emphasis on mechanical wet cooling towers. Seldom key studies focus on the effect of air parameters on evaporation loss in NDWCTs. In this study, the NDWCTs in the representative 300 MW and 600 MW power plant were taken as the subject investigated. Based on the Merkel method, a mathematical model of evaporation loss in the NDWCT was established in view of evaporation loss. Then a solution program for this model was developed by MATLAB software. The accuracy of the mathematical model was verified by comparing experimental values with calculated values. The NDWCTs were needed for operating in a variation of air parameters which strongly affected the thermal performance of NDWCTs. The influence mechanism of air parameters on evaporation loss in the NDWCT was mainly analyzed, which was of great guiding significance for the power plant to reduce the emission and save water.

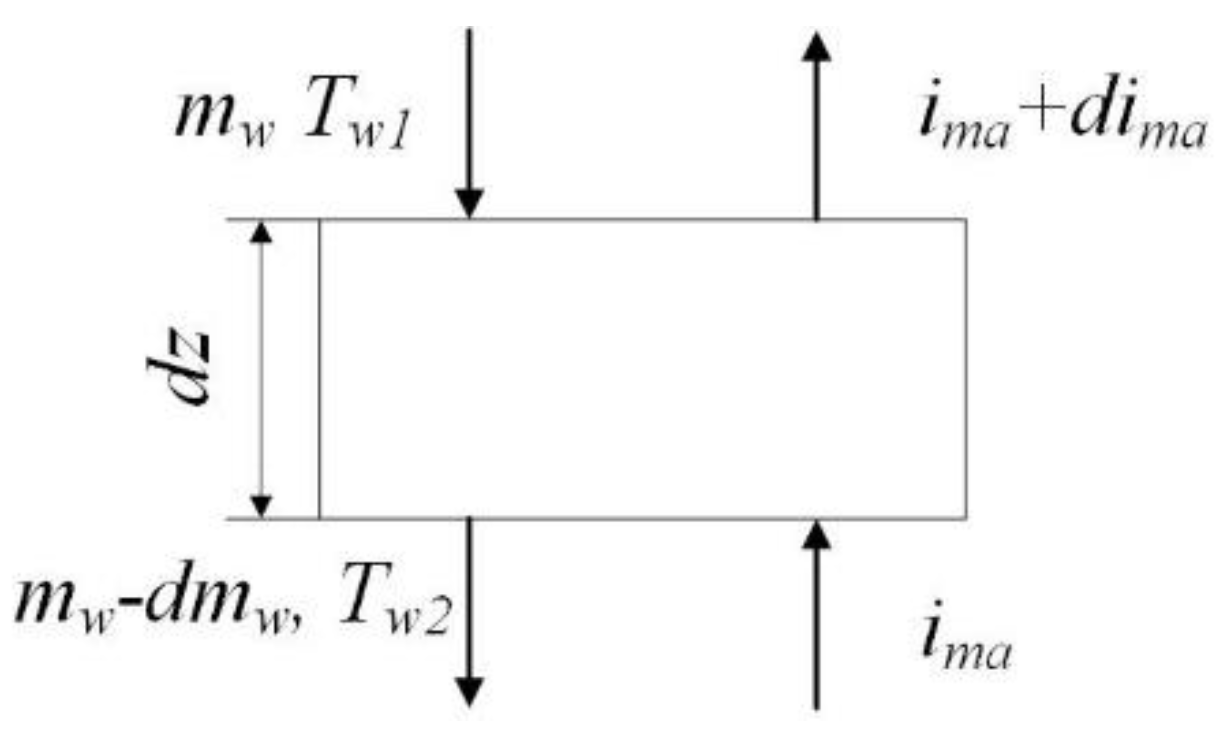
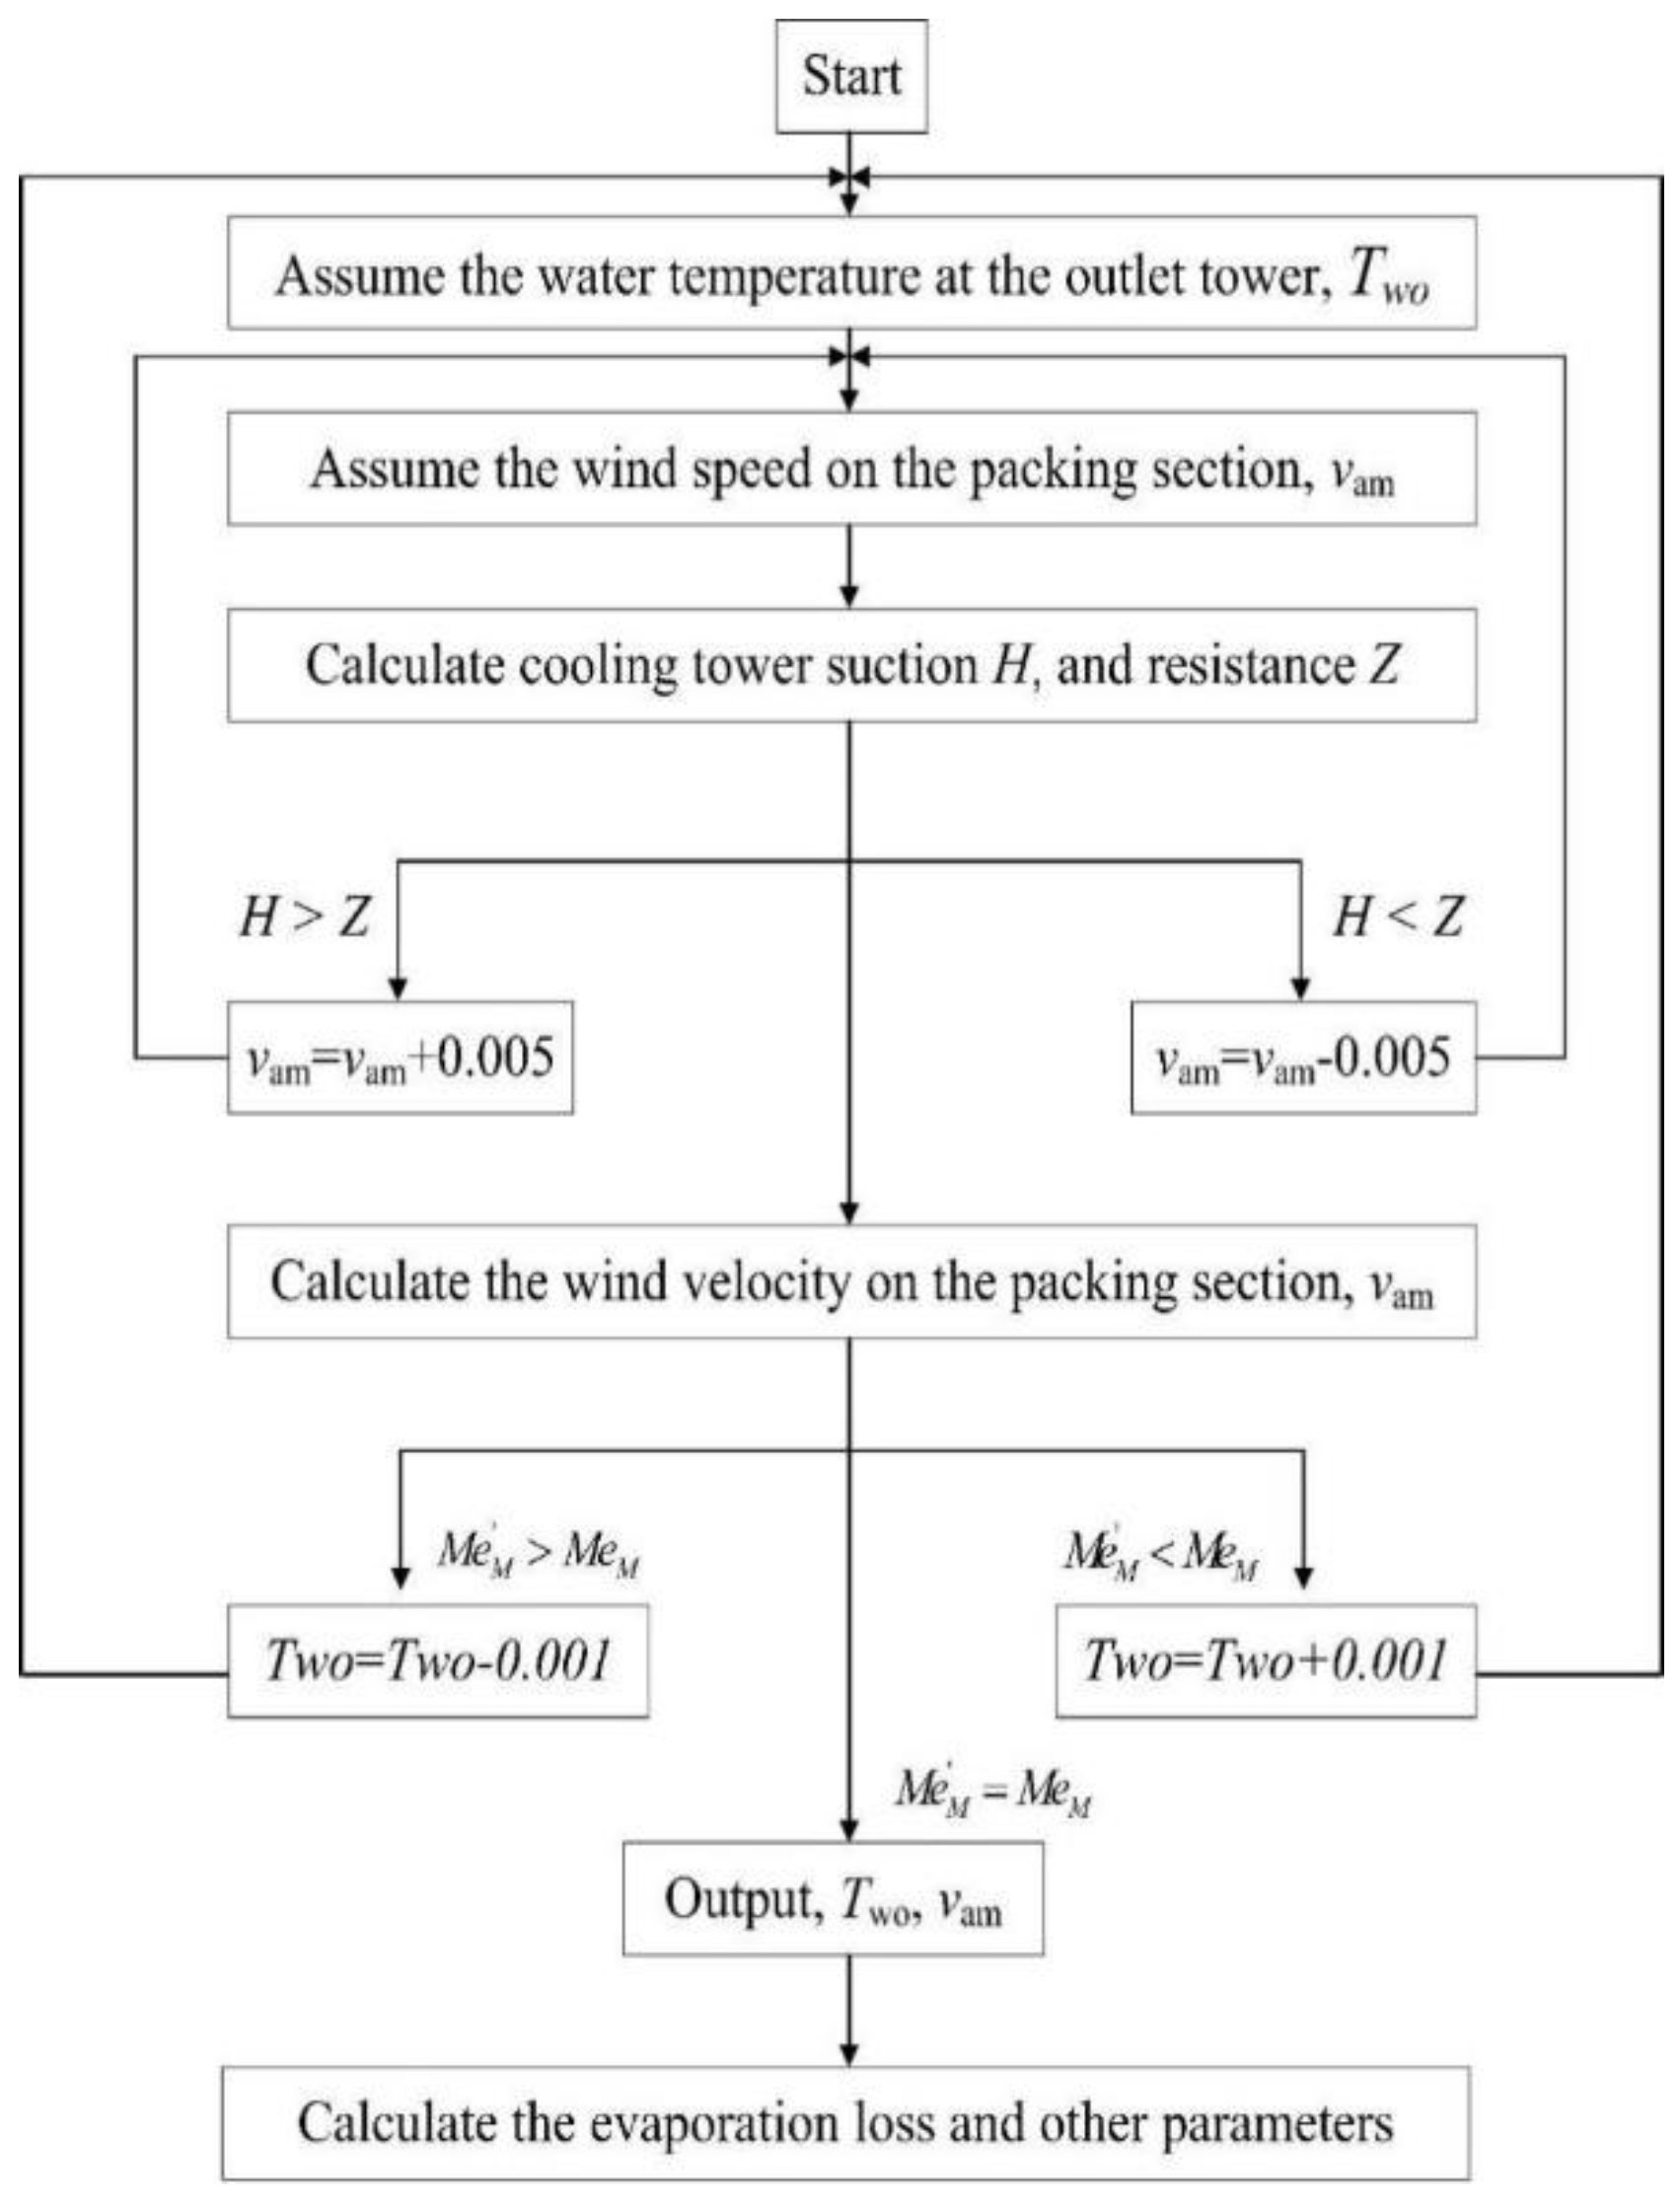
2. Mathematical Model

The heat transfer of circulating water was achieved by contact heat dissipation and evaporation heat dissipation in NDWCTs. The circulating water after heat transfer in condensers was pressurized by circulating water pump, and the circulating water passed through spray zone, fill zone, rain zone and then fell into collecting basin in turn. While, ambient air flowed upward. For an existing NDWCT, the thickness of the tower is about 1 m, and the tower tube of NDWCT is a cast-in-place reinforced concrete thin shell structure. The inner wall of the tower tube is brushed with anticorrosive paint, the outer wall of the tower tube is brushed with cement slurry, and the inner wall of the collecting basin is brushed with waterproof mortar. In this study, the important assumptions of the model were as follow:
  • The conditions of water and air varied only with vertical position in the tower.
  • Radiation heat transfer from air to water was negligible.
  • Heat transfer through the tower wall to the environment was negligible.
  • Temperatures of water and air at any cross-sections were uniform.
  • Windage and blowdown losses were negligible.
Based on Merkel theory, the enthalpy difference was taken as the sole driving force for the heat dissipation. In this theory, the assumptions that the change of circulating water was negligible and the Lewis factor was equal to 1 were adopted [10,18].
The Merkel equation as follows:
h d A t m w = T w o T w i c p w d T w i m a s w i m a
where hd is mass transfer coefficient. imasw is the enthalpy of the saturated air layer on the water surface when water temperature is Tw. ima is the enthalpy of the moist air when air temperature is Ta.
The Merkel number was modified in view of the effects of water loss. In this study, introduction of a heat coefficient k that represented the heat carried by evaporation loss [22,23]. The validity range of k was that the circulating water temperature range was in the range of 0–50 °C. Then, the modified Merkel equation is as follows:
M e M = 1 k T w o T w i c p w d T w i m a s w i m a
where Twi, and Two are the inlet water temperature and outlet water temperature of NDWCT respectively.
The specific derivative process of k coefficient was detailed introduced here [23], Figure 1 shows the heat and mass transfer in a finite volume of the cooling tower. As shown in Figure 1, the heat dissipating capacity of water was equal to the heat absorption capacity of air, as described in Equation (3).
c p w d ( m w T w ) = h d ( i m a s w i m a ) A V d z
where cpw = 4.1868 kJ/(kg·°C) is the specific heat of water, mw is the circulating water flow rate, Tw is the circulating water temperature, ima is the air enthalpy, and imasw is the enthalpy of saturated vapor with the temperature of Tw.
Here, introducing k, Equation (3) could be reduced to Equation (4) as follows:
c p w d ( m w T w ) = 1 k c p w m w d T w = h d ( i m a s w i m a ) A V d z
For a finite volume with an inlet water temperature Tw1 and an outlet water temperature of Tw2, the heat dissipating capacity of water could be calculated as Equation (5).
c p w [ m w T w 1 ( m w Δ m w ) T w 2 ] = 1 k c p w m w d T w
According to Equation (5), the computational formula for k was:
k = 1 1 + T w 2 Δ m w m w Δ T w
The heat dissipating capacity included conduction heat dissipation Qc and evaporation heat dissipation Qe, that was,
c p w m w d T w = Q c + Q e
According to Equations (6) and (7), the k was calculated by:
k = 1 1 + c p w T w 2 γ T w 2 ε ,   ε = Q e Q c + Q e
where γ T w 2 is the latent heat of vaporization at the temperature of Tw2. When Tw2 is in the range of 0–50 °C, the γ T w 2 could be calculated as follows:
γ T w 2 = 2453.46 2.3446 ( T w 2 20 )
Because the Qe is much larger than Qc in summer and Tw2cpw << γ T w 2 , the Equation (8) can be simplified as follows:
k 1 1 + c p w T w 2 γ T w 2 1 c p w T w 2 γ T w 2 + ( c p w T w 2 γ T w 2 ) 2 + 1 c p w T w 2 γ T w 2
According to Equations (9) and (10), the k was calculated by:
k = 1 T w 2 586 0.56 ( T w 2 20 )
For whole cooling tower k was expressed as
k = 1 T w o 586 0.56 ( T w o 20 )
The pumping force H and resistance of the NDWCT Z were equal. Ambient air entered the NDWCT from the inlet of tower, passed through the rain zone, fill zone, spray zone, water collector, and drained from the tower exit, generating resistance as the air passes through these parts. On the other hand, the pumping force was H caused by the density difference inside and outside the NDWCT [23].
H = ( ρ a i ρ a o ) g ( H t H i n l e t ) , Z = 1 2 ξ ρ a m v a m 2 ,   H = Z
where H is the pumping force, Z is the resistance of cooling tower, ρai is tower inlet air density, ρao is tower outlet air density, Ht is the tower height, and Hinlet is the tower inlet height. ξ is total drag coefficient of the tower and vam is the average airflow velocity in packing section.
Evaporation loss equaled the increase of air moisture content in NDWCT. The formula for calculating the evaporation loss was as follows:
m e v a p = m a ( w o w i )
The calculation formula of conduction heat dissipation was:
Q c = c p a m a ( T a o T a i )
where Qc is the conduction heat dissipation of cooling tower, cpa is the specific heat of air, and Tai and Tao are the inlet temperature and the outlet temperature of the cooling tower.
The mass flow of air was:
m a = ρ a i v a m A s
where As is the area of cross section of fill and ρai is tower inlet air density.
Here, the calculation method of the outlet air temperature Tao was introduced in detail. It can be seen from the enthalpy and humidity diagram that when the dry bulb temperature was greater than 15 °C, the saturation enthalpy of air and the dry bulb temperature were basically linear. It was generally considered that the humid air at the outlet of the cooling tower was saturated or close to saturation, thus here iao was used instead of i a o
T a o T a i T w m T a i = i a o i a i i m i a i i a o i a i i m i a i T a o = T a i + ( T w m T a i ) i a o i a i i m i a i
where Tai and Tao are the inlet temperature and the outlet temperature of the cooling tower, i a i and i a o are the specific enthalpy of saturated air at temperature Tai and Tao respectively, i a o is the enthalpy of the outlet air of the cooling tower, Twm is the average temperature of temperature Twi and Two, i m is the specific enthalpy of saturated air at temperature Twm.
As shown in Figure 1, the heat dissipating capacity of water was equal to the heat absorption capacity of air. The heat absorption capacity of air was equal to the increase of air enthalpy, as shown in Equation (18).
1 k c p w m w d T w = m a d i m a ,   after   integration ,   i a o = i a i + c pw ( T w i T w o ) m w m a k
The physical modelling experiment of the fillers in NDWCT is carried out, and then the fitting formula of Merkel number and gas-water ratio was obtained.
M e M = C λ n
where λ is the ratio of the mass air flow rate to the mass flow rate of circulating water. C and n are constants obtained from thermal performance test of the packing in the simulation test tower. The values of C and n were shown in Table 1.
The geometric dimension parameters, such as air inlet height of tower, the tower height, drenching area, average diameter of tower inlet, and tower outlet diameter, for the existing NDWCT, were determined. The environmental parameters, including atmospheric pressure, dry bulb temperature, wet bulb temperature and relative humidity, were given. Through MATLAB programming iterative calculation to obtain the outlet water temperature of the NDWCT, the tower air volume and the tower air moisture content. Finally, the evaporation loss in the NDWCT was obtained. The program block diagram for solving this calculation model is shown in Figure 2.

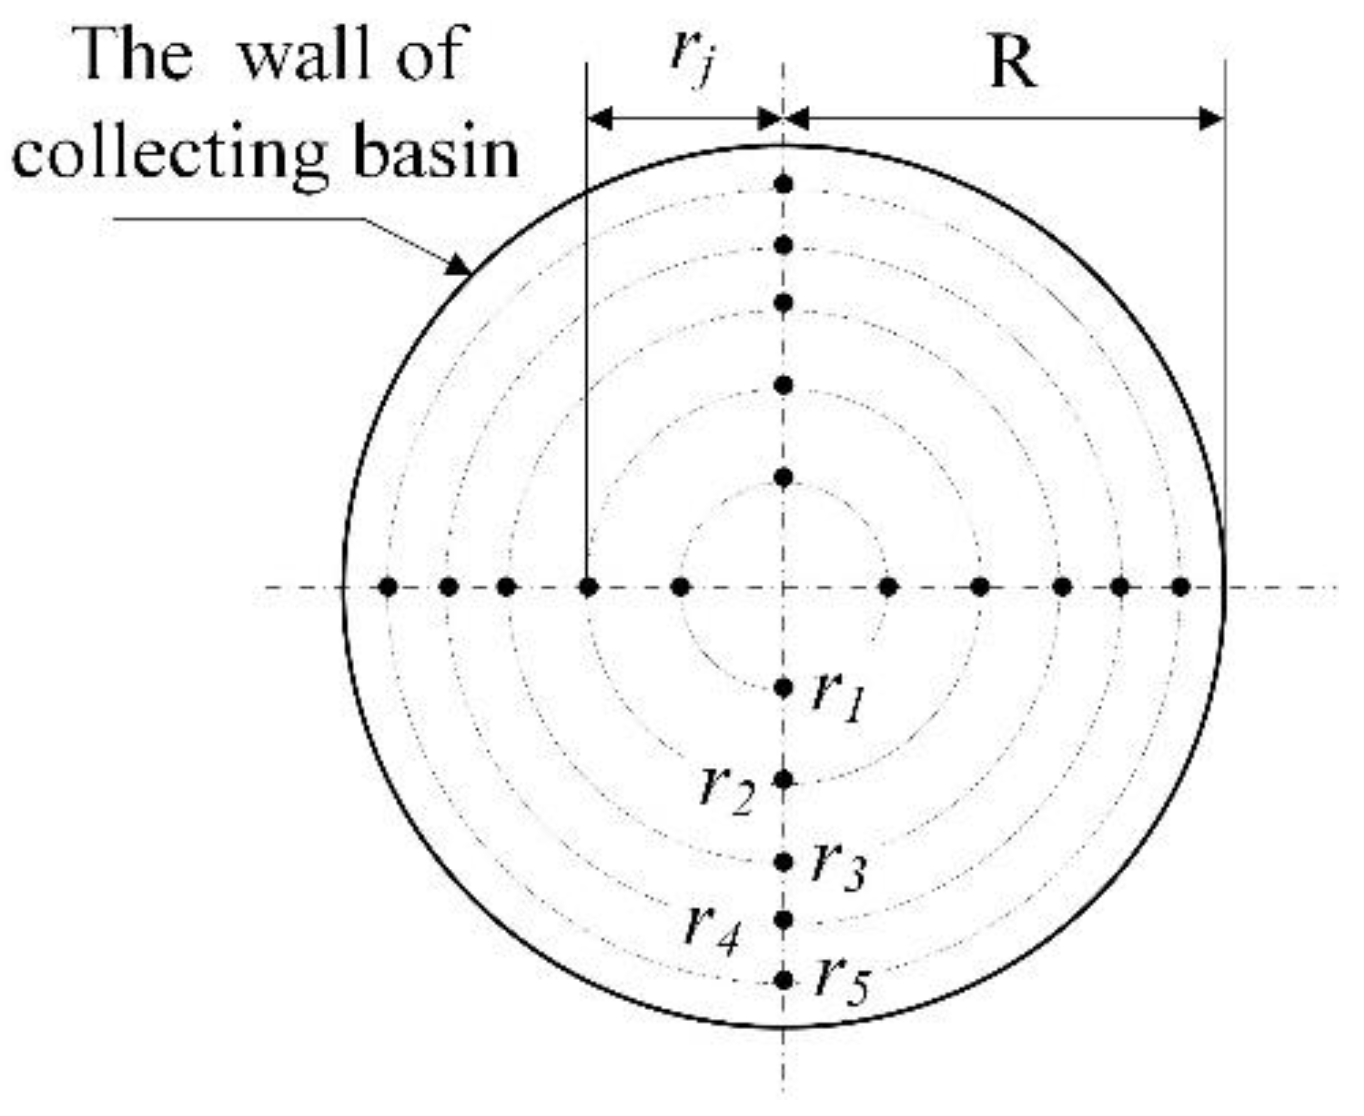
3. Experimental Verification

In this study, taking the NDWCTs of the representative 300 MW and 600 MW power plant as the experimental objects. The geometric dimensions and filler characteristics are shown in Table 2. The experiment was conducted in the northern of China, and the whole experiment was conducted in summer. Figure 3 shows the schematic diagram of NDWCT and the location of monitoring points. The NDWCT included the collecting basin, fillers, water distribution system, tower shell and the cooling tower central shaft. After being pressurized by the water pump, the hot water enters the water distribution system through the shaft, and then falls into the collecting zone after passing through the fill zone, as shown by the red arrow in the Figure 3. At the same time, under the cooling tower pumping force, the air passed through the rain zone, the fill zone, and the spray zone in turn and was finally discharged out of the tower, as shown by the black arrow in the Figure 3.
Two layers of temperature measuring points were arranged in the NDWCT, which mainly measured the water temperature at the inlet and outlet of the cooling tower. The monitoring points of inlet and outlet tower water temperature were respectively location in the central shaft and surface of collecting basin, as shown in Figure 3. The equal area method was used to measure the outlet tower water temperature. The location distribution of collecting basin measuring point were shown in in Figure 4, and the radius of the measuring point was obtained by Equation (20). Meteorological parameters around the NDWCT were measured by a small meteorological station. In order to improve the accuracy of measurements, the small-type meteorological station was located 40 m away from the NDWCT and 3 m above the horizontal level. The testing instruments at various cooling zones were listed in Table 3.
In this study, the experimental data were transmitted instantly through wireless technology, and the experimental data acquisition system was shown in the Figure 5. Taking temperature measurement as an example, the temperature at the measuring point was transformed into current signal through the sensor, and the current signals was received and sent to the signal receiving device by the data acquisition device. Next, the current signal was analyzed by software to get the corresponding temperature value in computer.
r j = R ( 2 j 1 ) / 10
where j is the coordinates of the laps where the measuring point is located, and the value of j is 1, 2, 3, 4, and 5 from the center along the radial direction. rj is the radius of the measuring point in the lap j. R is the radius of collecting basin.
In this paper, the accuracy of the mathematical model was verified by experimental data. The temperature in the center of the shaft was set as the inlet water temperature of the NDWCT. The average temperature of the temperature measuring point of the collecting basin was used as the outlet water temperature of NDWCT. Five different operating conditions of the 300 MW and 600 MW NDWCTs were tested respectively. More specifically, atmospheric pressure, dry bulb temperature, wet bulb temperature, mass flow rate of circulating water, and inlet tower water temperature are shown in Table 4 and Table 5.
The verification of this mathematical model was made by comparing the outlet water temperature Two obtained from the mathematical model with the experimental value. Figure 6 showed the calculated and experimental values of outlet water temperature Two at different conditions. By analyzing the calculated and experimental values Two of 300 MW and 600 MW units respectively, it is found that the calculated value of the outlet water temperature is very close to the experimental value. The maximum relative errors between the calculated and experimental values Two of the 300 MW and 600 MW unit at five working conditions were 0.95% and 1.20%, respectively. Therefore, it can be considered that the established mathematical model for predicting evaporation loss was accurate, and it was feasible to use this model for the next research.

4. Results and Discussion

The structural parameters of the NDWCT had been determined. Therefore, the influence of geometric dimension parameters wasn’t considered. Factors, which affected thermal performance of the NDWCT, would affect evaporation heat dissipation. In this study, the influence of air parameters on evaporation loss was emphatically analyzed. Air parameters mainly included air-dry bulb temperature and relative air humidity. In this paper, The NDWCT 300 MW was selected as the study subject, and the working condition 4 was selected as the reference working conditions. At this time, the relative humidity of the air is 71.79% and specific operating parameters were shown in Table 4.

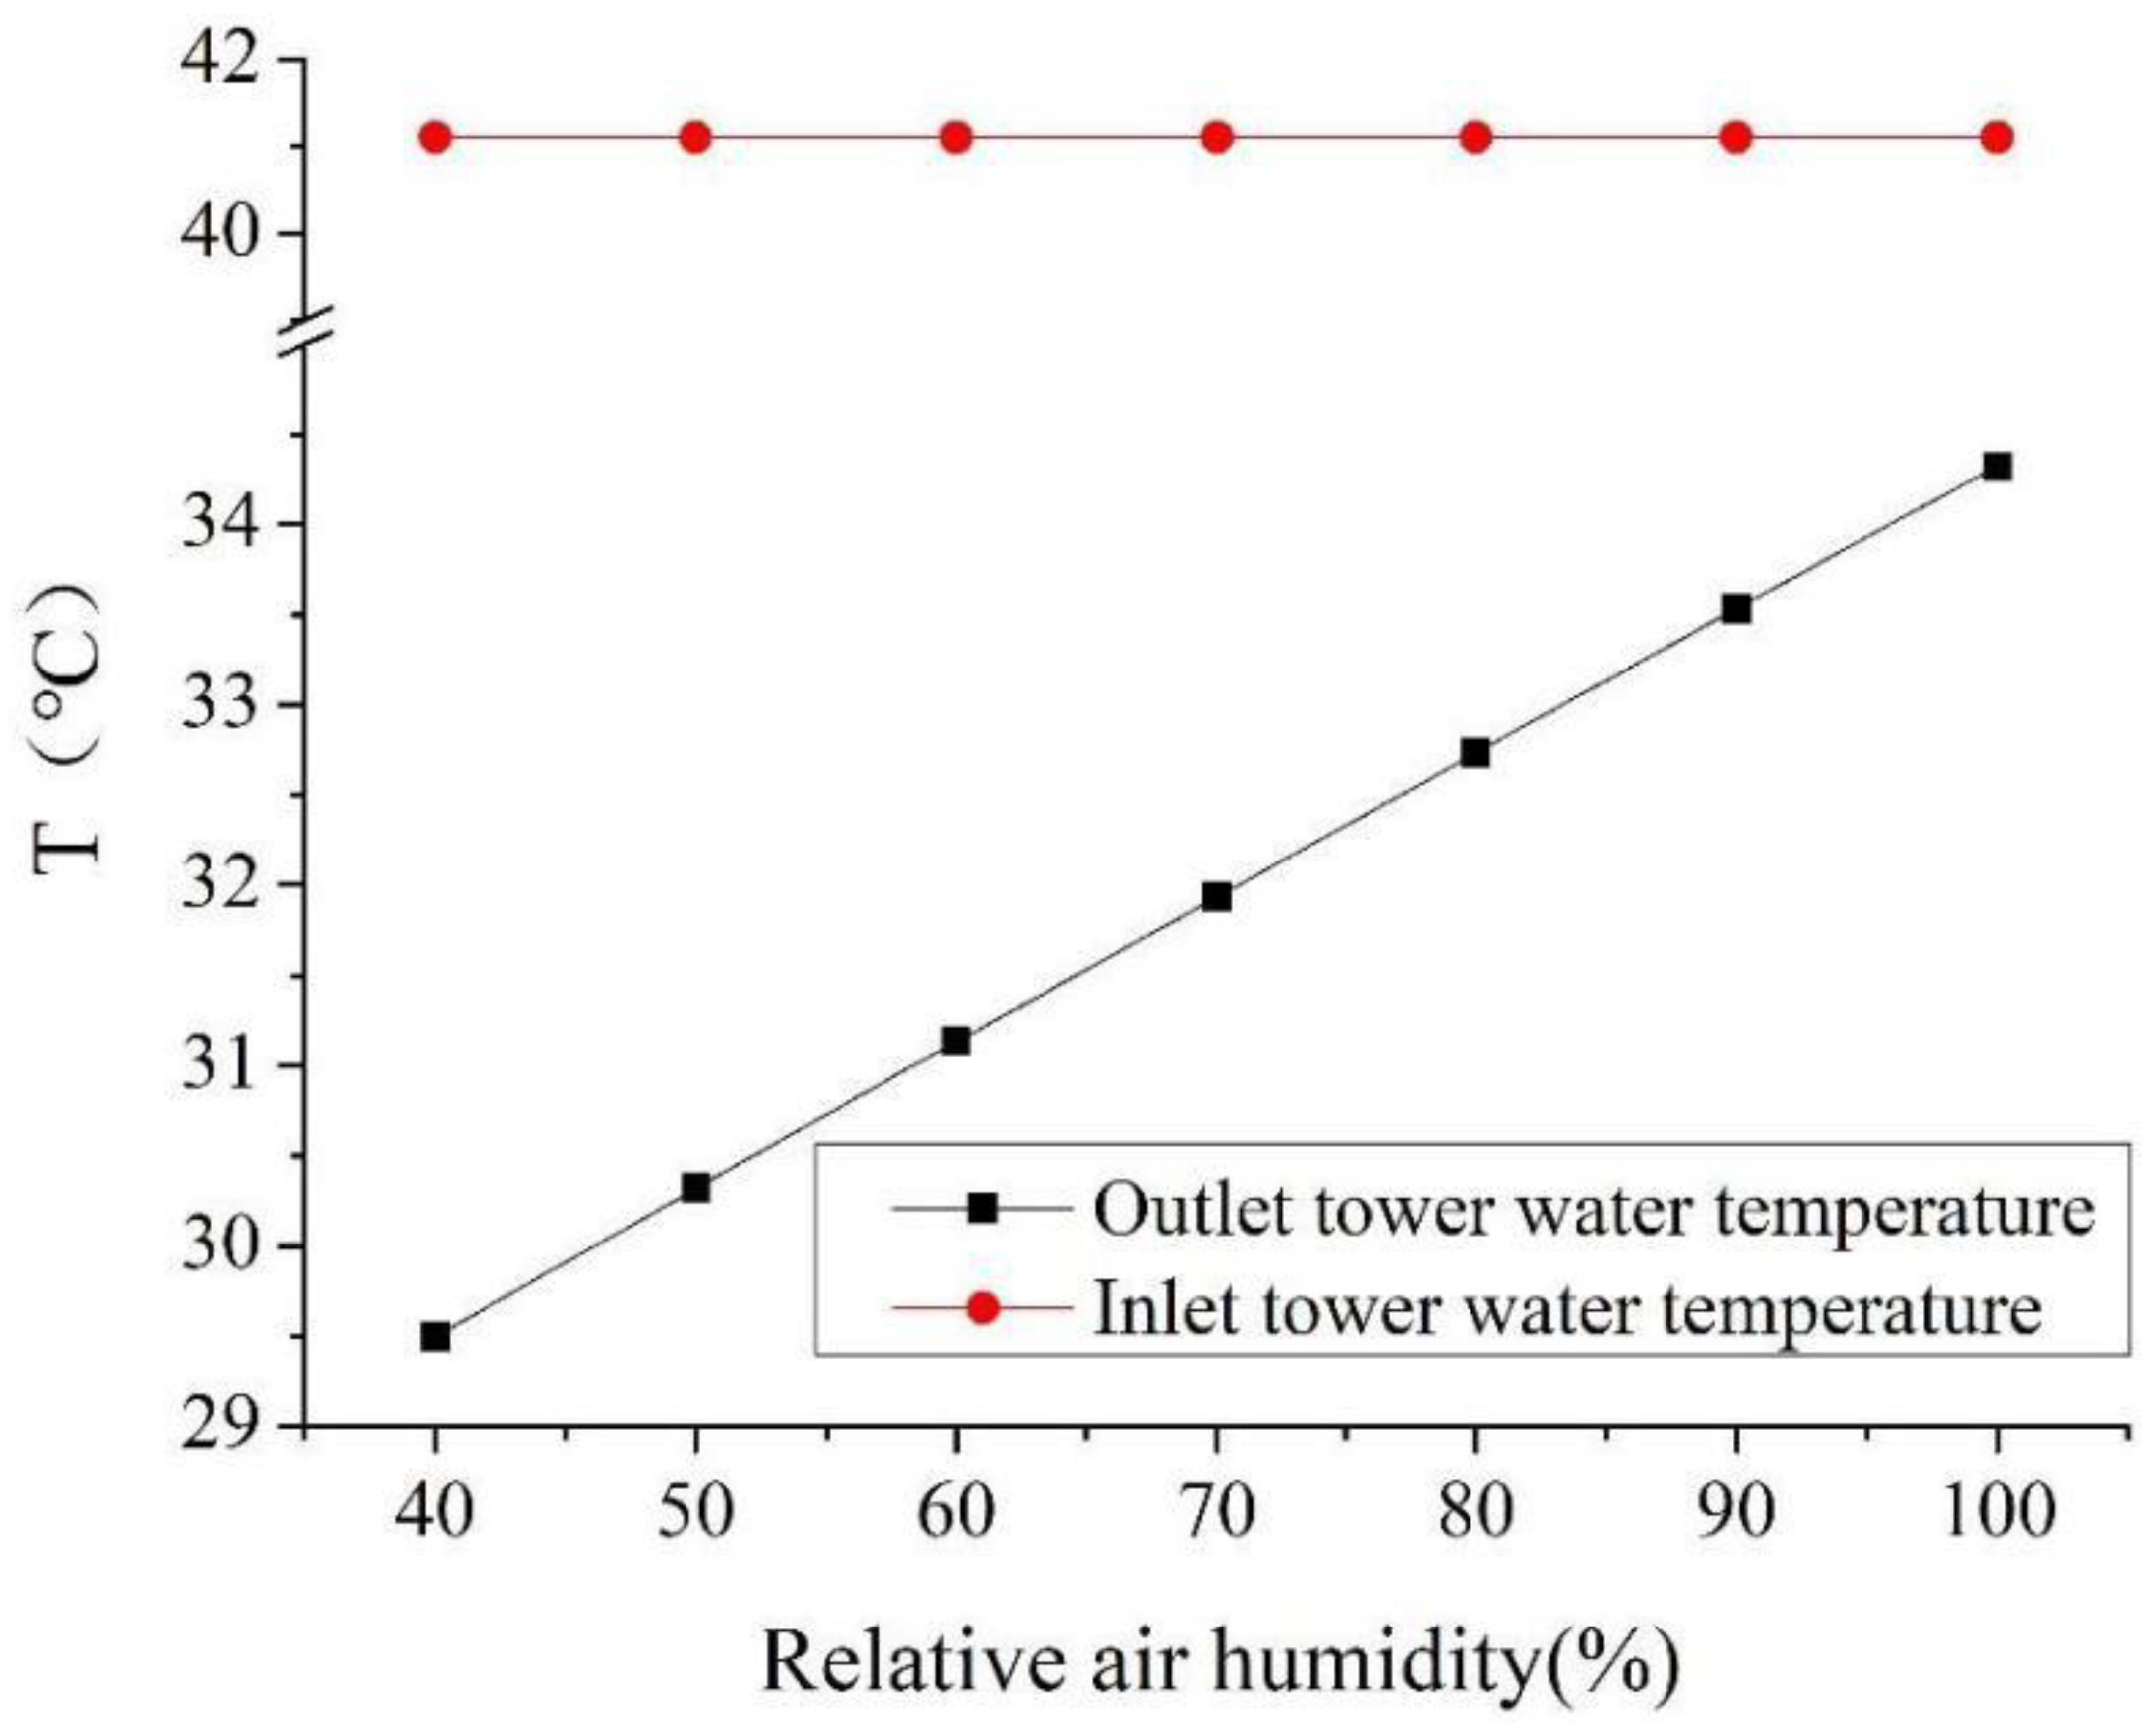
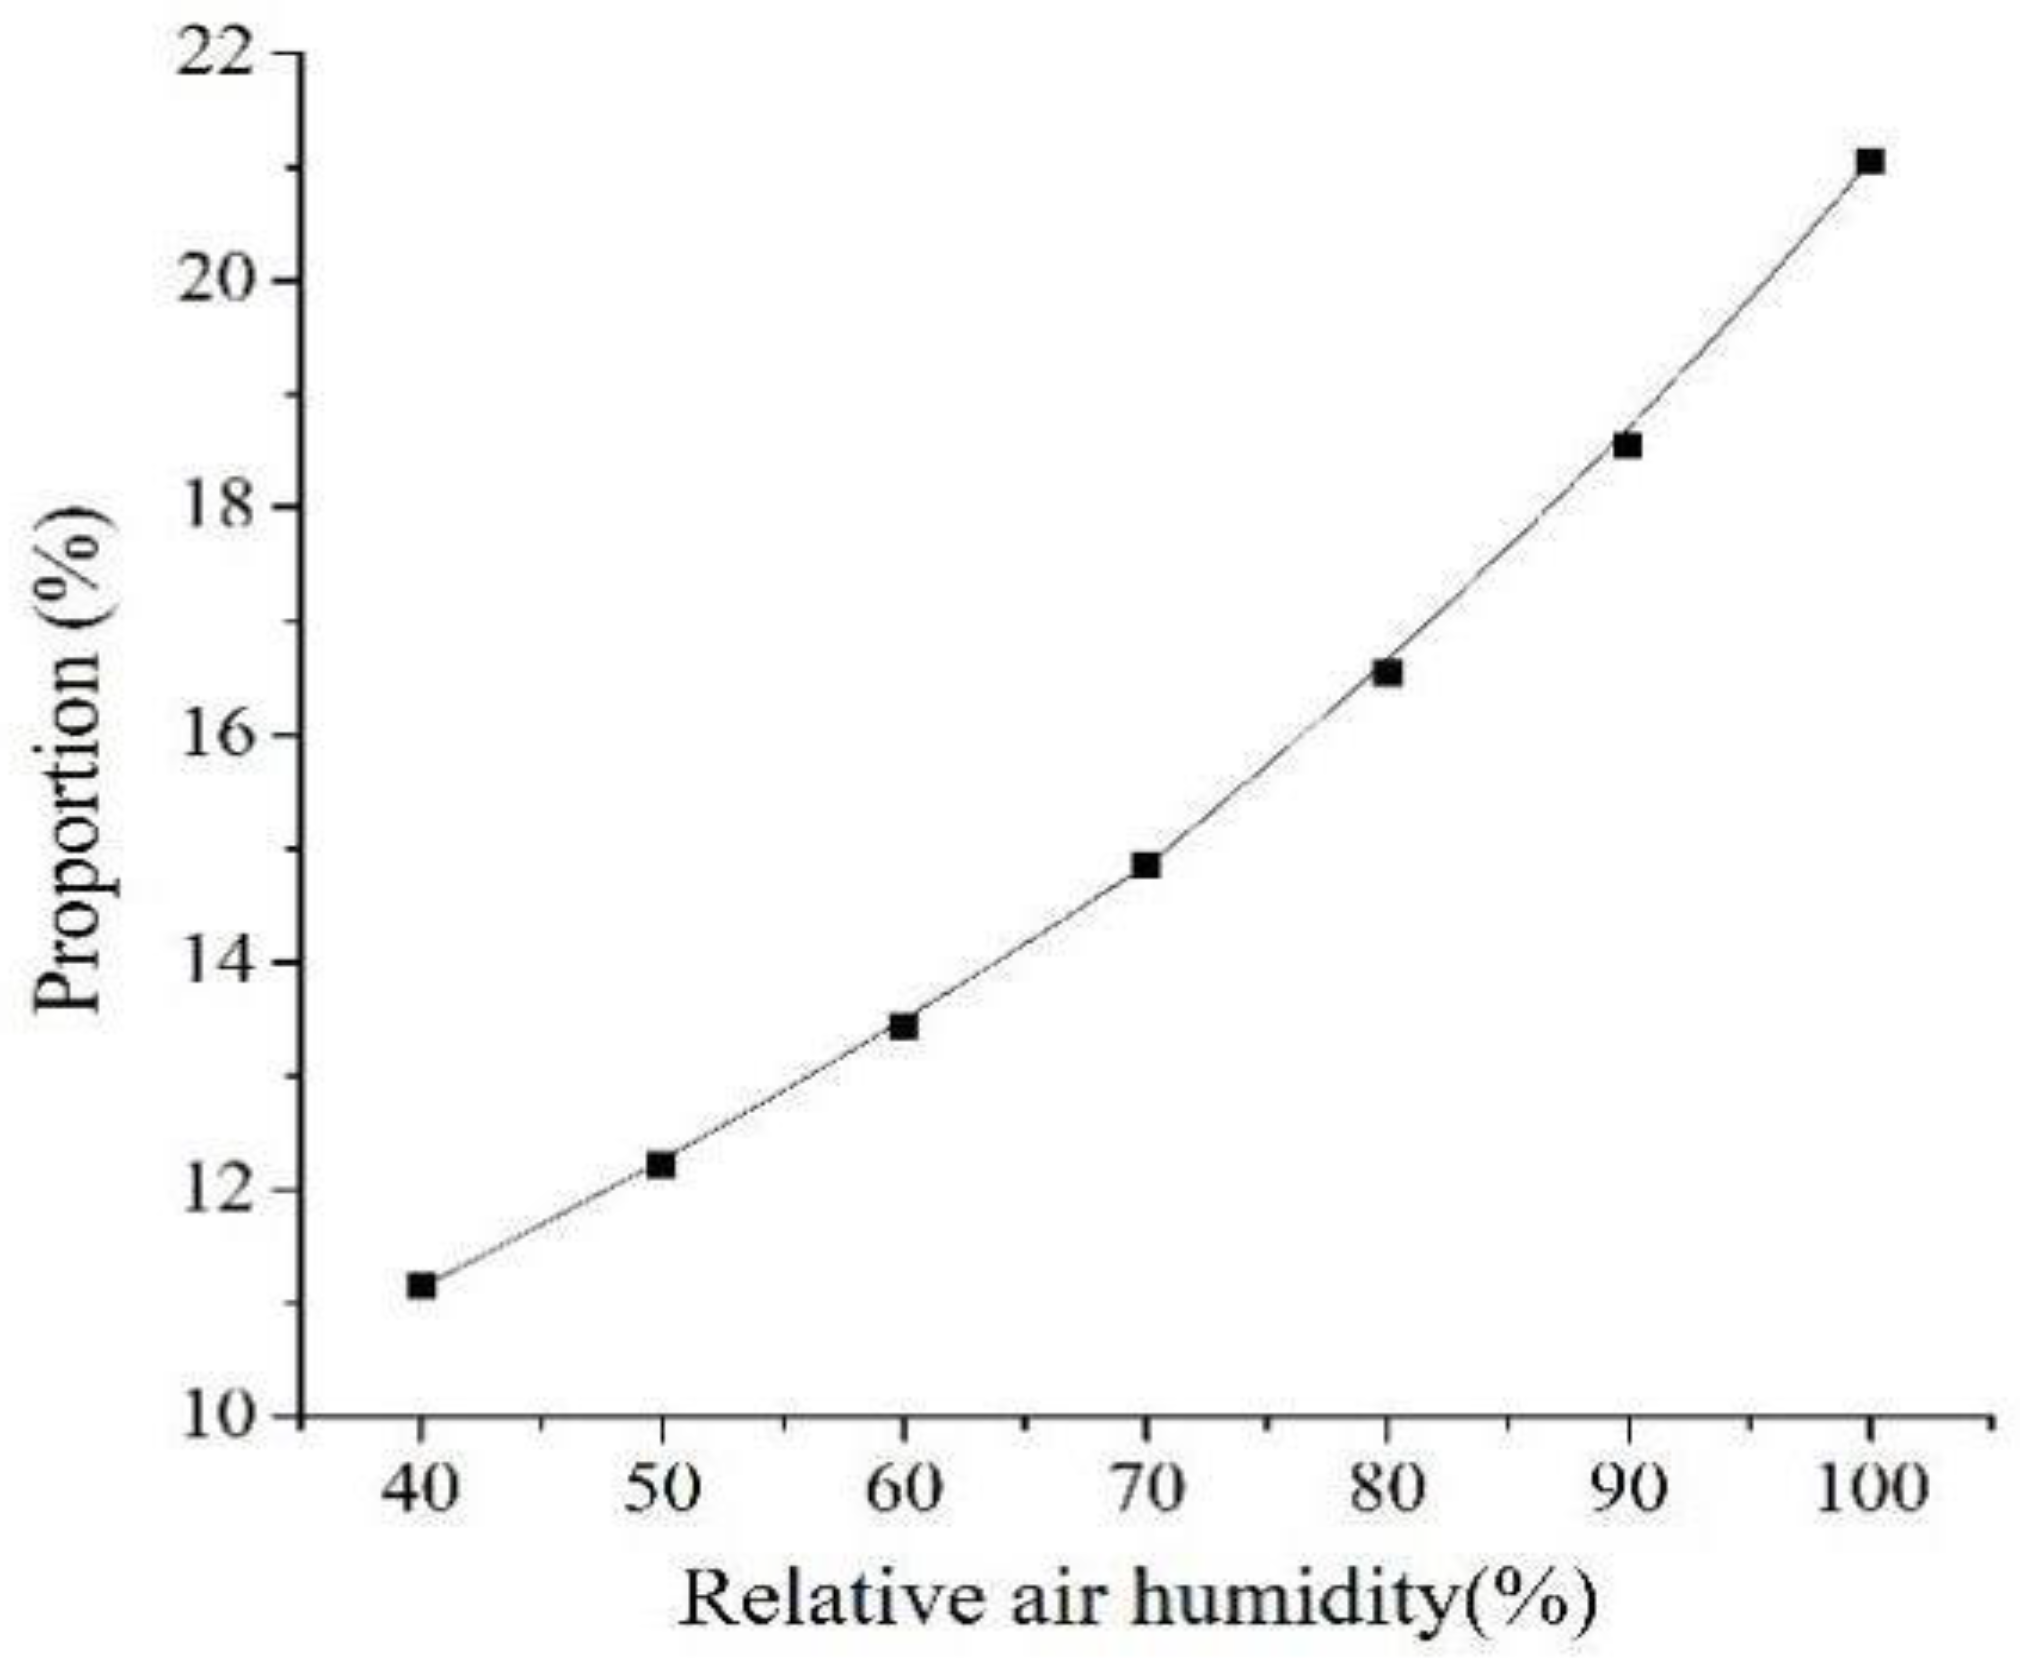
4.1. Relative Air Humidity

Compared to the reference working condition, only the relative air humidity changed. Figure 7 showed the relationship between outlet water temperature and relative air humidity, which showed that with the increase of the relative air humidity, the outlet water temperature increased. When relative air humidity increased by 1%, the outlet water temperature rose by about 0.08 °C. The main reason was that the driving force of evaporation heat dissipation was the difference between the moisture content of the saturated air layer on the surface of the circulating water and the air moisture content. Hence, when the relative air humidity became larger, the mass transfer decreased. The driving force for the contact heat dissipation was the temperature difference between air and circulating water. Although the relative air humidity increased, the air-dry bulb temperature unchanged. At this time, the contact heat dissipation in the cooling tower remained unchanged. The evaporation heat dissipation in the cooling tower was weakened and the contact heat dissipation remains unchanged, so outlet water temperature of the tower would increase. Later, when the outlet water temperature increased, the temperature between the circulating water temperature and the air temperature became larger, and the contact heat dissipation increased. The increase in contact heat transfer was less than the decrease in evaporation heat transfer.
Figure 8 showed the relationship between evaporation loss and relative air humidity. Notably, with the increase of the relative air humidity, the evaporation loss decreased significantly. When relative air humidity increased by 1%, the evaporation loss decrease by about 5.63 t/h. The trend of evaporation loss with environmental humidity was also compared with Xia’s [10] research results. Xia used the Merkel method, the Poppe approach and empirical equation to numerically analyse the effect the relative air humidity on the evaporation loss for NDWCT, as shown in Figure 9. Since the structural parameters, environmental parameters and operating parameters of the selected cooling tower were not the same as those of Xia, here only qualitative analysis and comparison were made on Figure 8 and Figure 9. When the methods of Merkel method and empirical equation were used, the evaporation loss decreased with the relative air humidity increasing. When the Poppe approach was used, the evaporation loss remained stable as the relative air humidity increased. Poppe approach believed that the air could reach supersaturation, which meant that when the air had reached saturation, it could still continue to contain water. However, the outlet air of the cooling tower can generally only reach saturation or near saturation. Therefore, Poppe approach was not suitable for analysis of evaporation loss with different humidity. According to Xia’s conclusion, the evaporation loss was more than the actual value by using empirical equation, while the evaporation loss was lower than the actual value by using Merkel method. In this study, the trend of evaporation loss with different humidity was similar to that when Xia used Merkel method and empirical equation. However, in this study, taking into account the influence of evaporation loss, Merkel method was modified so that the evaporation loss agreed with the test value, which was explained in the model verification. Both qualitative and quantitative analysis could be done on the research of cooling tower evaporation loss by using this modified Merkel method.
With the increase of relative air humidity, the evaporation heat dissipation driven by the difference in moisture content of air decreased. The air-dry bulb temperature did not change with the increase of relative air humidity. The driving force of contact heat dissipation almost unchanged. At this time, with relative air humidity increasing, contact heat dissipation basically unchanged. Later, when the outlet water temperature increased, the contact heat dissipation increased, and the total heat dissipation decreased. Thus, the proportion of the contact heat dissipation to the total heat dissipation increased, as shown in Figure 10. To comprehensively evaluate evaporation loss in the NDWCT, the relative variation of evaporation loss should also be considered. In this study, a parameter Ke, the physical significance of which was the ratio of evaporation loss to total circulating water at per 1 °C temperature drop, was defined as an index to evaluate the relative variation of evaporation loss. Ke decreased with the increase of relative air humidity, as shown in Figure 11.

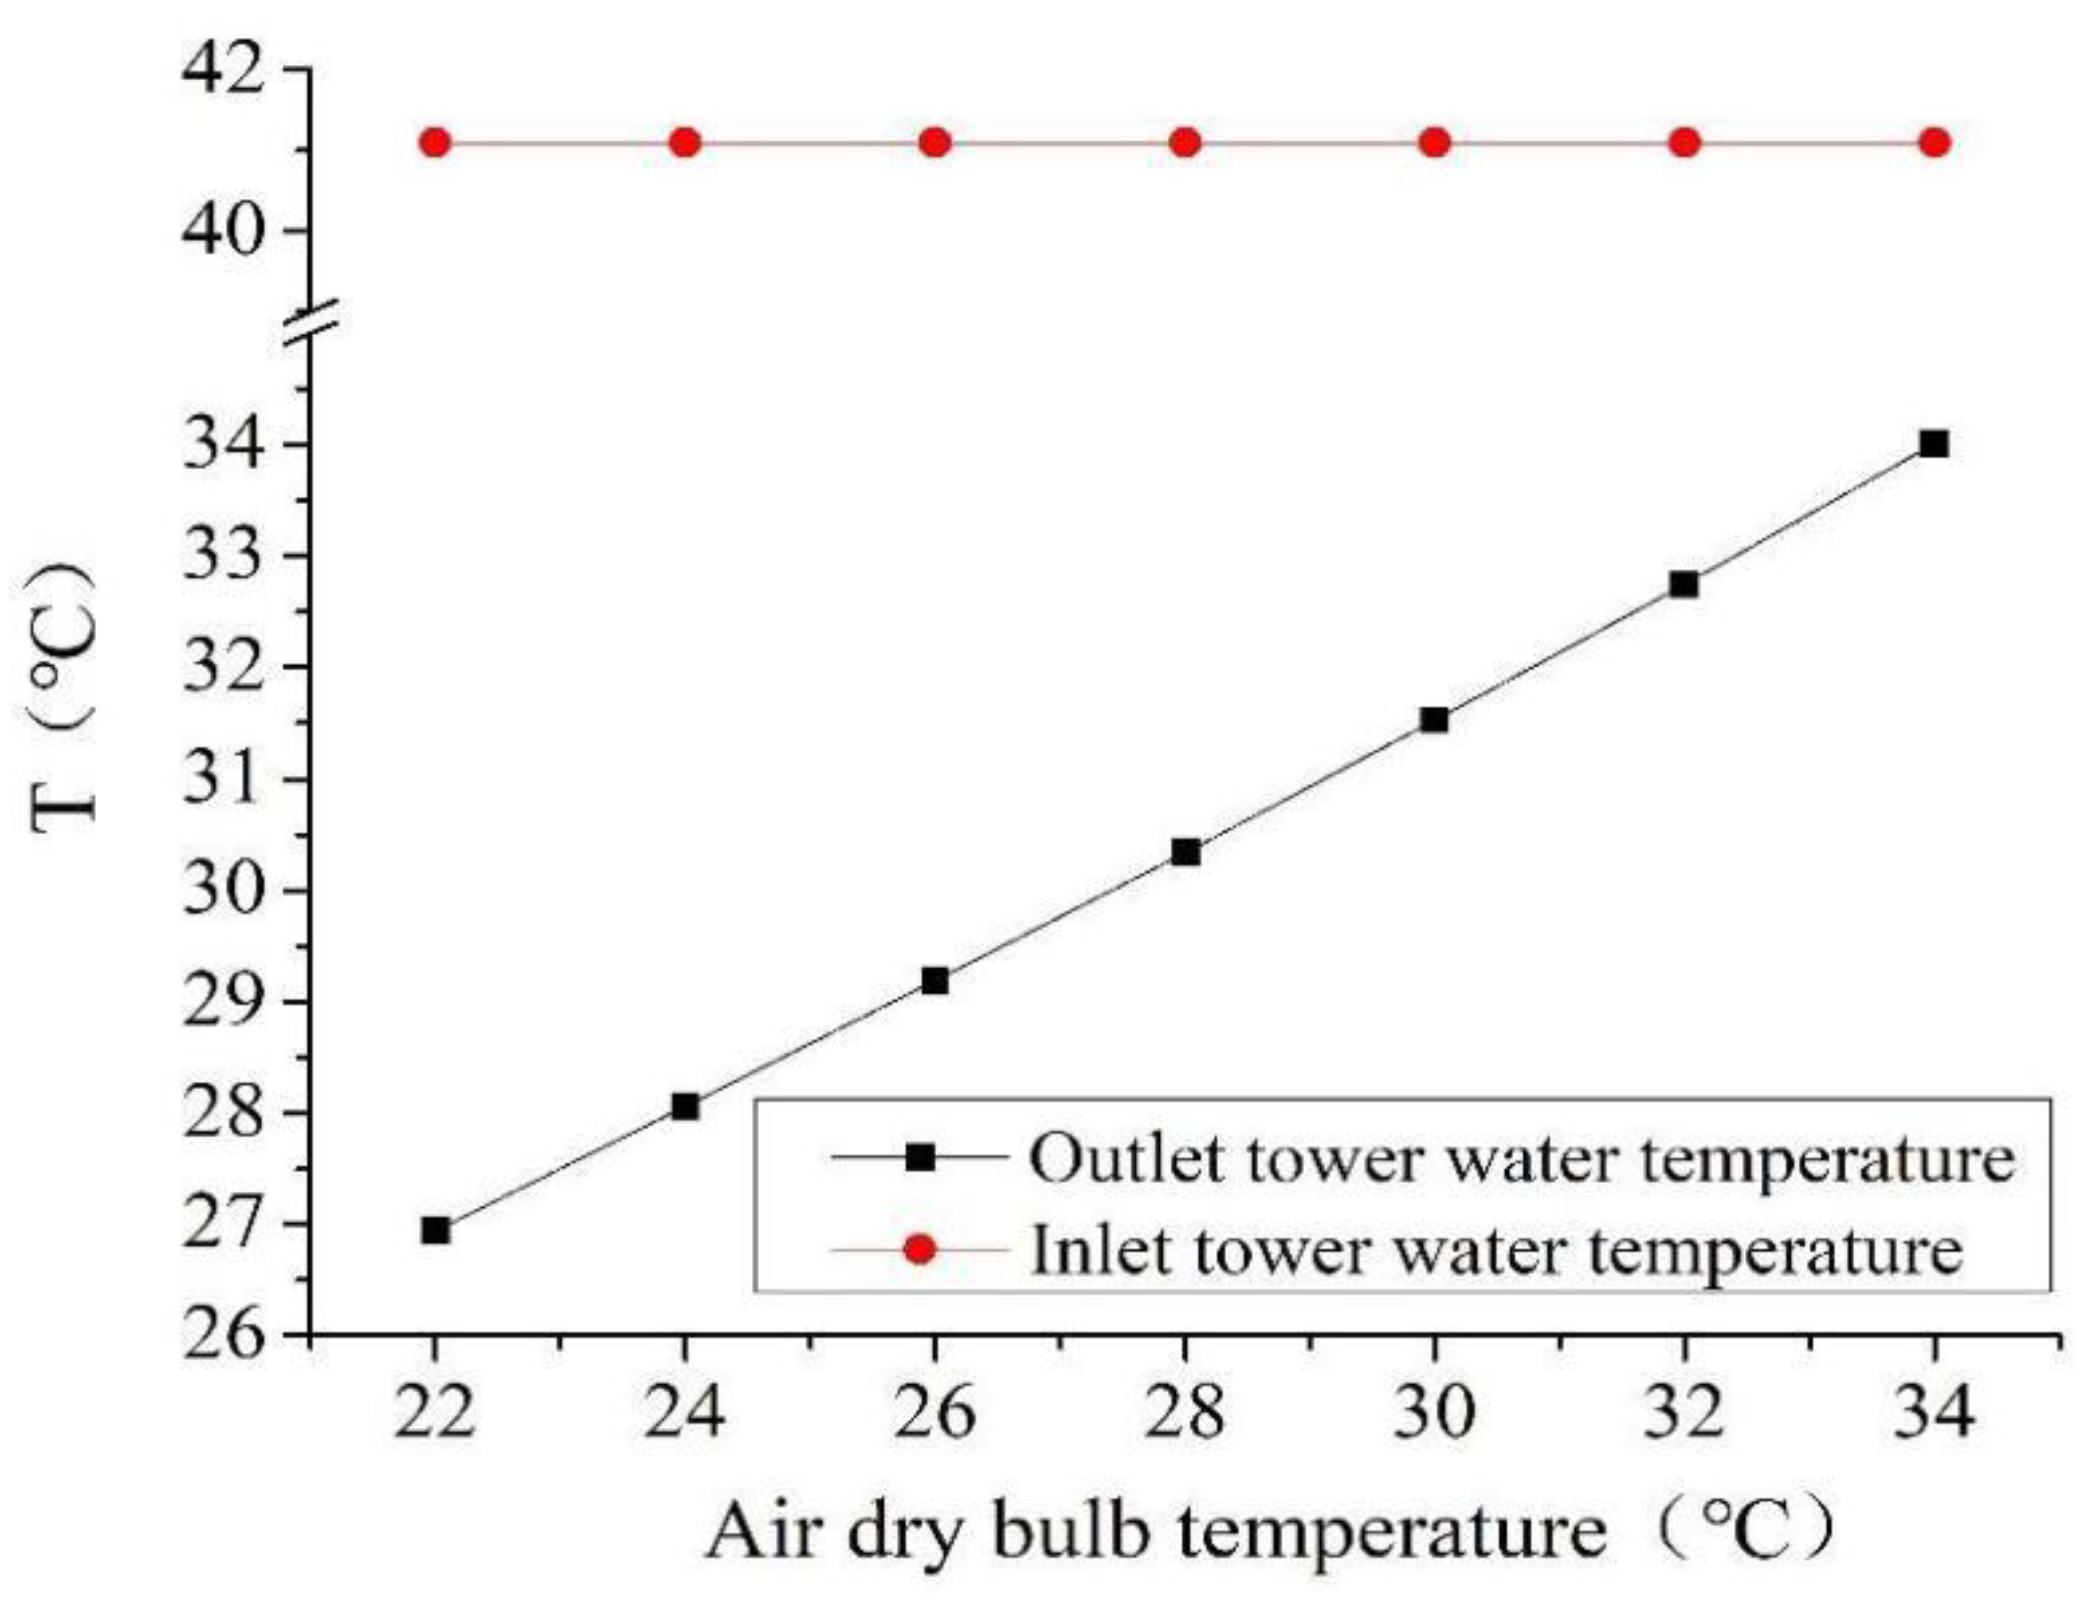
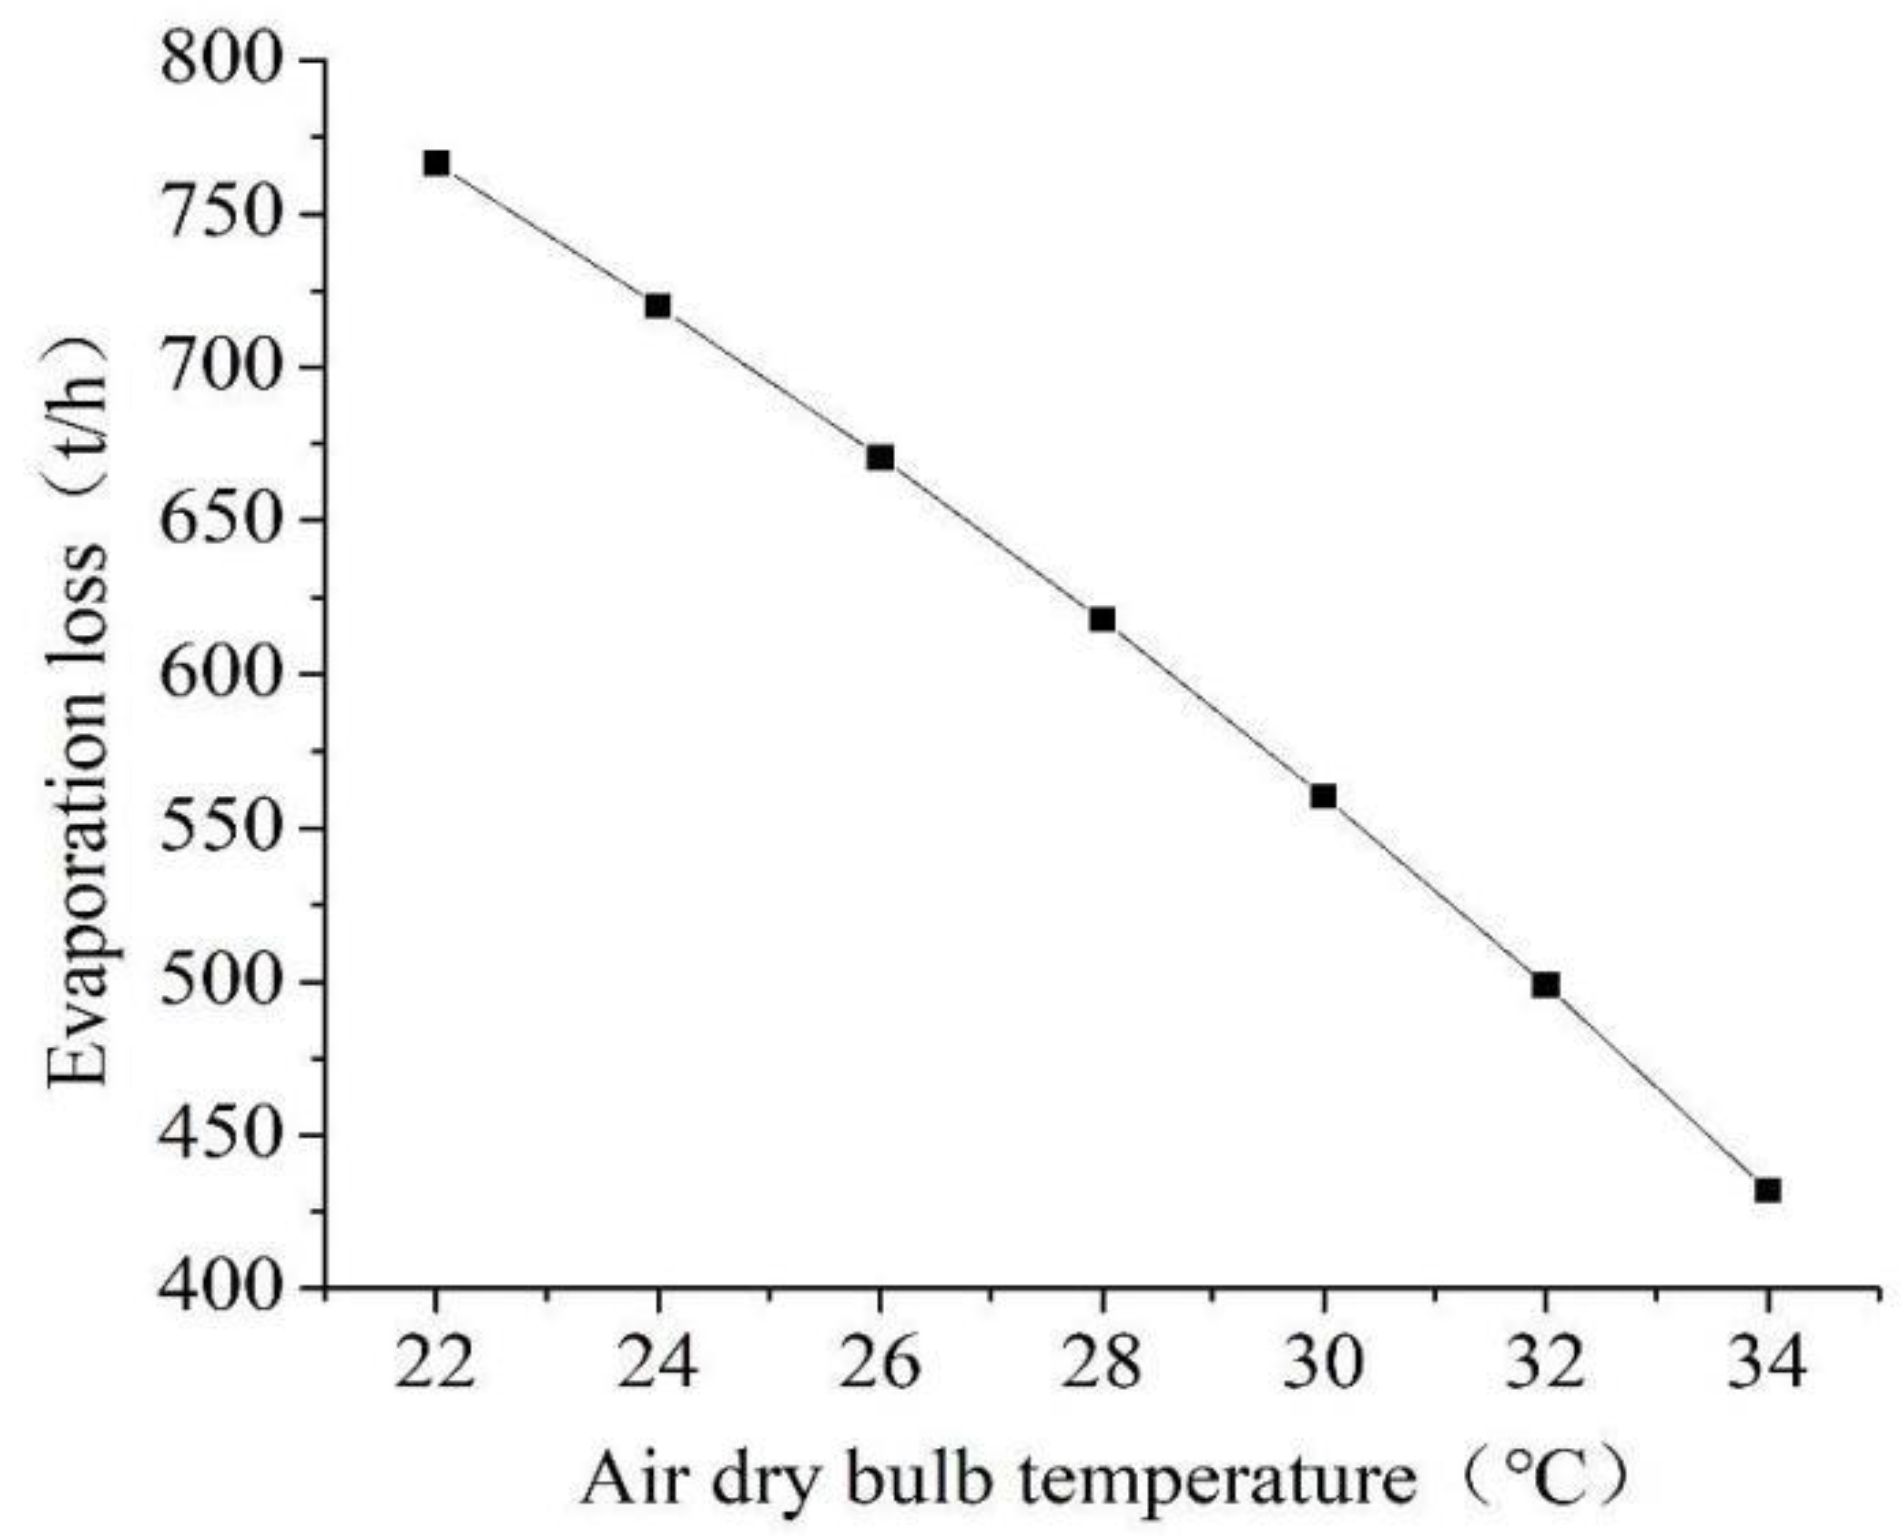
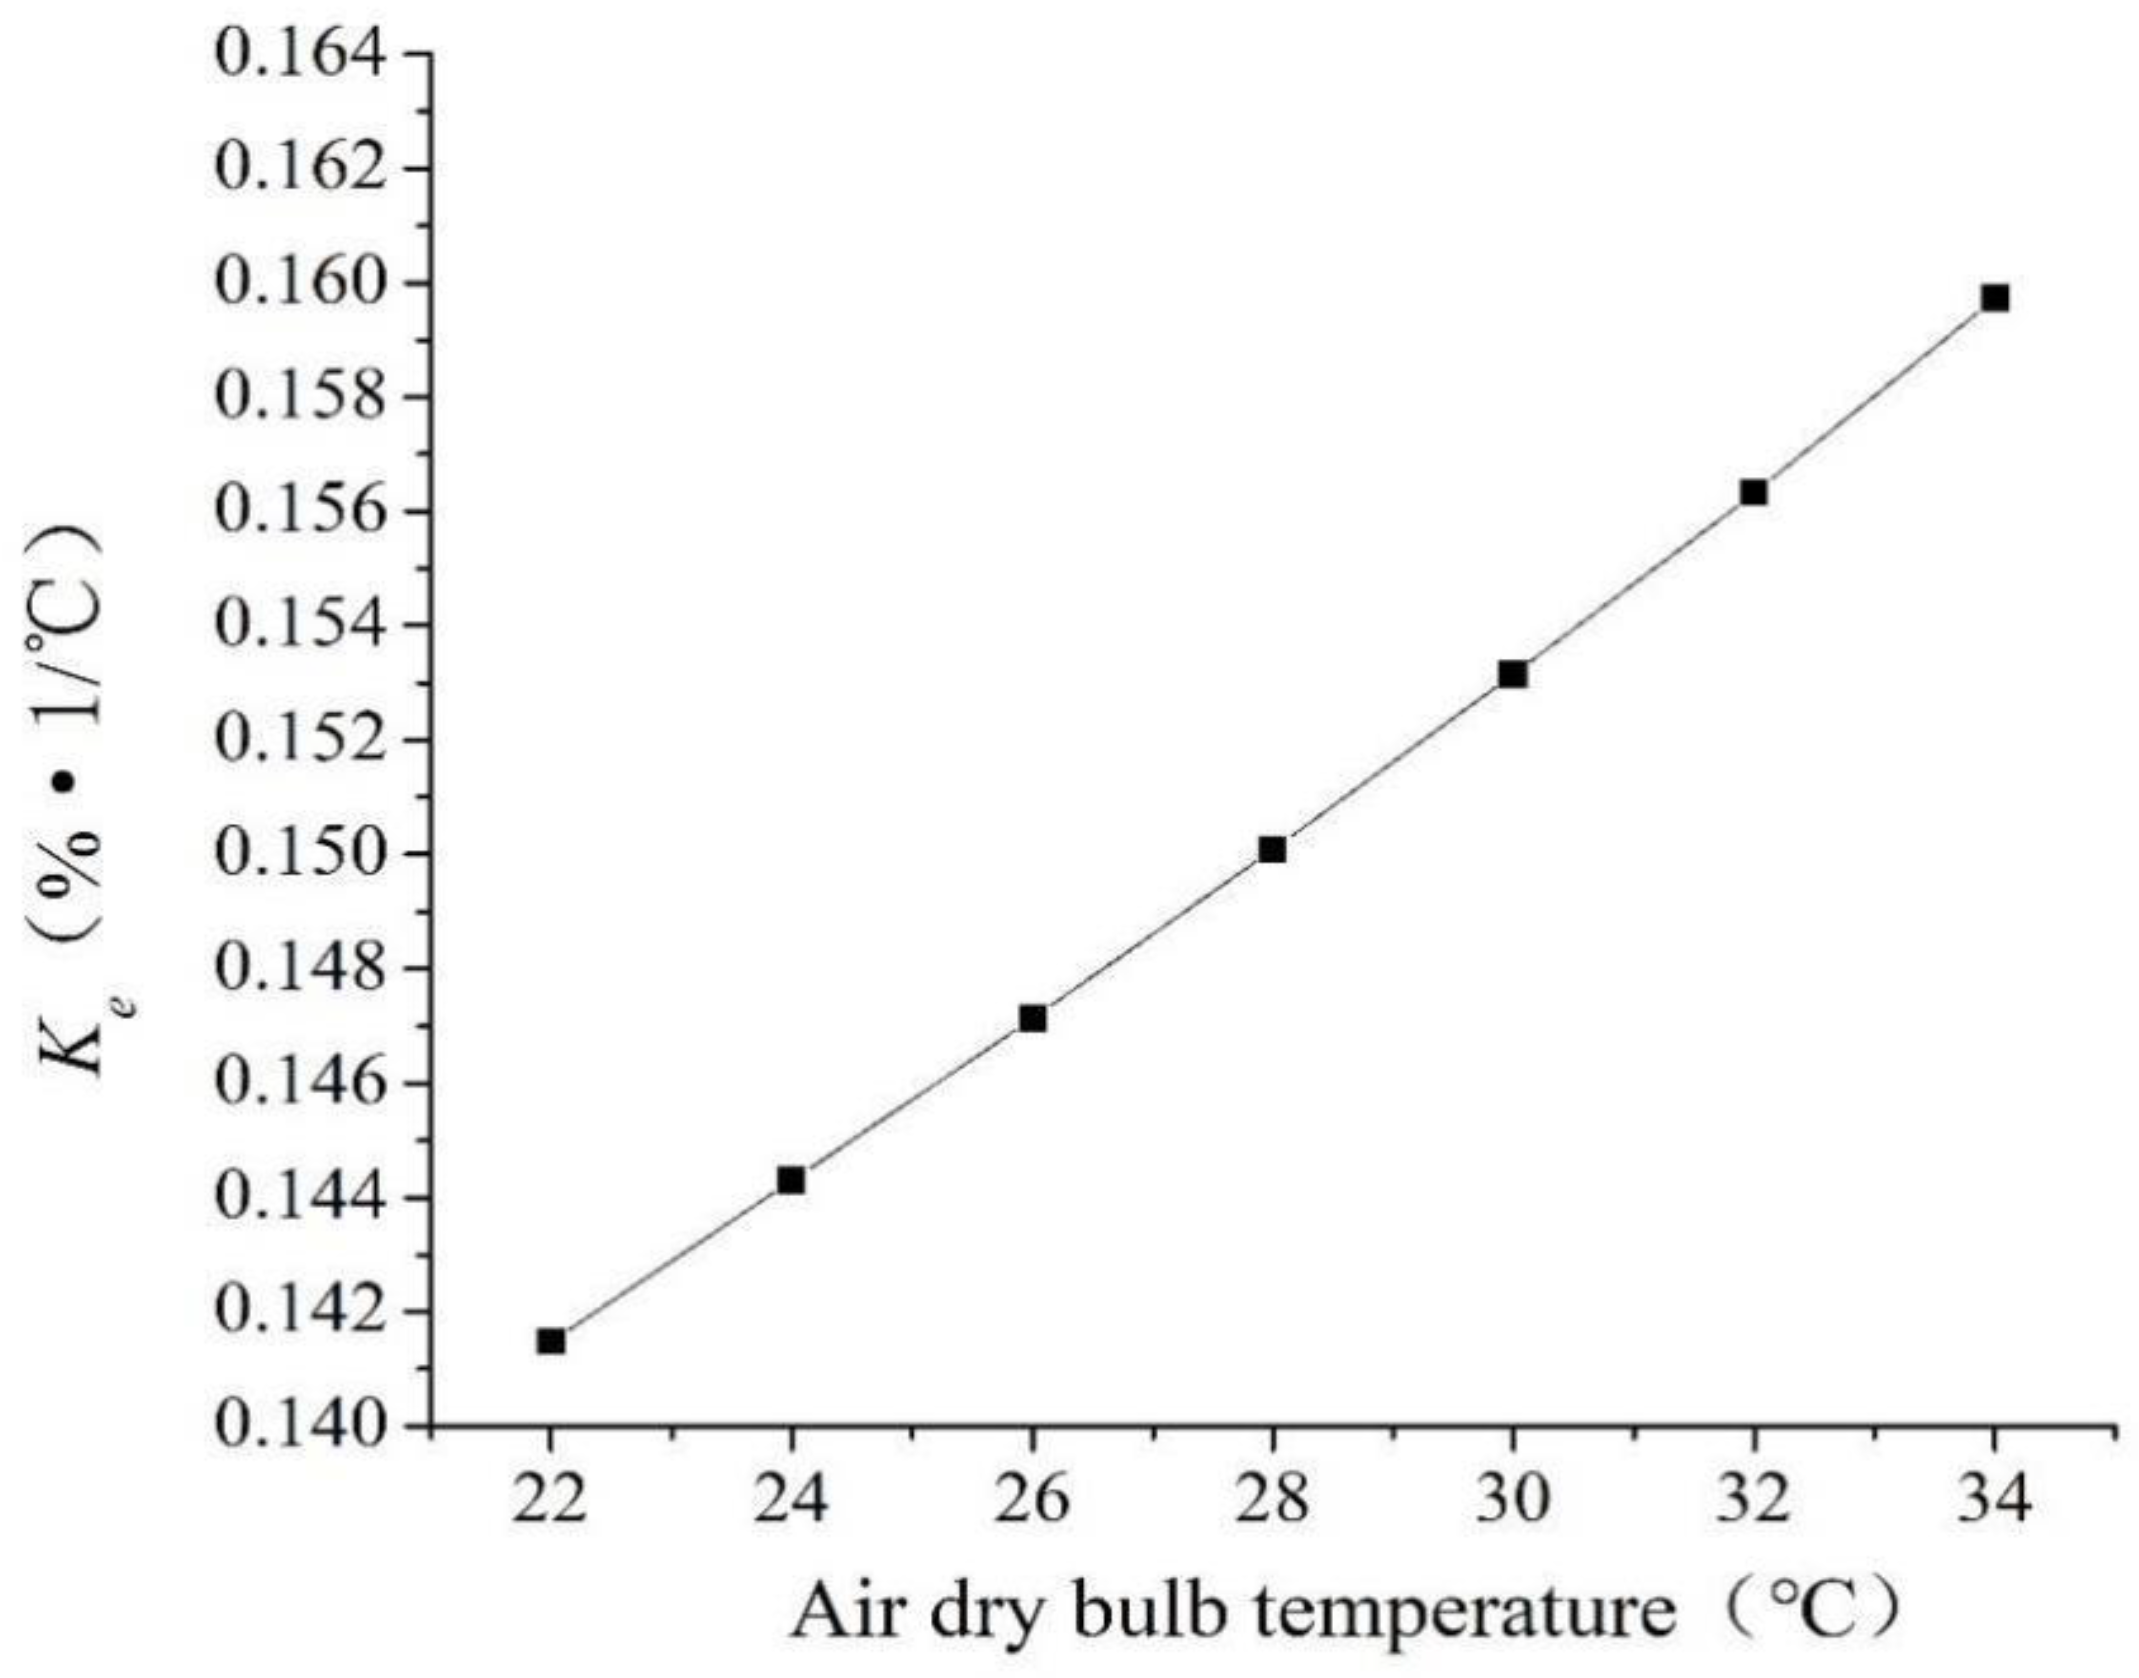
4.2. Air-Dry Bulb Temperature

Compared with the reference working condition, only the air-dry bulb temperature changed and other parameters remained unchanged. When the low-temperature air passed through high-temperature circulating water, heat was transferred from the higher temperature side to the lower temperature side. The driving force for heat transfer was the temperature difference between air and circulating water. When the air-dry bulb temperature increased, the temperature difference between the air and the circulating water decreased, and the heat transfer decreased. The surface of the circulating water formed a thin layer of saturated air whose temperature was the same as that of the circulating water. The speed of mass transfer depended on the difference between the moisture content in the saturated air layer and the moisture content in the air. When the air temperature increased, the moisture content in the air also increased, which caused the difference between the saturated air layer on the surface of the circulating water and the moisture content in the air to decrease, so the mass transfer also decreased. Hence, with the increase of air-dry bulb temperature, the heat and mass transfer performance of the NDWCT deteriorated, which led to a gradual increase in the outlet water temperature, as shown in Figure 12. When the air-dry bulb temperature gradually increased, the evaporation loss decreased significantly, as shown in Figure 13. When air dry bulb temperature increased by 1 °C, the outlet tower water temperature increased by about 0.59 °C and the evaporation loss dropped by nearly 26.65 t/h.
With the increase air-dry bulb temperature, the temperature difference between circulating water and air decreased gradually. Thus, the driving force of contact heat dissipation decreased, and contact heat dissipation in the NDWCT decreased. In addition, with the air-dry bulb temperature increasing, the relative air humidity remained unchanged and the moisture content of inlet tower air increased, which weaken the driving impetus of evaporative heat dissipation. With air-dry bulb temperature increasing, the contact heat dissipation and evaporation heat dissipation capacity of the NDWCT were both weakened. However, the increase of air-dry bulb temperature had a greater impact on the contact heat dissipation capacity driven by temperature difference. Figure 14 showed that the proportion of contact heat dissipation to total heat dissipation was decreased with the increase of air-dry bulb temperature. Figure 15 showed the relationship between Ke and air-dry bulb temperature. The temperature drop of circulating water in the NDWCT was mainly achieved by the evaporation heat dissipation. When the inlet tower water temperature, the mass flow rate, and the relative humidity were kept unchanged, Ke increased with the rise of air-dry bulb temperature as shown in Figure 15.

5. Conclusions

In this study, the mathematical model for calculating the evaporation loss in the NDWCT was established. Taking NDWCTs in the representative 300 MW and 600 MW power plant as the research objects, the accuracy of the mathematical model was verified. The calculated results were quite in agreement with experimental values. The effect of air parameters on evaporation loss was emphatically studied.
With the air-dry bulb temperature increasing, the heat and mass transfer performance of the NDWCT deteriorates, the evaporation heat dissipation and the evaporation loss decreases. Reduction of the proportion of contact heat dissipation in total heat dissipation occurs, while the rate of evaporation loss caused by unit temperature difference increases. When air dry bulb temperature increased by 1 °C, the outlet tower water temperature increased by about 0.59 °C, and the evaporation loss dropped by nearly 26.65 t/h.
As the relative air humidity increases, the evaporation heat dissipation and the evaporation loss in NDWCT decreases. However, the ratio of the contact heat dissipation to the total heat dissipation increases, and the rate of evaporation loss caused by unit temperature difference decreases. When relative air humidity increased by 1%, the outlet water temperature rose by about 0.08 °C, and the evaporation loss decreased by about 5.63 t/h.

Author Contributions

Conceptualization, W.Y. and F.S.; data curation, F.S.; investigation, W.Y.; methodology, W.Y. and R.L.; validation, F.S., R.L., and X.C.; writing—original draft, W.Y.; writing—review & editing, Y.L. All authors have read and agreed to the published version of the manuscript.

Funding

This research received no external funding.

Conflicts of Interest

The authors declare no conflict of interest.

Nomenclature

Atfill surface area of the NDWCT (m2)
Avsurface area per unit volume of fill (m2/m3)
Asthe area of cross section of fill (m2)
cpspecific heat at constant pressure (J/kg°C)
C, nconstants
ggravitational acceleration (m/s2)
hdmass-transfer coefficient (kg/m2s)
Hinlettower inlet height (m)
Htthe tower height (m)
Hpumping force of NDWCT (Pa)
imaswthe enthalpy of the saturated air layer on the water surface when water temperature is Tw (J/kg)
imathe enthalpy of the moist air when air temperature is Ta (J/kg)
jthe coordinates of the laps where the measuring point is located
Kethe ratio of evaporation loss to total circulating water at per 1 °C temperature drop (%·1/°C)
kheat coefficient
mmass flow rate (kg/s)
mevapevaporation loss (t/h)
mamass flow rate of air (kg/s)
mwmass flow rate of circulating water (kg/s)
MeMerkel number
NDWCTnatural draft counter-flow wet cooling tower
Qcconduction heat dissipation in NDWCT (W)
Qeevaporation heat dissipation in NDWCT (W)
rjthe radius of the measuring point in the lap j (m)
Rthe radius of collecting basin (m)
Twwater temperature (°C)
Tw1inlet water temperature of the finite volume(°C)
Tw2outlet water temperature of the finite volume(°C)
Twiinlet water temperature of NDWCT(°C)
Twooutlet water temperature of NDWCT (°C)
Taair temperature (°C)
Taiinlet air temperature of NDWCT(°C)
Taooutlet air temperature of NDWCT(°C)
vamthe average airflow velocity in packing section (m/s)
zheight of the finite volume
Zresistance of the NDWCT (Pa)

Greek Letters

ξtotal drag coefficient of tower
ρaitower inlet air density (kg/m3)
ρaotower outlet air density (kg/m3)
whumidity ratio of air (kg/kg)
εthe ratio of evaporation heat dissipation to total heat disspation
λair-water ratio
γTw2the latent heat of vaporization at the temperature of Tw2 (kJ/kg)

Subscripts

aair
cconduction
eevaporation
iinlet
Mmodification
mmean, or mass transfer
ooutlet
ssaturation
ttower
wwater

References

  1. Feeley, T.J., III; Skone, T.J.; Stiegel, G.J.; McNemar, A.; Nemeth, M.; Schimmoller, B.; Murphy, J.T.; Manfredo, L. Water: A critical resource in the thermoelectric power industry. Energy 2008, 33, 1–11. [Google Scholar] [CrossRef]
  2. Cutillas, C.G.; Ramírez, J.R.; Lucas, M. Optimum Design and Operation of an HVAC Cooling Tower for Energy and Water Conservation. Energies 2017, 10, 299. [Google Scholar] [CrossRef] [Green Version]
  3. Macknick, J.; Newmark, R.L.; Heath, G.; Hallett, K.C. Operational water consumption and withdrawal factors for electricity generating technologies: A review of existing literature. Environ. Res. Lett. 2012, 7, 045802. [Google Scholar] [CrossRef]
  4. Owen, M.T.F.; Kröger, D.G. An Investigation of Air-Cooled Steam Condenser Performance Under Windy Conditions Using Computational Fluid Dynamics. J. Eng. Gas Turbines Power 2011, 133, 064502. [Google Scholar] [CrossRef]
  5. Yang, L.J.; Du, X.Z.; Yang, Y.P. Influences of wind-break wall configurations upon flow and heat transfer characteristics of air-cooled condensers in a power plant. Int. J. Therm. Sci. 2011, 50, 2050–2061. [Google Scholar] [CrossRef]
  6. Zhang, L.; Zhang, L.; Zhang, Q.; Jiang, K.; Tie, Y.; Wang, S. Effects of the Second-Stage of Rotor with Single Abnormal Blade Angle on Rotating Stall of a Two-Stage Variable Pitch Axial Fan. Energies 2018, 11, 3293. [Google Scholar] [CrossRef] [Green Version]
  7. Zhang, L.; He, R.; Wang, X.; Zhang, Q.; Wang, S. Study on static and dynamic characteristics of an axial fan with abnormal blade under rotating stall conditions. Energy 2019, 170, 305–325. [Google Scholar] [CrossRef]
  8. Meyer, C.J.; Kroger, D.G. Numerical investigation of the effect of fan performance on forced draught air-cooled heat exchanger plenum chamber aerodynamic behaviour. Appl. Therm. Eng. 2004, 24, 359–371. [Google Scholar] [CrossRef]
  9. Kairouani, L.; Hassairi, M.; Tarek, Z. Performance of cooling tower in south of Tunisia. Build. Environ. 2004, 39, 351–355. [Google Scholar] [CrossRef]
  10. Xia, L.; Li, J.; Ma, W.; Gurgenci, H.; Guan, Z.; Wang, P. Water Consumption Comparison Between a Natural Draft Wet Cooling Tower and a Natural Draft Hybrid Cooling Tower—An Annual Simulation for Luoyang Conditions. Heat Transf. Eng. 2017, 38, 1034–1043. [Google Scholar] [CrossRef]
  11. Facao, J.; Oliveira, A.C. Heat and Mass Transfer in an Indirect Contact Cooling Tower: CFD Simulation and Experiment. Numer. Heat Transf. Part A Appl. 2008, 54, 933–944. [Google Scholar] [CrossRef]
  12. Qureshi, B.A.; Zubair, S.M. Prediction of Evaporation Losses in Wet Cooling Towers. Heat Transf. Eng. 2006, 27, 86–92. [Google Scholar] [CrossRef]
  13. Qureshi, B.A.; Zubair, S.M. Prediction of evaporation losses in evaporative fluid coolers. Appl. Therm. Eng. 2007, 27, 520–527. [Google Scholar] [CrossRef]
  14. Hajidavalloo, E.; Shakeri, R.; Mehrabian, M.A. Thermal performance of cross flow cooling towers in variable wet bulb temperature. Energy Convers. Manag. 2010, 51, 1298–1303. [Google Scholar] [CrossRef]
  15. Rubio-Castro, E.; Serna-González, M.; Ponce-Ortega, J.M.; Morales-Cabrera, M.A. Optimization of mechanical draft counter flow wet-cooling towers using a rigorous model. Appl. Therm. Eng. 2011, 31, 3615–3628. [Google Scholar] [CrossRef]
  16. Rao, R.V.; More, K.C. Optimal design and analysis of mechanical draft cooling tower using improved Jaya algorithm. Int. J. Refrig. 2017, 82, 312–324. [Google Scholar] [CrossRef]
  17. Naik, B.K.; Muthukumar, P. A novel approach for performance assessment of mechanical draft wet cooling towers. Appl. Therm. Eng. 2017, 121, 14–26. [Google Scholar] [CrossRef]
  18. Mansour, M.K.; Hassab, M.A. Innovative correlation for calculating thermal performance of counterflow wet-cooling tower. Energy 2014, 74, 855–862. [Google Scholar] [CrossRef]
  19. Picardo, J.R.; Variyar, J.E. The Merkel equation revisited: A novel method to compute the packed height of a cooling tower. Energy Convers. Manag. 2012, 57, 167–172. [Google Scholar] [CrossRef]
  20. Fisenko, S.P.; Brin, A.A.; Petruchik, A.I. Evaporative cooling of water in a mechanical draft cooling tower. Int. J. Heat Mass Transf. 2004, 47, 165–177. [Google Scholar] [CrossRef]
  21. Chen, C.J.; Wang, R.Z.; Xia, Z.Z.; Kiplagat, J.K. Study on a silica gel–water adsorption chiller integrated with a closed wet cooling tower. Int. J. Therm. Sci. 2010, 49, 611–620. [Google Scholar] [CrossRef]
  22. Gao, M.; Zou, J.; He, S.; Sun, F. Thermal performance analysis for high level water collecting wet cooling tower under crosswind conditions. Appl. Therm. Eng. 2018, 136, 568–575. [Google Scholar] [CrossRef]
  23. Zhao, Z. Cooling Tower; Chinese Water Conservancy and Electric Power Publisher: Beijing, China, 2001. [Google Scholar]
Figure 1. Heat and mass transfer in a finite volume of the cooling tower.
Energies 13 06174 g001
Figure 2. The flowchart of the evaporation loss in NDWCT.
Energies 13 06174 g002
Figure 3. Schematic diagram of NDWCT and the location of monitoring points.
Energies 13 06174 g003
Figure 4. Sectional view of collecting basin mearing point.
Energies 13 06174 g004
Figure 5. Schematic diagram of experimental data acquisition.
Energies 13 06174 g005
Figure 6. Calculated and experimental values of outlet water temperature at five working conditions.
Energies 13 06174 g006
Figure 7. Outlet tower water temperature and relative air humidity.
Energies 13 06174 g007
Figure 8. Evaporation loss at vary relative air humidity.
Energies 13 06174 g008
Figure 9. Variation in evaporation loss calculated by Xia [10].
Energies 13 06174 g009
Figure 10. Relationship between the proportion of contact heat dissipation to total heat dissipation and relative air humidity.
Energies 13 06174 g010
Figure 11. Relationship between Ke and relative air humidity.
Energies 13 06174 g011
Figure 12. Outlet water temperature with different air-dry bulb temperature.
Energies 13 06174 g012
Figure 13. Evaporation loss at vary air dry bulb temperature.
Energies 13 06174 g013
Figure 14. Relationship between the proportion of contact heat dissipation to total heat dissipation and air-dry bulb temperature.
Energies 13 06174 g014
Figure 15. Relationship between Ke and air-dry bulb temperature.
Energies 13 06174 g015
Table 1. The values of C and n.
Capacity300 MW600 MW
C1.692.19
n0.540.65
Table 2. Geometric dimensions of the NDWCT.
Capacity300 MW600 MW
Geometric dimensionsTower height (m)123.4150.6
Air inlets’ height (m)8.39.8
Distance between spray zone and tower outlet (m)113.5137.6
Air inlet diameter (m)84.7115.7
Outlet diameter (m)52.572.0
Area of fill zone (m2)55009000
Filler characteristicsFitting formula of fillers M e M = 1.69 λ 0.54 M e M = 2.19 λ 0.65
Table 3. Testing instruments.
ItemTesting InstrumentAccuracy
Atmospheric pressureSmall-type meterological station±1.5%
Inlet dry and wet bulb temperatureSmall-type meterological station±0.1 °C
Inlet and outlet tower water temperaturePlatinum resistance thermometer±0.1 °C
Mass flow rate of circulating waterFLEXIM ultrasonic flowmeter±0.5%
Table 4. Five different working conditions of 300 MW NDWCT.
Working ConditionsMeteorological ParametersMass Flow Rate of Circulating Water
(t/h)
Inlet Tower Water Temperature
(°C)
Atmospheric Pressure
(kPa)
Dry Bulb Temperature
(°C)
Wet Bulb Temperature
(°C)
199.626.519.93828638.2
2100.131.126.43828641.4
3100.826.721.02274641.7
4100.130.926.63828641.1
5100.428.623.63828638.8
Table 5. Five different working conditions of 600 MW NDWCT.
Working ConditionMeteorological ParametersMass Flow Rate of Circulating Water
(t/h)
Inlet Tower Water Temperature
(°C)
Atmospheric Pressure
(kPa)
Dry Bulb Temperature
(°C)
Wet Bulb Temperature
(°C)
1100.431.9827.907427241.34
2101.127.5225.407427238.06
3101.128.1625.407427238.49
4101.127.5924.217427237.02
5101.128.3223.677427238.36
Publisher’s Note: MDPI stays neutral with regard to jurisdictional claims in published maps and institutional affiliations.

