Article

A Novel Equivalent Continuum Approach for Modelling Hydraulic Fractures

1
Department of Civil Engineering, University of Calgary, Calgary, AB T2N 1N4, Canada
2
Department of Geoscience, University of Calgary, Calgary, AB T2N 1N4, Canada
*
Author to whom correspondence should be addressed.
Energies 2020, 13(23), 6187; https://doi.org/10.3390/en13236187
Submission received: 30 October 2020 / Revised: 19 November 2020 / Accepted: 23 November 2020 / Published: 25 November 2020
(This article belongs to the Special Issue Development of Unconventional Reservoirs 2020)

Abstract

:
Hydraulic fracturing has transitioned into widespread use over the last few decades. There are a variety of numerical methods available to simulate hydraulic fracturing. However, most current methods require a large number of input parameters, of which the values of some parameters are poorly constrained. This paper proposes a new method of modelling the hydraulically fractured region using void-ratio dependent relation to define the permeability of the fractured region. This approach is computationally efficient and reduces the number of input parameters. By implementing this method with an equivalent continuum representation, uncertainties are reduced arising from heterogeneity and anisotropy of earth materials. The computational efficiency improves modelling performance in stress sensitive zones such as in the vicinity of the injection well or near faults.

1. Introduction

Hydraulic fracturing is a fluid injection process intended to create fractures in order to increase formation permeability [1]. This process is applicable in both vertical and horizontal wells, but is now performed mainly in extended horizontal wells [2] to allows multiple hydraulically fractured zones to be completed in a single well [3]. Each hydraulically fractured zone is then referred to as a stage, and a single extended horizontal well may have more than 20 stages. Geomechanical analysis is crucial in the pre-assessment of the geological formation to ensure the safety and effectiveness of the practice [4]. Moreover, considering the high cost of drilling and completion programs, modelling is a key assessment tool for hydraulic fracturing. There are a multitude of techniques and methods available for the modelling of hydraulic fracturing [5,6,7,8,9,10,11].
Analytical approaches are common for modelling hydraulic fractures. These methods are primarily based on the well established Perkins–Kern–Nordgren (PKN) and Khristianovic–Geertsma–de Klerk (KGD) models [12,13,14,15,16,17]. These models remain highly useful for a quick hydraulic fracturing assessment at a site. The PKN model is better suited for cases of fractures with length equal to or greater than twice the fracture height. These conditions are generally applied to hydraulic fracturing in shale reservoirs [18]. The KGD method tends to bea better representative of cases where the fracture length is equal to or less than its height. Such fracture conditions are mainly applicable to brownfields applications where fracturing is used to revive production [19,20].
Based on these analytical solutions, there are numerous numerical methods available for hydraulic fracture modelling. Among the most common numerical modelling techniques are the cohesive zone method (CZM), extended finite element method (XFEM), and discrete element method (DEM) [9,21,22,23,24,25,26]. Hybrid techniques such as the finite element method-discrete element method (FEM-DEM) have also started to emerge. Such techniques attempt to combine the advantages of two methods to improve their performance [27,28].
Another type of modelling approach that has received less attention is a class of methods called equivalent continuum techniques. These methods attempt to represent fractured media through a generalised approach that provides descriptive results for a sufficiently large scale. Previous applications of equivalent continuum approaches have tended to largely focus on relatively shallow depths of analysis [29,30,31,32].

2. Literature Review on Hydraulic Fracturing Modelling Methods

The practice of hydraulic fracturing has resulted in an extensive body of literature focused on modelling techniques. Some of these techniques are briefly described below.

2.1. Analytical Models

Analytical solutions tend to be highly generalised and simplified through a set of assumptions. For example, assumptions that underlie the PKN and KGD models are: Homogeneous, isotropic, and linear elastic rock, laminar flow, no effects of additives such as proppant, and simple fracture geometry. The main distinction between PKN and KGD models is the assumed cross-sectional shape of the hydraulic fracture. In the PKN model, the hydraulic fracture is assumed to have an elliptical cross-section, while the KGD model assumes a rectangular shape. The KGD model can easily be converted to radial coordinates, which is useful to represent penny-shaped cracks. General solutions for pressure, width, and length for PKN, KGD, and penny-shaped hydraulic fracture models are widely known [17,33].
The use of analytical solutions can be extended to the formations with natural fractures using the leak-off coefficient. The introduction of leak-off coefficient to the analytical solutions improves the agreement of planar hydraulic fracture geometry with field data. However, analytical solutions are constrained by the simplified definition of approximate hydraulic fracture geometries. On the other hand, numerical models are capable of simulating complex hydraulic fracture geometries and their effects on host medium.

2.2. Cohesive Zone Method (CZM)

The cohesive zone method utilises cohesive elements within a continuum model to represent fractures in the rock. Cohesive elements use traction-separation relation for mechanical strength weakening [34]. In the cohesive zone, this relationship defines the energy release equation, wherein if a specific threshold strain/stress is reached, then the cohesive element is relaxed and allowed to deform more freely. In addition, the permeability relation for the cohesive zone uses a parallel plate theory, which is an effective representation for fracture permeability. As outlined below, a recent enhancement of the CZM is known as XFEM.

2.3. Extended Finite Element Modelling (XFEM)

Extended finite element modelling (XFEM) uses the same fundamental approach as the cohesive zone method, except that the fractured zone is defined differently. In particular, for the XFEM, heaviside, junction, and branch enrichment functions are introduced into the domain. These functions are used to calculate where the fracture tip will propagate and how the deformation of the fracture will be imposed onto surrounding rock [35].
Both CZM and XFEM attempt to model fractures individually, which complicates the computation process due to the increased number of equations in the model. Additionally, the large dimensional difference between the fractures and general modelling domain imposes challenges for model convergence. Another challenge for XFEM approaches is mesh dependency due to the use of enrichment functions, the dimensions of the element specifying the orientation and displacement of fractures become highly mesh dependent. Although the CZM approach does not suffer from the same degree of mesh dependency, it requires a pre-definition of the fracture geometry, which imposes limitations on how a fracture will propagate.

2.4. Discrete Element Method (DEM)

The discrete element method (DEM) is a modelling approach wherein each mesh element is considered as a separate continuum particle and the intervening space between is treated as fractures [36,37]. These fractures use the same type of physics as in the case of CZM, with respect to strength degradation and fracture initiation. A superiority of the DEM over the CZM is an ability for fractures to propagate in any direction in 3-dimensional space. The convergence rate is improved, compared to XFEM, due to a similar dimensionality of the fractures and continuum elements.
The improvements provided by the DEM approach are based on the treatment of fractures as contact points between the elements. However, this method also has high computational requirements, as it generally requires a large number of model elements in order for the model to be realistic and representative.

2.5. FEM-DEM

FEM-DEM is a hybrid approach that combines the advantages of DEM with finite element modelling (FEM) to reduce the computational load. The DEM component is applied within model micro-scale sections, and the stresses resultant from the DEM are then imposed within the FEM, which models the macro-scale domain [38]. This method is most applicable if the domain can be discretised into high- and low-sensitivity subdomains. It should also be mentioned that FEM-DEM codes are available that combine these two methods for different purposes [27,28].

2.6. Equivalent Continuum Methods (ECM)

Equivalent continuum methods assume that within a representative element volume (REV) the medium can be treated as homogeneous. Instead of defining fractures individually and modelling the strength degradation, this means that the properties of the domain are generalised and modelled as a continuum. The region of interest can then be discretised based on the regions of high and low fracture density, allowing for the modelling of the fractured and virgin zones of the reservoir [18,39]. The use of an ECM representation makes it simpler to apply well established numerical approaches such as the finite element method (FEM) to solve governing equations that describe the physical processes and behaviour of the medium.
Most of previous applications of ECM are focused on soils and near-surface materials [29,30,31,32], rather than for modelling hydraulic fracturing in rocks at a greater depth. This may be due to the general availability of a wide range of empirical methods to define the properties of fractured materials at shallow depths [40,41].
A novel ECM method introduced in this paper attempts to address the necessity of optimised hydraulic fracturing modelling. The introduced method in this paper uses the dependency of the permeability on void ratio to define the hydraulic fracture propagation. This method allows for an easier convergence due to uniform mesh dimensions and the exploitation of an already present coupled fluid flow and continuum relations.

3. Methodology

3.1. Average Volumetric Strain in Fractured Zone

During hydraulic fracturing, it is a common practice to record microseismicity, injection pressure, and rates. These data are then used to analyse the effectiveness of the hydraulic fracturing program. One type of analysis used in this paper is a comparison of estimates of volumetric strains based on microseismicity and injection pressure. In estimating the volumteric strain using the injection pressure, rock is assumed to be cohesion-less and fractures to open when change in injection pressure equals minimum in-situ stress. Thus, the volumetric strain using injection pressure is given by σ m i n / K , where σ m i n is the minimum in-situ effective stress and K denotes bulk modulus of the fractured domain. The volumetric strain using microseismicity is estimated using V i n j / S R V , where V i n j is the injected volume and S R V represents stimulated rock volume (SRV). SRV is defined as a three dimensional rock volume where new fractures and opened natural fractures during hydraulic fracturing are contained [42]. The uniqueness of the strain when fracturing occurs suggests that both of the volumteric strains should exhibit same solution. Thus, this uniqueness allows one to relate the hydraulic fracturing permeability to volumteric strain which then can be related to the void ratio.

3.2. Void Ratio Dependent Permeability

Permeability and porosity of a medium are often closely related. Relationships between these two quantities are widely used in reservoir engineering through semi-log porosity-permeability plots [43]. In our ECM method, a similar approach is used to estimate formation permeability. Unlike conventional porosity-permeability relations, our proposed relation uses a step-like function. This provides a good representation for hydraulic fracturing, due to steep spatial gradients of permeability in the vicinity of a hydraulic fracture [17]. Practicality and robustness of this approach arise from the availability of built-in relationships in ABAQUS FEM between permeability and void ratio [34]. This functionality is described by Equation (1).
η ( e ) = a ( t a n h ( ( e e t h r e s h ) α ) ) α
where η is permeability, a is a maximum permeability, e is the void ratio, e t h r e s h is the minimum void ratio after which fracture permeability starts to dominate, and α is a factor related to rock brittleness and fracture density.
Void ratio is a scalar quantity while permeability is a tensor. Therefore, the anisotropy of permeability, i.e., in which it varies with direction, must be handled through transformation. In our implementation, permeability anisotropy is introduced using a normalisation and denormalisation method proposed by [44]. In this method, first the microseismic data are normalised using the dimensions of the SRV using Equation (2),
X t r a n s = X L s c a l L m a x Y t r a n s = Y L s c a l L m i n Z t r a n s = Z L s c a l L i n t
where X, Y, and Z are coordinates of detected events in the microseismic cloud along the maximum, minimum, and intermediate stress directions, respectively; L m a x , L m i n , and L i n t specify the SRV length parameters along the maximum, minimum, and intermediate stress directions, respectively; L s c a l = L m a x L m i n L i n t 3 , and X t r a n s ; Y t r a n s , and Z t r a n s are transformed coordinates of detected events in microsesimic cloud.
To illustrate this transformation, assume a notional SRV characterised by an elliptical microseismic cloud in a 2D plane. The elliptical shape implies that the resultant fracture propagation rate and formation permeability are both anisotropic. After normalising the microseismic data in this canonical example, the resultant microseismic cloud will be circumscribed by a circular boundary. These steps are graphically depicted in Figure 1. This approach allows for a simplification of the analysis into a more straightforward one-dimensional analysis.
The permeability function that is obtained using the resultant normalised data are denormalised using Equation (3),
k x = ( L m a x L s c a l ) 2 k 0 k y = ( L m i n L s c a l ) 2 k 0 k z = ( L i n t L s c a l ) 2 k 0
where, k 0 is the permeability estimated using one-dimensional analysis and k x , k y , and k z are permeabilities in X, Y, and Z directions, respectively.
To provide a case study of our ECM approach, the proposed relation was applied to the Hoadley field data to demonstrate the applicability of this method using real data.

3.3. Case Study—Hoadley Tight Sand Reservoir

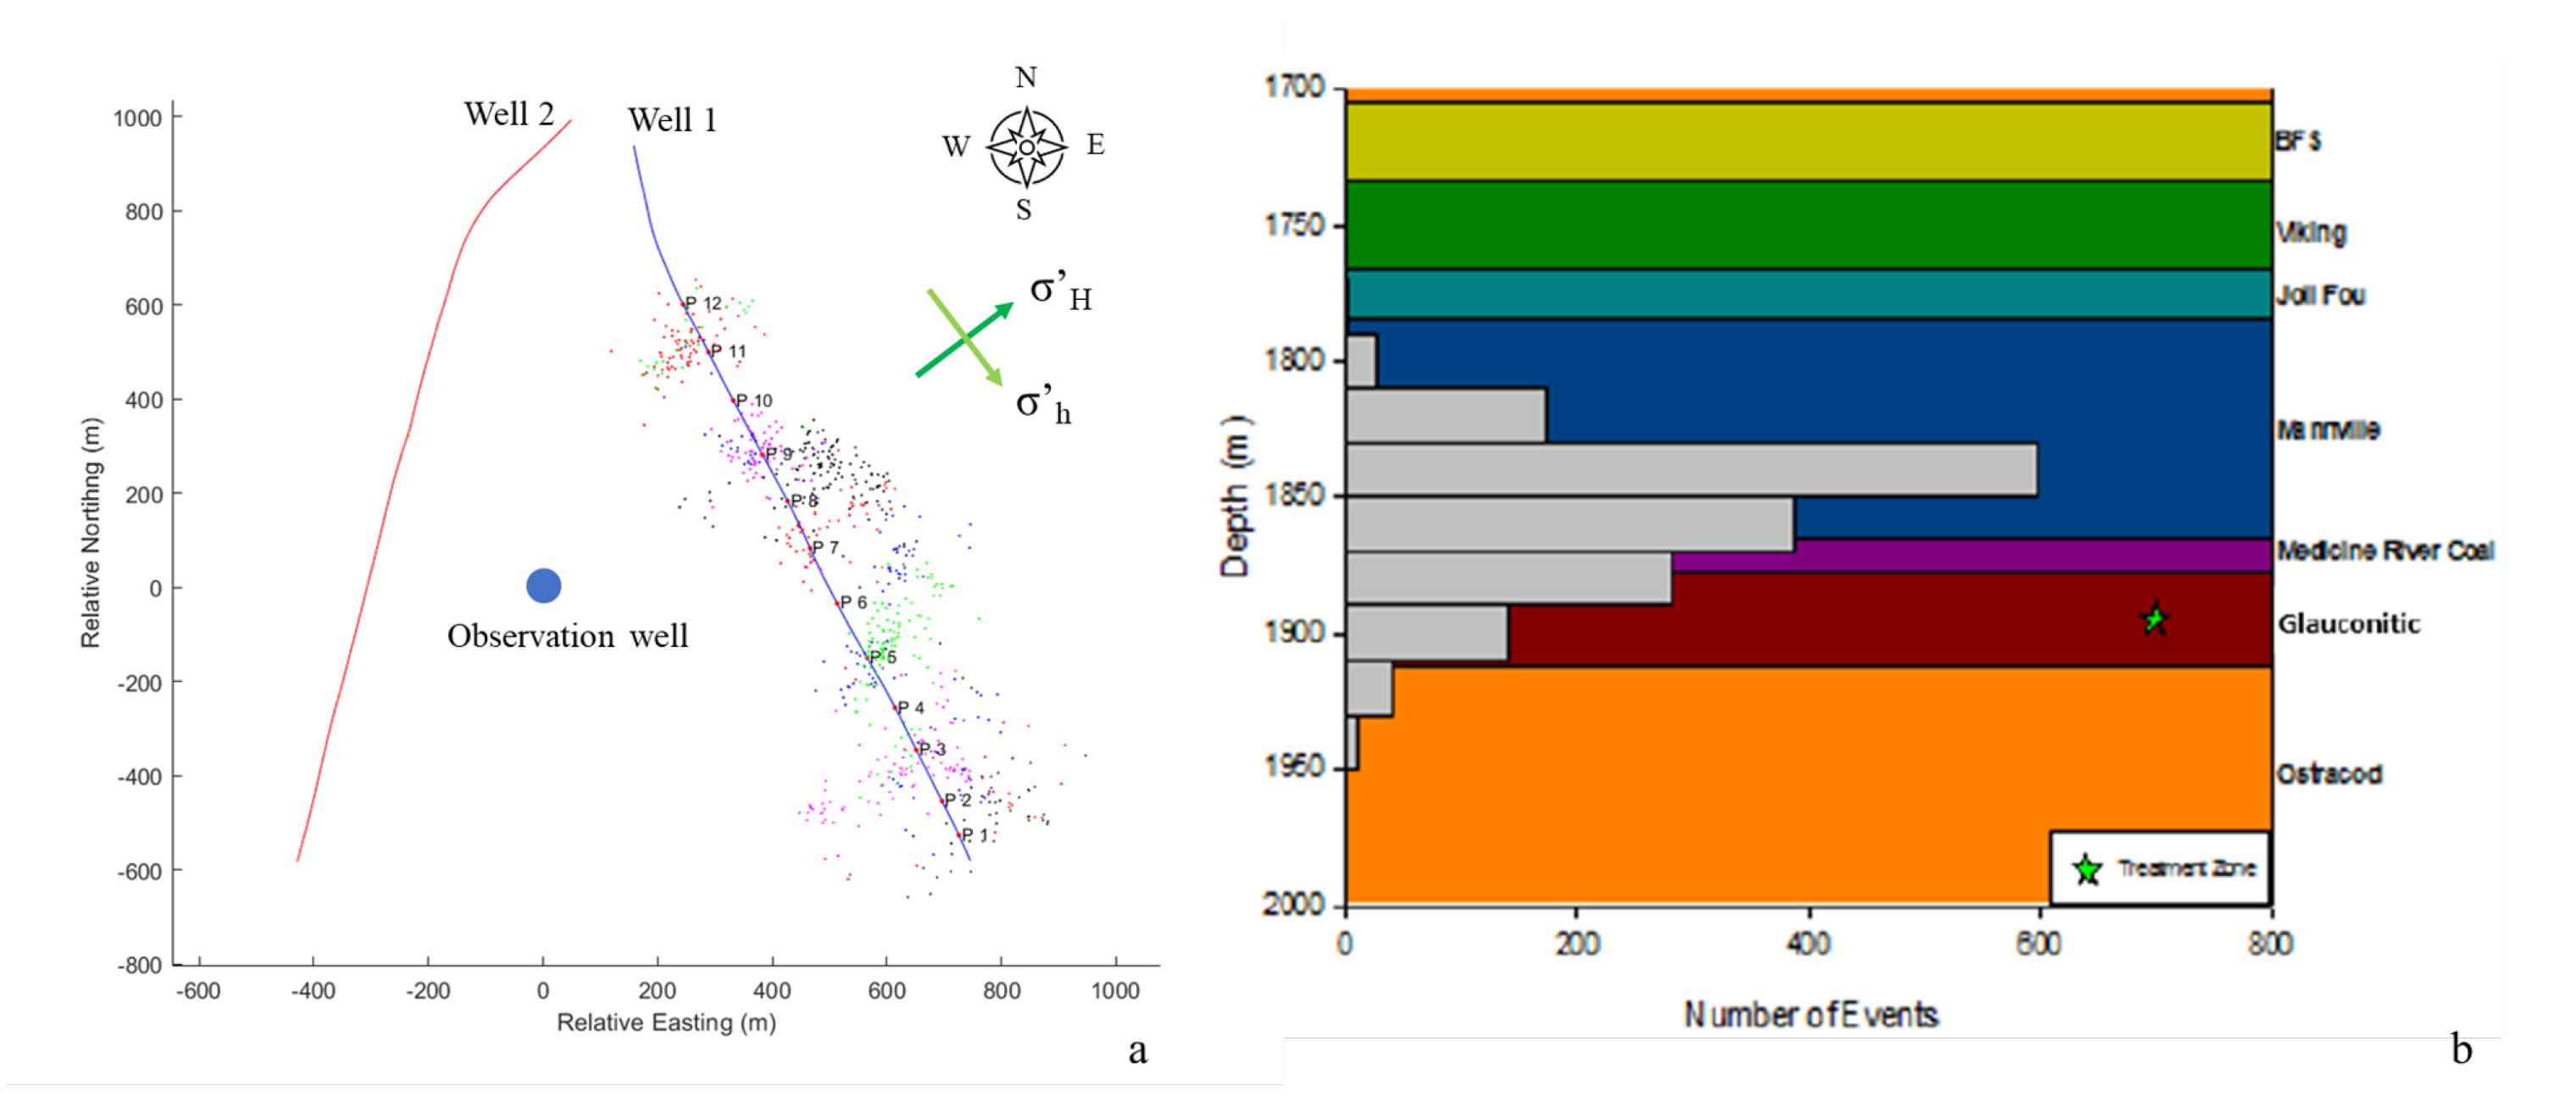
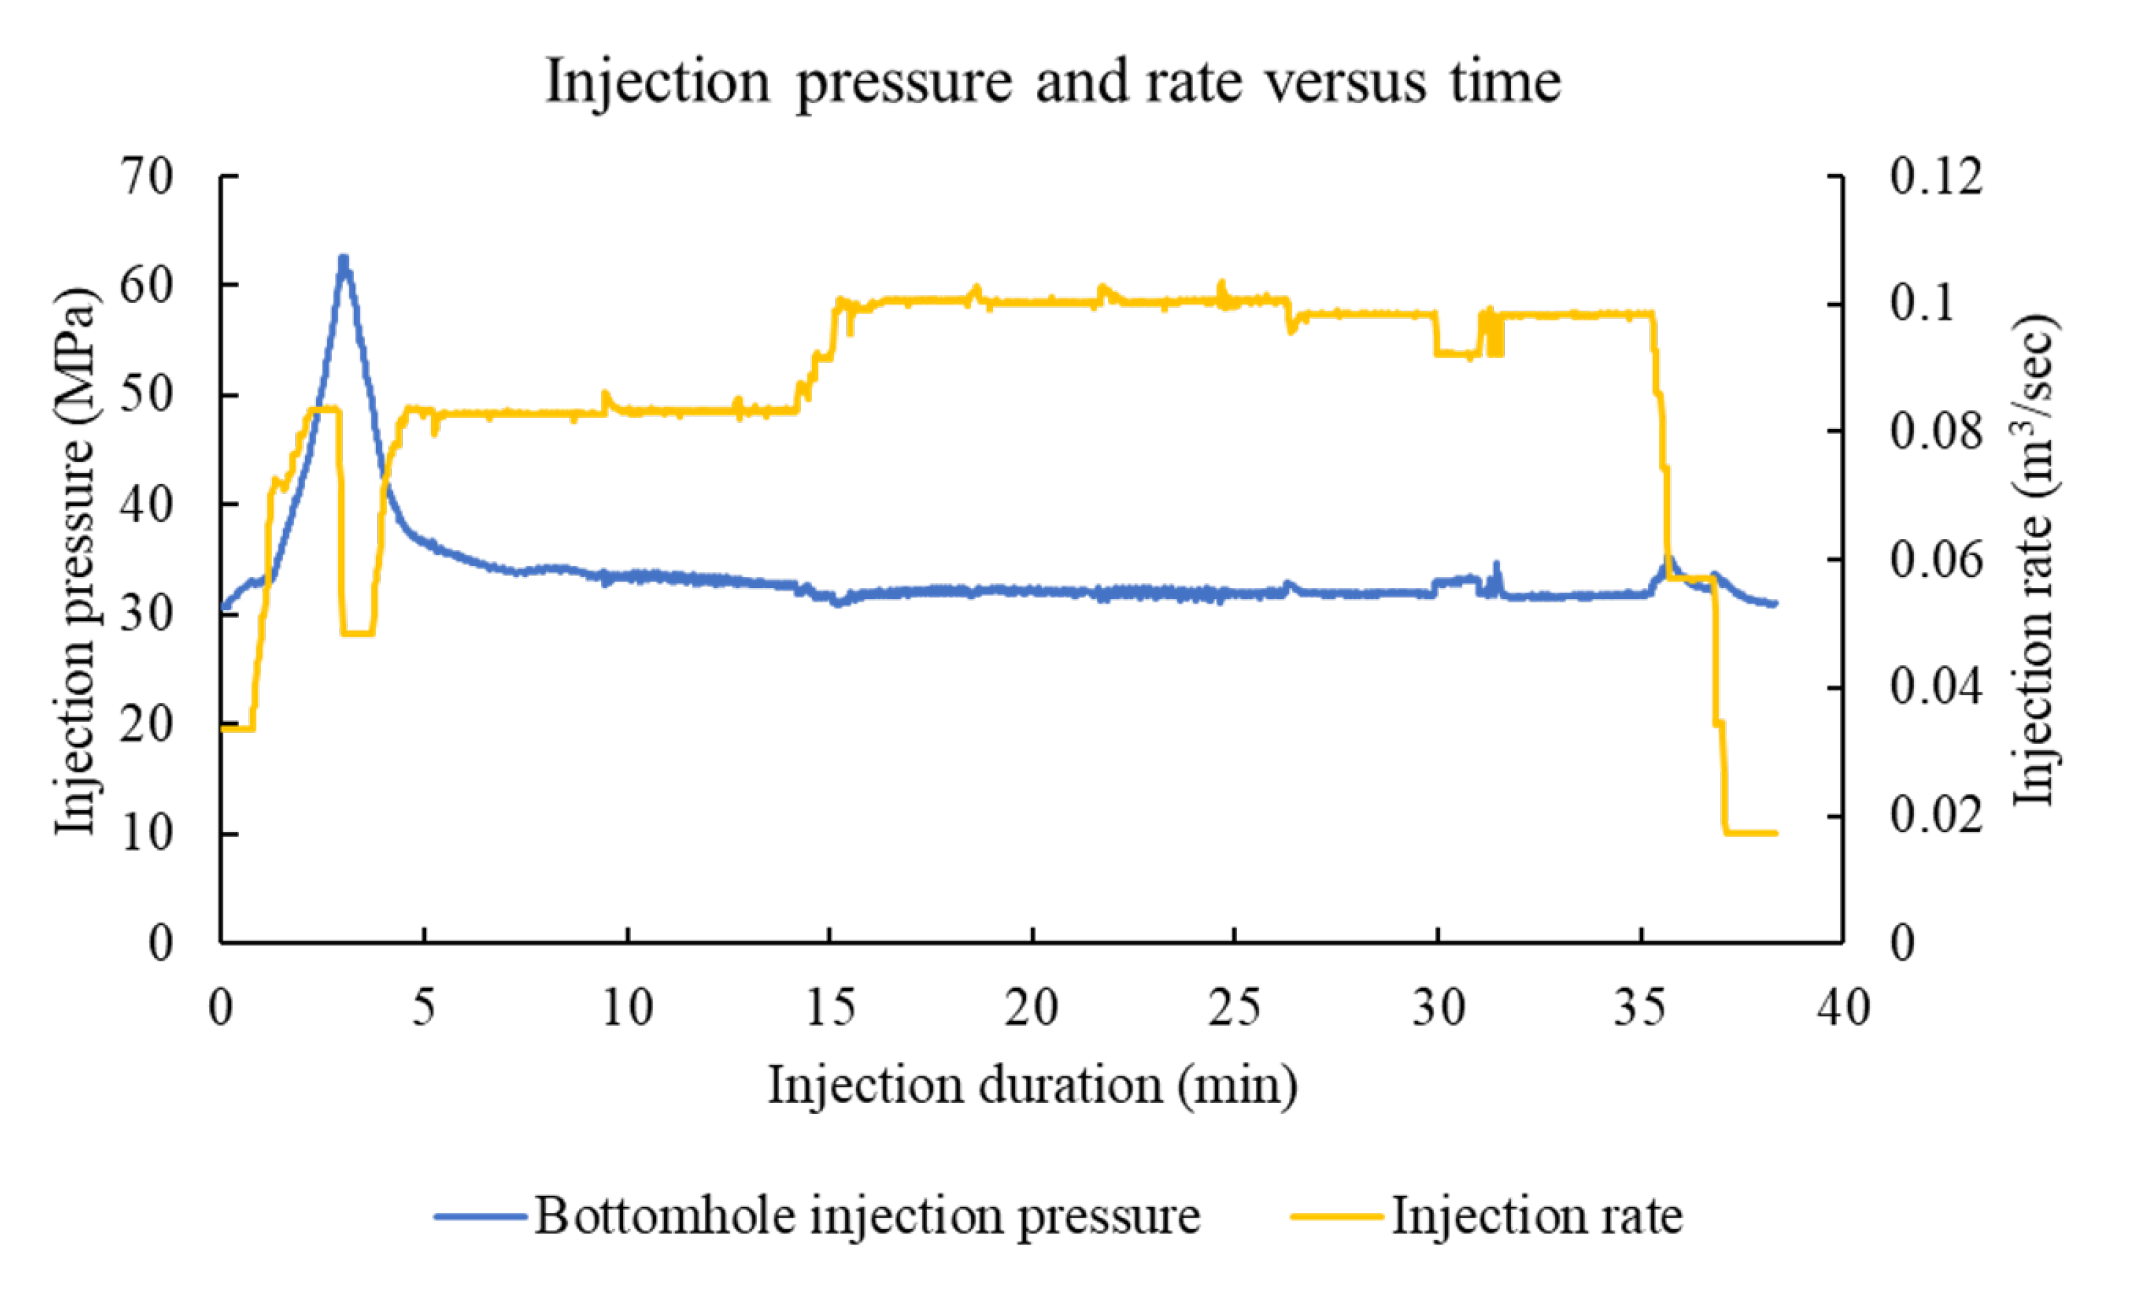
The Hoadley gas field is located northwest of Red Deer and southwest of Edmonton, Alberta, Canada. The pay formation is the Glauconite tight sand member of the Cretaceous Mannville Group, which is overlain by the coal-bearing Medicine River Formation. Open-hole, multi-stage hydraulic fracturing was carried out in two horizontal injection wells and monitored using a 12-level geophone array from a nearby vertical well [45]. The configuration of the wells and directions of maximum and minimum in-situ stresses are shown in Figure 2a. In Figure 2a blue and red line and, the big blue dot indicate two injection and vertical observation wells, respectively. The scattered dots are the observed microseismicity during hydraulic fracturing. The different colour is assigned for microseismicity observed at each stage. Simplified stratigraphy of the Hoadley field, as well as a depth histogram showing the number of microseismic events at given depths, is provided in Figure 2b. This paper is focused on a single stage of the hydraulic fracturing program in well 1. The injection pressure and rate profiles for stage 12 hydraulic fracturing in well 1 are plotted in Figure 3.
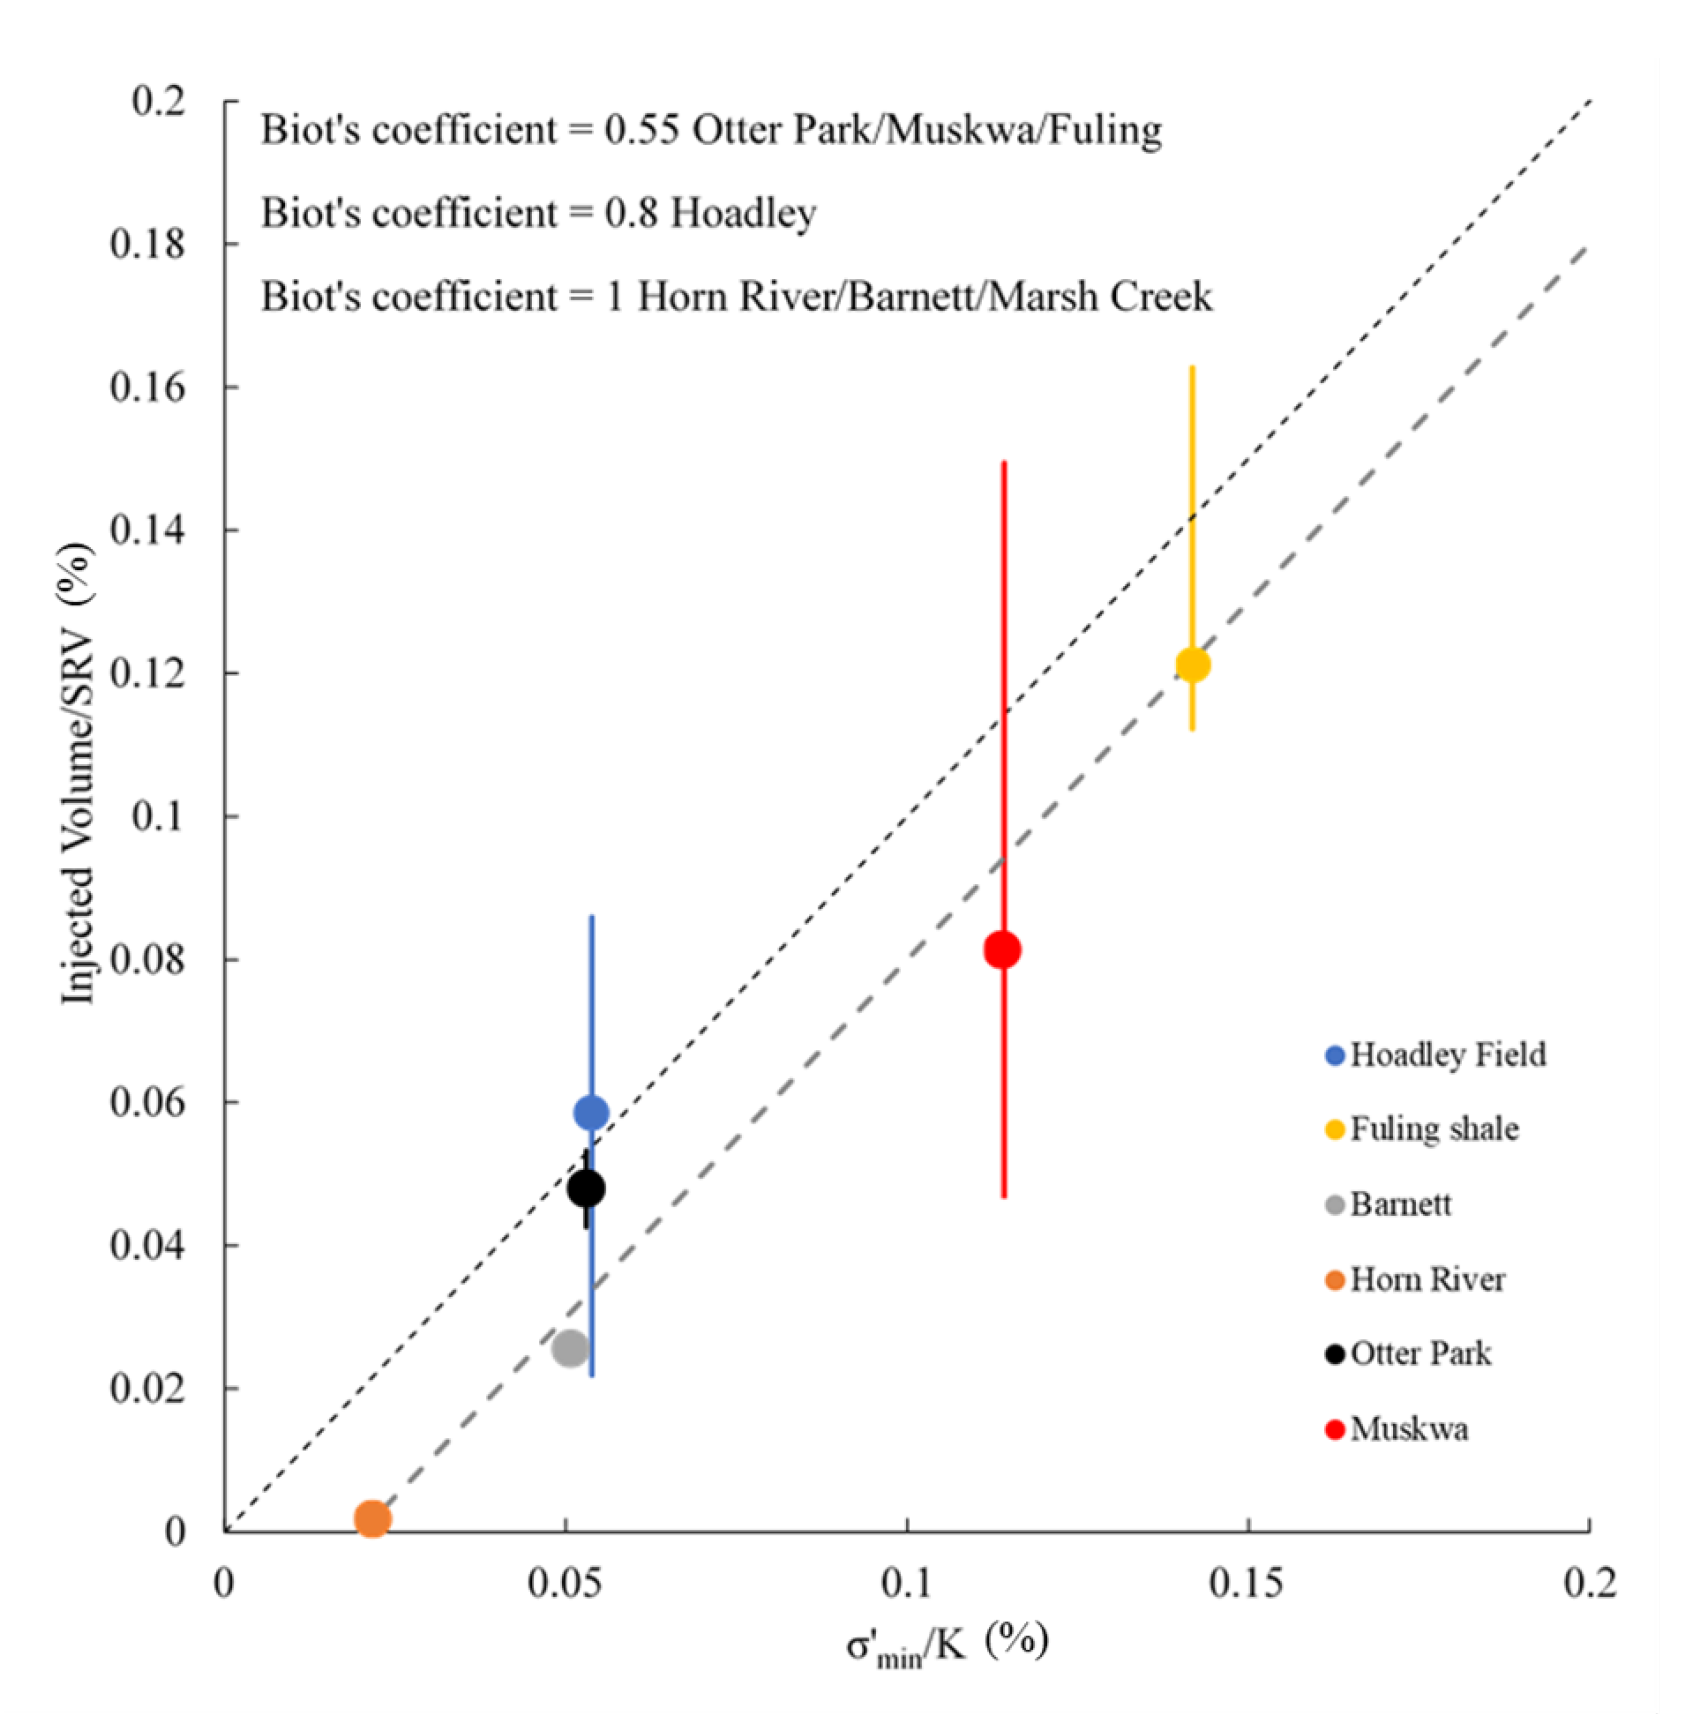
Furthermore, the volumteric strain using the injected volume and injection pressure methods are plotted in Figure 4. The other field data are also included for comparison [45,46,47,48]. The trend shown in Figure 4 suggests unique volumetric strain when fractures open, which allows relating the fractured rock permeability to volumetric strain.
Despite most of the microseismicity apparently concentrating above the target unit, this paper models only the Glauconite member. We focus on the in-zone microseismic response due to the abundance of geomechanical property data for Glauconite member, whereas other units are depicted through correlations only. The input parameters of the Glauconite member for ABAQUS FEM are provided in Table 1.
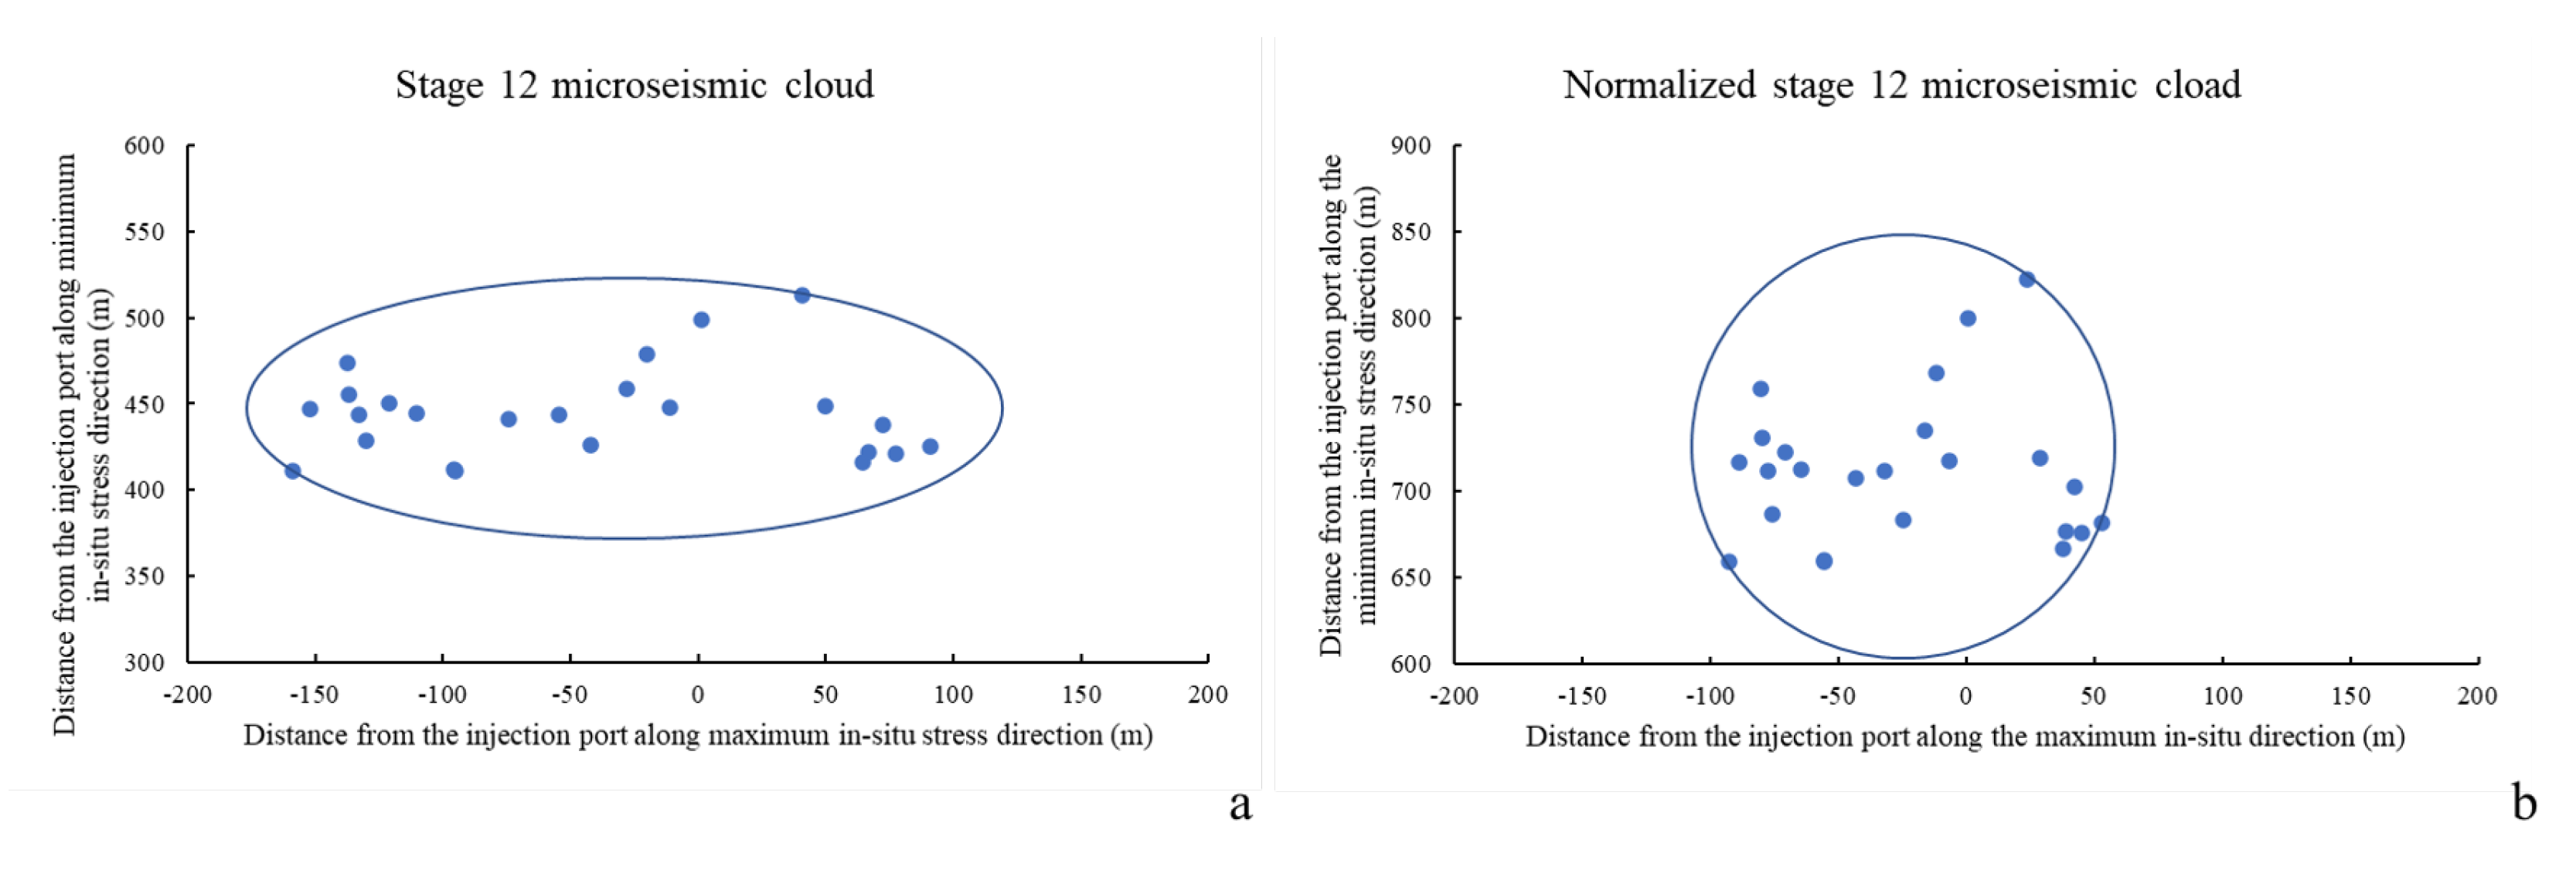
The first step in ECM simulation of the hydraulic fracturing is to normalise the microseismic data to reduce the analysis to one-dimensional form. Prior to normalisation, the microseismic data was rotated to align with maximum horizontal stress. Then the coordinates were translated to be relative to the injection port of stage 12. The planar view of rotated and translated microseismic event coordinates for stage 12 are illustrated in Figure 5a. The values for L m a x , L m i n , and L i n t are 150 m, 50 m, and 75 m, respectively. The normalised microseismic cloud for stage 12 is presented in Figure 5b.
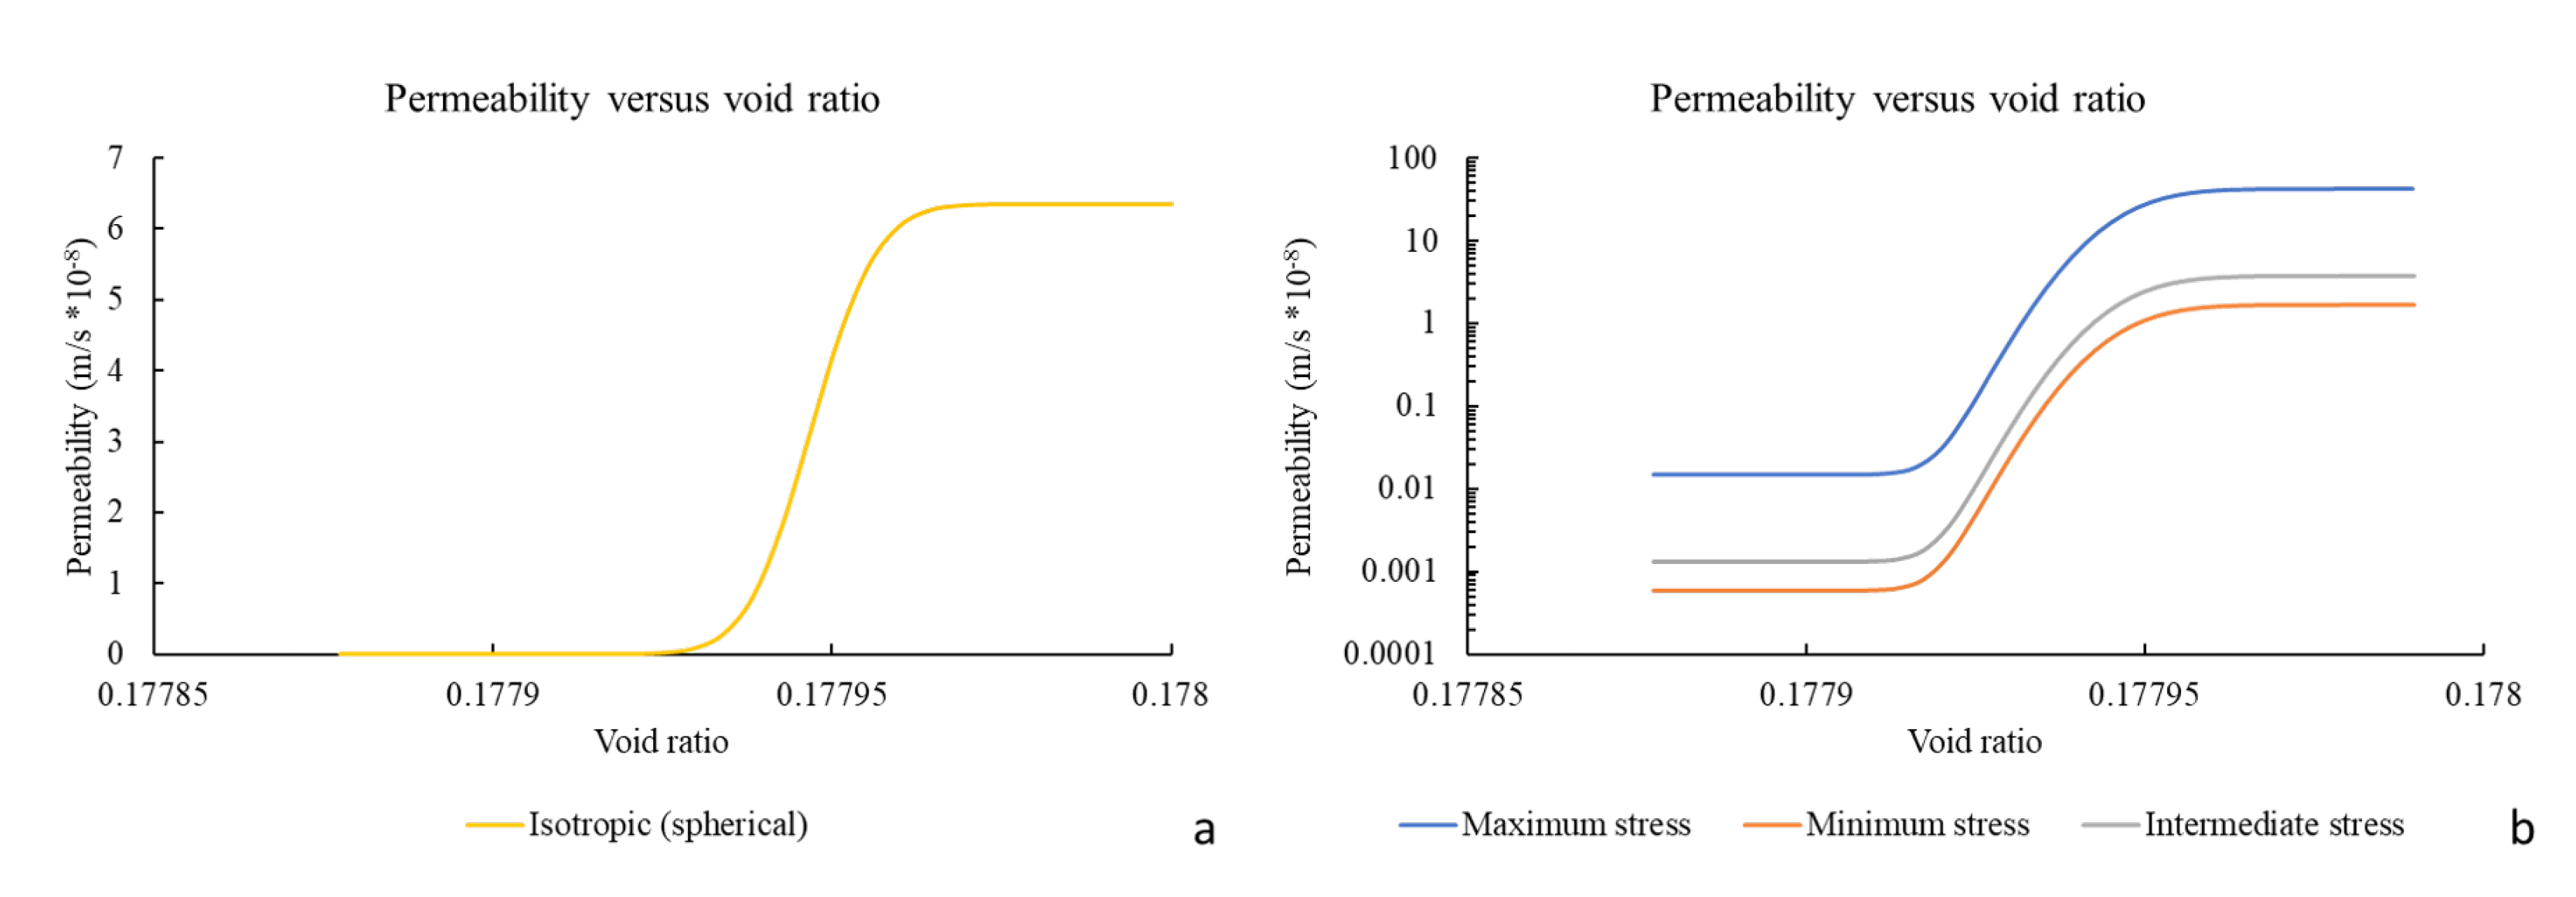
The void ratio dependent permeability relation is constructed to match the normalised microseismic cloud. The resulting relation is shown in Figure 6a. As outlined above, this relationship is then denormalised to obtain anisotropic permeability. The resultant permeabilities along the maximum, minimum, and intermediate stress directions, respectively are plotted in Figure 6b.
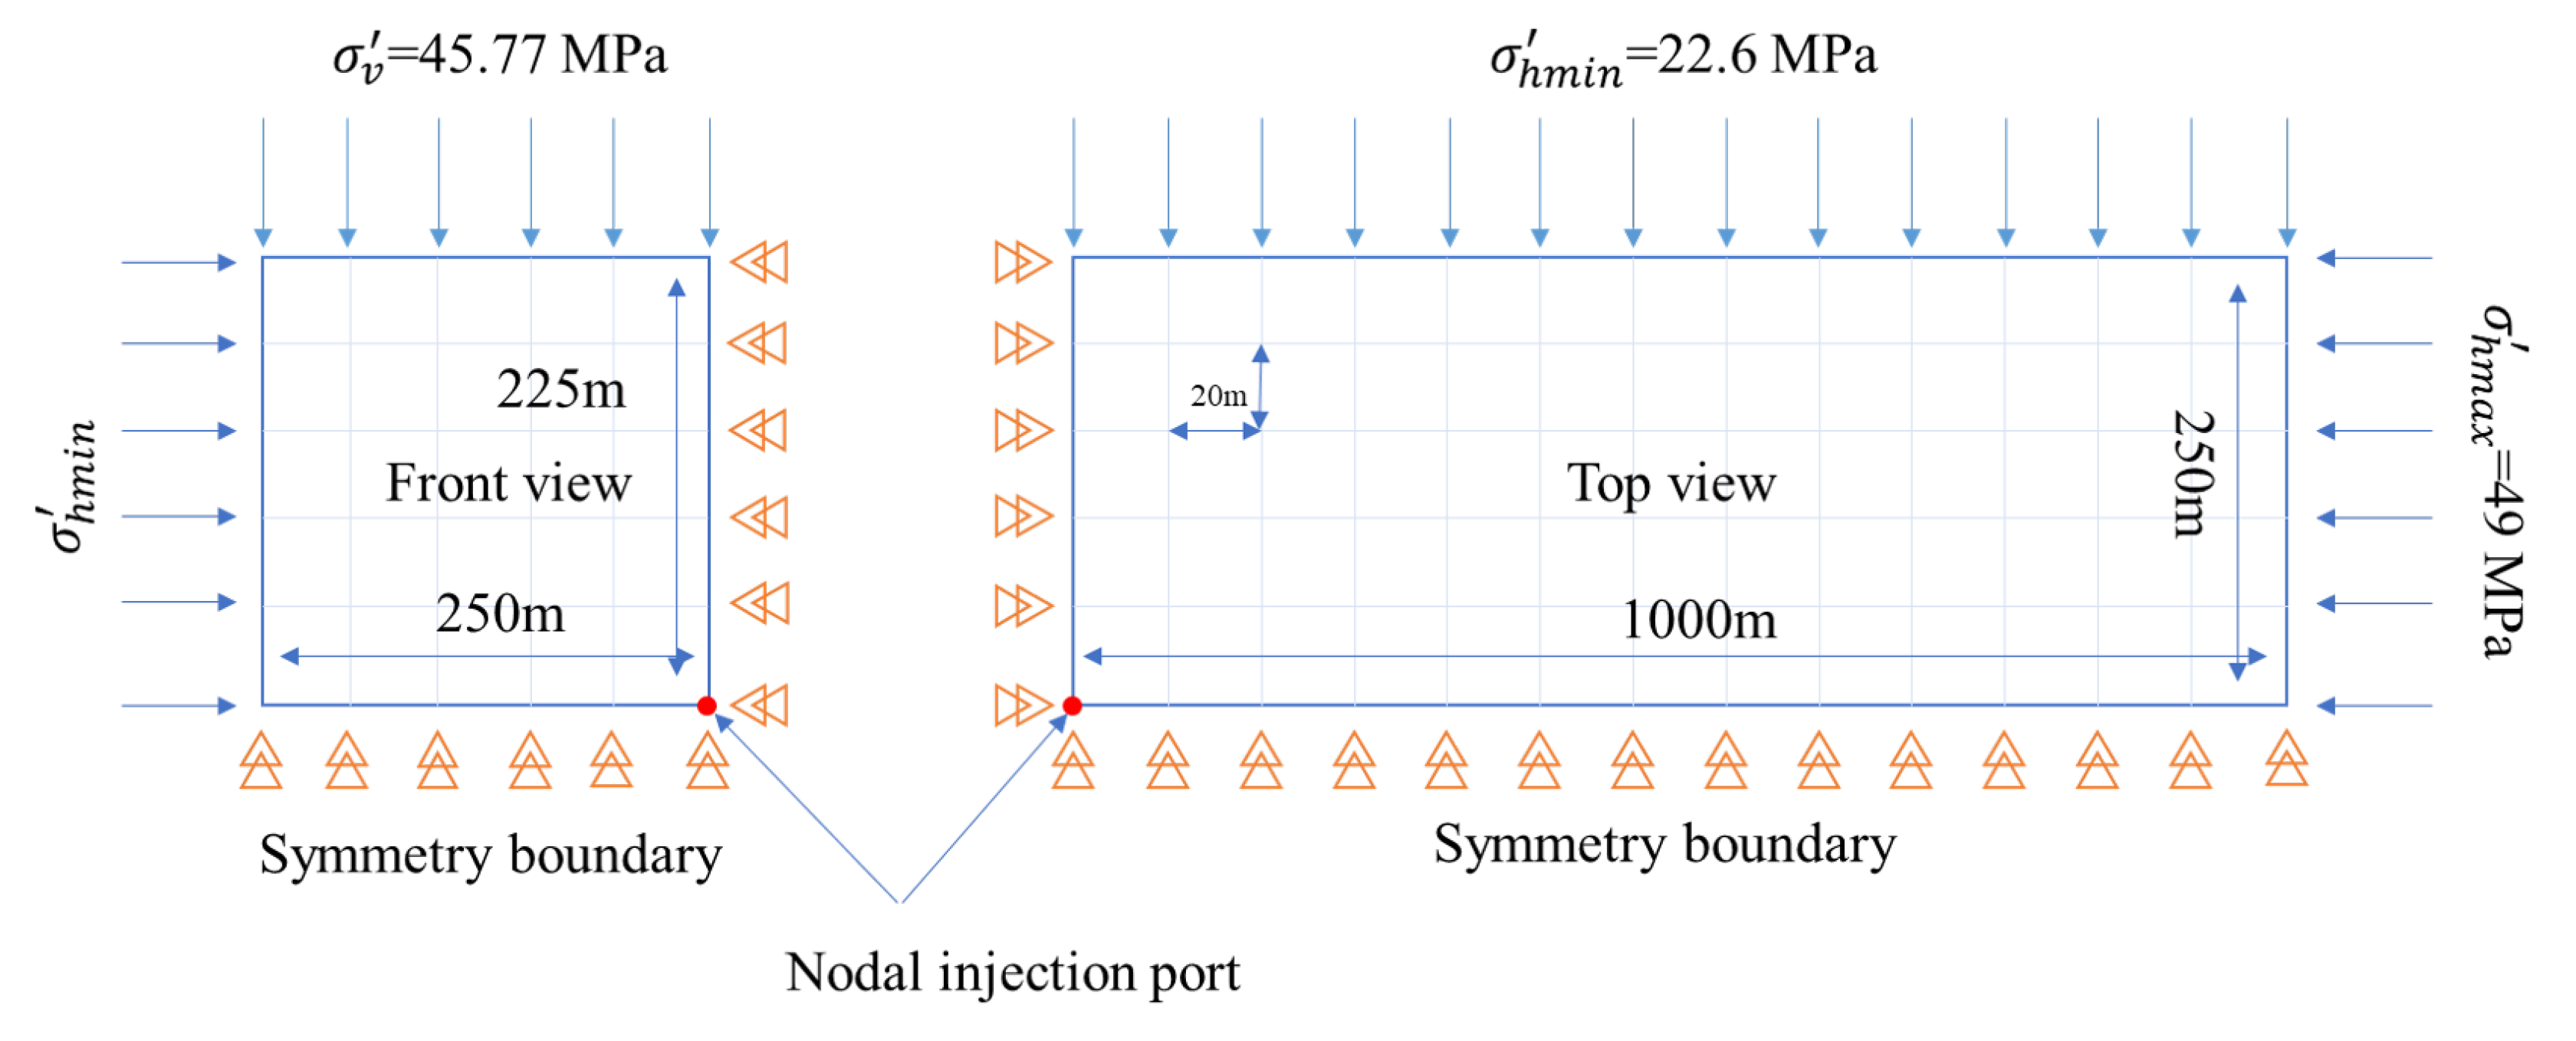
The anisotropic permeability relation is then used in ABAQUS to combine with the continuity equation, including the stress change effect. The constructed model uses C3D8P three-dimensional pore pressure solid element with an approximate mesh size of 20 m. The modelled region dimensions are 1000 m by 250 m by 225 m at the maximum, minimum and vertical stress directions, respectively. The modelled region dimensions are much larger than the SRV to avoid boundary effects. At the outer and top surfaces of the model, a constant pressure boundary is applied to ensure a constant far-field effective stress effect. This injection rate is only 12.5% of the average injection rate since the constructed model uses symmetry boundary along three surfaces. The inner and bottom surfaces use a symmetry boundary. The injection is defined using concentrated fluid flow load on a single node at a constant rate of 0.015 m3/s. In-situ stresses and pore pressure are introduced through pre-defined fields in ABAQUS. A constant value at 1900 m is applied for the in-situ stresses and pore pressure. The boundary conditions and injection port locations are indicated in Figure 7 using a simplified sketch.
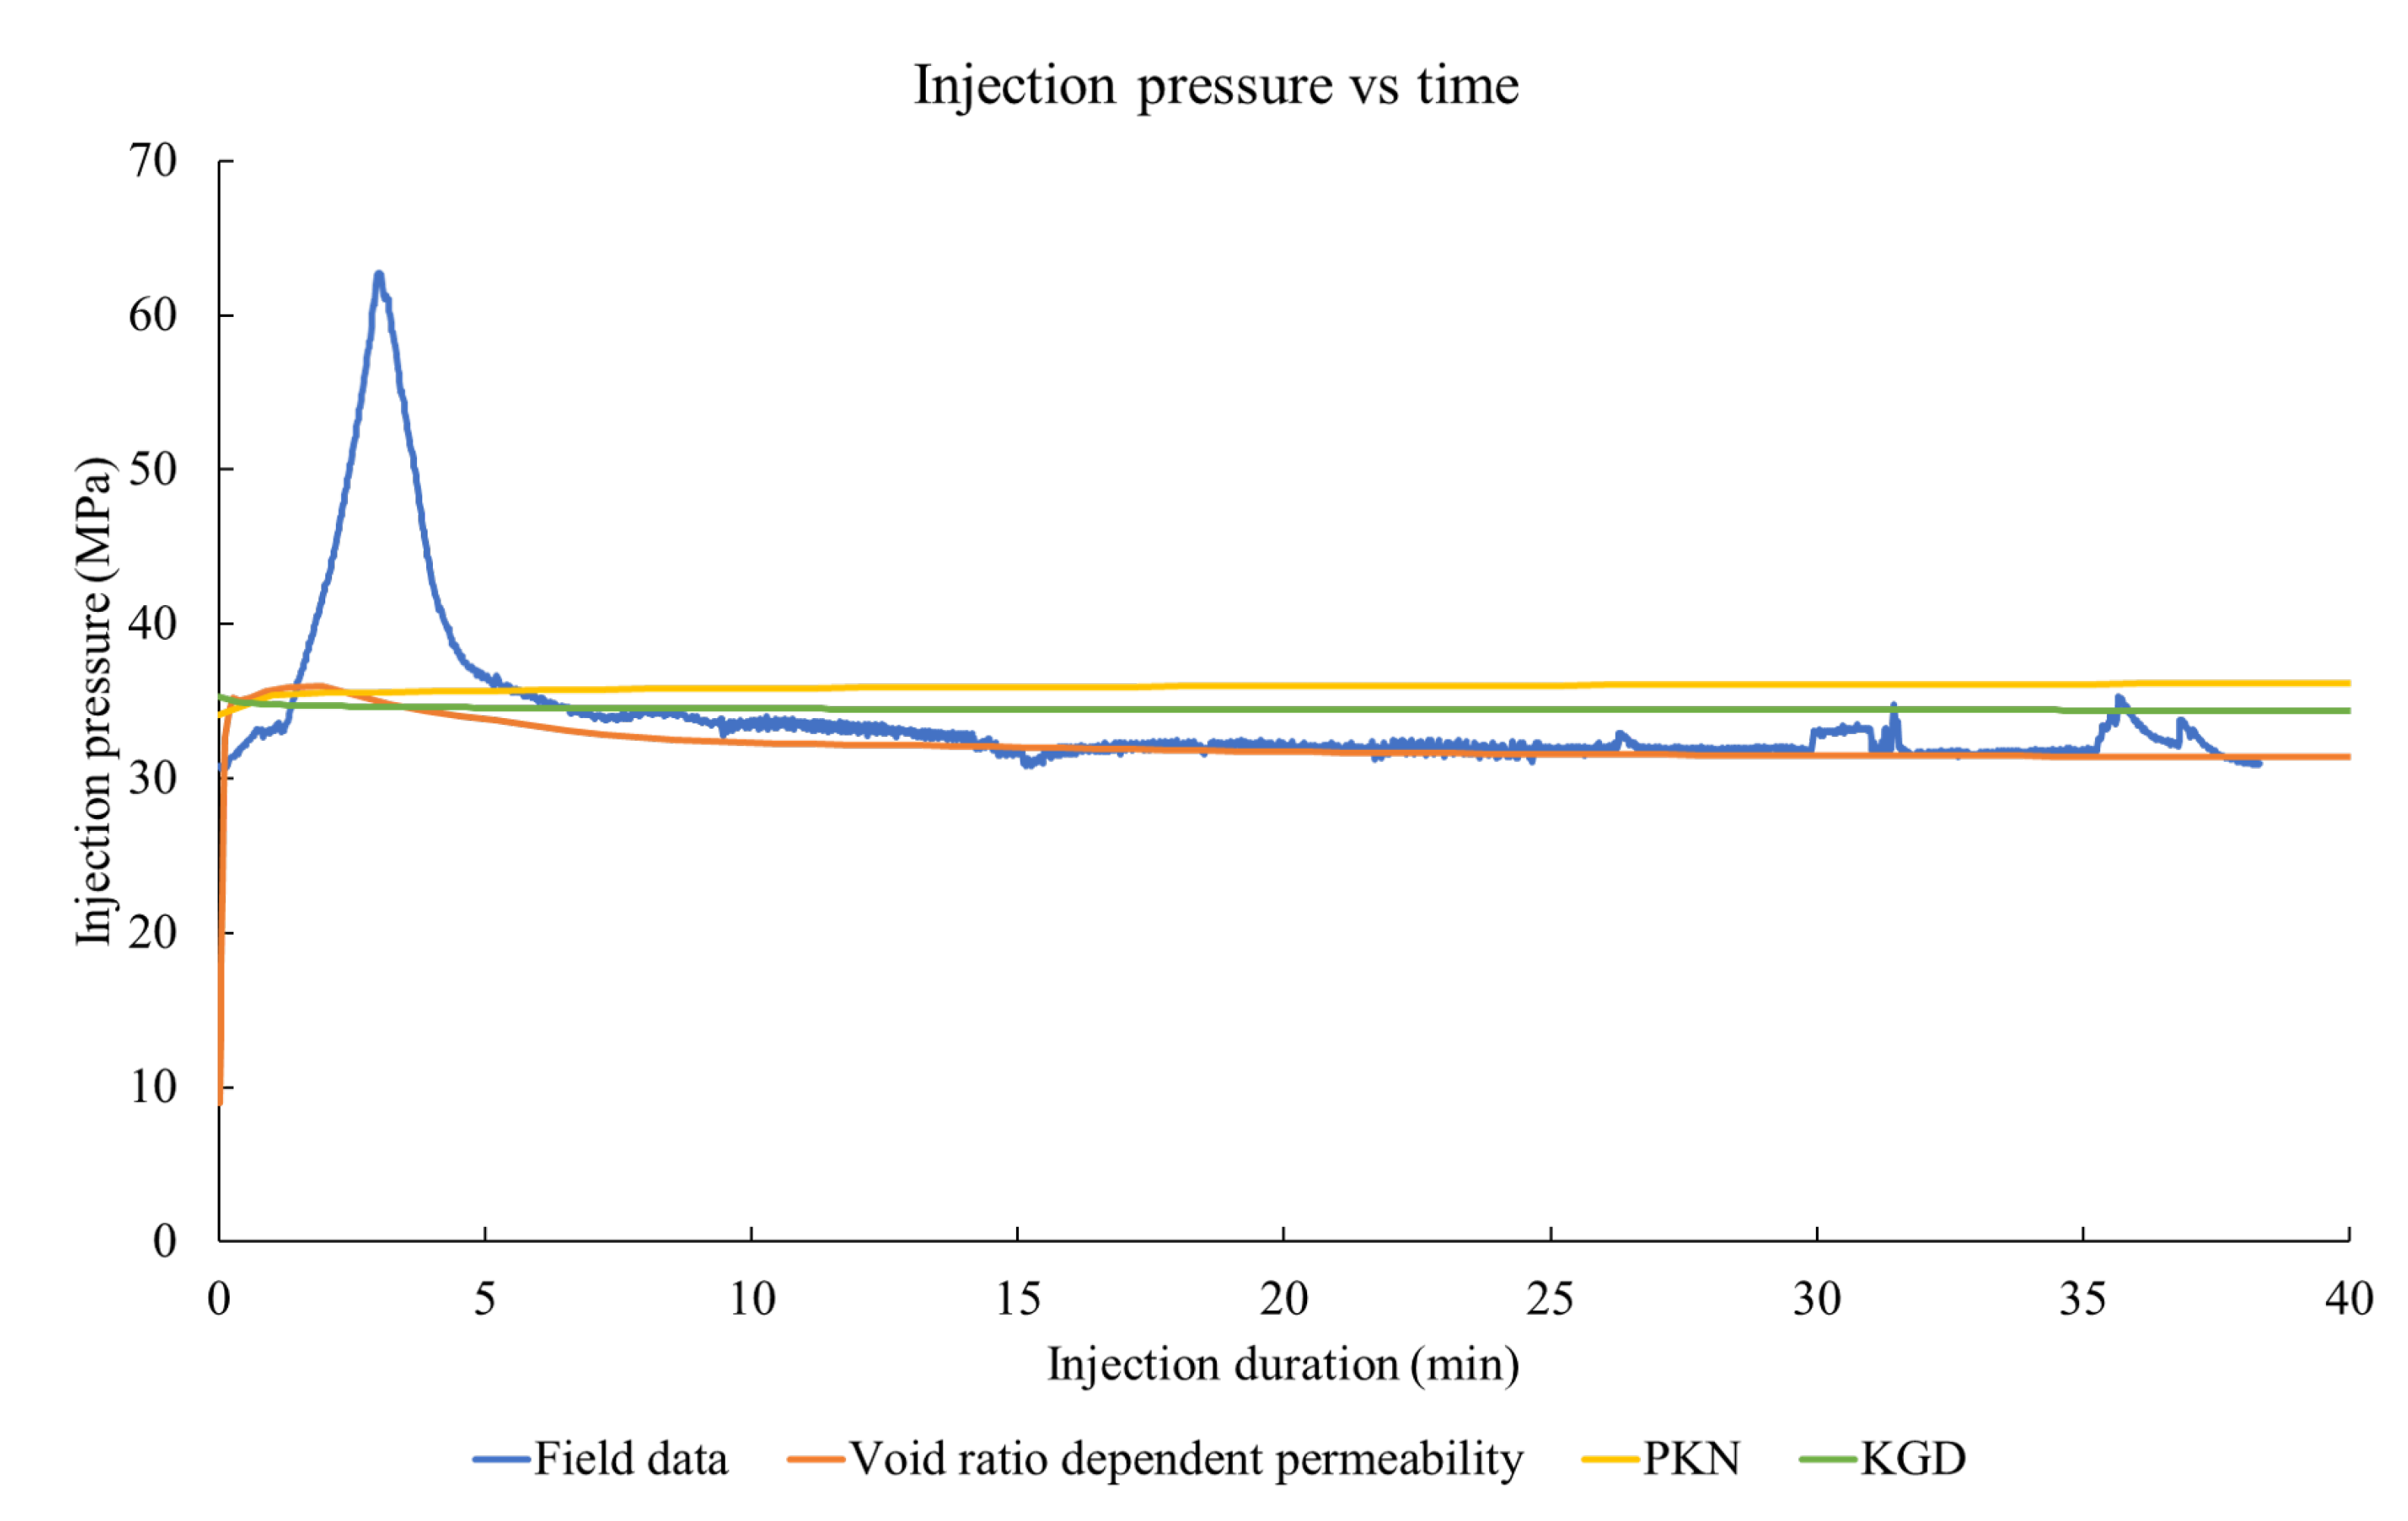
The results from the ECM are compared to field data, as well as the PKN and KGD models. The injection pressure profile obtained from three models and field observation are provided in Figure 8. The PKN and KGD models account for the intact rock cohesion of 11.55 MPa. Furthermore, to account for the natural fractures in the formation, the leak-off coefficient is introduced into analytical solutions. The leak-off coefficient is estimated based on fracture half-length of 150 m at the end of 38 min injection period. As indicated in Figure 8, the analytical models slightly overestimate injection pressure while ECM shows a good match with reported data.
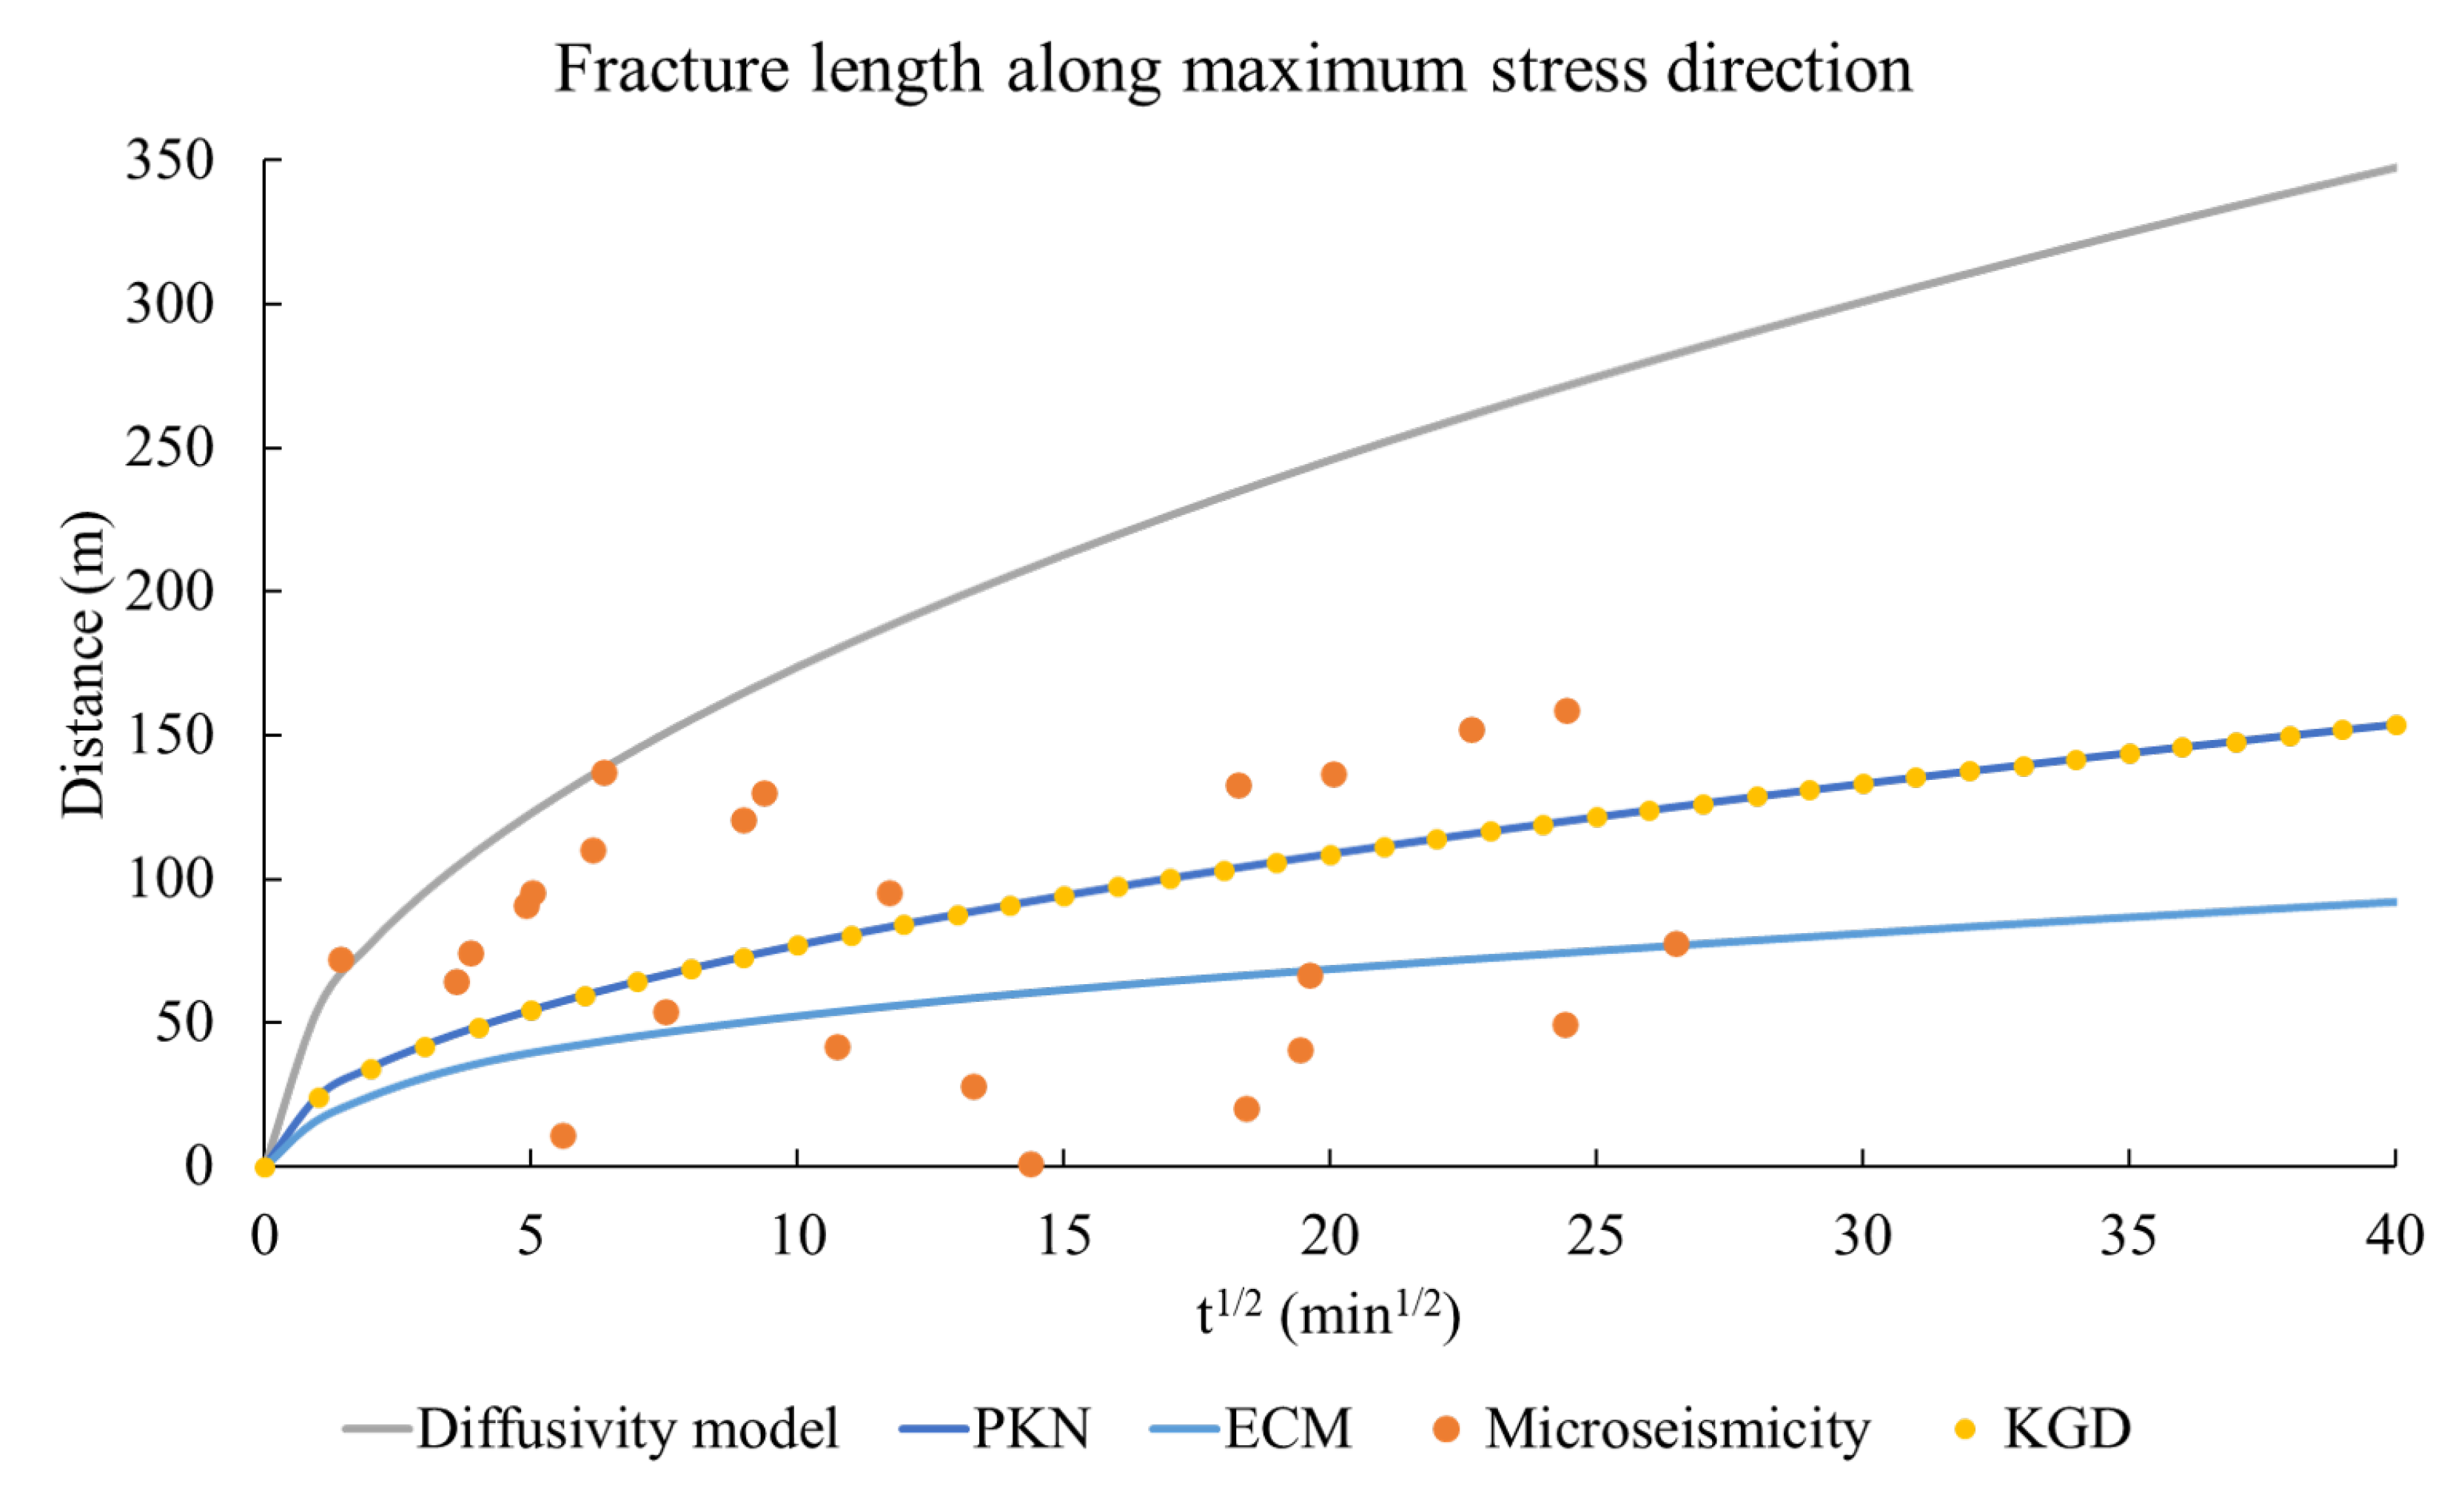
The analytical and ECM estimates for fracture length are compared against observed microseismicity. Fracture length along maximum stress comparison is provided in Figure 9. Besides the previously mentioned methods a diffusivity model estimate is included in Figure 9. The diffusivity model estimates the fracture length growth according to r ( t ) = 4 π D t where r ( t ) is the fracture length as a function of time in m, D is diffusivity in m2/s and time in s. The estimated diffusivity using the microseismicity along maximum stress direction is 4 m2/s. This indicates the case for fracture length increment with assumed constant permeability. As observed from Figure 9, both analytical solutions show the same fracture length elongation profile as the estimation of fluid leak-off coefficient based on the assumed final length of the fracture. For the ECM it is assumed that microseismicity is observed at a given node when pore pressure reaches 12.12 MPa. This satisfies the Mohr Coulomb failure criterion for Glauconite formation [18]. The ECM estimate for fracture length is lower compared to other methods. This is possible due to some of the microseismicity being not due to pore pressure change but due to total stress change around the increased pore pressure region.
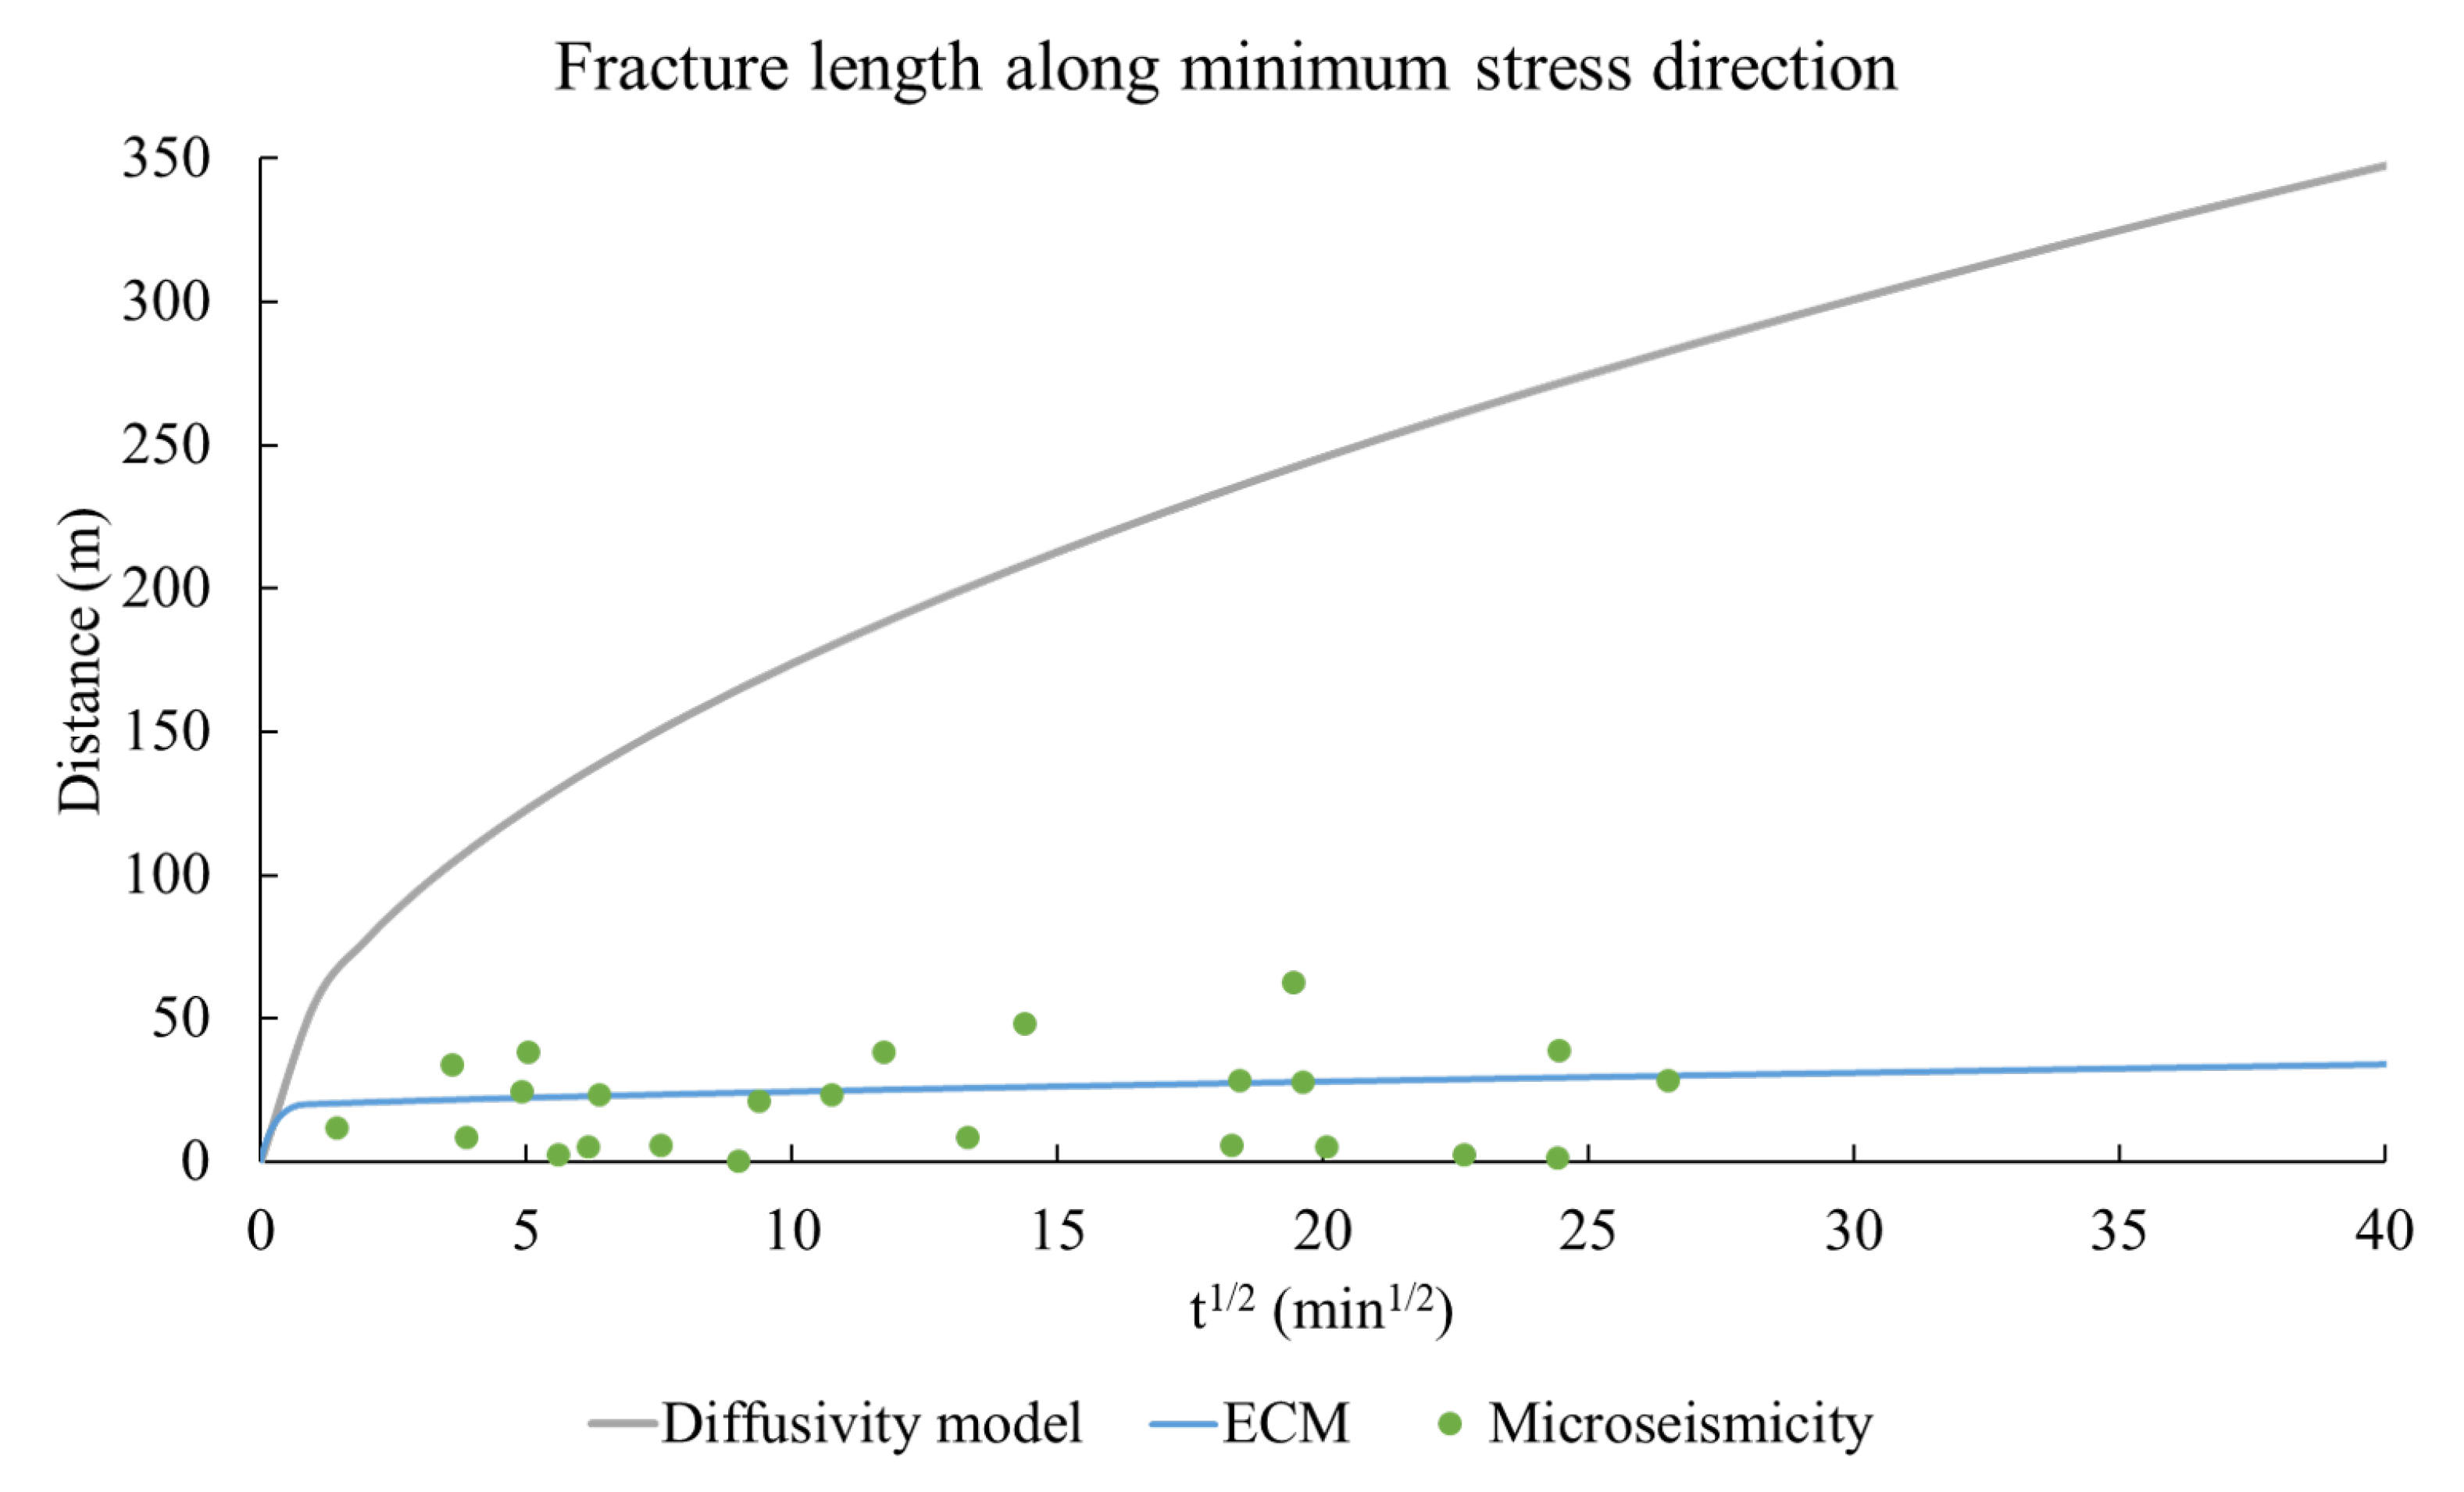
Furthermore, the fracture length estimates along minimum in-situ stress direction are compared in Figure 10. As the PKN and KGD models are one-dimensional solutions, they do not show any fracture extend along minimum in-situ stress direction. In addition, the diffusivity model assumes a radial flow. Therefore, it overestimates the fracture extend along the minimum in-situ stress. The ECM approach underestimates the fracture length for the minimum in-situ stress direction, too. This further confirms the possibility of some of the microseismicity due to total stress change effects. The model can be calibrated to match better the microseismic cloud however, the injection pressure profile would differ from the field observation. Considering the higher reliability of injection data compared to microseismicity, it is more preferential to match the injection data.
Another advantage of the proposed ECM has optimised modelling efficiency. The ECM and XFEM models were run using a personal computer with Core i7 2.4 GHz quad-core processor. The ECM required 8768.1 s of CPU time to model 3600 s (or 60 min) of injection period with no divergence problem. However, XFEM required about 28,800 s CPU time before running into convergence problem after 300 s (or 5 min) of the injection period. Therefore, for given generalised data set ECM approach poses as a more efficient modelling method. The XFEM might become a more preferred option if more detailed geomechanical data will allow for a better optimisation of this method.

4. Conclusions

Based on increasing interest in the use of optimised modelling techniques to simulate hydraulic fracturing, we developed a robust and computationally efficient equivalent continuum method. Our ECM method implemented using ABAQUS applies a step-like relationship between void ratio and permeability and incorporates microseismic data to define the stimulated volume of a reservoir. Anisotropy is accounted for by applying a transformation that enables the use of a standard one-dimensional modelling approach with a uniform mesh. This method is particularly useful for cases where there is insufficient data available to define parameters for other numerical approaches, including stress/strain sensitive zones in the target formation. In addition, the use of representative element volume allows the homogenisation of rock elastic and fracture properties for a modelled region. The proposed ECM is more representative compared to PKN, KGD, and diffusivity models and more efficient compared to the XFEM approach. A case study of hydraulic fracturing of tight sand in the Hoadley gas field, Alberta, illustrates the utility of our method for characterising hydraulic fracturing.

Author Contributions

Conceptualisation, E.A.; methodology, E.A.; writing—original draft preparation, E.A.; writing—review and editing, R.C.K.W. and D.W.E.; supervision, R.C.K.W.; funding acquisition, D.W.E. All authors have read and agreed to the published version of the manuscript.

Funding

This research was funded by Natural Sciences and Engineering Research Council of Canada grant number CRDPJ/474748-2014.

Acknowledgments

This research was funded by Natural Sciences and Engineering Research Council of Canada grant number CRDPJ/474748-2014. Sponsors of the Microseismic Industry Consortium are also thanked for their ongoing support of this initiative.

Conflicts of Interest

The authors declare no conflict of interest.

Abbreviations

The following abbreviations are used in this manuscript:
FEMFinite Element Modelling
CZMCohesive Zone Modelling
XFEMExtended Finite Element Modelling
ECMEquivalent Continuum Method
SRVStimulated Reservoir Volume

References

  1. Li, Q.; Xing, H.; Liu, J.; Liu, X. A review on hydraulic fracturing of unconventional reservoir. Petroleum 2015, 1, 8–15. [Google Scholar] [CrossRef] [Green Version]
  2. Montgomery, C.T.; Smith, M.B. Hydraulic fracturing: History of an enduring technology. JPT J. Pet. Technol. 2010, 62, 26–32. [Google Scholar] [CrossRef]
  3. Wu, K.; Olson, J.E. A simplified three-dimensional displacement discontinuity method for multiple fracture simulations. Int. J. Fract. 2015, 193, 191–204. [Google Scholar] [CrossRef]
  4. Warpinski, N. A review of hydraulic-fracture induced microseismicity. In Proceedings of the 48th US Rock Mechanics/Geomechanics Symposium, Minneapolis, MN, USA, 1–4 June 2014; American Rock Mechanics Association. Available online: https://www.onepetro.org/conference-paper/ARMA-2014-7774 (accessed on 24 November 2020).
  5. Yao, Y.; Gosavi, S.V.; Searles, K.H.; Ellison, T.K. Cohesive fracture mechanics based analysis to model ductile rock fracture. In Proceedings of the 44th US Rock Mechanics Symposium and 5th US-Canada Rock Mechanics Symposium, Salt Lake City, UT, USA, 27–30 June 2010. [Google Scholar]
  6. Haddad, M.; Sepehrnoori, K. Simulation of multiple-stage fracturing in quasibrittle shale formations using pore pressure cohesive zone model. In Proceedings of the Unconventional Resources Technology Conference, Denver, CO, USA, 25–27 August 2014; pp. 1777–1792. [Google Scholar] [CrossRef]
  7. Haddad, M.; Sepehrnoori, K. Integration of XFEM and CZM to model 3D multiple-stage hydraulic fracturing in quasi-brittle shale formations: Solution-dependent propagation direction. In Proceedings of the AADE National Technical Conference and Exhibition, San Antonio, TX, USA, 8–9 April 2015; pp. 8–9. [Google Scholar]
  8. Haddad, M.; Sepehrnoori, K. Simulation of hydraulic fracturing in quasi-brittle shale formations using characterized cohesive layer: Stimulation controlling factors. J. Unconv. Oil Gas Resour. 2015, 9, 65–83. [Google Scholar] [CrossRef]
  9. Wang, H. Numerical modeling of non-planar hydraulic fracture propagation in brittle and ductile rocks using XFEM with cohesive zone method. J. Pet. Sci. Eng. 2015, 135, 127–140. [Google Scholar] [CrossRef]
  10. Zielonka, M.G.; Searles, K.H.; Ning, J.; Buechler, S.R. Development and validation of fully-coupled hydraulic fracturing simulation capabilities. In Proceedings of the SIMULIA Community Conference, Providence, RI, USA, 20–22 May 2014; pp. 19–21. [Google Scholar]
  11. Arndt, S.; Zee, W.V.D.; Hoeink, T.; Hughes, B.; Nie, J. Hydraulic fracturing simulation for fracture networks. In Proceedings of the SIMULIA Community Conference, Berlin, Germany, 18–21 May 2015; Volume 4. [Google Scholar]
  12. Nasirisavadkouhi, A. A comparison study of KGD. PKN Modif. P3D Model 2015. [Google Scholar] [CrossRef]
  13. Yu, G.; Aguilera, R. 3D analytical modeling of hydraulic fracturing stimulated reservoir volume. In SPE Latin America and Caribbean Petroleum Engineering Conference, Mexico City, Mexico, 16–18 April, 2012; Society of Petroleum Engineers, SPE-153486-MS, SPE; Available online: https://www.onepetro.org/conference-paper/SPE-153486-MS (accessed on 24 November 2020).
  14. Bouteca, M.J. 3D analytical model for hydraulic fracturing: Theory and field test. In Proceedings of the SPE Annual Technical Conference and Exhibition, New Orleans, Louisiana, USA, 27–30 September 1984. [Google Scholar] [CrossRef]
  15. Stalgorova, E.; Mattar, L. Analytical model for unconventional multifractured composite systems. SPE Reserv. Eval. Eng. 2013, 16, 246–256. [Google Scholar] [CrossRef]
  16. Geertsma, J.; De Klerk, F. A rapid method of predicting width and extent of hydraulically induced fractures. J. Pet. Technol. 2007, 21, 1571–1581. [Google Scholar] [CrossRef]
  17. Nordgren, R. Propagation of a vertical hydraulic fracture. Soc. Pet. Eng. J. 1972, 12, 306–314. [Google Scholar] [CrossRef]
  18. Maulianda, B. On Hydraulic Fracturing of Tight Gas Reservoir Rock. Ph.D. Thesis, University of Calgary, Calgary, AB, Canada, 2016. [Google Scholar] [CrossRef]
  19. Gonzalez, D.; Holman, R.; Richard, R.; Xue, H.; Morales, A.; Kwok, C.K.; Judd, T. Accounting for production shadow in infill/DUC well hydraulic fracturing modeling and calibration. In SPE Liquids-Rich Basins Conference-North America, Midland, Texas, USA, 13–14 September, 2017; Society of Petroleum Engineers; Available online: https://www.onepetro.org/conference-paper/SPE-187479-MS (accessed on 24 November 2020).
  20. Valiullin, A.; Makienko, V.; Yudin, A.; Overin, A.; Gromovenko, A. Channel fracturing technique helps to revitalize brown fields in langepas area. In Society of Petroleum Engineers—SPE Oil and Gas India Conference and Exhibition, Mumbai, India, 24–26 November 2015; Society of Petroleum Engineers; Available online: https://www.onepetro.org/conference-paper/SPE-178131-MS (accessed on 24 November 2020). [CrossRef]
  21. Chen, Z.; Bunger, A.P.; Zhang, X.; Jeffrey, R.G. Cohesive zone finite element-based modeling of hydraulic fractures. Acta Mech. Solida Sin. 2009, 22, 443–452. [Google Scholar] [CrossRef]
  22. Wang, X.L.; Liu, C.; Wang, H.; Liu, H.; Wu, H.A. Comparison of consecutive and alternate hydraulic fracturing in horizontal wells using XFEM-based cohesive zone method. J. Pet. Sci. Eng. 2016, 143, 14–25. [Google Scholar] [CrossRef]
  23. Guo, J.; Luo, B.; Lu, C.; Lai, J.; Ren, J. Numerical investigation of hydraulic fracture propagation in a layered reservoir using the cohesive zone method. Eng. Fract. Mech. 2017, 186, 195–207. [Google Scholar] [CrossRef]
  24. Yao, Y.; Liu, L.; Keer, L.M. Pore pressure cohesive zone modeling of hydraulic fracture in quasi-brittle rocks. Mech. Mater. 2015, 83, 17–29. [Google Scholar] [CrossRef]
  25. Carrier, B.; Granet, S. Numerical modeling of hydraulic fracture problem in permeable medium using cohesive zone model. Eng. Fract. Mech. 2012, 79, 312–328. [Google Scholar] [CrossRef] [Green Version]
  26. Yao, Y. Linear elastic and cohesive fracture analysis to model hydraulic fracture in brittle and ductile rocks. Rock Mech. Rock Eng. 2012, 45, 375–387. [Google Scholar] [CrossRef]
  27. Lavrov, A.; Larsen, I.; Holt, R.M.; Bauer, A.; Pradhan, S. Hybrid FEM/DEM simulation of hydraulic fracturing in naturally-fractured reservoirs. In Proceedings of the 48th US Rock Mechanics/Geomechanics Symposium, Minneapolis, MN, USA, 1–4 June 2014; pp. 626–633. [Google Scholar]
  28. Munjiza, A.; John, N.W. Mesh size sensitivity of the combined FEM/DEM fracture and fragmentation algorithms. Eng. Fract. Mech. 2001, 69, 281–295. [Google Scholar] [CrossRef]
  29. Min, K.B. Fractured Rock Masses as Equivalent Continua—A Numerical Study. Ph.D. Thesis, Mark Och Vatten, Stockholm, Sweden, 2004. [Google Scholar]
  30. Oda, M. An equivalent continuum model for coupled stress and fluid flow analysis in jointed rock masses. Water Resour. Res. 1986, 22, 1845–1856. [Google Scholar] [CrossRef]
  31. Villeneuve, M.C.; Heap, M.J.; Kushnir, A.R.; Qin, T.; Baud, P.; Zhou, G.; Xu, T. Estimating in situ rock mass strength and elastic modulus of granite from the Soultz-sous-Forêts geothermal reservoir (France). Geotherm. Energy 2018, 6, 1–29. [Google Scholar] [CrossRef]
  32. JianPing, Y.; WeiZhong, C.; DianSen, Y.; JingQiang, Y. Numerical determination of strength and deformability of fractured rock mass by FEM modeling. Comput. Geotech. 2015, 64, 20–31. [Google Scholar] [CrossRef]
  33. Mack, M.G.; Warpinski, N.R. Mechanics of hydraulic fracturing. In Reservoir Stimulation; Wiley: New York, NY, USA, 2000; pp. 1–6. [Google Scholar]
  34. SIMULIA. ABAQUS 6.16-1. 2016. Available online: http://130.149.89.49:2080/v2016/index.html (accessed on 24 November 2020).
  35. Youn, D.J.; Griffiths, D.V. Hydro-Mechanical Coupled Simulation of Hydraulic Fracturing Using the Extended Finite Element Method (XFEM). Ph.D Thesis, Colorado School of Mines, Golden, GO, USA, 2016. [Google Scholar]
  36. Kang, Y.; Yu, M.; Miska, S.; Takach, N.E. Wellbore stability: A critical review and introduction to DEM. In Proceedings of the SPE Annual Technical Conference and Exhibition, New Orleans, LA, USA, 4–7 October 2009; Volume 4, pp. 2689–2712. [Google Scholar] [CrossRef]
  37. Zhou, J.; Huang, H.; Mattson, E.; Wang, H.F.; Haimson, B.C.; Doe, T.W.; Oldenburg, C.M.; Dobson, P.F. Modeling of Hydraulic Fracture Propagation at the kISMET Site Using a Fully Coupled 3D Network-Flow and Quasi-Static Discrete Element Model; Technical Report; Idaho National Lab (INL): Idaho Falls, ID, USA, 2017. [Google Scholar]
  38. Nguyen, T.K.; Combe, G.; Caillerie, D.; Desrues, J. FEM x DEM modelling of cohesive granular materials: Numerical homogenisation and multi-scale simulations. Acta Geophys. 2014, 62, 1109–1126. [Google Scholar] [CrossRef]
  39. Maulianda, B.; Savitri, C.D.; Prakasan, A.; Atdayev, E.; Yan, T.W.; Yong, Y.K.; Elrais, K.A.; Barati, R. Recent comprehensive review for extended finite element method (XFEM) based on hydraulic fracturing models for unconventional hydrocarbon reservoirs. J. Pet. Explor. Prod. Technol. 2020. [Google Scholar] [CrossRef]
  40. Hoek, E.; Diederichs, M.S. Empirical estimation of rock mass modulus. Int. J. Rock Mech. Min. Sci. 2006, 43, 203–215. [Google Scholar] [CrossRef]
  41. Oda, M. Similarity rule of crack geometry in statistically homogeneous rock masses. Mech. Mater. 1984, 3, 119–129. [Google Scholar] [CrossRef]
  42. Mayerhofer, M.; Lolon, E.; Warpinski, N.; Cipolla, C.; Walser, D.; Rightmire, C. What Is Stimulated Rock Volume? In Proceedings of the SPE Shale Gas Production Conference, Fort Worth, TX, USA, 16–18 November 2009. [Google Scholar]
  43. Ahmed, T. Reservoir Engineering Handbook; Gulf Professional Publishing: Oxford, UK, 2018. [Google Scholar]
  44. Shapiro, S.; Hummel, N. Nonlinear diffusion-based interpretation of hydraulic fracturing induced seismicity. In Proceedings of the 75th EAGE Conference & Exhibition-Workshops, London, UK, 10–13 June 2013. cp–349–00028. [Google Scholar]
  45. Eaton, D.; Caffagni, E.; van der Baan, M.; Matthews, L. Passive seismic monitoring and integrated geomechanical analysis of a tight-sand reservoir during hydraulic-fracture treatment, flowback and production. In Proceedings of the Unconventional Resources Technology Conference, Denver, CO, USA, 25–27 August 2014; pp. 1537–1545. [Google Scholar]
  46. Ren, L.; Lin, R.; Zhao, J. Stimulated reservoir volume estimation and analysis of hydraulic fracturing in shale gas reservoir. Arab. J. Sci. Eng. 2018, 43, 6429–6444. [Google Scholar] [CrossRef]
  47. Li, Q.; Aguilera, R. Parametric probabilistic models for fluid diffusivity inversion and forward microseismic generation using seismicity rates. SPE West. Reg. Meet. 2018. [Google Scholar] [CrossRef] [Green Version]
  48. Xu, Y.; Adefidipe, O.; Dehghanpour, H. Estimating fracture volume using flowback data from the Horn River Basin: A material balance approach. J. Nat. Gas Sci. Eng. 2015, 25, 253–270. [Google Scholar] [CrossRef]
  49. Reynolds, M.; Thomson, S.; Peyman, F.; Hung, A.; Quirk, D.; Chen, S. A Direct Comparison of Hydraulic Fracture Geometry and Well Performance between Cemented Liner and Openhole Packer Completed Horizontal Wells in a Tight Gas Reservoir. In Proceedings of the PSPE Hydraulic Fracturing Technology Conference, Woodlands, TX, USA, 6–8 February 2012; pp. 1–19. [Google Scholar] [CrossRef] [Green Version]
  50. Broger, E.K.; Syhlonyk, G.E.; Zaitlin, B.A. Glauconite Sandstone Exploration: A Case Study from the Lake Newell Project, Southern Alberta. In Petroleum Geology of the Cretaceous Mannville Group Western Canada—Memoir 18; American Association of Petroleum Geologists, AAPG: Tulsa, OK, USA, 1997; pp. 140–168. Available online: http://archives.datapages.com/data/cspg_sp/data/018/018001/140_cspgsp0180140.htm (accessed on 24 November 2020).
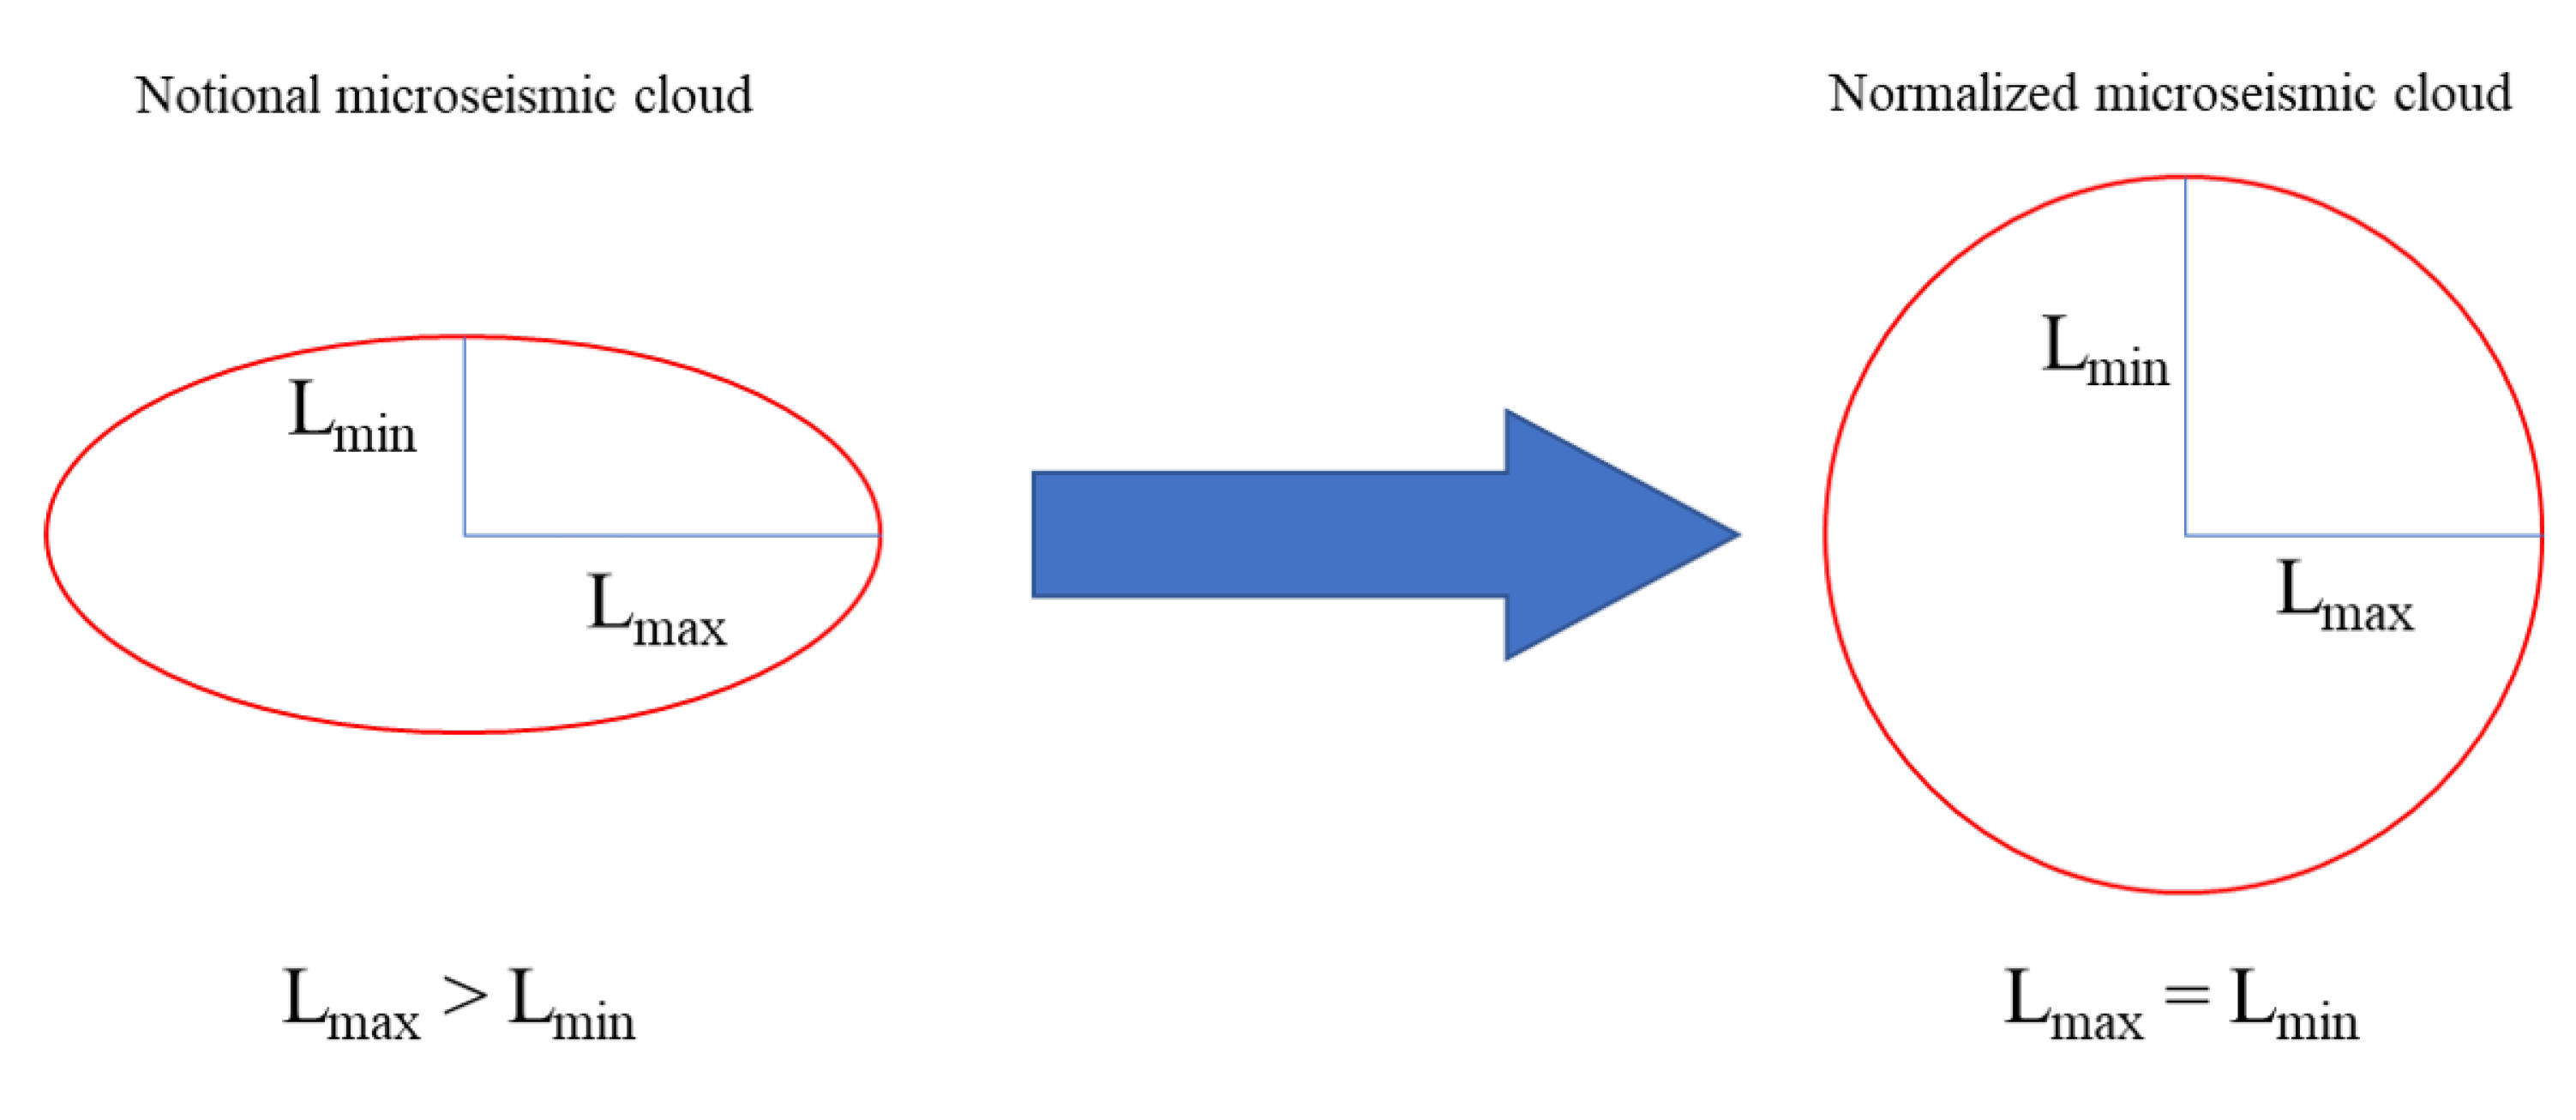
Figure 1. Applying the normalisation method by [44] on a notional stimulated rock volume (SRV) microseismic cloud. The notional microseismic cloud is assumed to be within anisotropic 2-dimensional ellipse. After normalisation, the microseismic cloud can be bounded with a circular shape reducing the analysis to a 1-dimensional scale.
Energies 13 06187 g001
Figure 2. Hoadley field well orientation (a) and simplified stratigraphy (b). Depth histogram of microseismic events. Gray bars indicate total number of microseismic events recorded at a given depth interval during the hydraulic fracturing [18].
Energies 13 06187 g002
Figure 3. Field recorded injection pressure and rate for stage 12 hydraulic fracturing.
Energies 13 06187 g003
Figure 4. Volumetric strain comparison using the injected volume and minimum in-situ stress approaches. The plotted relation suggests that fracture propagates when strain due to injection equals the strain due to minimum in-situ stress.
Energies 13 06187 g004
Figure 5. The planar microseismic event coordinates for stage 12 rotated to align with maximum in-situ stress direction and translated to be relative to injection port coordinates (a). The normalised stage 12 microseismic event coordinates using L m a x = 150 m, L m i n = 50 m, and L i n t = 75 m (b).
Energies 13 06187 g005
Figure 6. The best matching void ratio dependent permeability relation for normalised and isotropic microseismic cloud (a). The denormalised void ratio dependent permeabilities along maximum, minimum, and intermediate in-situ stress directions for stage 12 hydraulic fracturing (b).
Energies 13 06187 g006
Figure 7. The boundary conditions and injection port location. The single headed arrows triangles indicate loading directions and symmetry surfaces, respectively. Red dot represents the location of injection port.
Energies 13 06187 g007
Figure 8. The injection pressure comparison between Equivalent Continuum Methods (ECM), Perkins–Kern–Nordgren (PKN), and Khristianovic–Geertsma–de Klerk (KGD) models against the field observation. As it is observed, the analytical solutions slightly overestimate the injection pressure while ECM shows a good match.
Energies 13 06187 g008
Figure 9. Comparison of fracture length increment along maximum in-situ stress direction using diffusivity, PKN, KGD, and ECM models. The orange dots indicate recorded microseismicity along the maximum in-situ stress direction.
Energies 13 06187 g009
Figure 10. Comparison of fracture length increment along minimum in-situ stress direction using diffusivity and ECM models. The green dots indicate recorded microseismicity along minimum in-situ stress direction.
Energies 13 06187 g010
Table 1. The summary of Glauconite data.
PropertyValue
Porosity8–20% [49]
15 % [18]
Permeability0.001–0.01 mD [49]
0.07 mD [18]
Density2220 kg/m 3 [50]
Depth2075 m [49]
1900 m [18]
Pore pressure
gradient
8.5–16.1 kPa/m [49]
4.86 kPa/m [18]
σ v gradient 24.09 kPa/m [18]
σ H gradient 25.79 kPa/m [18]
σ h gradient 11.66 kPa/m [18]
Young’s
modulus
45.04 GPa [18]
Poisson’s ratio 0.23 [18]
Publisher’s Note: MDPI stays neutral with regard to jurisdictional claims in published maps and institutional affiliations.