Article

Joint Study of Impingement Combustion Simulation and Diesel Visualization Experiment of Variable Injection Pressure in Constant Volume Vessel

School of Automotive Studies, Tongji University, Shanghai 201804, China
*
Author to whom correspondence should be addressed.
Energies 2020, 13(23), 6210; https://doi.org/10.3390/en13236210
Submission received: 26 October 2020 / Revised: 12 November 2020 / Accepted: 23 November 2020 / Published: 25 November 2020

Abstract

:
In this paper, the visualization experiments of spray, ignition, and combustion of diesel under variable injection pressure (from 90 to 130 MPa) were studied by using a constant volume vessel and impinging combustion plate system. With the development of the down-sizing of diesel engines, the wall impinging combustion without liquid spray collision will be the research focus in the diesel engine combustion process. The flame natural luminosity in the experiment represents the soot formation of diesel combustion. Besides, the detailed information of diesel spray mixing combustion was obtained by using the CFD (Computational Fluid Dynamics) simulation of alternative fuels in CONVERGE™. The specific conclusions are as follows. The high velocity of the spray under the higher injection pressure could reduce the low-mixing area near the impinging wall by entraining more air. Under higher injection pressure in simulation, the gas diffused more extensively, and more heat was released after combustion. Therefore, a large amount of soot formed in the early stage of combustion and then oxidized in high-temperature regions, which agreed with the conclusions in the experiments. Under the influence of the superposition of image pixels of the flame, the change of soot generation with injection pressure is smaller than the actual value, so the visualization experiment can be used as the basis of combustion prediction.

1. Introduction

Diesel engines have been widely used in various fields because of their advantages of low fuel consumption, high torque, reliability, and durability. However, the particulate pollution of diesel engines is always hard to tackle, for example, excessive particulate pollutants in the environment will cause air pollution and damage to human health [1,2]. Therefore, as more stringent environmental protection regulations are introduced, there will be more research focus on the efficiency and clean combustion of the diesel engine.
Soot is the main component of diesel particulate pollutants, and its formation process or the nucleation of basic carbon particles mostly occurs in the region with poor mixing area in the combustion process [3,4]. In the internal pollutants control technology, the combustion process is one of the most important reasons for soot generation.
The visualization experiment of spray and combustion has always been a good way to study the diesel engine from the fuel injection to combustion reaction. In the early years, Dec et al. [5] studied the interaction between a diesel engine diffusion flame and combustion chamber wall on an optical engine. From the obtained soot images, they speculated that the soot inside the flame was directly impacted and attached to the combustion chamber wall, and finally found evidence that the soot came from combustion. Dongerbreek [6] and Mueller [7] have verified the direct correlation between the flame nature luminosity and soot generation in the experiments. Therefore, the natural luminosity of the flame can be used as a marker for the generation of soot in the process of fuel combustion, that is, the flame luminosity captured by the camera can be a way to characterize soot.
Injection pressure is one of the most important basic parameters in the fuel injection system of traditional diesel engines. Research proved that as the fuel injection pressure increases, reducing the injection advance angle can improve the heat release rate [8] for the reason that the high injection pressure shortens the ignition time delay and accelerates the combustion reaction in the cylinder [9]. With the increase of diesel engine load, the concentration of particulate matter in the DI diesel engine increases, while the increase of injection pressure reduces the concentration of particulate matter under all loads, namely, reduces soot emission.
With the development of high speed and down-sizing of diesel engines in recent years, the phenomenon of fuel- or flame-wall-impinging combustion in the combustion chamber becomes very common [10,11]. Generally, in a compact combustion chamber, diesel fuel penetrates, atomizes, mixes, and diffuses under high pressure of fuel injection, which determines the flame shape after ignition and forms a wall impinging flame in the combustion. The region where exothermic reaction of the fuel-air mixture leads to the inevitable flame-wall impingement. Studies also have shown that pure flame impingement or gas impingement will promote combustion, while liquid fuel impingement will worsen combustion and increase soot generation [12]. Besides, the schematic diagram of the conceptual model of diesel engine wall impinging combustion proposed by Bruneaux [13] shows that the soot generation area is mainly concentrated in the impinging area near the wall plate.
From the perspective of the physical phenomena of fuel spray and flame combustion, the injection pressure could have an important impact on the fuel spray configuration, the air entrainment in the cylinder, and the mixing of fuel and gas. Many visualization experiments on injection pressure have shown that the air entrainment intensity of fuel spray will be enhanced under higher injection pressure [14,15]. Especially under the ultra-high injection pressure with a high-pressure common rail system, the fuel-air mixing is greatly enhanced [16]. The study on the structure and visualization of fuel spray also shows that the increasing injection pressure leads to the increase of jet velocity and turbulence intensity and the obvious changes in spray velocity. The distance of liquid spray penetration and the area of spray increase during the same period [17,18], accelerating the spray evaporation [19]. Under the relative lower injection pressure (about 200–600 bar) of diesel engines, the morphology of liquid spray varies significantly. However, the injection pressure for the high-pressure-common-rail-system of diesel engines is usually larger than 800 bar, so there is no difference in the diesel spray when the injection pressure increases [20]. Moreover, when the wall impingement phenomena exist, the injection pressure has a different impact on combustion flames and the mixed quality of the fuel during the combustion process because of the interaction between diesel and cylinder waste. Under the condition of free flame diffusion, when the injection pressure increase, the width of flame shape increases, and the length decreases, forming the large-volume flam with a large flame reaction area. Besides, the increase of injection pressure reduces the size of fuel droplets and increases the mixing speed, leading to the increase of the flame temperature and the reduction of the emission of CO and soot particles [21].
The research on the combustion in the constant volume vessel under fixed-injections condition showed that with the increase of injection pressure, the gas spray spreading diameter along the impinging wall plate and fuel-air mixing area near the impinging wall became larger [22]. The delay of ignition will decrease with the increase of injection pressure, and the reaction velocity will increase significantly, enabling the diesel spray to reach the equivalence ratio of reaction start more quickly [19]. With the increase of the injection pressure, the flame lift-off length decreases [23] and the intensive soot intensity captured by the camera is located in the axial direction of the impinging area, forming a fuel concentrated area near the wall plate [24].
Few studies have been conducted on spray and flame-wall in the same condition, because of the restriction on different experimental setups and boundary conditions of spray, ignition, and flame imaging in the constant volume vessel. The fuel injection system of modern diesel engines is designed to avoid the collision between the liquid diesel spray and the piston surface, but the limited space of the cylinder and piston still has a direct influence on the mixing and diffusion of the fuel, which will affect the subsequent combustion.
To sum up, the effect of fuel injection pressure needs deep study by modern engine design, especially when the wall impinging phenomenon exists, which will further affect the flame diffusion process and the final emission after combustion. Based on the experiment of a single hole injector in the constant volume combustion vessel, this article studied the complete evolution process of diesel fuel from spray to ignition to combustion flame wall under different injection pressure conditions by using CFD simulation. The effects of injection pressure on the wall impingement, flame propagation, and soot generation of diesel were studied by the simulation of fuel combustion in the constant volume vessel of the CONVERGE™ (Version 2.4.0, Convergent Science, Inc., Madison, WI, USA).

2. Experimental and Simulation Setup

2.1. Visualization Experiment Platform and Wall Plate Impingement System

The following Figure 1 is the layout of the visualization experiment platform with a fuel common rail system, enabling the injection pressure to reach 90–130 MPa.
The wall impingement system is equipped with the constant volume vessel, in which the distance between the wall plate and injection nozzle is determined by the combustion chamber parameters of a typical diesel engine, as shown in Figure 2.
There are three different imaging methods (as shown in the Table 1 and Figure 3) used in the visualization experiment, namely spray, ignition, and flame imaging.
For the backlight projection imaging of fuel spray, we can capture the shape of the spray phase at different times by using high-power LED light and optical path arrangement of frosted glass. Flame luminescence includes chemiluminescence and soot incandescence [25,26], through the reduced light direct imaging, the chemiluminescence of low-temperature combustion can be filtered with the ND(neutral dimmer)8 filter, and the high-temperature incandescence of soot can be retained, to reflect the formation of soot and characterize the emission to a certain extent.
Table 2, as follows, shows the experimental conditions of the temperature and pressure construction in the constant volume vessel and the fuel injection setups. These parameters were determined by the pressure and temperature in the cylinder at the beginning of fuel injection under a certain working condition. Each experiment under the same conditions was repeated at least three times. Besides, the target engine equips a 6-holes injector, and the fuel injection mass is 138 mg under this working condition. Therefore, in the constant volume bomb experiment, the injection mass of the single hole injector is fixed at 23 mg.

2.2. CFD Simulation Conditions in CONVERGE™

As shown in the following Figure 4, the spray and combustion simulation is accomplished by simulating the structure of the constant volume vessel and the distance between the injection nozzle to the impinging wall. Through the user-defined injection parameters, the whole injection process can be simulated.
In this simulation, it is necessary to fix the injection mass at 23 mg, which is the same as in the experiment by one of the working conditions.
The KH+RT injection model is used to get the spray results information under different injection pressures. The Sage combustion model and Hiroyasu soot generation model are used in the combustion simulation calculation, and the combustion period in the simulation is calibrated by the reaction time of the experiment. The major settled parameters in the CFD model are shown in the following Table 3.
The spray, combustion temperature, and soot generation evaluation of diesel in the constant volume vessel were simulated by using fuel n-Heptane (C7H16), which is often used in heavy duty diesel engine simulation.

3. Results and Discussion

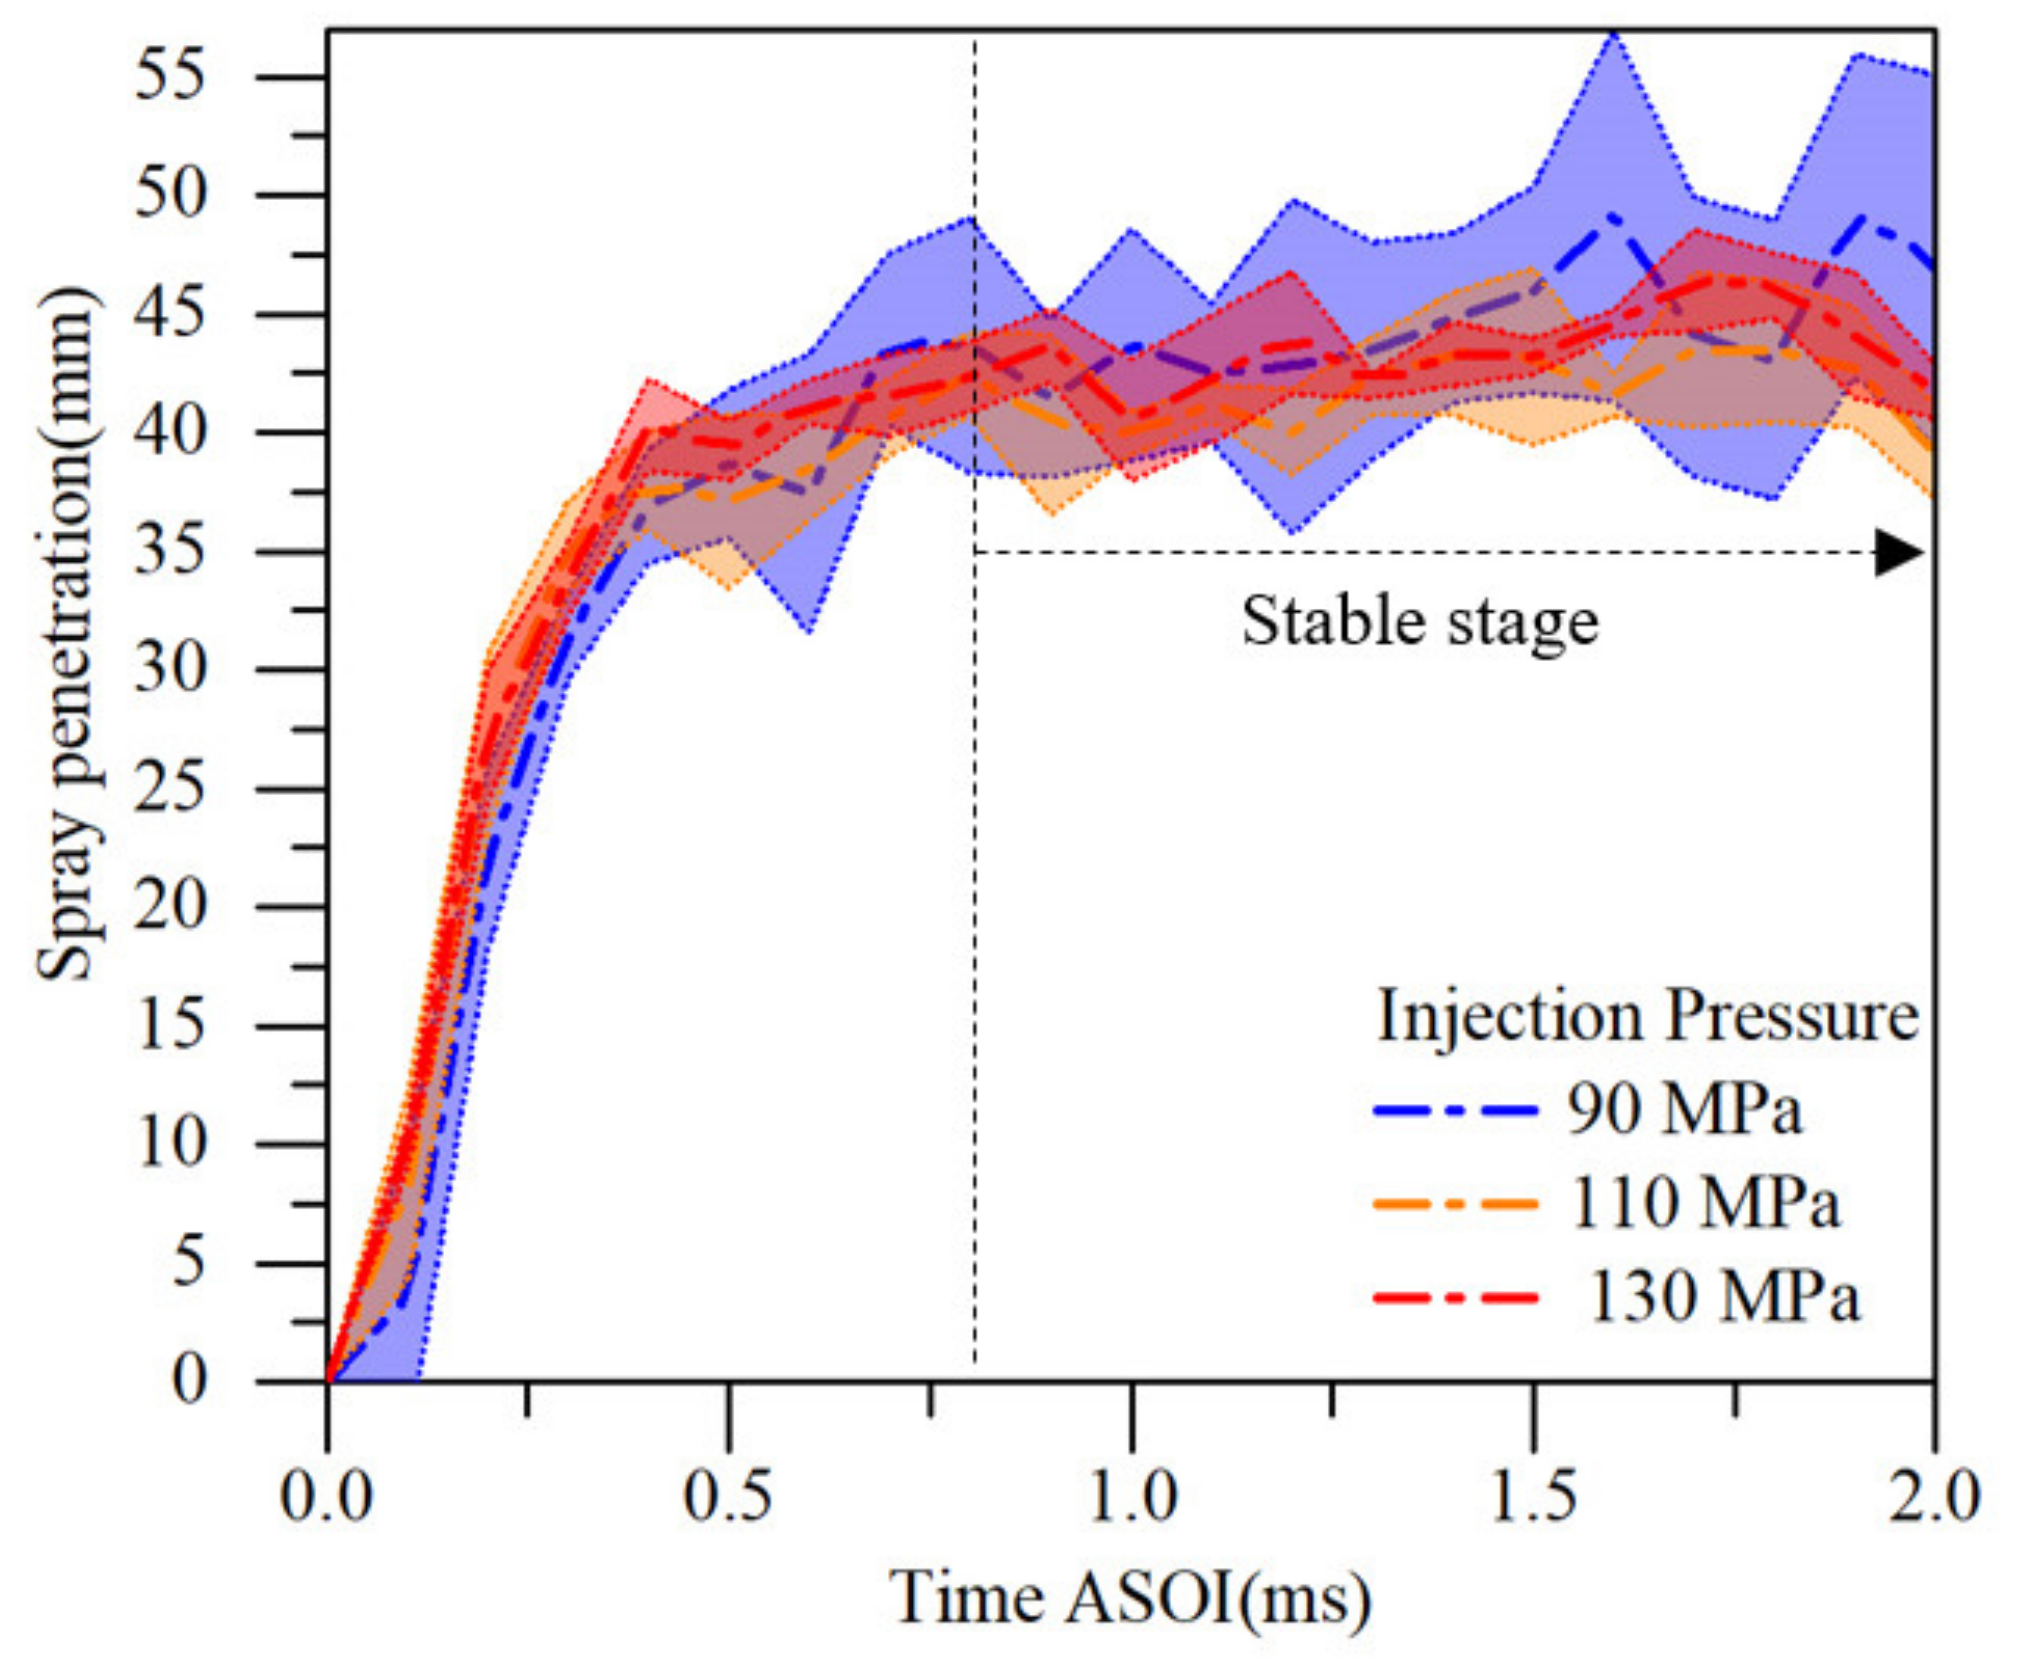
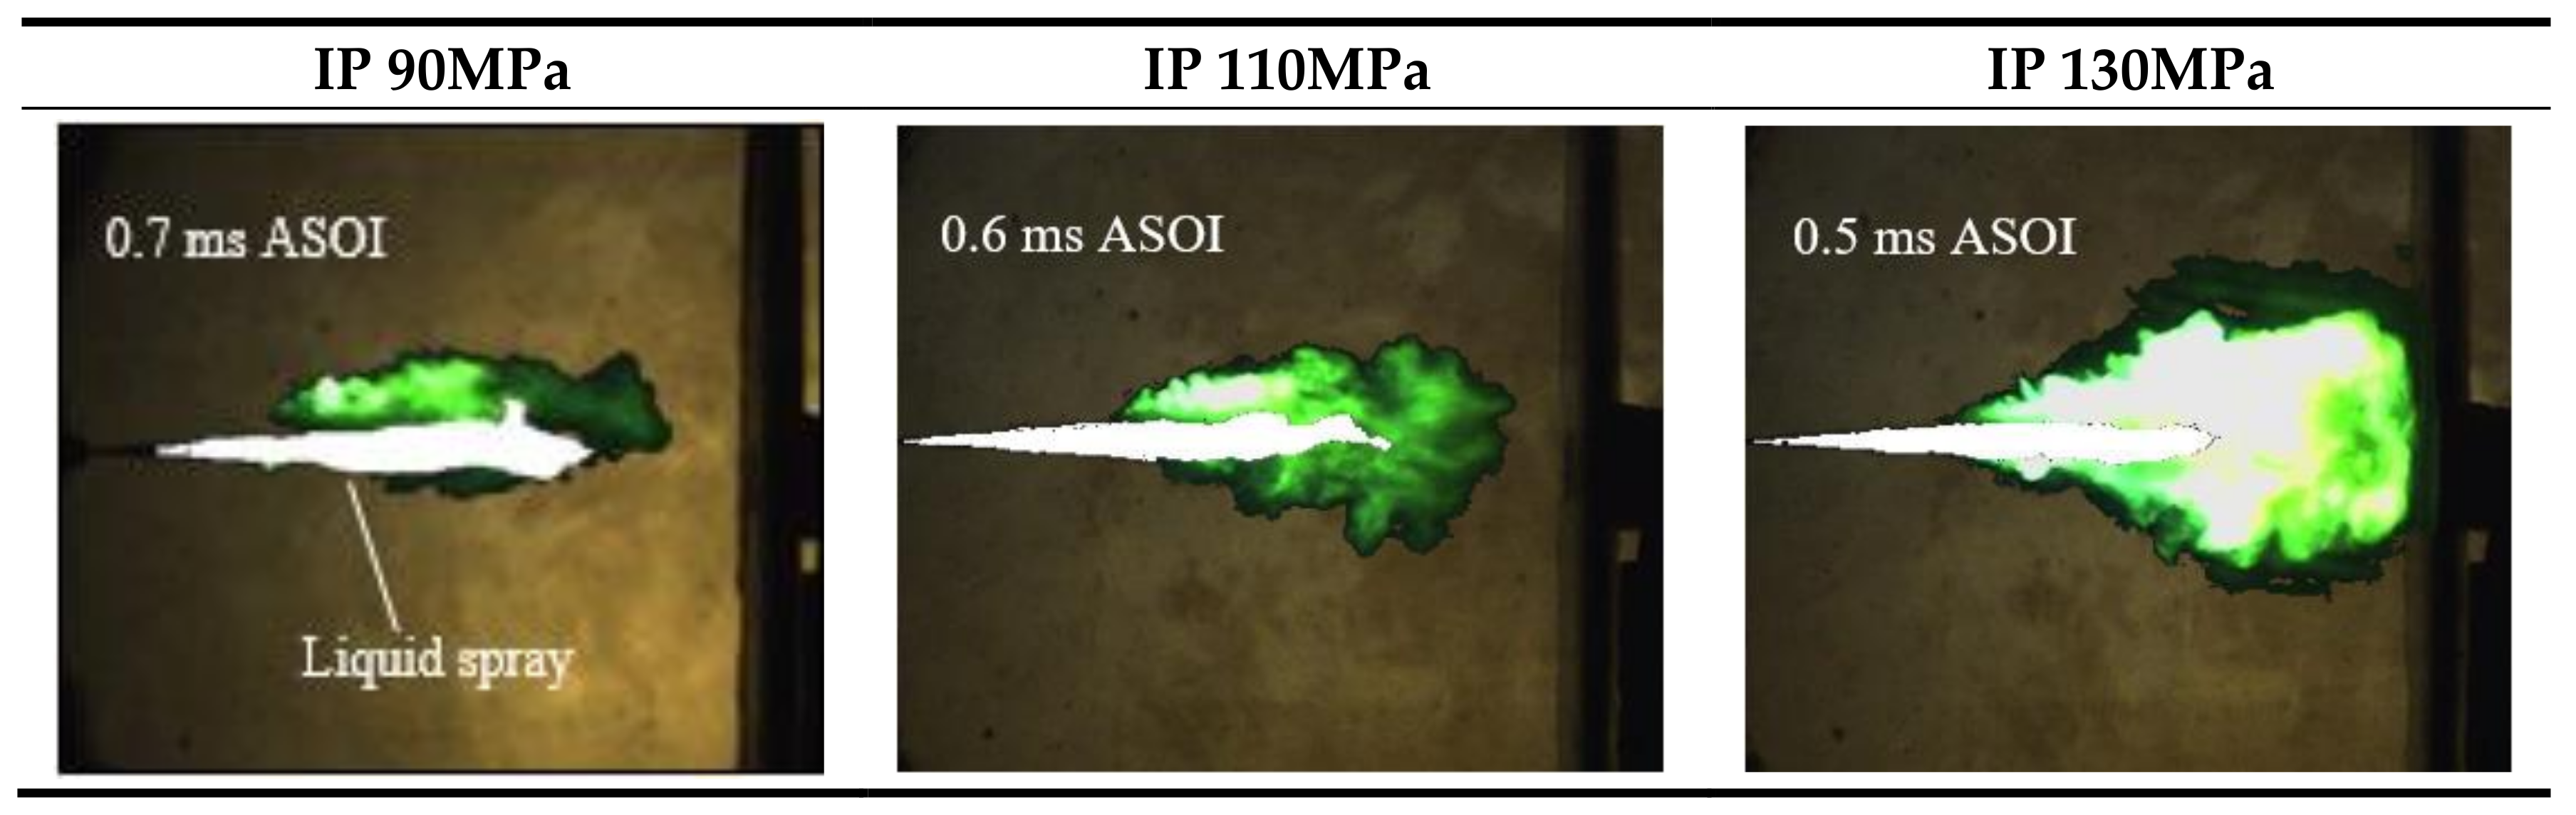
3.1. Spray Images and Spray Penetration

The following Figure 5 shows spray images with the binary graphs of the spray liquid phase. The fuel diffusion and gas mixture is an intermediate process between liquid spray and gaseous spray without obvious boundary in the initial images, so a threshold is needed to determine the main body of the spray jet.
As can be seen from the images, there is no obvious difference in the stable stage of the spray shape according to different experiments of high injection pressures under the high pressure common rail injection system. The specific spray penetration and the error bars can be obtained through the binary graphs in the following Figure 6.
With the increase of injection pressure, the spray penetration velocity increases, but the spray penetrations in the stable area overlap with each other and there is no obvious trend change. Therefore, the injection pressure has no definite influence on the liquid spray penetration.
Similarly, the liquid area of spray is not directly related to the injection pressure and the fuel spray velocity is mainly affected by the injection pressure.
The range of spray penetration can be used to calibrate the parameters of the simulation. The following Figure 7 is a simulation of the penetration distance of the spray liquid by using CONVERGE™.
The predicted trend as a function of injection pressure is consistent with that of the experiments. The main difference is the high speed of initial spray development under high injection pressure.
In the simulation of the spray development process, we can further observe the changes in the microscopic parameter changes that cannot be measured in these experiments. The following images in Figure 8 show the fuel equivalence ratio distribution under different injection pressures.
Under the high injection pressure of 110 and 130 MPa, the velocity of fuel and the velocity of the fuel-air mixture accelerated obviously and the mixing quality of the fuel spray periphery is better than that of 90 MPa. This means that there are more areas to achieve the conditions of ignition and combustion at the same moment.
The Figure 8 shows that the boundaries of the main spray jets are different under each injection pressure, which means that there are more low-equivalent ratio regions that meet the conditions of combustion at the same time. However, higher injection pressure can improve the poor mixing area near the impinging plate.
Similar to the conclusion of liquid fuel impingement, even if the liquid penetration distance does not reach the length of the impinging wall plate, the worst mixing region is near the wall and forms a high equivalence ratio fuel concentration area that is not conducive to combustion.
Additionally, due to the high kinetic energy brought by high injection pressure, the highspeed fuel spray will extend wider along the wall plate at the same time and form a larger mixed gas space.

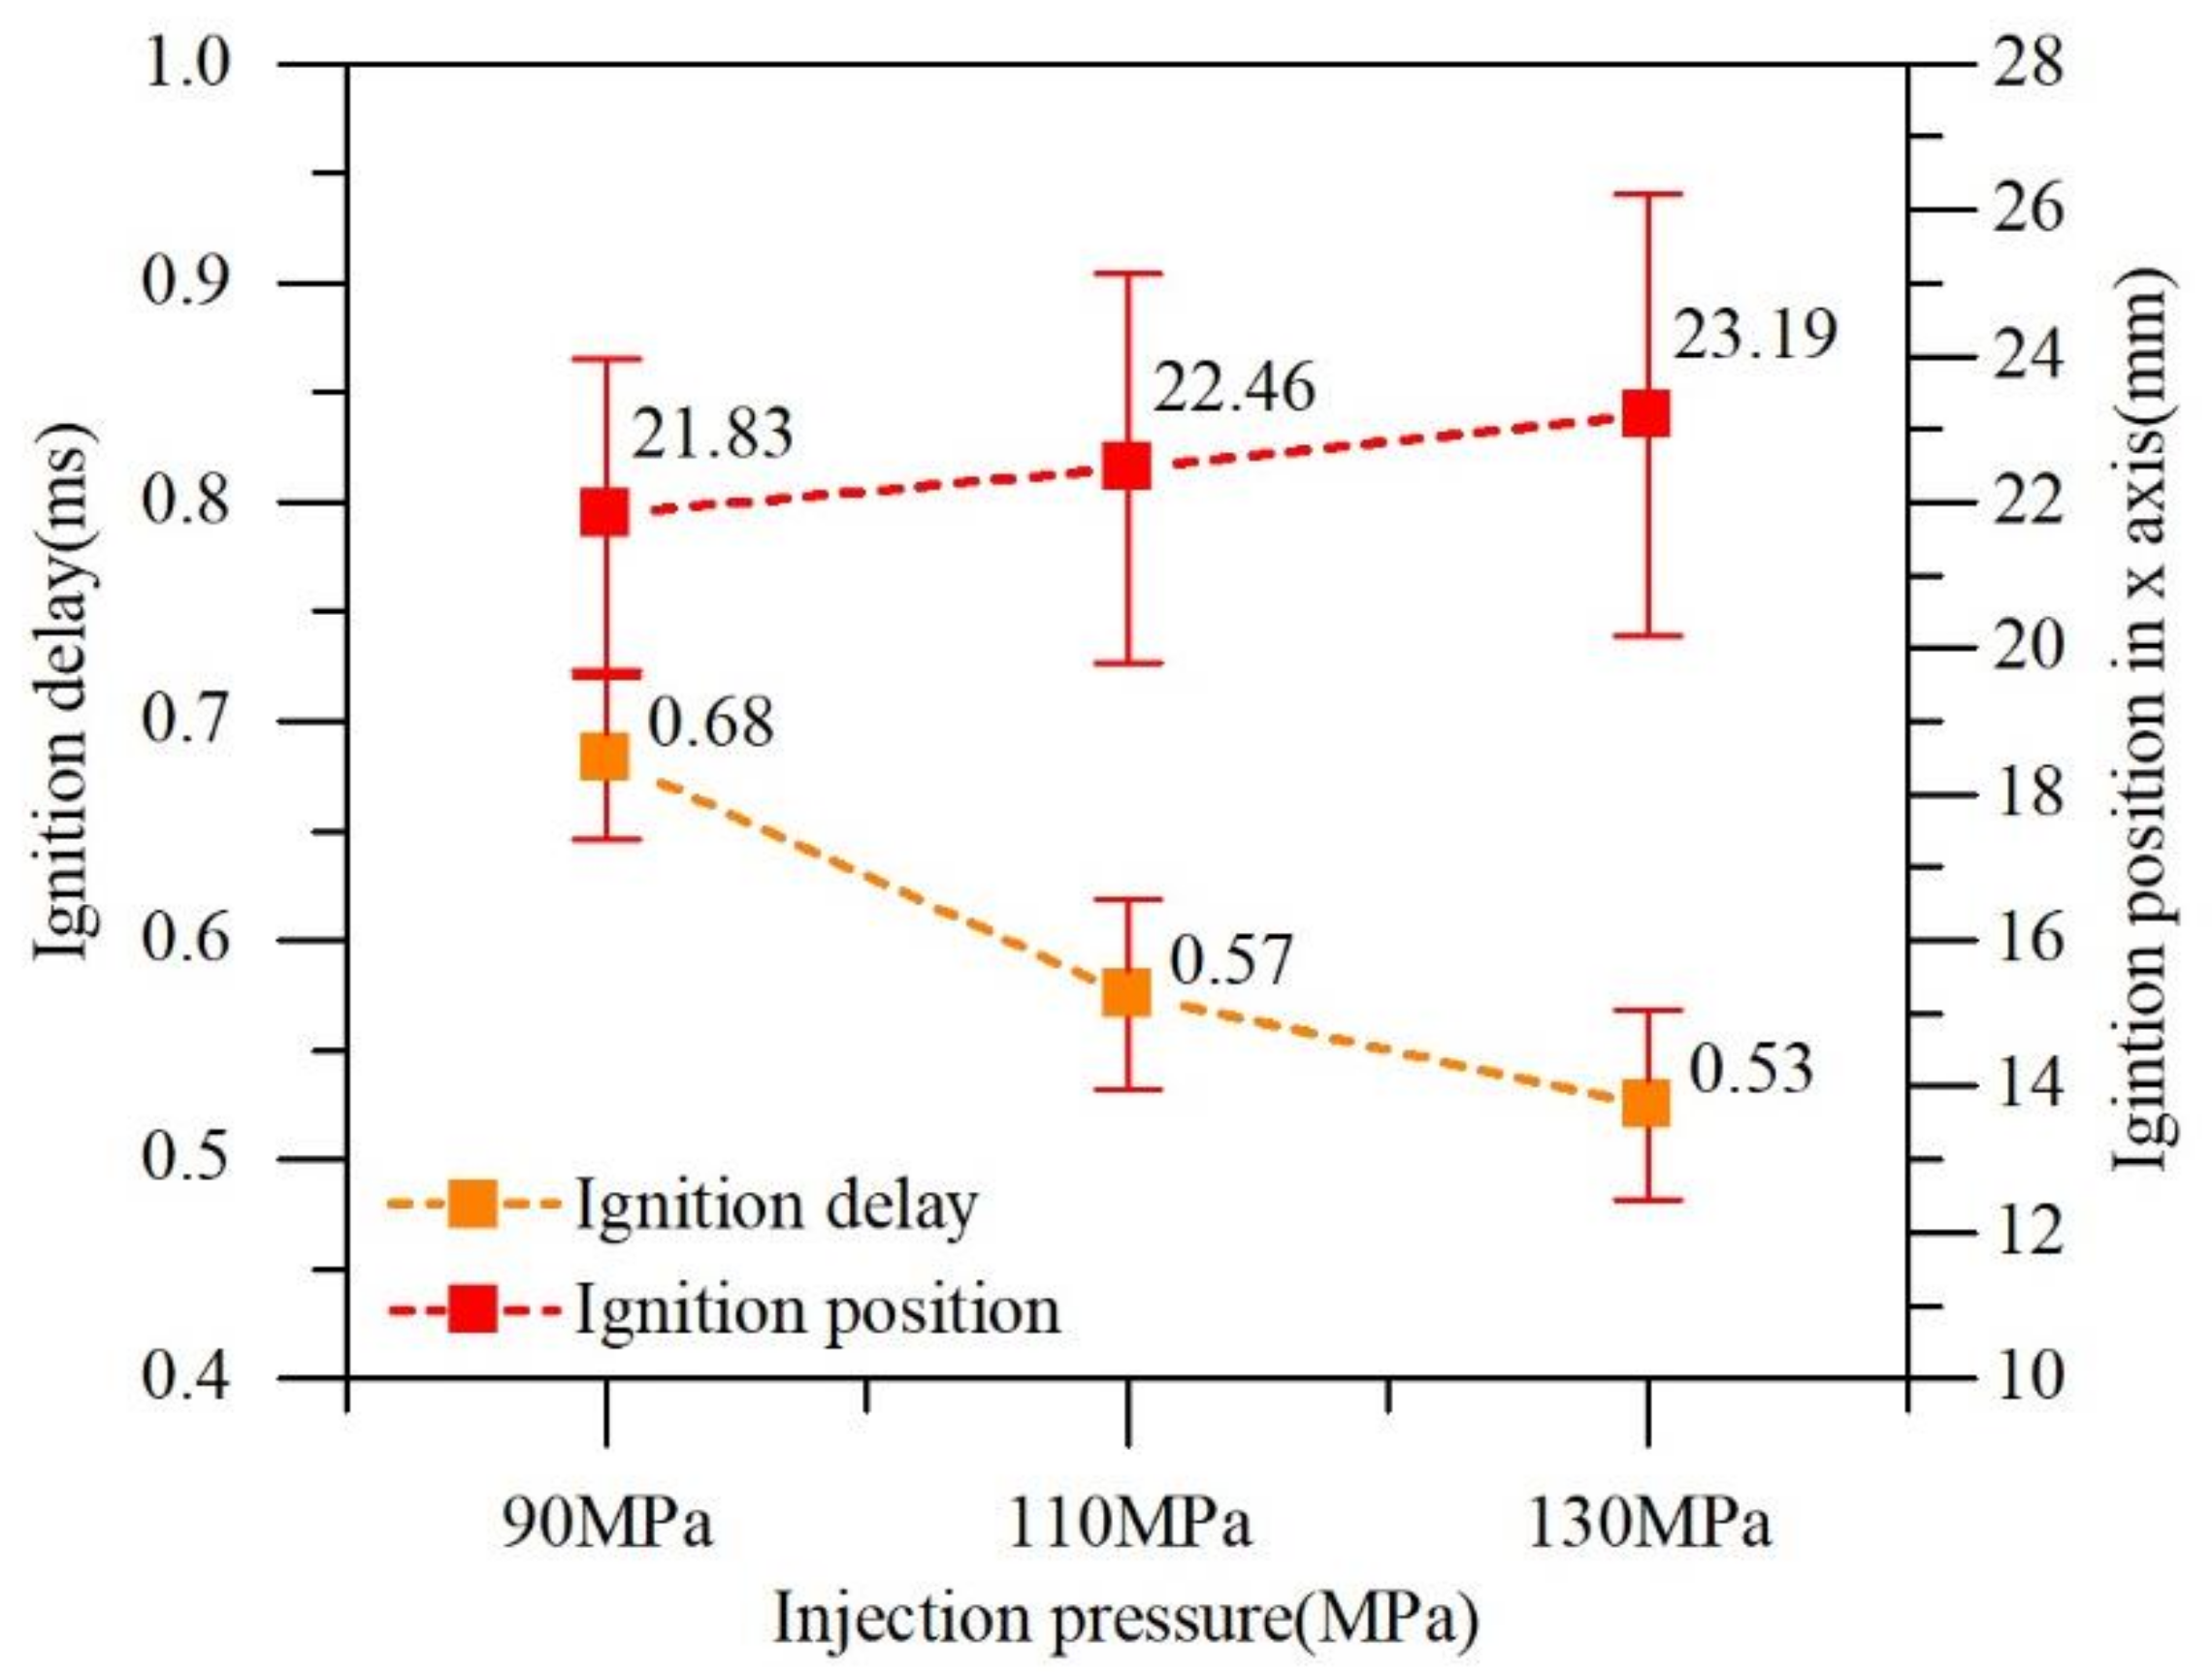
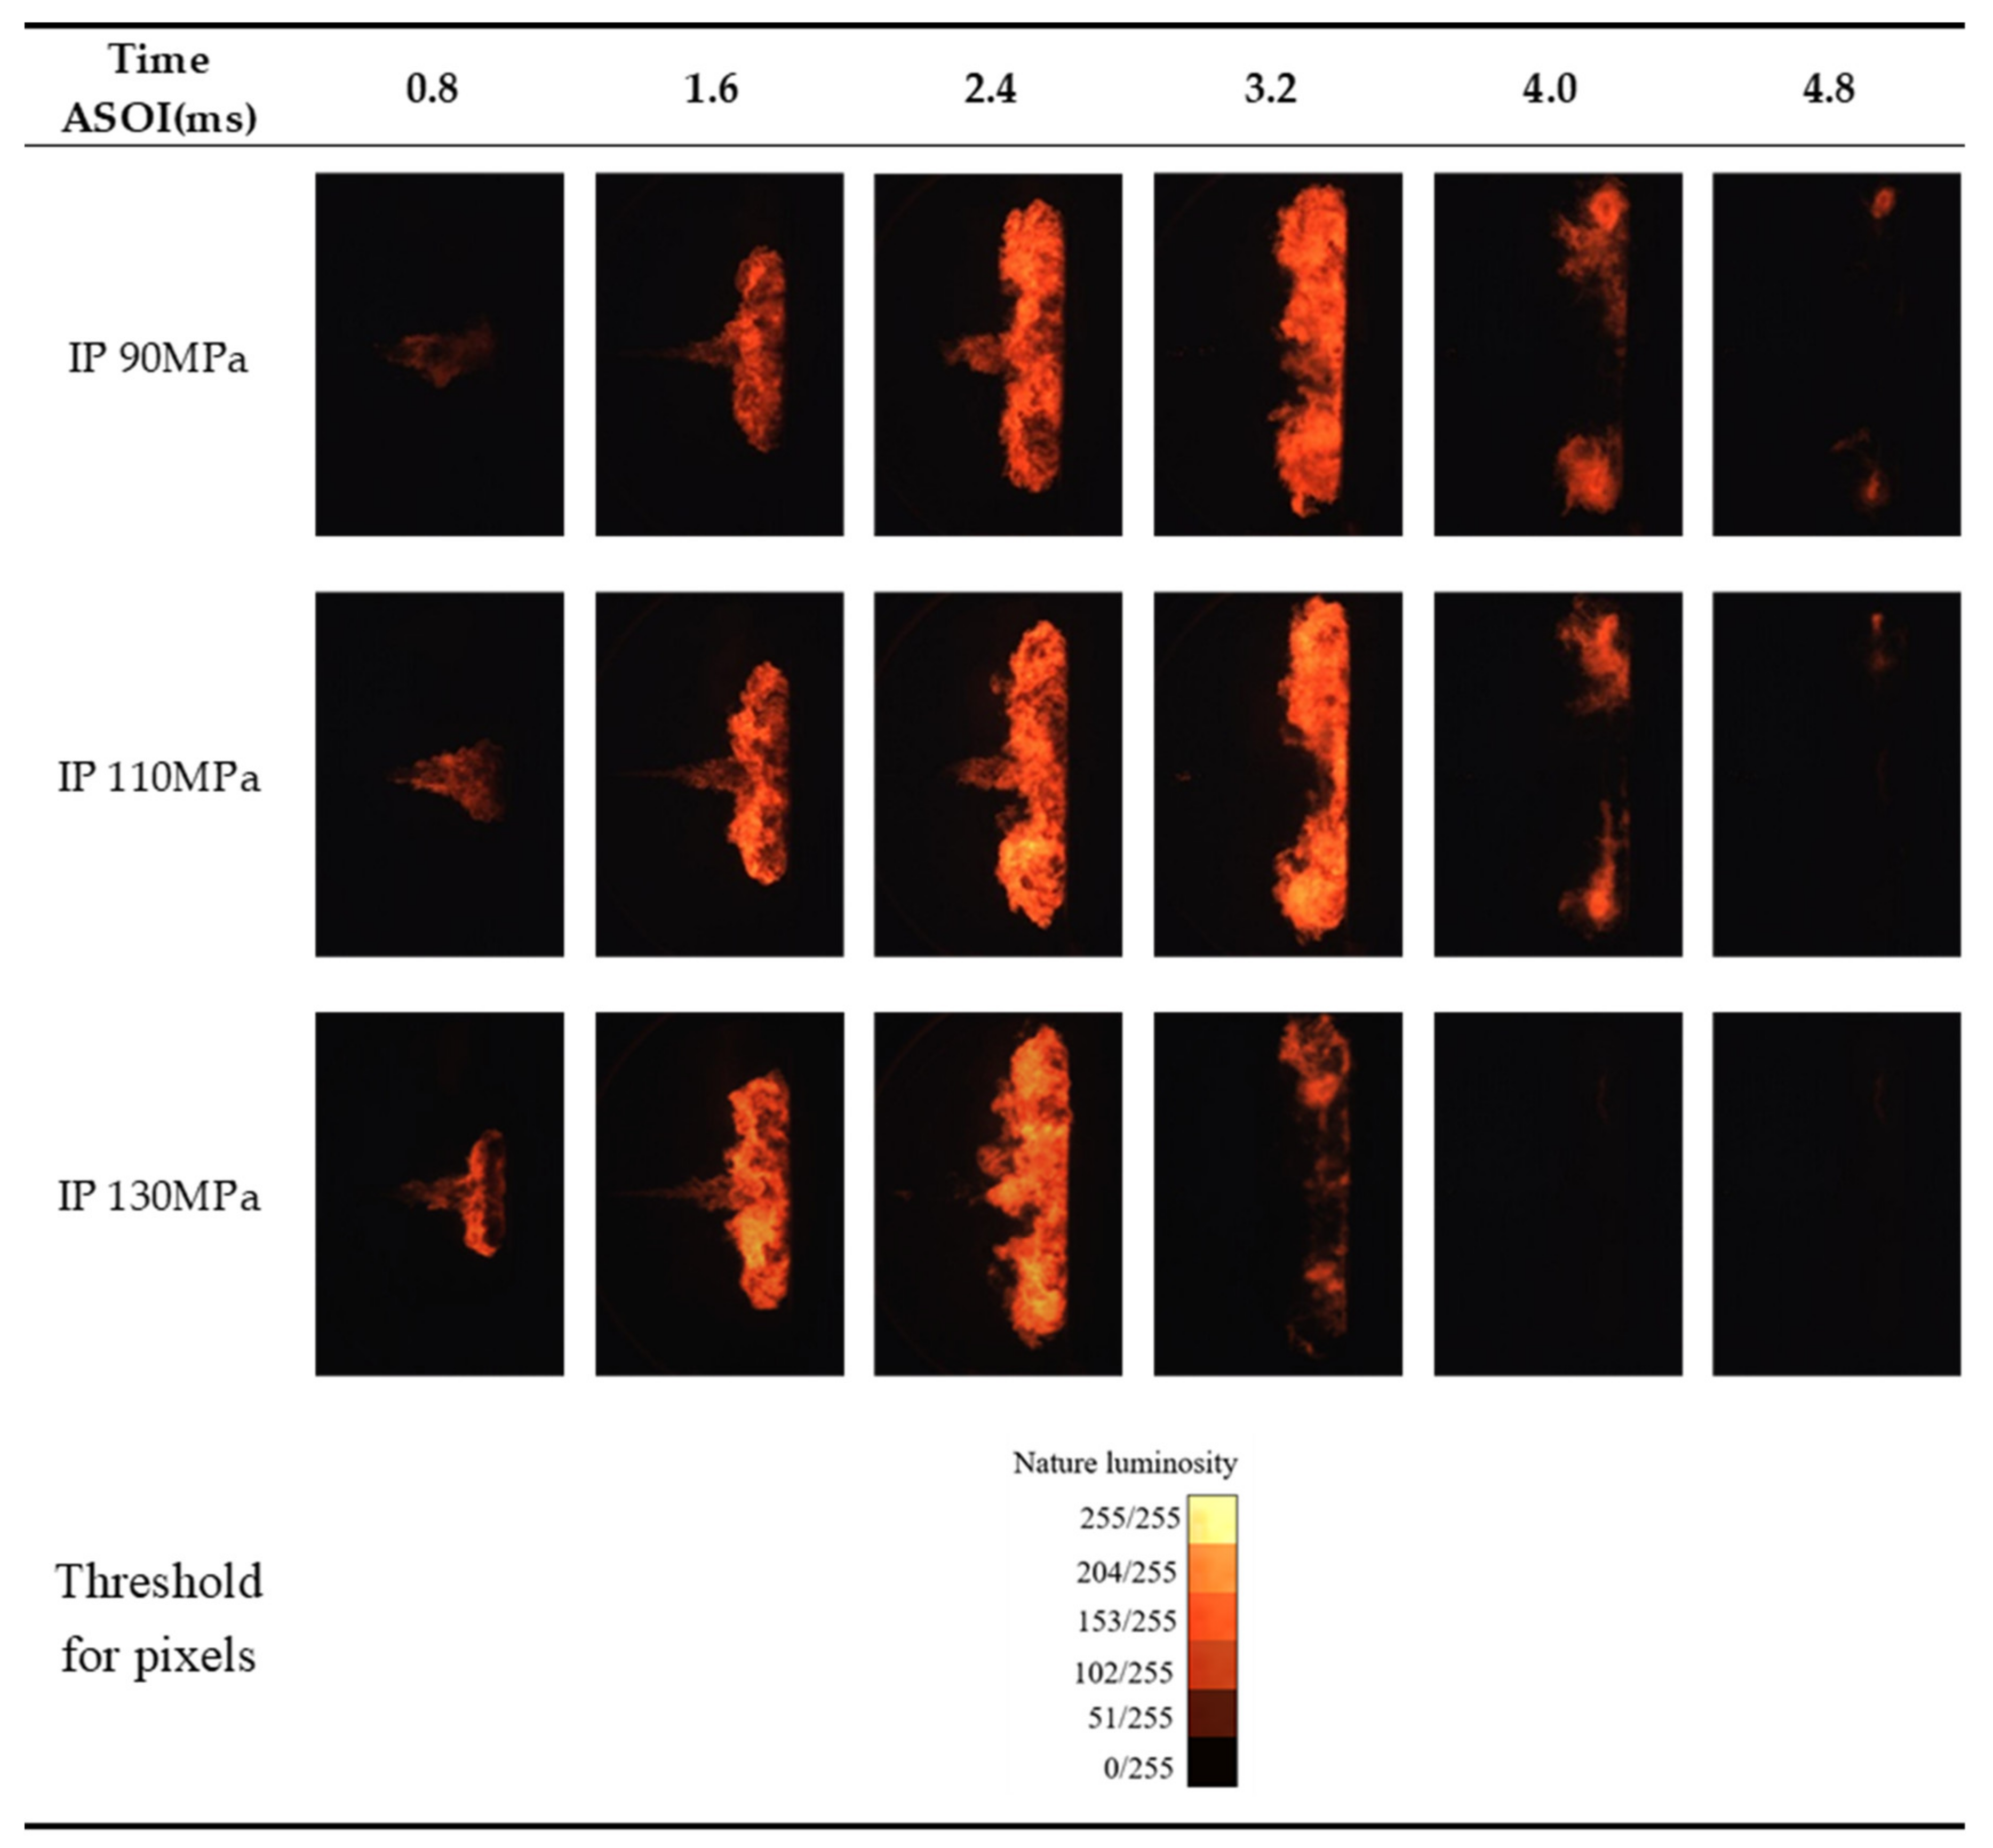
3.2. Ignition Images and Analysis

The following images in Figure 9 are the ignition images at different initial ignition times and the corresponding liquid spray form.
The ignition axial position and ignition time delay under different injection pressures are shown in the Figure 10 below.
Under higher injection pressure, the ignition response is accelerated because the high pressure enhances the air entrainment of the diesel mist and improves the overall fuel air mixing quality so that the equivalence ratio required for ignition can be achieved faster in the fuel injection process.

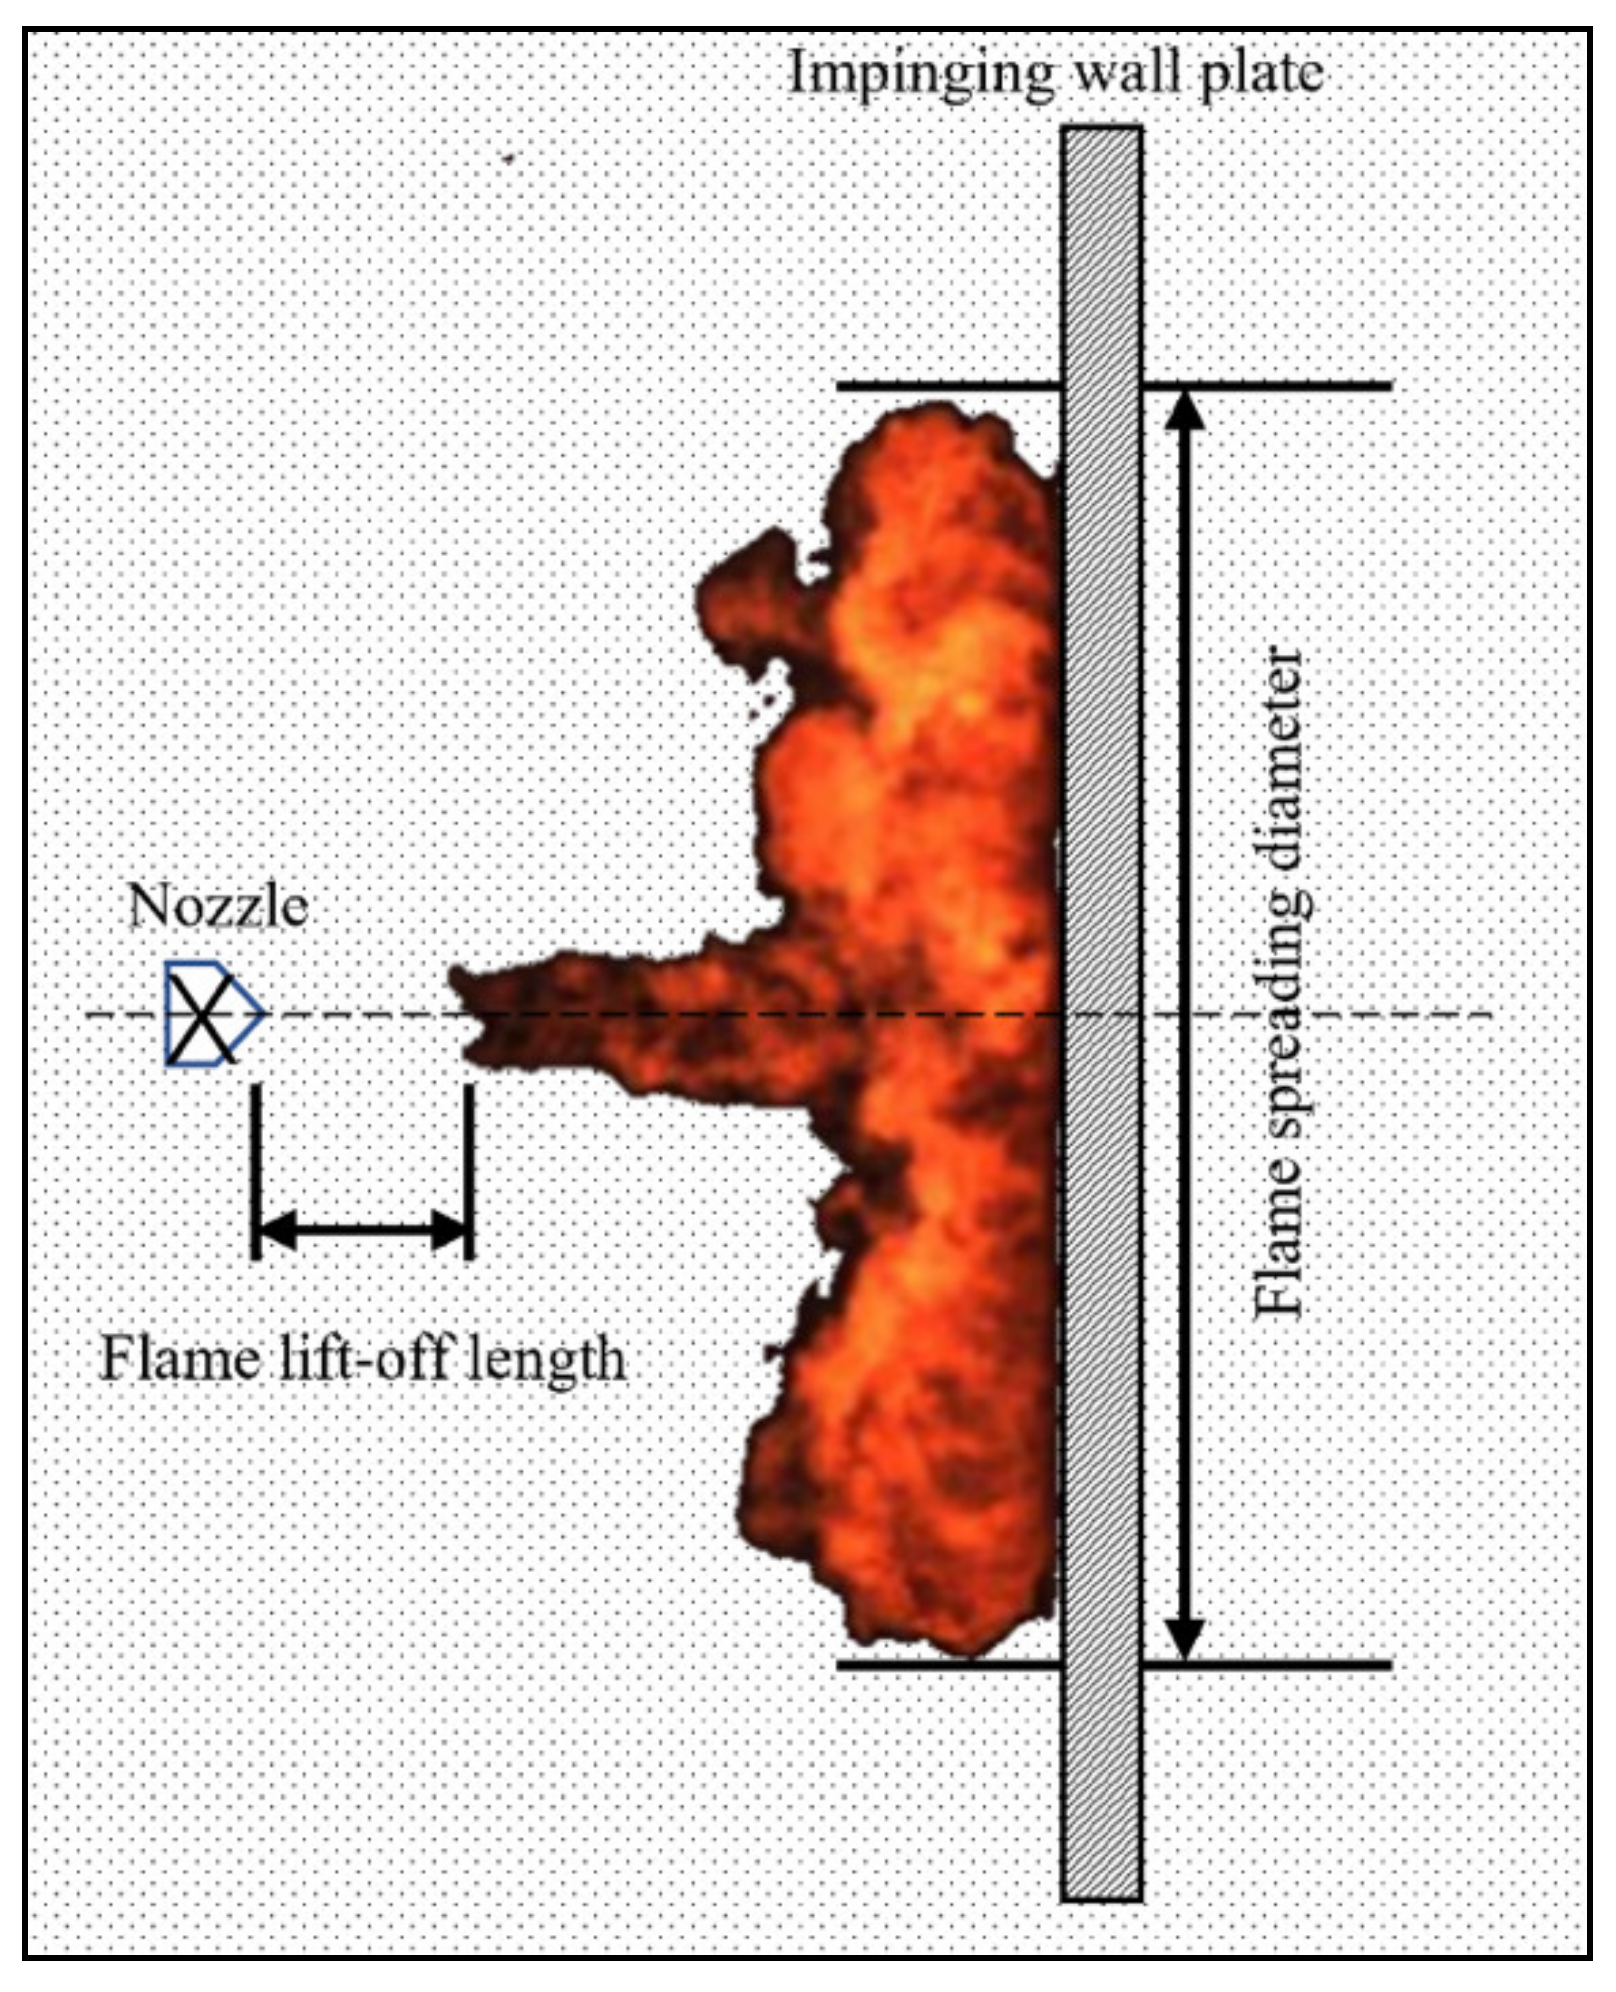
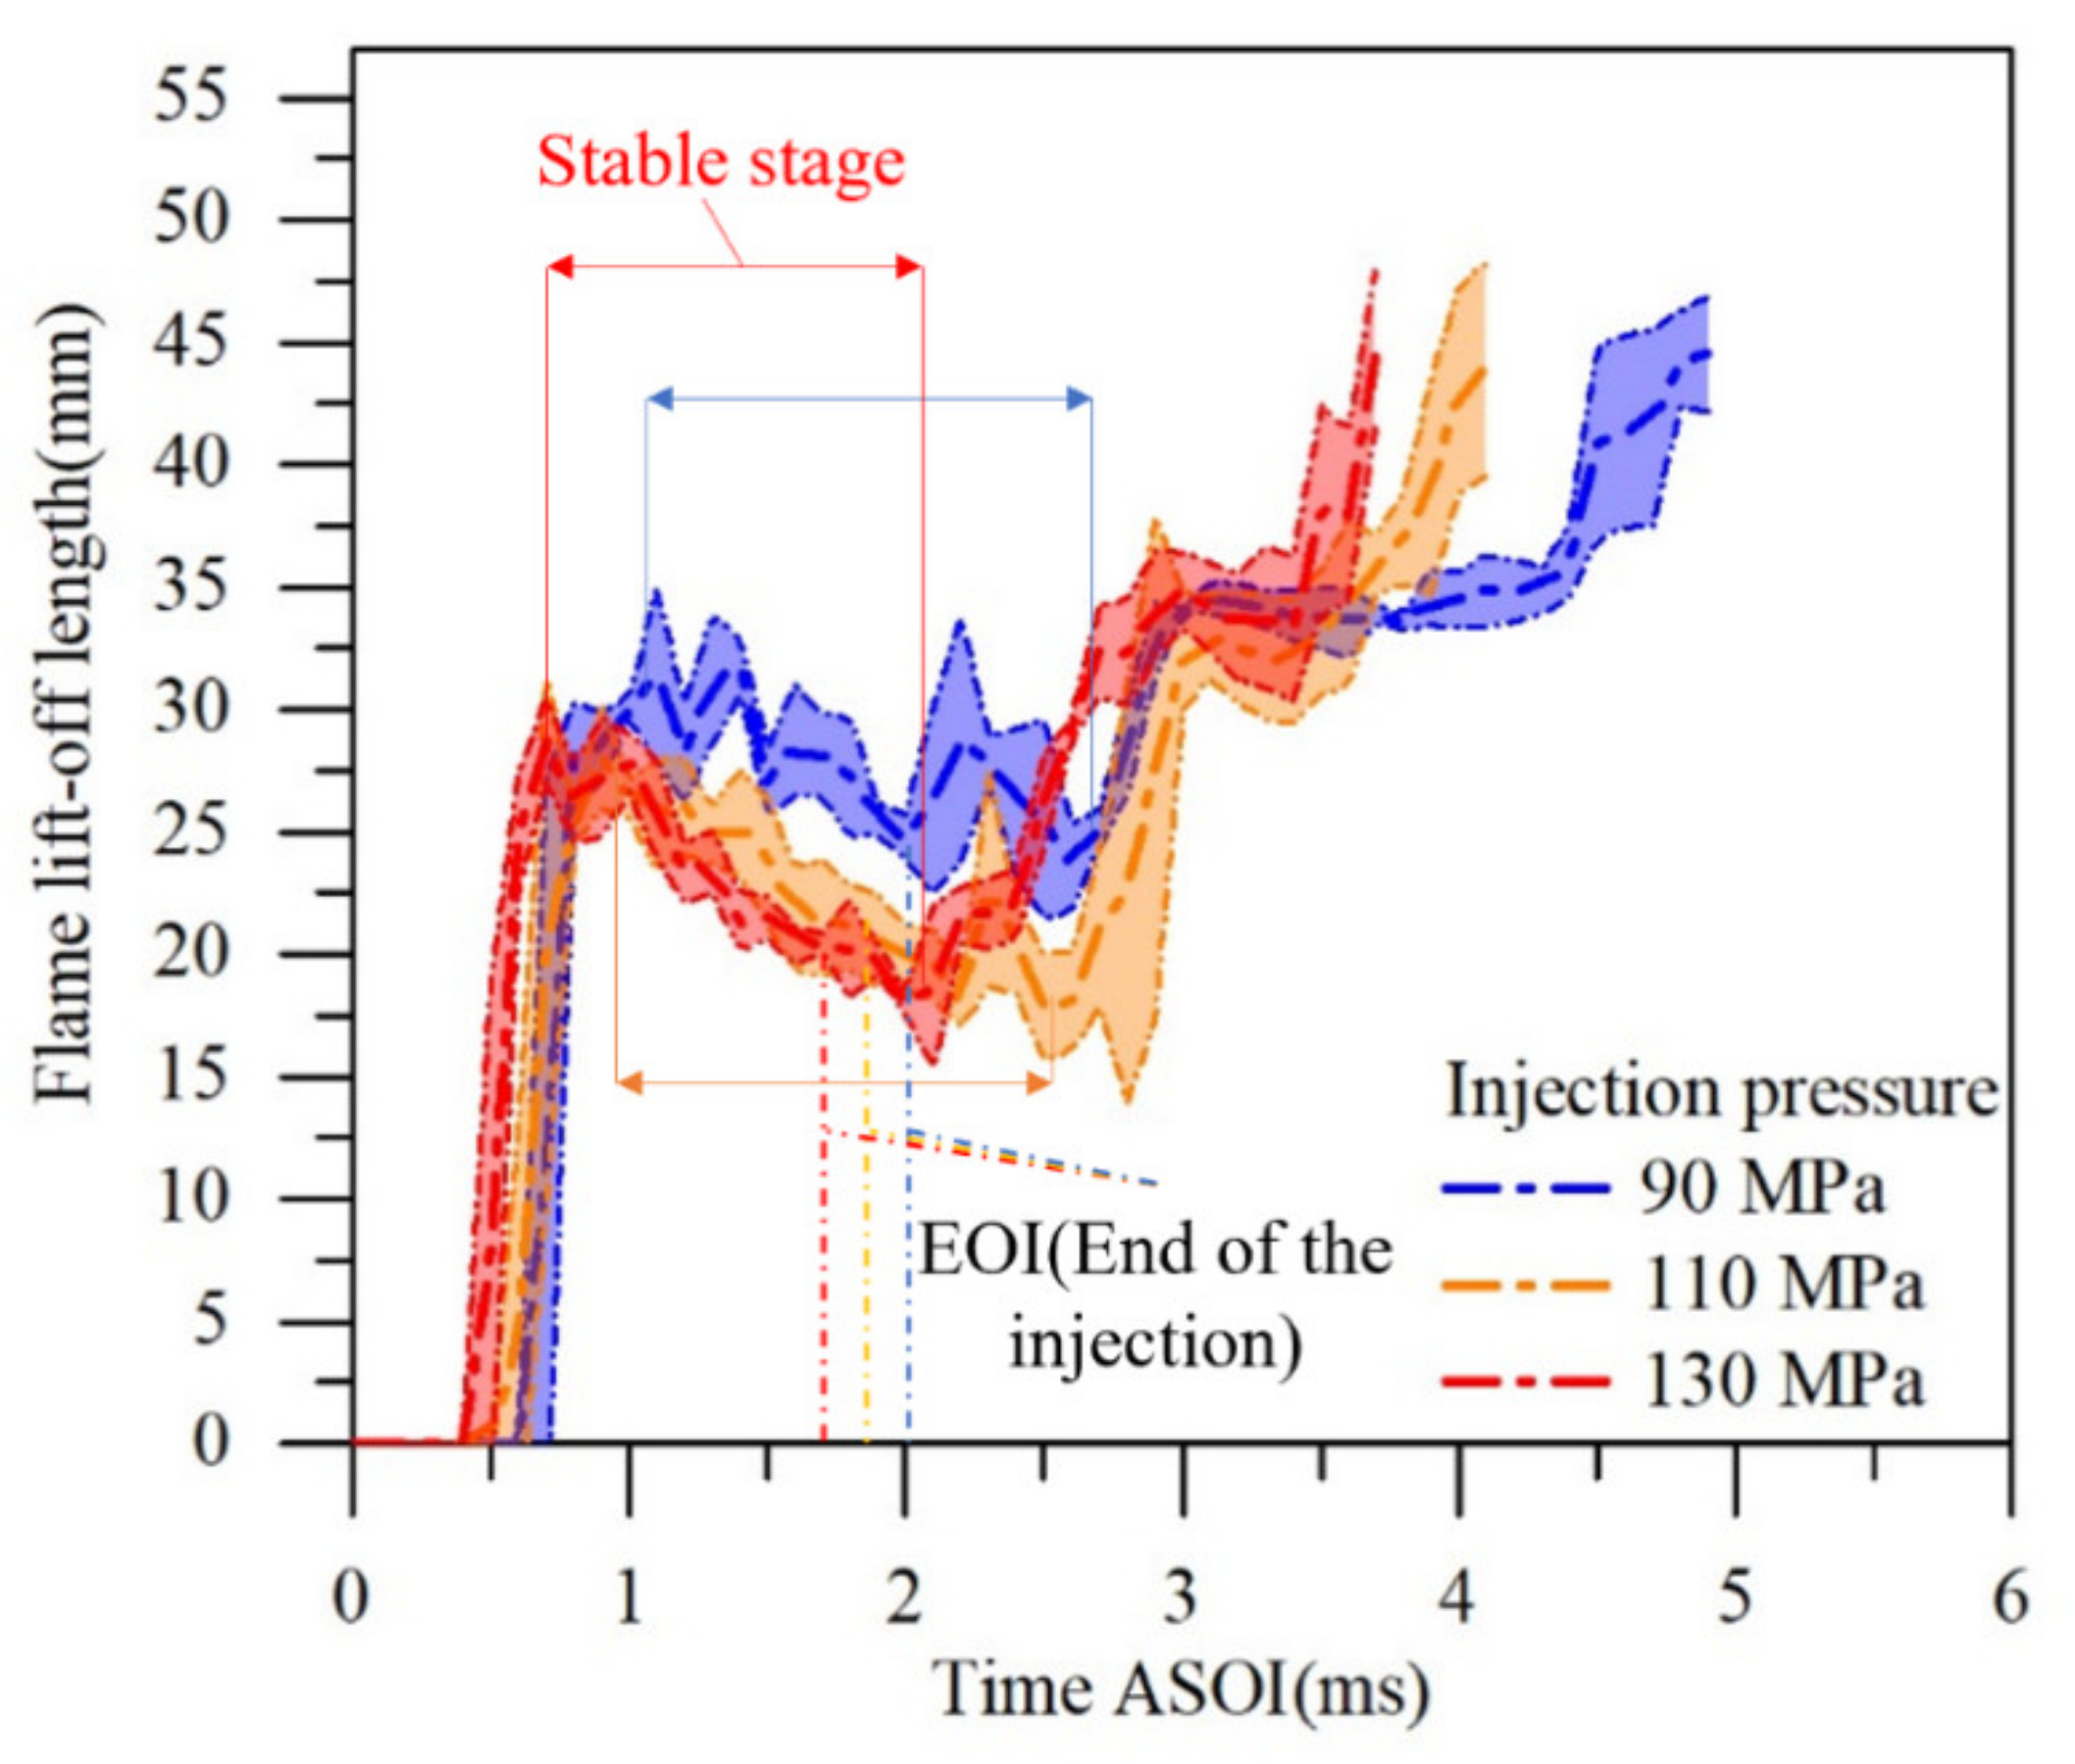
3.3. Flame lift-Off Length and Diffusion Area

The geometric parameters of the flame shape in this experiment are shown in Figure 11 below.
The following Figure 12 shows the images of the flame nature luminosity by using the highspeed camera.
Under high injection pressure, the period from the initial flame appearance to the flame complete disappearance is shorter. High injection pressure accelerates the overall combustion velocity of diesel with the same fuel mass.
The following Figure 13 shows the trend of flame upstream length under different injection pressures.
The flame lift-off length is the length when the upstream flame reaches the maximum value and tends to become smooth [27]. The value of the flame lift-off length is close to the nozzle as the injection pressure increases, indicating that the distance from the diesel spray under the higher fuel injection pressure to the flammable equivalence ratio is shorter.
The flame diffusion area is the projection surface that the flame captured by the camera naturally emits luminosity. It is the actual area corresponding to the diffusion flame, which was influenced by the mixing and diffusion of diesel and air during the injection combustion process, as shown in Figure 14 below.
Under high injection pressure, the flame diffuses earlier due to the short ignition delay, but the diffusion velocity of the whole flame in the space is not significantly different from that at low injection pressure. However, the maximum flame diffusion area is larger under high injection pressure because of the higher kinetic energy of fuel and gas mixing, making the gas spray more widely distributed in the space.

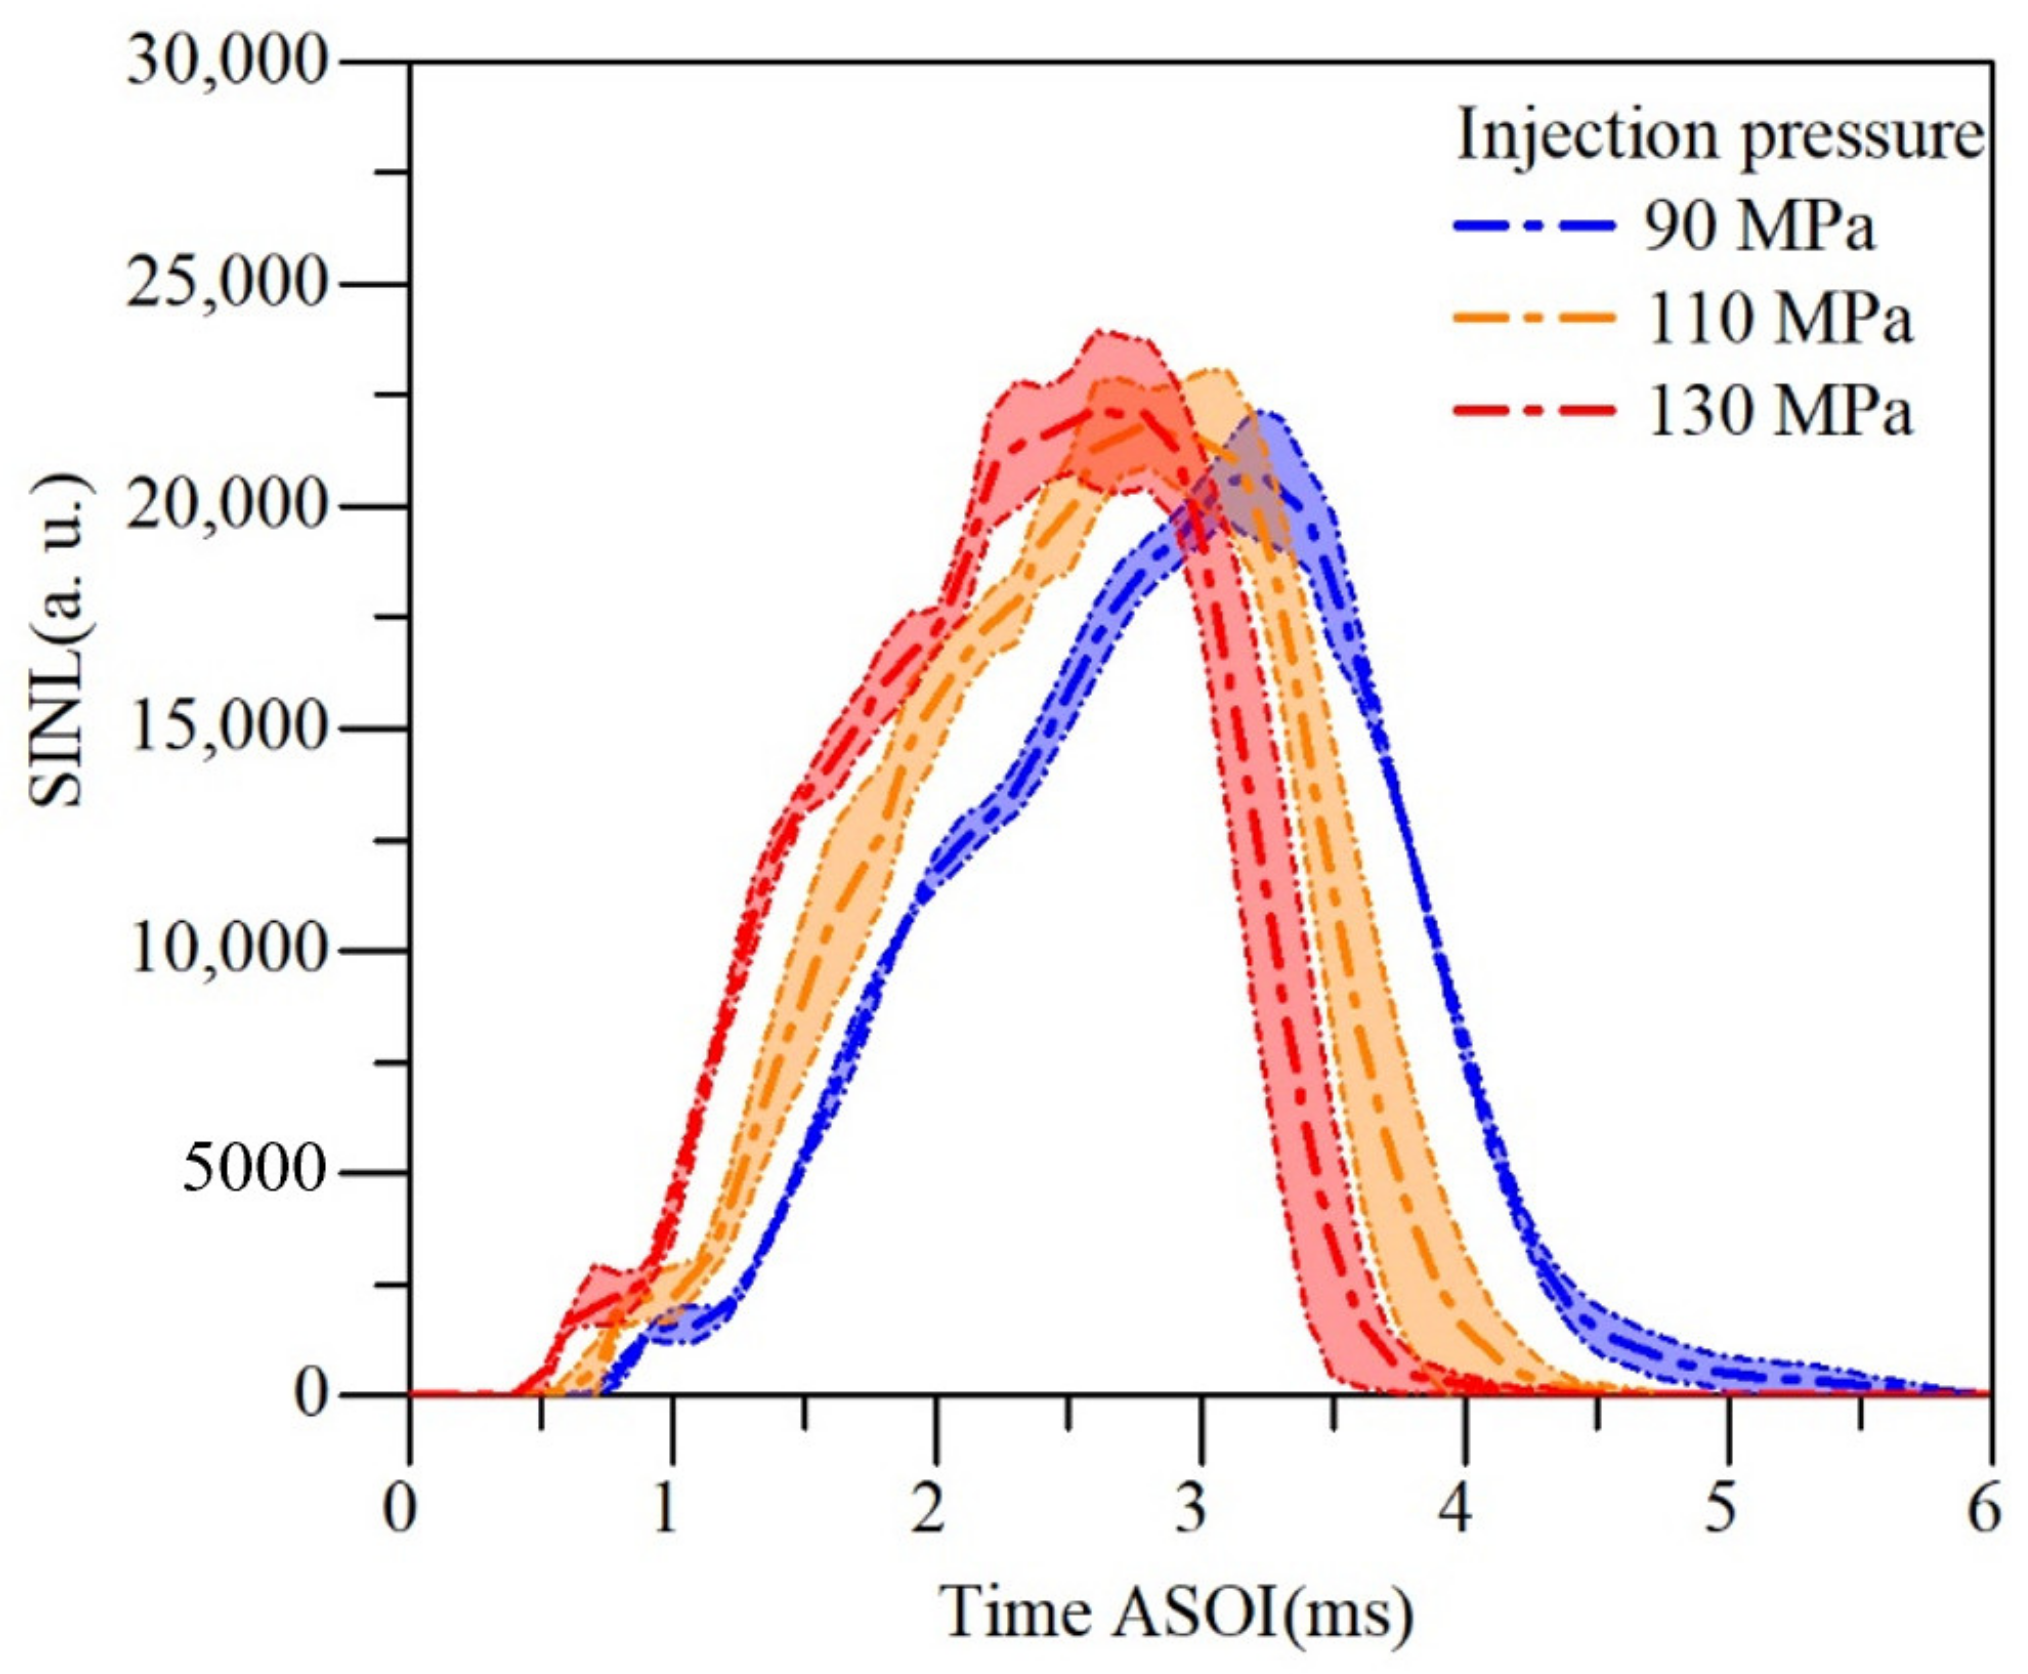
3.4. Flame Spatially Integrated Natural Luminosity (SINL) and Time Integral Natural Luminosity (TINL)

The spatial integral nature luminosity of the flame is obtained by the spatial summation of the brightness values of all pixels in the flame image of each frame, representing the instantaneous soot generation in the combustion process [27,28,29]. The shape of flame diffusion can be regarded as the radial projection of the space flame development. By using the axisymmetric relation of the injection spray axis, the SINL development trend in the following Figure 15 can be obtained by accumulating and integrating the flame nature luminance value.
The peak value of SINL increases in this diagram, mainly due to the larger maximum flame diffusion area under high injection pressure. The large flame area results in the increased accumulated pixels and the total brightness. From the integral relationship, the flame diffusion area reflects the distribution of high temperature flame in space, that is, in the same combustion period, the high temperature range under high injection pressure is relatively larger.
The initial soot generation time is significantly advanced under higher injection pressure, and the overall combustion speed is significantly accelerated, making the overall soot generation period shorter.
By integrating the SINL of the time during the combustion, we can further analyze the generation of soot by using the TINL (time integral natural luminosity) in the following Figure 16.
As shown in results, with the increase of injection pressure, the difference of total soot generation under various injection pressures is not obvious. However, due to the shortened reaction period, the total amount of instantaneous smoke generation decreases with the higher injection pressure, which is conducive to rapid combustion and reduces soot emission [30]. Compared with the soot generation under the IP at 90 MPa, the total soot generation of the 110 and 130 MPa have decreased by 0.5% and 1.2%, respectively.

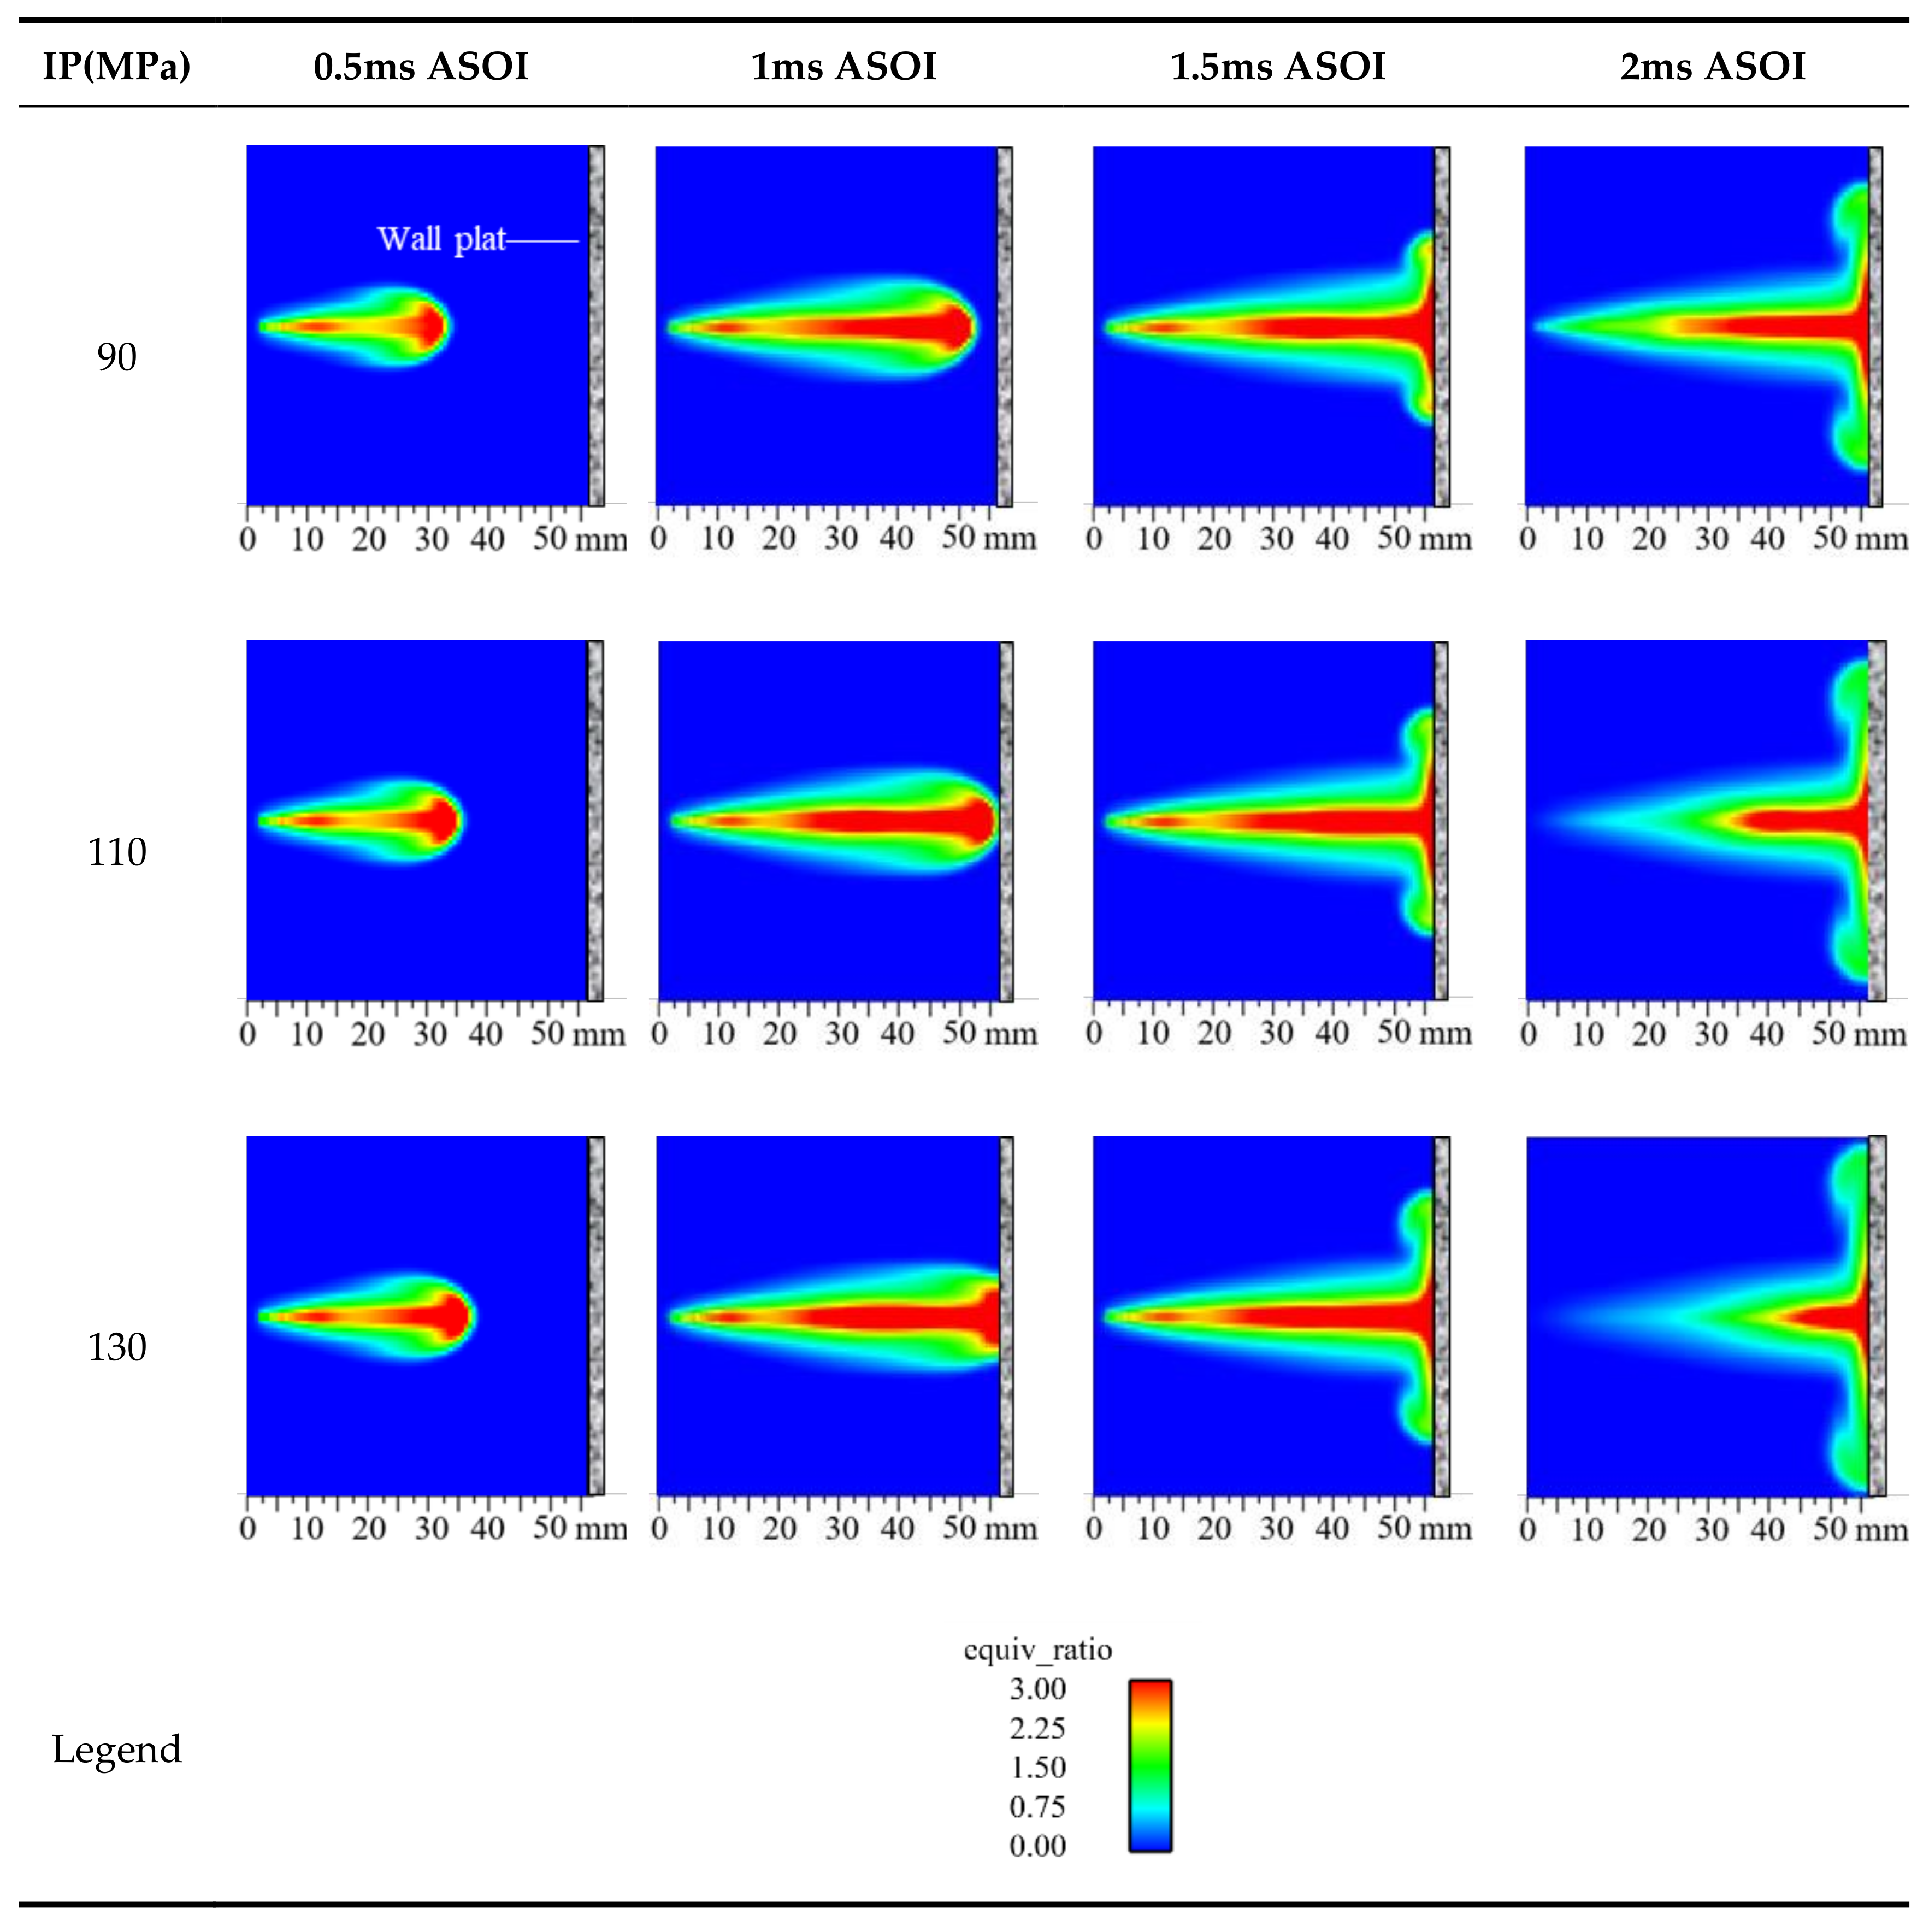
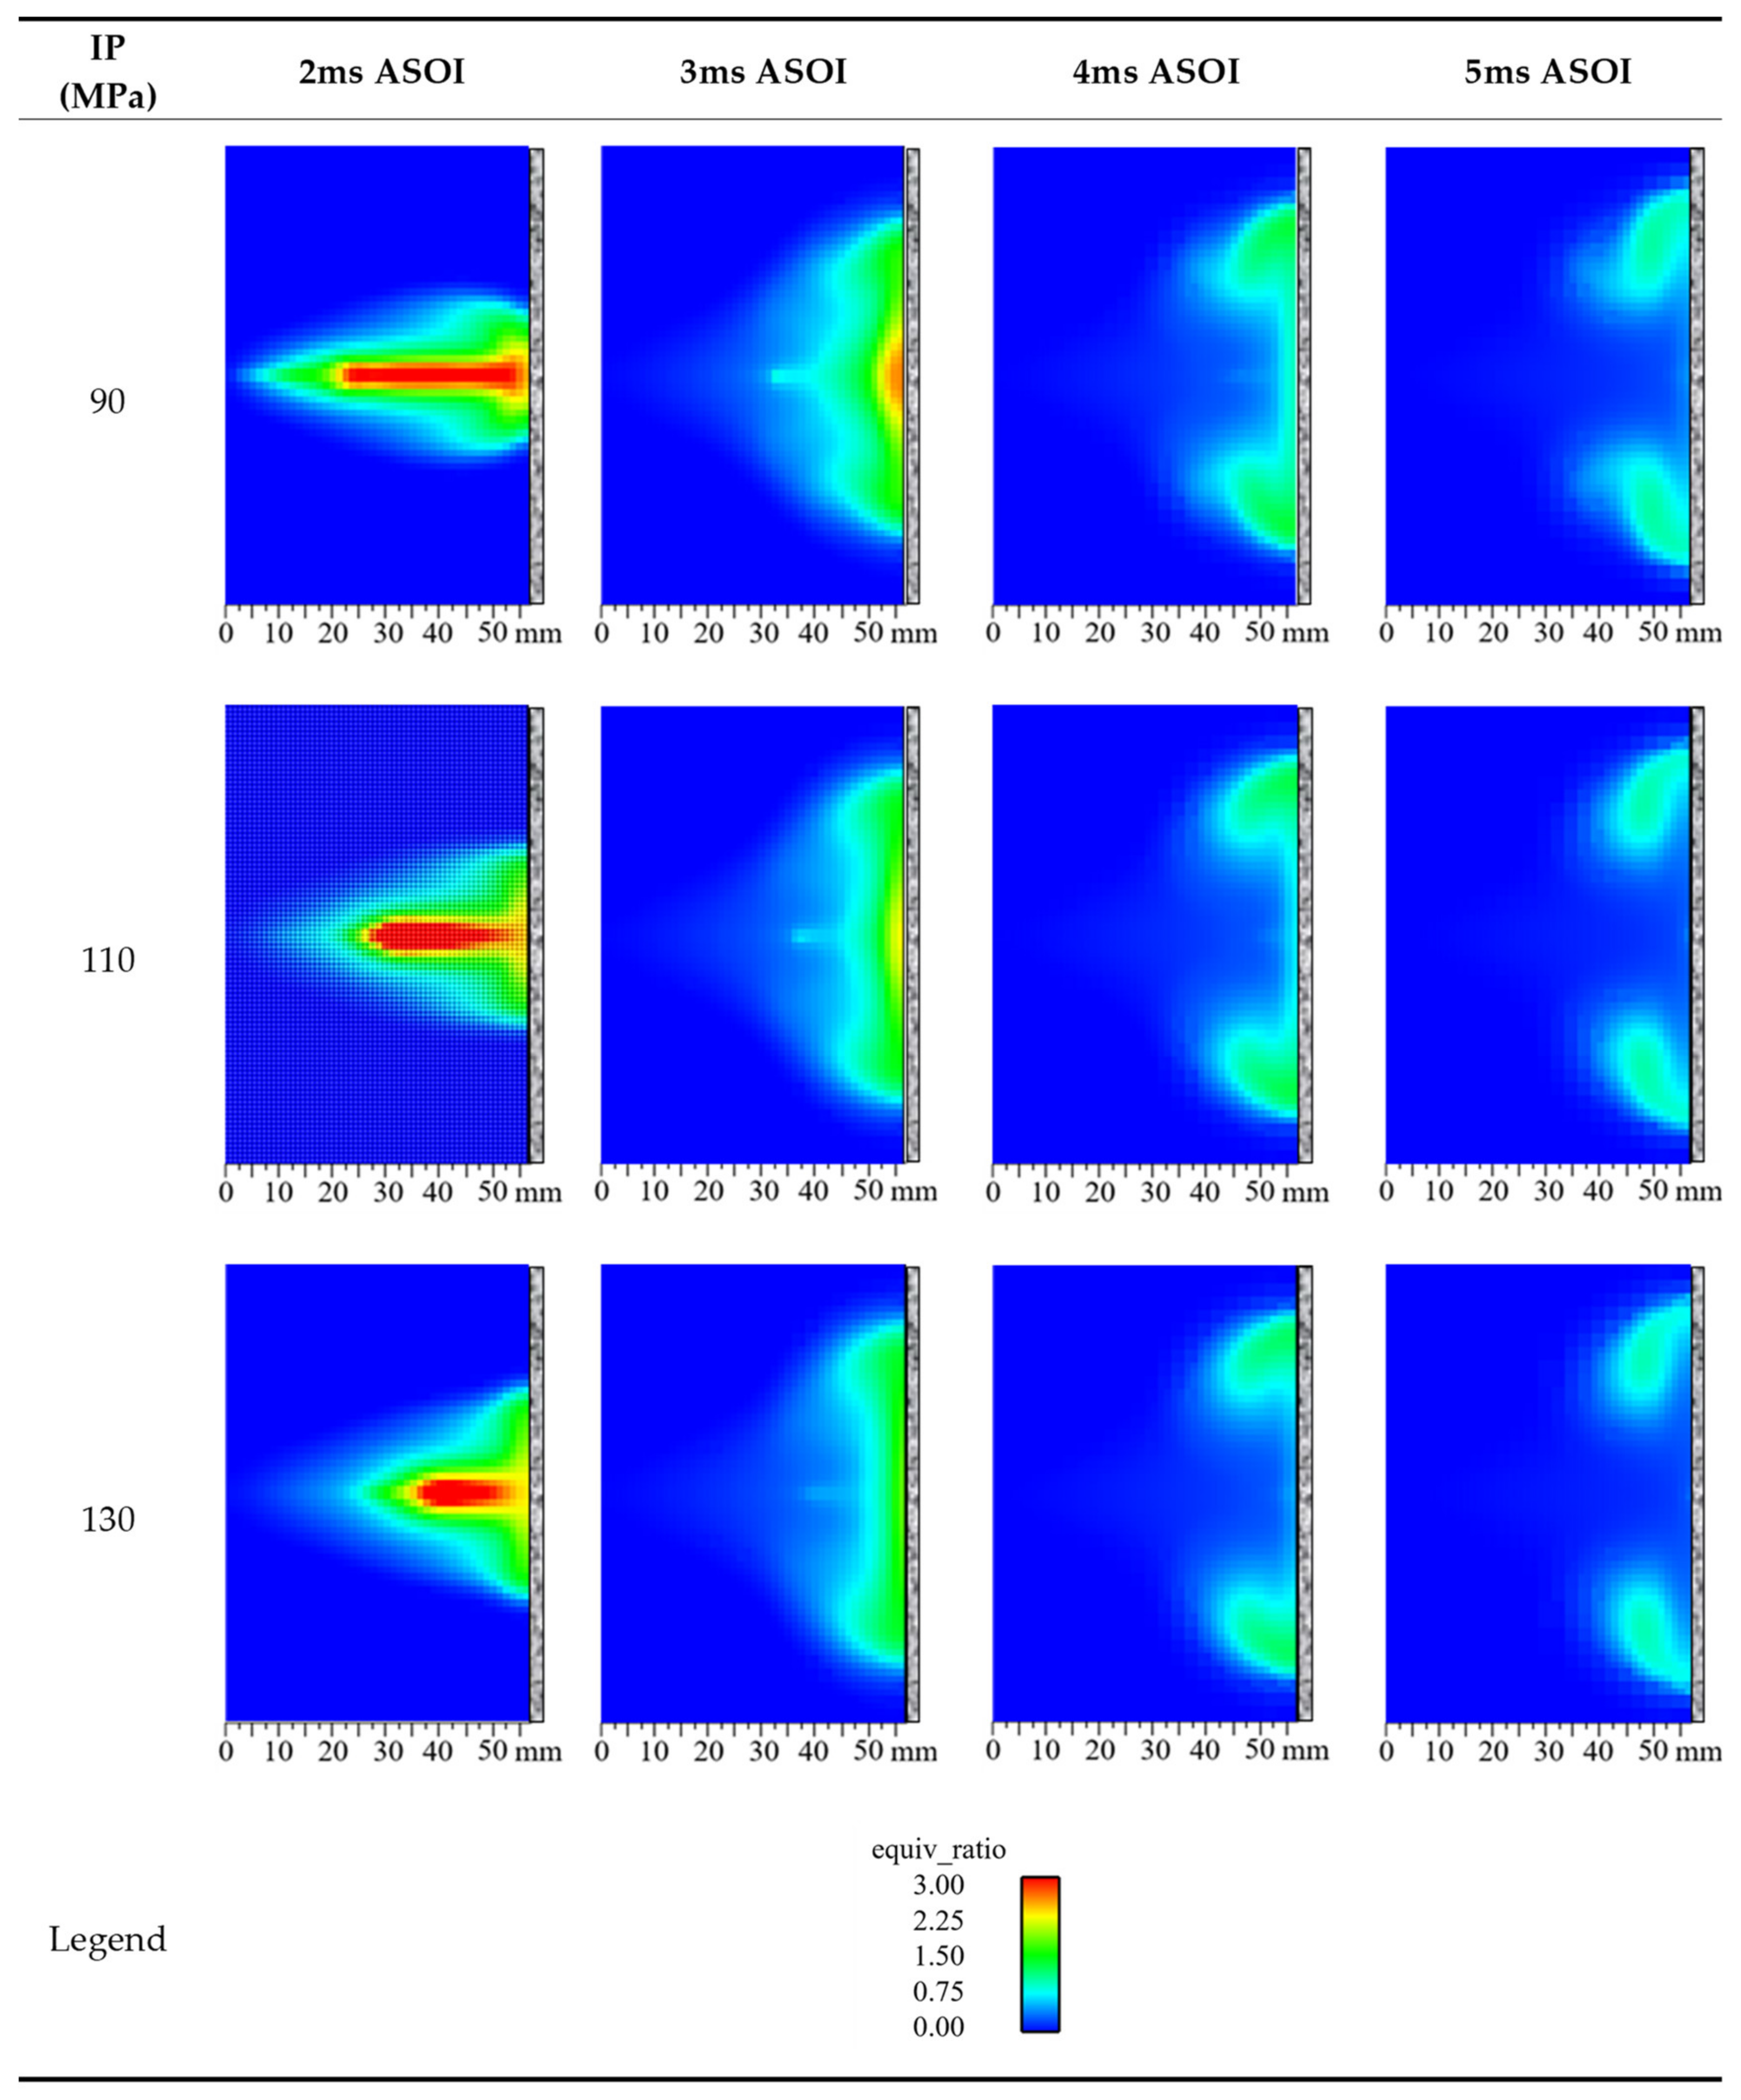
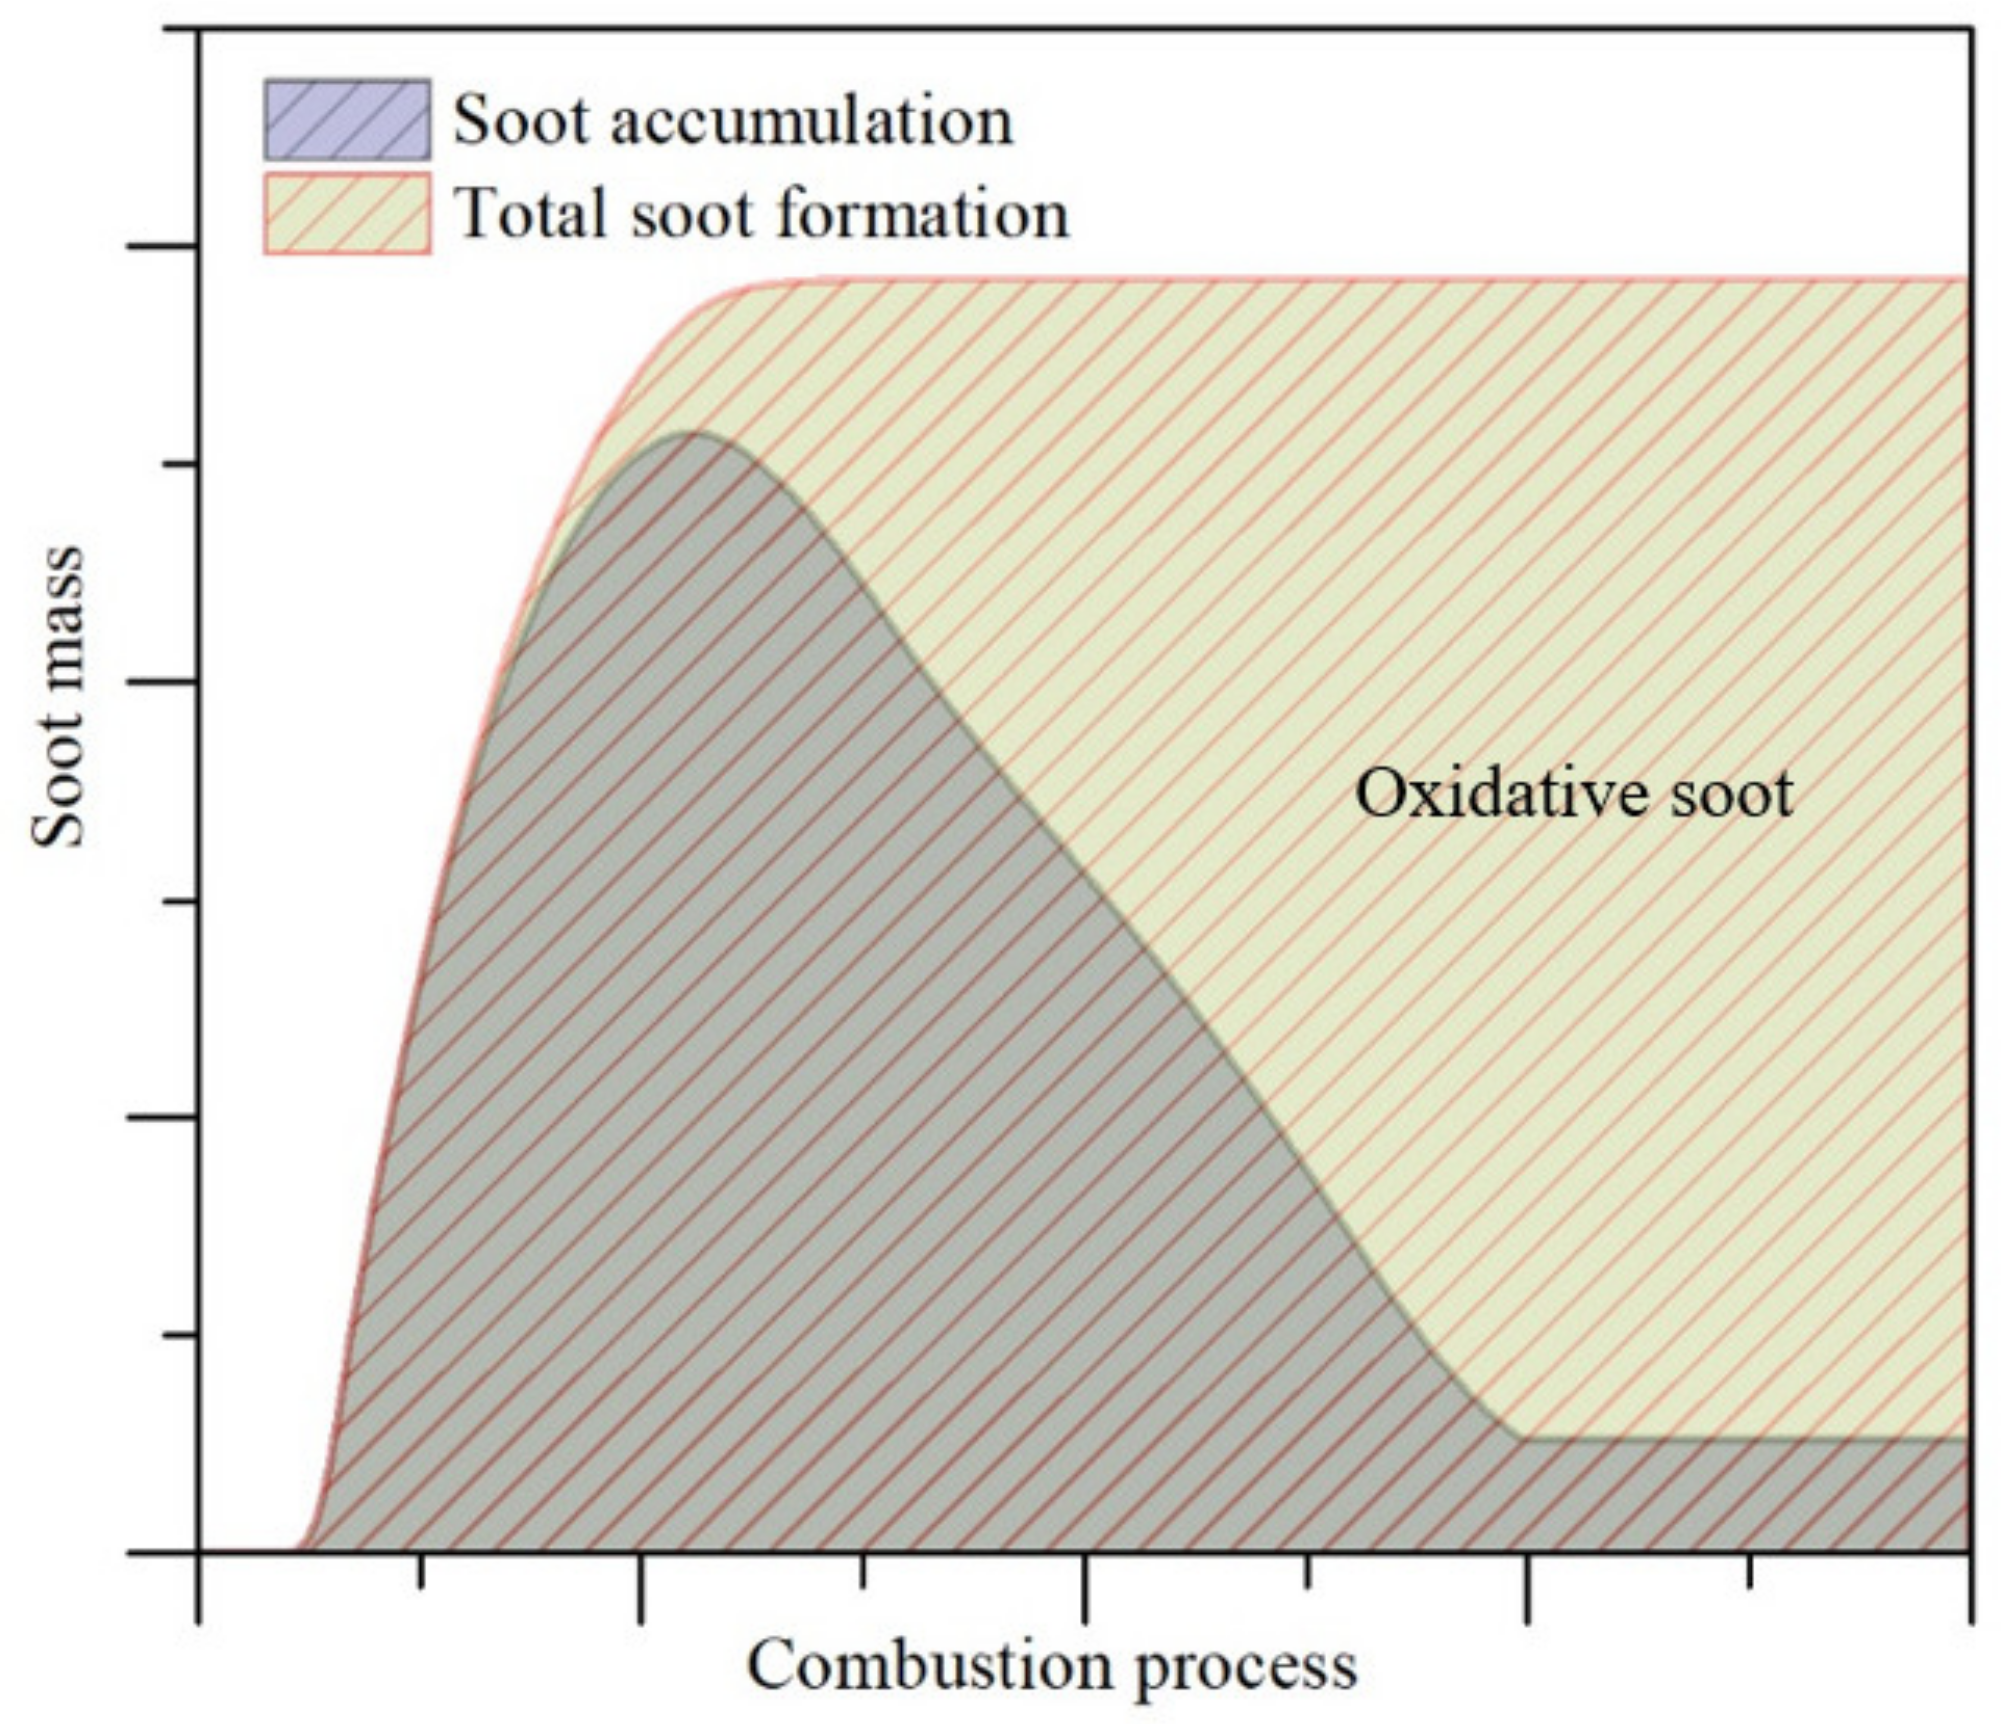
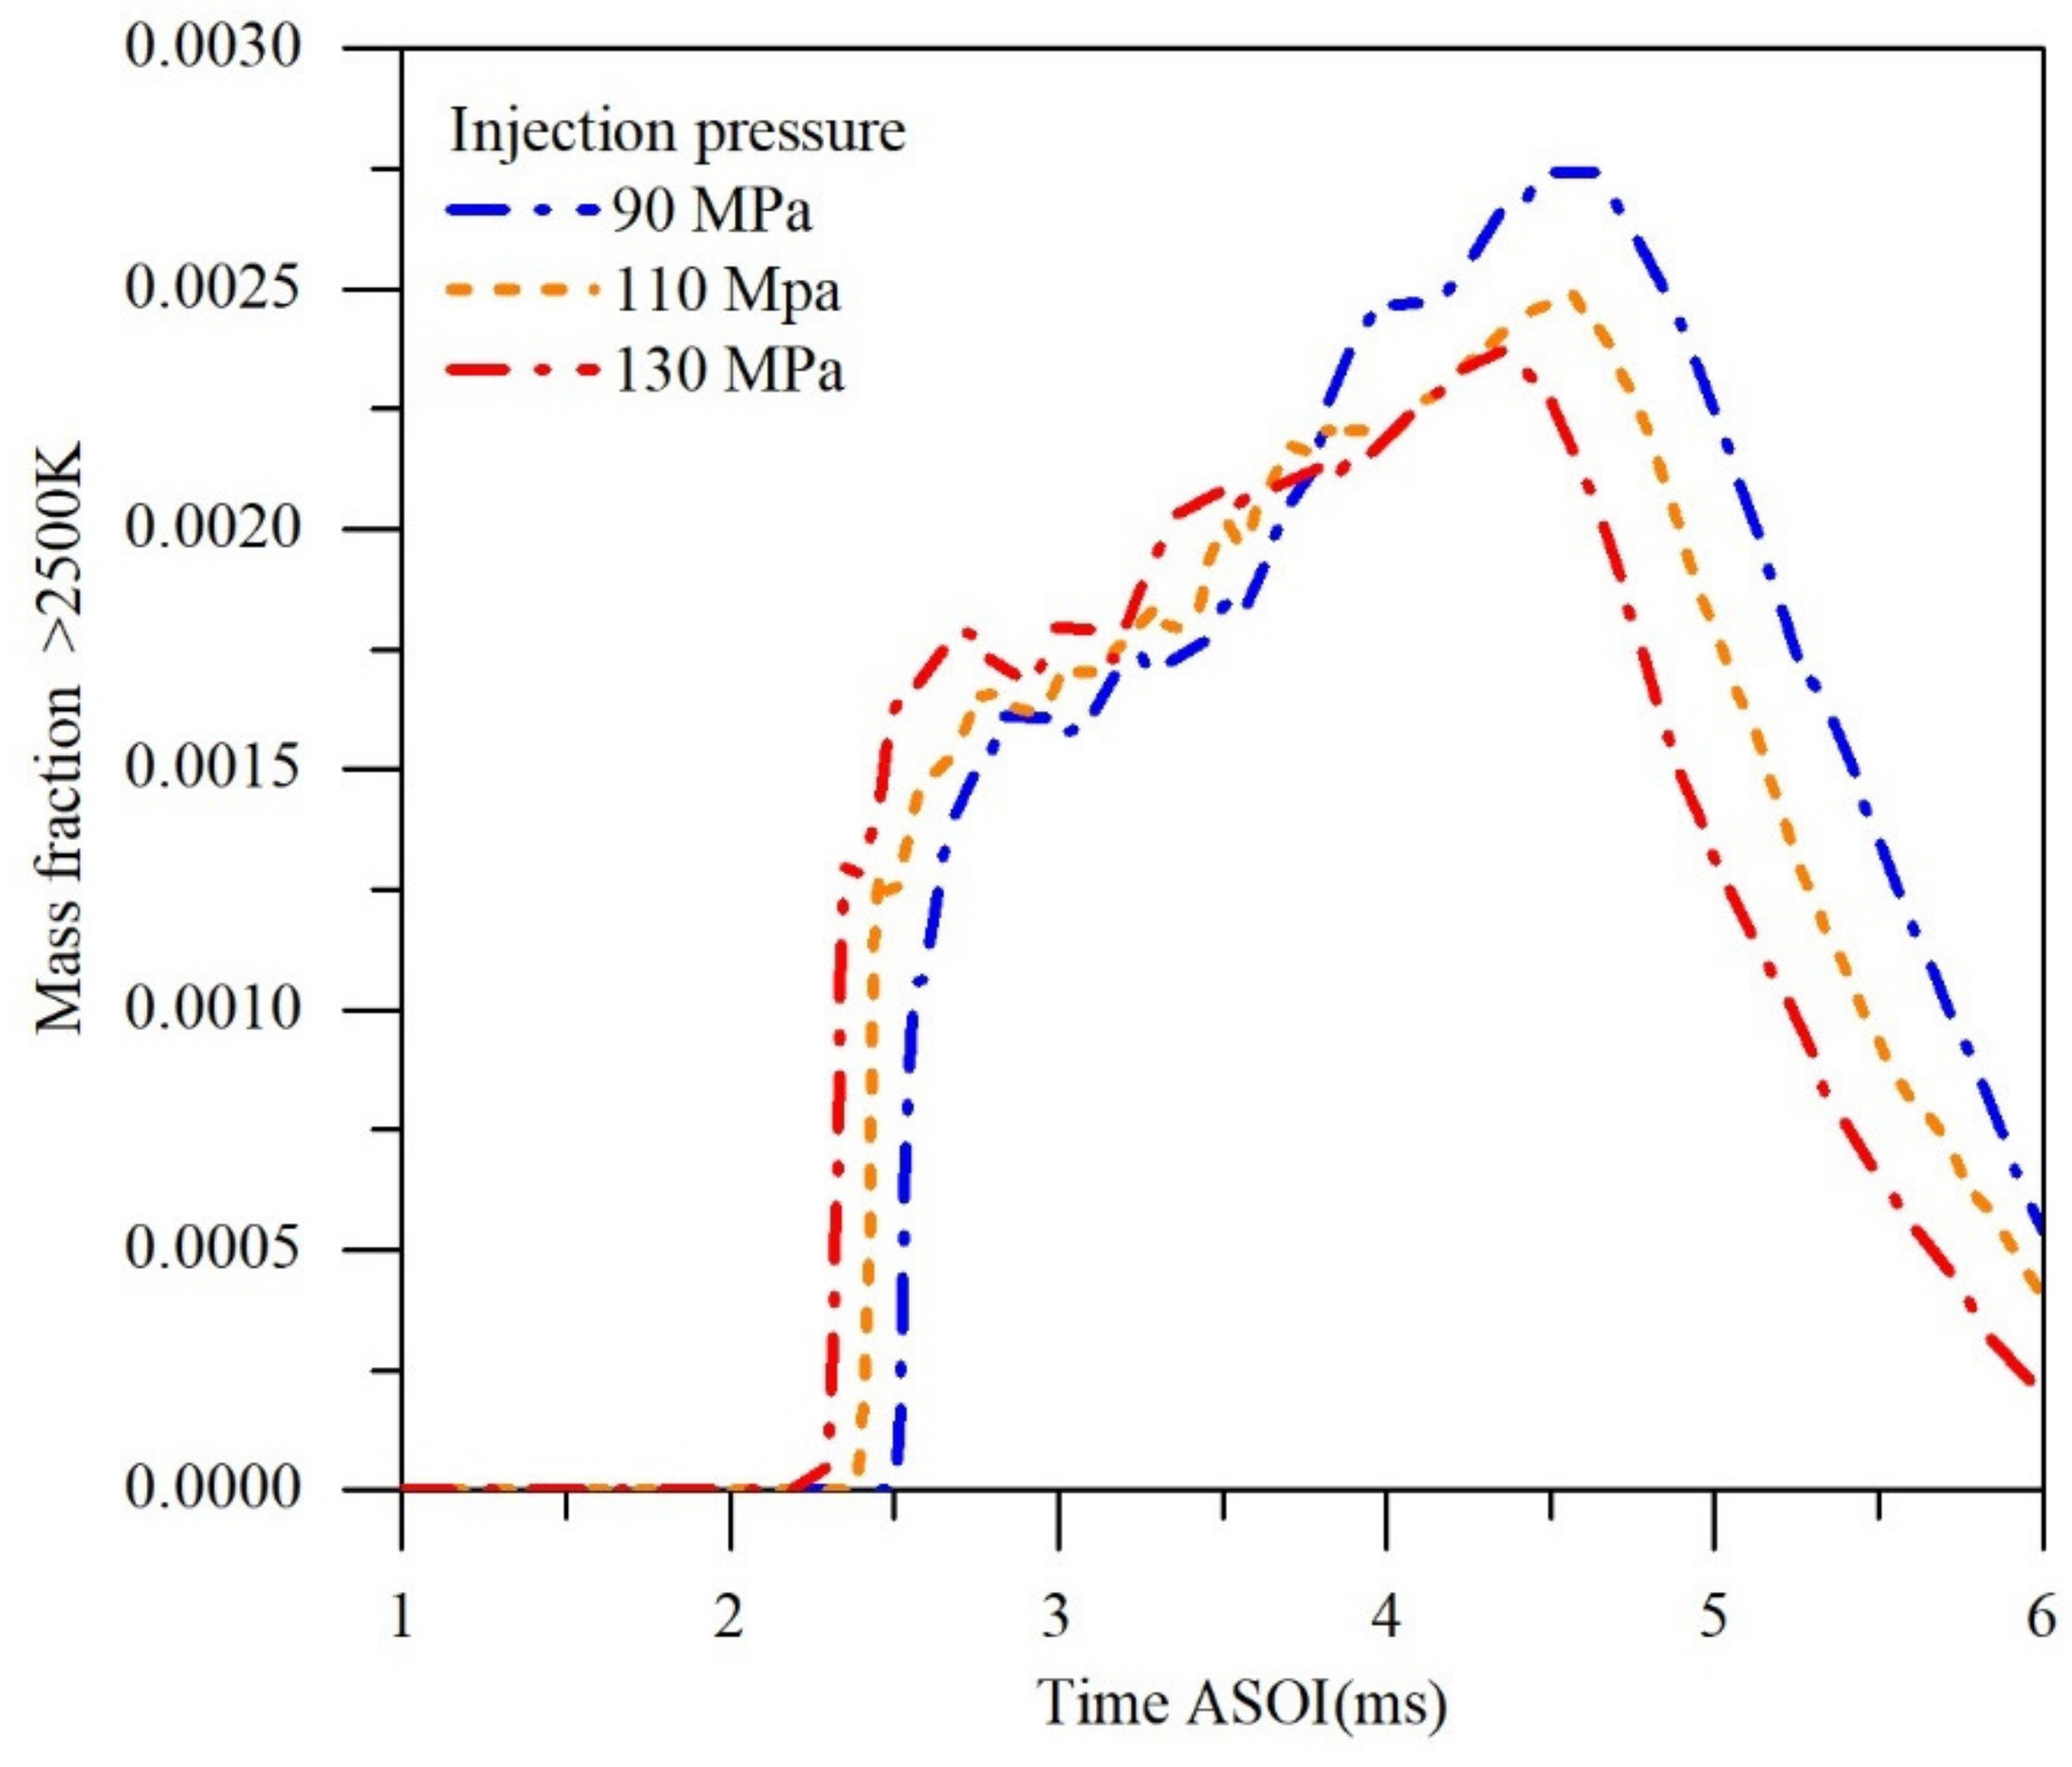
3.5. Equivalence Ratio and Soot Generation in CFD Combustion Simulation

The following images in the Figure 17 show the equivalence ratio changes in the simulated combustion process by using CONVERGE™.
The mixture process under different injection pressures is approximately the same as the flame diffusion by the experiment.
Compared with the experimental and simulated combustion process, it can be seen that, in the combustion process after the end of fuel injection, the change of the fuel-air mixing quality in the axial near-wall region is most obvious because the equivalent ratio at the axis is caused by the strong air entrainment rate brought by the high speed near the region.
The combustion reaction emission model used the Hiroyasu soot generation model in the CONVERGE™, representing the total amount of soot accumulated in the combustion time point. Figure 18 below shows the change rule of soot accumulation at each point in time of the simulation under different injection pressures.
Figure 19 shows that the flame under high injection pressure leads to the earlier soot generation for its earlier ignition and combustion moment. Due to the better fuel-air-mixing quality under high injection pressure, the total amount of soot climbs slowly at few oxygen-deficient regions after the combustion starts. Due to the different mixing quality, the peak value of soot varies greatly under different injection pressures, but the cumulative amount after the final combustion is relatively close to each other, which is similar to the results of TINL in Figure 16. The total amount of soot is reduced, respectively, at 4.9% and 28.6%. Although the trend of soot generation is the same, the differences between the simulation results under three different injection pressures are more obvious than that in the experiment.
In the actual combustion process, soot nucleates when the temperature rises in the early stage of combustion and then forms carbon nuclei through the collision and growth [31,32]. The longer the combustion cycle is at high temperature, the more soot is generated [33,34]. However, when the oxygen is sufficient, the soot elementary particle will oxidize under high temperature in the cylinder, reducing their diameter or disappearing. Therefore, as shown in Figure 19, the actual soot formation process can be divided into two parts: forming and oxidative elimination.
These two parts are closely related to the reaction temperature. The following Figure 20 shows the reaction mass fraction above 2500 K in the simulation, this is the ratio of the mass above 2500 K to the total mass in the constant volume vessel. It can be approximately considered as the mass fraction of high temperature soot formation and oxidation.
It can be seen from the figure that the overall trend of reaction mass fraction under different injection pressures is similar to the flame brightness trend in the experiment. At high injection pressure (e.g., 130 MPa), because of the high mixing quality, the high-temperature region after the combustion stage is the largest and the oxidation start time is earlier. However, when using the flame luminosity instead of soot, the part of oxidized soot is not well-characterized, and the larger flame diffusion area under higher IP causes errors in the superposition of pixels, so the relative trend from the experiment is not obvious.

4. Conclusions

By analyzing the visualization experiments and CFD simulations in CONVERGE™, the overall diesel fuel visualization process from spray and ignition to flame impinging combustion under different injection pressures was studied in this paper and came to the following conclusions.
  • When the spray penetration does not reach the impinging wall plate, the wall plate still has a restrictive effect on the mixed gas, causing the dense mixture to form in the near-wall area and the local mixing quality to decrease. This phenomenon cannot be detected by using spray imaging.
  • The high velocity of the spray under the higher injection pressure could accelerate the mixture of the lower mixing area to the combustion state by entraining more air, enabling the combustion to reach the destination fuel reaction equivalence ratio faster. Additionally, more heat is released from the gas after combustion at the same time under higher IP.
  • The higher kinetic energy brought by higher spray velocity makes the gas diffuse in the space more extensively, which can be shown by the evolution of the diffusion flame area and the TINL.
  • The changing trends of soot generation under different IP are the same under the experiments and simulations. Compared with 90 MPa, 130 MPa IP reduces the final soot amount in the experiment and simulation by 1.2% and 28%, respectively, because of the rapid combustion. The difference between the experimental results under different injection pressures is smaller than the simulation results because of the superposition of flame luminosity, so the soot formation under higher IP is relatively overpredicted in the experiment.
In the visualization experiment, the instantaneous flame nature luminosity was captured by the camera. Due to the relationship between the projection surface, the luminosity is regarded as the summary of the maximum flame luminosity in the radial direction, which approximately represents the instantaneous generation level of soot and records the process of emission. The image pixel superposition effect only shows the high temperature generated area, but not all of the oxidation area. Therefore, objective errors exist in the evaluation of the flame luminosity. In the subsequent studies, more quantitative analysis on soot generation will be analyzed if possible.

Author Contributions

Writing—original draft, Software. Y.T.; Writing—review and editing, Y.Z.; Funding acquisition, D.L.; Methodology, C.W.; Project administration, P.T. and Z.H.; Visualization, L.F. All authors have read and agreed to the published version of the manuscript.

Funding

This research was funded by National Key R&D Program of China (2017YFE0102800).

Acknowledgments

The authors would like to acknowledge the financial support by National Key R&D Program of China.

Conflicts of Interest

The authors declare no conflict of interest.

Abbreviations

DIdirect injection
ASOIafter start of injection
PMparticulate matter
TINLtime integrated natural luminosity
SINLspatially integrated natural luminosity
IPinjection pressure

References

  1. Matti Maricq, M. Chemical characterization of particulate emissions from diesel engines: A review. J. Aerosol Sci. 2007, 38, 1079–1118. [Google Scholar] [CrossRef]
  2. Long, C.M.; Nascarella, M.A.; Valberg, P.A. Carbon black vs. black carbon and other airborne materials containing elemental carbon: Physical and chemical distinctions. Environ. Pollut. 2013, 181, 271–286. [Google Scholar] [CrossRef] [PubMed] [Green Version]
  3. Hiroyasu, H.; Arai, M. Structures of Fuel Sprays in Diesel Engines; SAE Technical Paper 900475; SAE International: Warrendale, PA, USA, 1990. [Google Scholar]
  4. Tree, D.R.; Svensson, K.I. Soot processes in compression ignition engines. Prog. Energy Combust. Sci. 2007, 33, 272–309. [Google Scholar] [CrossRef]
  5. Dec, J.E.; Tree, D.R. Diffusion-Flame/Wall Interactions in a Heavy-Duty DI Diesel Engine; SAE Technical Paper 2001-01-1295; SAE International: Warrendale, PA, USA, 2001. [Google Scholar]
  6. Donkerbroek, A.; Boot, M.; Luijten, C.; Dam, N.N.; Ter Meulen, J. Flame lift-off length and soot production of oxygenated fuels in relation with ignition delay in a DI heavy-duty diesel engine. Combust. Flame 2011, 158, 525–538. [Google Scholar] [CrossRef]
  7. Mueller, C.J.; Martin, G.C. Effects of Oxygenated Compounds on Combustion and Soot Evolution in a DI Diesel Engine: Broadband Natural Luminosity Imaging; SAE Technical Paper 2002-01-1631; SAE International: Warrendale, PA, USA, 2002. [Google Scholar]
  8. Karthic, S.; Kumar, M.S.; Nataraj, G.; Pradeep, P. An assessment on injection pressure and timing to reduce emissions on diesel engine powered by renewable fuel. J. Clean. Prod. 2020, 255, 120186. [Google Scholar] [CrossRef]
  9. Agarwal, A.K.; Srivastava, D.K.; Dhar, A.; Maurya, R.K.; Shukla, P.C.; Singh, A.P. Effect of fuel injection timing and pressure on combustion, emissions and performance characteristics of a single cylinder diesel engine. Fuel 2013, 111, 374–383. [Google Scholar] [CrossRef]
  10. Zhang, Y.; Jia, M.; Liu, H.; Xie, M. Development of an improved liquid film model for spray/wall interaction under engine-relevant conditions. Int. J. Multiph. Flow 2016, 79, 74–87. [Google Scholar] [CrossRef]
  11. Jafarmadar, S.; Khalilarya, S.; Shafee, S.; Barzegar, R. Modeling the effect of spray/wall impingement on combustion process and emission of DI diesel engine. Therm. Sci. 2009, 13, 23–33. [Google Scholar] [CrossRef]
  12. Wang, X.; Huang, Z.; Zhang, W.; Kuti, O.A.; Nishida, K. Effects of ultra-high injection pressure and micro-hole nozzle on flame structure and soot formation of impinging diesel spray. Appl. Energy 2011, 88, 1620–1628. [Google Scholar] [CrossRef]
  13. Bruneaux, G. Combustion structure of free and wall-impinging diesel jets by simultaneous laser-induced fluorescence of formaldehyde, poly-aromatic hydrocarbons, and hydroxides. Int. J. Engine Res. 2008, 9, 249–265. [Google Scholar] [CrossRef]
  14. Mohammadi, A.; Kidoguchi, Y.; Miwa, K. Effect of Injection Parameters and Wall-Impingement on Atomization and Gas Entrainment Processes in Diesel Sprays; SAE Technical Paper 2002-01-0497; SAE International: Warrendale, PA, USA, 2002. [Google Scholar]
  15. Marčič, S.; Marčič, M.; Wensing, M.; Vogel, T.; Praunseis, Z. A simplified model for a diesel spray. Fuel 2018, 222, 485–495. [Google Scholar] [CrossRef]
  16. Zhang, W.; Nishida, K.; Gao, J.; Miura, D. An experimental study on flat-wall-impinging spray of microhole nozzles under ultra-high injection pressures. Proc. Inst. Mech. Eng. Part D J. Automob. Eng. 2008, 222, 1731–1741. [Google Scholar] [CrossRef]
  17. Moon, S.; Gao, Y.; Wang, J.; Fezzaa, K.; Tsujimura, T. Near-Field dynamics of high-speed diesel sprays: Effects of orifice inlet geometry and injection pressure. Fuel 2014, 133, 299–309. [Google Scholar] [CrossRef]
  18. Agarwal, A.K.; Dhar, A.; Gupta, J.G.; Kim, W.I.; Lee, C.S.; Park, S. Effect of fuel injection pressure and injection timing on spray characteristics and particulate size–number distribution in a biodiesel fuelled common rail direct injection diesel engine. Appl. Energy 2014, 130, 212–221. [Google Scholar] [CrossRef]
  19. Shi, Z.; Lee, C.-F.; Wu, H.; Li, H.; Wu, Y.; Zhang, L.; Bo, Y.; Liu, F. Effect of injection pressure on the impinging spray and ignition characteristics of the heavy-duty diesel engine under low-temperature conditions. Appl. Energy 2020, 262, 114552. [Google Scholar] [CrossRef]
  20. Chen, P.-C.; Wang, W.-C.; Roberts, W.L.; Fang, T. Spray and atomization of diesel fuel and its alternatives from a single-hole injector using a common rail fuel injection system. Fuel 2013, 103, 850–861. [Google Scholar] [CrossRef]
  21. Abu-Hamdeh, N.H.; Bantan, R.A.; Alimoradi, A.; Pourhoseini, S. The effect of injection pressure on the thermal performance and emission characteristics of an oil burner operating on B20 palm oil biodiesel-diesel blend fuel. Fuel 2020, 278, 118174. [Google Scholar] [CrossRef]
  22. Du, W.; Zhang, Q.; Bao, W.; Lou, J. Effects of injection pressure on spray structure after wall impingement. Appl. Therm. Eng. 2018, 129, 1212–1218. [Google Scholar] [CrossRef]
  23. Kuti, O.A.; Zhu, J.; Nishida, K.; Wang, X.; Huang, Z. Characterization of spray and combustion processes of biodiesel fuel injected by diesel engine common rail system. Fuel 2013, 104, 838–846. [Google Scholar] [CrossRef]
  24. Zhao, Z.; Zhu, X.; Naber, J.; Lee, S.-Y. Assessment of impinged flame structure in high-pressure direct diesel injection. Int. J. Engine Res. 2020, 21, 391–405. [Google Scholar] [CrossRef]
  25. Gaydon, A. The Spectroscopy of Flames; Springer Science & Business Media: Berlin, Germany, 2012. [Google Scholar]
  26. Dec, J.E.; Espey, C. Chemiluminescence Imaging of Autoignition in a DI Diesel Engine; SAE Technical Paper 982685; SAE International: Warrendale, PA, USA, 1998. [Google Scholar]
  27. Pickett, L.; Siebers, D.; Idicheria, C. Relationship between ignition processes and the lift-off length of diesel fuel jets. SAE Trans. 2005, 114, 1714–1731. [Google Scholar]
  28. Ma, Y.; Huang, S.; Huang, R.; Zhang, Y.; Xu, S. Ignition and combustion characteristics of n-pentanol–diesel blends in a constant volume chamber. Appl. Energy 2017, 185, 519–530. [Google Scholar] [CrossRef]
  29. Wu, H.; Nithyanandan, K.; Zhou, N.; Lee, T.H.; Lee, C.-F.F.; Zhang, C. Impacts of acetone on the spray combustion of Acetone-Butanol-Ethanol (ABE)-Diesel blends under low ambient temperature. Fuel 2015, 142, 109–116. [Google Scholar] [CrossRef]
  30. Yesilyurt, M.K. The effects of the fuel injection pressure on the performance and emission characteristics of a diesel engine fuelled with waste cooking oil biodiesel-diesel blends. Renew. Energy 2019, 132, 649–666. [Google Scholar] [CrossRef]
  31. Oh, K.C.; Lee, C.B.; Lee, E.J. Characteristics of soot particles formed by diesel pyrolysis. J. Anal. Appl. Pyrolysis 2011, 92, 456–462. [Google Scholar] [CrossRef]
  32. Jung, Y.; Oh, K.C.; Bae, C.; Shin, H.D. The effect of oxygen enrichment on incipient soot particles in inverse diffusion flames. Fuel 2012, 102, 199–207. [Google Scholar] [CrossRef]
  33. Desgroux, P.; Mercier, X.; Thomson, K.A. Study of the formation of soot and its precursors in flames using optical diagnostics. Proc. Combust. Inst. 2013, 34, 1713–1738. [Google Scholar] [CrossRef]
  34. Raj, A.; Yang, S.Y.; Cha, D.K.; Tayouo, R.; Chung, S.H. Structural effects on the oxidation of soot particles by O2: Experimental and theoretical study. Combust. Flame 2013, 160, 1812–1826. [Google Scholar] [CrossRef]
Figure 1. Diagram spray and combustion visualization experiment platform.
Energies 13 06210 g001
Figure 2. Sketch of impinging distance.
Energies 13 06210 g002
Figure 3. Sketch map of the imaging methods, (a) LED backlight scattering imaging, (b) wide area low-pass chemiluminescence imaging and reduced light direct imaging.
Energies 13 06210 g003aEnergies 13 06210 g003b
Figure 4. Concept diagram in the CFD simulation by using CONVERGE™.
Energies 13 06210 g004
Figure 5. Spray images under different injection pressures.
Energies 13 06210 g005
Figure 6. Spray liquid penetration in the experiments.
Energies 13 06210 g006
Figure 7. Comparison of the simulated spray liquid penetrations with the experiments.
Energies 13 06210 g007
Figure 8. Simulation results of the equivalence ratio under different injection pressures.
Energies 13 06210 g008
Figure 9. Ignition images under different IP.
Energies 13 06210 g009
Figure 10. The axial initial ignition position and ignition time delay.
Energies 13 06210 g010
Figure 11. The geometric parameters of the flame.
Energies 13 06210 g011
Figure 12. Impinging flame images under different IP.
Energies 13 06210 g012
Figure 13. Flame upstream and lift-off length.
Energies 13 06210 g013
Figure 14. Flame diffusion area.
Energies 13 06210 g014
Figure 15. The flame spatial integral nature luminosity (SINL).
Energies 13 06210 g015
Figure 16. The flame time integral natural luminosity (TINL).
Energies 13 06210 g016
Figure 17. Simulation results of the equivalence ratio under different injection pressures.
Energies 13 06210 g017
Figure 18. Hiroyasu soot generation in simulation.
Energies 13 06210 g018
Figure 19. Soot forming and oxidative elimination in combustion.
Energies 13 06210 g019
Figure 20. The mass fraction of reaction fuel above 2500 K.
Energies 13 06210 g020
Table 1. Imaging conditions.
Setup and ParametersSprayIgnitionFlame
Optical layoutLED backlight scattering imagingWide area low-pass chemiluminescence imagingReduced light direct imaging
Filter/600 nm filterND8 filter
Camera frame rate (fps)10,00010,00010,000
time of exposure (μs)20544
Image resolution576 × 648576 × 648576 × 648
Spatial resolution (μm/pixel)180180180
Table 2. Specific experimental conditions.
ItemsValue
Impinging distance (mm)57
Ambient temperature (K)800
Pressure (MPa)3.69
Ambient density (kg/m3)16.07
Nozzle orifice diameter (mm)0.31
Injection mass (mg)23
Injection pressure (MPa)90110130
Table 3. Setups of major parameters in the CFD model.
ParametersValue
Initial regional pressure (Pa)369,000
Initial region regional temperature (K)800
Nozzle discharge coefficient0.54
TKE constant3000
Constant turbulent dissipation300
KH breakup velocity constant0.2
KH breakup time constant5.0
RT model size constant1.0
Publisher’s Note: MDPI stays neutral with regard to jurisdictional claims in published maps and institutional affiliations.

