Article

A Methodology to Investigate the Deviations between Simple and Detailed Dynamic Methods for the Building Energy Performance Assessment

1
TEBE Research Group, Department of Energy, Politecnico di Torino, Corso Duca degli Abruzzi 24, 10129 Torino, Italy
2
Institute of Animal Science and Technology, Universitat Politècnica de València, Camino de Vera s/n, 46022 València, Spain
*
Author to whom correspondence should be addressed.
Energies 2020, 13(23), 6217; https://doi.org/10.3390/en13236217
Submission received: 30 October 2020 / Revised: 20 November 2020 / Accepted: 24 November 2020 / Published: 26 November 2020
(This article belongs to the Special Issue Selected Papers from BS2019 – Building Simulation)

Abstract

:
The research investigates the validity of the simple hourly method, as introduced by the EN ISO 52016-1 standard, for the assessment of the building energy demand for heating and cooling, by comparing it with a detailed dynamic model (EnergyPlus). A new methodology is provided to identify and quantify the causes of deviations between the models. It consists in the split of the contributions of the air heat balance (AHB) equation by dynamic driving force, and in the adoption of consistency options of the modeling parameters related to specific physical phenomena. A case study approach is adopted in the article to achieve the research objective. The results show that the deviations in the heating and cooling loads between the two calculation methods can be mainly ascribed to the use of different surface heat transfer coefficients, and to a different modeling of the extra thermal radiation to the sky. Providing a methodology to validate the calculation method, this work is intended to contribute to the enhancement of the use of simple dynamic models and to the improvement of the standardization activity.

1. Introduction

The use of accurate energy simulation models is crucial to assess the environmental and energy-related impacts of buildings. These models are usually developed and employed to evaluate the current energy performance of buildings and to predict the energy saving potentials related to building retrofit actions [1,2]. In some cases, they also consider the effects of future climate conditions [3]. In this framework, several building energy models are presented in literature. They considerably differ from each other for the adopted approach since each model is usually developed for a specific purpose and with a certain level of detail. Some building energy performance assessment models are provided by international technical standards.
In this context, EN ISO 52016-1 [4] is one of the recently issued technical standards developed within the Mandate M/480 [5] to support the implementation of Directive 2010/31/EU [6]. The calculation methods of the building energy performance (EP) are widely used in the regulatory framework, either to check compliance with EP requirements or to carry out the energy performance certification. The EN ISO 52016-1 standard provides updated calculation procedures of the building energy needs for space heating and cooling. A new hourly method, based on simplified assumptions and a reduced amount of input data compared to a detailed dynamic simulation tool, is introduced.
Even though simplified methods are less accurate than detailed ones, their adoption for the EP assessment of buildings is usually seen as a good compromise between the accuracy of a detailed dynamic simulation and the simplicity of a quasi-steady-state assessment model. At the same time, simplified methods ensure the reproducibility of results without ambiguities both in algorithms and in input/output data [7]. In literature, many research works deal with the comparison between calculation methods of the building EP, usually investigating in what conditions and for which purposes a simplified method can predict with sufficient accuracy the building energy performance if compared with a detailed simulation model. According to Corrado et al. [8], attention should be paid to specific aspects, such as the determination of heat transfer, and the zoning level of detail. According to Millet [9], simplified simulation methods rely on simple inputs (easy to obtain and understand) and outputs that can be easily checked. On the other hand, a detailed model still requires many input data that are not always available or sufficiently reliable.
The new simple hourly method of EN ISO 52016-1 replaces the one of the withdrawn EN ISO 13790 standard [10]. In literature, many authors adopted the EN ISO 13790 simple hourly method to assess the thermal performance of buildings. This method does not considerably increase the computation time if compared with the steady-state method, and it does not need further building data to perform the simulation. The simple hourly method of EN ISO 13790 was applied with good results in the simulation of the energy performance of different types of buildings, as highlighted by the works of Millet [9], Marchio et al. [11], Roujol et al. [12], and Costantino et al. [13,14]. Despite its good reliability in simulating the thermal behavior of buildings, some limitations of this method were highlighted in literature. The limitations especially concern the modeling of buildings with high thermal inertia and the estimation of the energy consumption for space cooling since the building heat capacity is not accurately and extensively analyzed.
Kokogiannakis et al. [15] compared the differences in the energy ratings (both for heating and cooling) that result from using models that are based on the monthly and simple hourly methods of EN ISO 13790, and from two detailed simulation tools (EnergyPlus and ESP-r). The analysis was focused on a three-storey building and was carried out considering the variation of some parameters, such as internal heat gains schedules, external walls constructions, and climate conditions. The results of this work showed that, in terms of space heating, all methods gave almost the same results, while greater differences stood out in the assessment of space cooling.
Atmaca et al. [16] focused on the differences between the simple hourly method and a detailed simulation tool (EnergyPlus) in estimating the heating and cooling energy demand that resulted by varying the heat capacity of the building envelope. The analyzed case study was a single-family house, and five different types of external walls were considered. The results of this work enabled the authors to state that the calculation of the building thermal mass of the simple hourly method can be considered reliable in non-complex buildings.
Michalak [17] developed a Matlab/Simulink energy model in compliance with the simple hourly method of EN ISO 13790 for the estimation of the annual energy demand for heating and cooling of a two-storey detached house. The outputs of the model were compared with the results of a detailed simulation tool (EnergyPlus) and of the monthly method of EN ISO 13790. The analysis concerned ten different locations (two for each climatic zone of Poland) and demonstrated the reliability of the simple hourly method, but pointed out the need of further investigation in the cooling mode.
Whereas the reliability of the simple hourly method of EN ISO 13790 was sufficiently investigated in literature, the new simple hourly method introduced by EN ISO 52016-1 has not been adequately analyzed yet. A preliminary validation of the new hourly method consistent with the BESTEST (Building Energy Simulation Test) procedure was carried out by Van Dijk et al. [18]. Zakula et al. [19] performed a comparison between the new method and TRNSYS (Transient System Simulation Tool) for different climatic zones, building use categories, and envelope characteristics. Differences between the two calculation methods were quantified up to 40% and up to 18% for annual heating and cooling needs, respectively. The authors pointed out that the use of constant values for the overall thermal resistance and for the total solar energy transmittance of glazing can result in significant errors.
Campana et al. [20] compared the results obtained through a new open SIMULINK blockset (ALMABuild) for the dynamic energy modeling of buildings and HVAC systems with the results of the BESTEST procedure, of EnergyPlus, and of the simple hourly method of EN ISO 52016-1. The results highlighted that the discrepancies between ALMABuild and EnergyPlus are less than 30% for heating loads, and the evaluation of the peak power is generally lower than 5%. On the contrary, the differences between the estimation of ALMABuild and the simple hourly method of EN ISO 52016-1 are considerable, being up to 90% for heavyweight buildings.
Mazzarella et al. [21] compared the thermal conduction model of EN ISO 52016-1 with the methodology proposed and implemented in the Italian National Annex of the standard. The authors demonstrated that the latter provides more accurate results.
As the EN ISO 52016-1 also provides a quasi-steady state calculation method, Bruno et al. [22] analyzed the reliability of this method for the estimation of the cooling energy demand. In addition, they proposed a new methodology consisting in calibrating the quasi-steady-state model with the the results provided by the dynamic software TRNSYS through a black box approach. The performed analyses concerned different configurations of the glazed envelope of two different case studies (a detached house and an office building) in different climate conditions of the Mediterranean area. The results of this work showed that the quasi-steady-state method of EN ISO 52016-1 is suitable for the estimation of cooling requirements in buildings, but noticeable deviances can be found especially in the presence of large portions of the glazed envelope. Consequently, a previous calibration of the quasi-steady-state model is required.
Research from Ballarini et al. [23] was aimed at investigating the features of the hourly method of EN ISO 52016-1 by comparing it against both the hourly method of EN ISO 13790 and the detailed dynamic model of the EnergyPlus simulation tool. The resulting deviations, in terms of thermal loads and energy needs for space heating and cooling, and internal operative temperature, were discussed. Despite a greater accuracy of the new method being shown if compared with the EN ISO 13790 model, some deviations are still observed in the prediction of the heating and cooling load profiles and in the building thermal time constant, when compared with EnergyPlus.
The present work provides a significant extension of the research conducted in [23]. Differently from [23], whose aim was the comparison between models results through a case study, the objective of the present work is to deepen the research study as to investigate and quantify the main causes of deviation between the EN ISO 52016-1 and EnergyPlus calculation methods. A new methodology is provided, higher number of simulations have been performed and more detailed findings are presented.
The methodology consists in the split of the contributions of the air heat balance equation by dynamic driving force (i.e., ambient temperature, internal heat sources, solar radiation) in each simulation model. Afterwards, consistency options between the simple hourly method and the detailed dynamic one are adopted in the modeling of specific physical phenomena, as to separate the effect of a different modeling of the phenomena from the use of different modeling parameters.
The analysis is intended to validate the new calculation method and in general, to provide a methodology that can be applied to every simplified energy model for the building EP assessment. In the long-run, the work is aimed at contributing to the standardization activity by improving the reliability of the simplified building EP calculation methods, as to enhance their application for the energy assessment of buildings.

2. Materials and Methods

2.1. Calculation Methods

2.1.1. Detailed Dynamic Simulation Method—EnergyPlus

EnergyPlus [24] adopts the air heat balance (AHB) algorithm to estimate the heat flow that is needed to maintain the indoor set point temperature inside the analyzed enclosure. The AHB assumes the uniformity of the indoor air temperature (perfect mixing), the uniformity of each surface temperature, and the uniformity of the spatial distribution of both long-wave and short-wave radiations. In addition, the conduction heat flow through the building envelope is considered one-dimensional (the effects of thermal bridges are neglected) and the radiation from surfaces is considered diffusive following the Lambert’s cosine rule. Based on the previous assumptions and neglecting the heat transfer due to infiltration and inter-zone air mixing, the AHB reads:
C z d θ z d τ = i = 1 N Q ˙ i , c + i = 1 N sup Q ˙ i , s + Q ˙ V + Q ˙ N ,
where Cz is the effective heat capacity of the building internal mass (e.g., furniture) and of the indoor air, θz is the air temperature of the thermal zone, and τ is time. Q ˙ i , c is the heat flow coming from the i-th convective heat source, Q ˙ i , s is the convective heat flow from the i-th surface of the thermal zone. Q ˙ V and Q ˙ N are the ventilation heat flow and the convective portion of the HVAC heat loads, respectively.
The heat conduction through the walls is solved using either the finite difference method or the transfer function algorithm, with a sub-hourly time discretization and adopting the “Ideal Load Air System”. In this way, infinite heating and cooling loads are provided to the thermal zone and the features of the HVAC system (e.g., efficiencies and maximum capacities) do not affect the results.

2.1.2. Hourly Method—EN ISO 52016-1

As far as the level of detail is concerned, the hourly method of EN ISO 52016-1 [4] stands between a detailed dynamic simulation model and the simple hourly method of EN ISO 13790 [7].
Similar to EnergyPlus, it adopts the AHB algorithm to estimate the heat flow that is needed to maintain the indoor set point temperature inside the analyzed enclosure. Nevertheless, compared to EnergyPlus, some simplifications are introduced, such as a simplified distribution of mass in each construction, time-invariant convective/long-wave heat transfer coefficients, and total solar energy transmission through glazing considered as directly entering the zone as shortwave radiation.
Similar to the simple method of EN ISO 13790, the hourly method of EN ISO 52016-1 is based on the thermal-electrical analogy between the analyzed thermal zone and an equivalent electrical network (RC model). While the EN ISO 13790 hourly model considers only one heat capacity for the whole envelope and five thermal resistances that represent the heat transfer coefficients of the thermal zone, the EN ISO 52016-1 hourly model assumes a few nodes for each construction element. Up to five heat capacities and four thermal resistances are used for modeling each opaque component (Figure 1), and two nodes are considered for each window or door.
Whereas EnergyPlus splits the solar radiation incident on the window into the fraction directly transmitted into the zone and that one absorbed inside the glass panel and then transferred inside the thermal zone, on the other hand, the EN ISO 52016-1 method evaluates a total amount of solar gains through windows into the zone by applying the total solar energy transmittance of glazing (ggl). EN ISO 52016-1 requires that, for windows with non-scattering glazing, the g-value is calculated by correcting the total solar energy transmittance at normal incidence (ggl,n) by a factor (Fw) that takes into account the effective incidence angle of solar radiation. In the present work, this correction factor was calculated on an hourly basis as a function of the incidence angle, and applying the empirical model developed by Karlsson et al. [25].
The EN ISO 52016-1 standard requires adopting constant values of the surface heat transfer coefficients, as provided in Section 9.5 of EN ISO 13789 [26]. These values are in agreement with the conventional surface resistances in EN ISO 6946 [27], and are calculated assuming linearized radiative surface heat transfer coefficients, constant values of surface emissivity (0.9), and of wind speed (4 m·s−1). The standard external convective heat transfer coefficients are therefore overestimated compared with those calculated in EnergyPlus by considering the real wind speed and assuming a sheltered surrounding. Moreover, EnergyPlus adopts non-linearized formulation of the longwave heat transfer, by applying the Stefan–Boltzmann law.
The hourly model of EN ISO 52016-1 evaluates separately the extra thermal radiation to the sky from the external radiative heat transfer towards the uniform external environment assumed at the same temperature as the air. The extra thermal radiation to the sky is calculated assuming fixed values of the external radiative surface heat transfer coefficient, the view factor to the sky, and the average difference between the air temperature and the apparent sky temperature.

2.2. Workflow

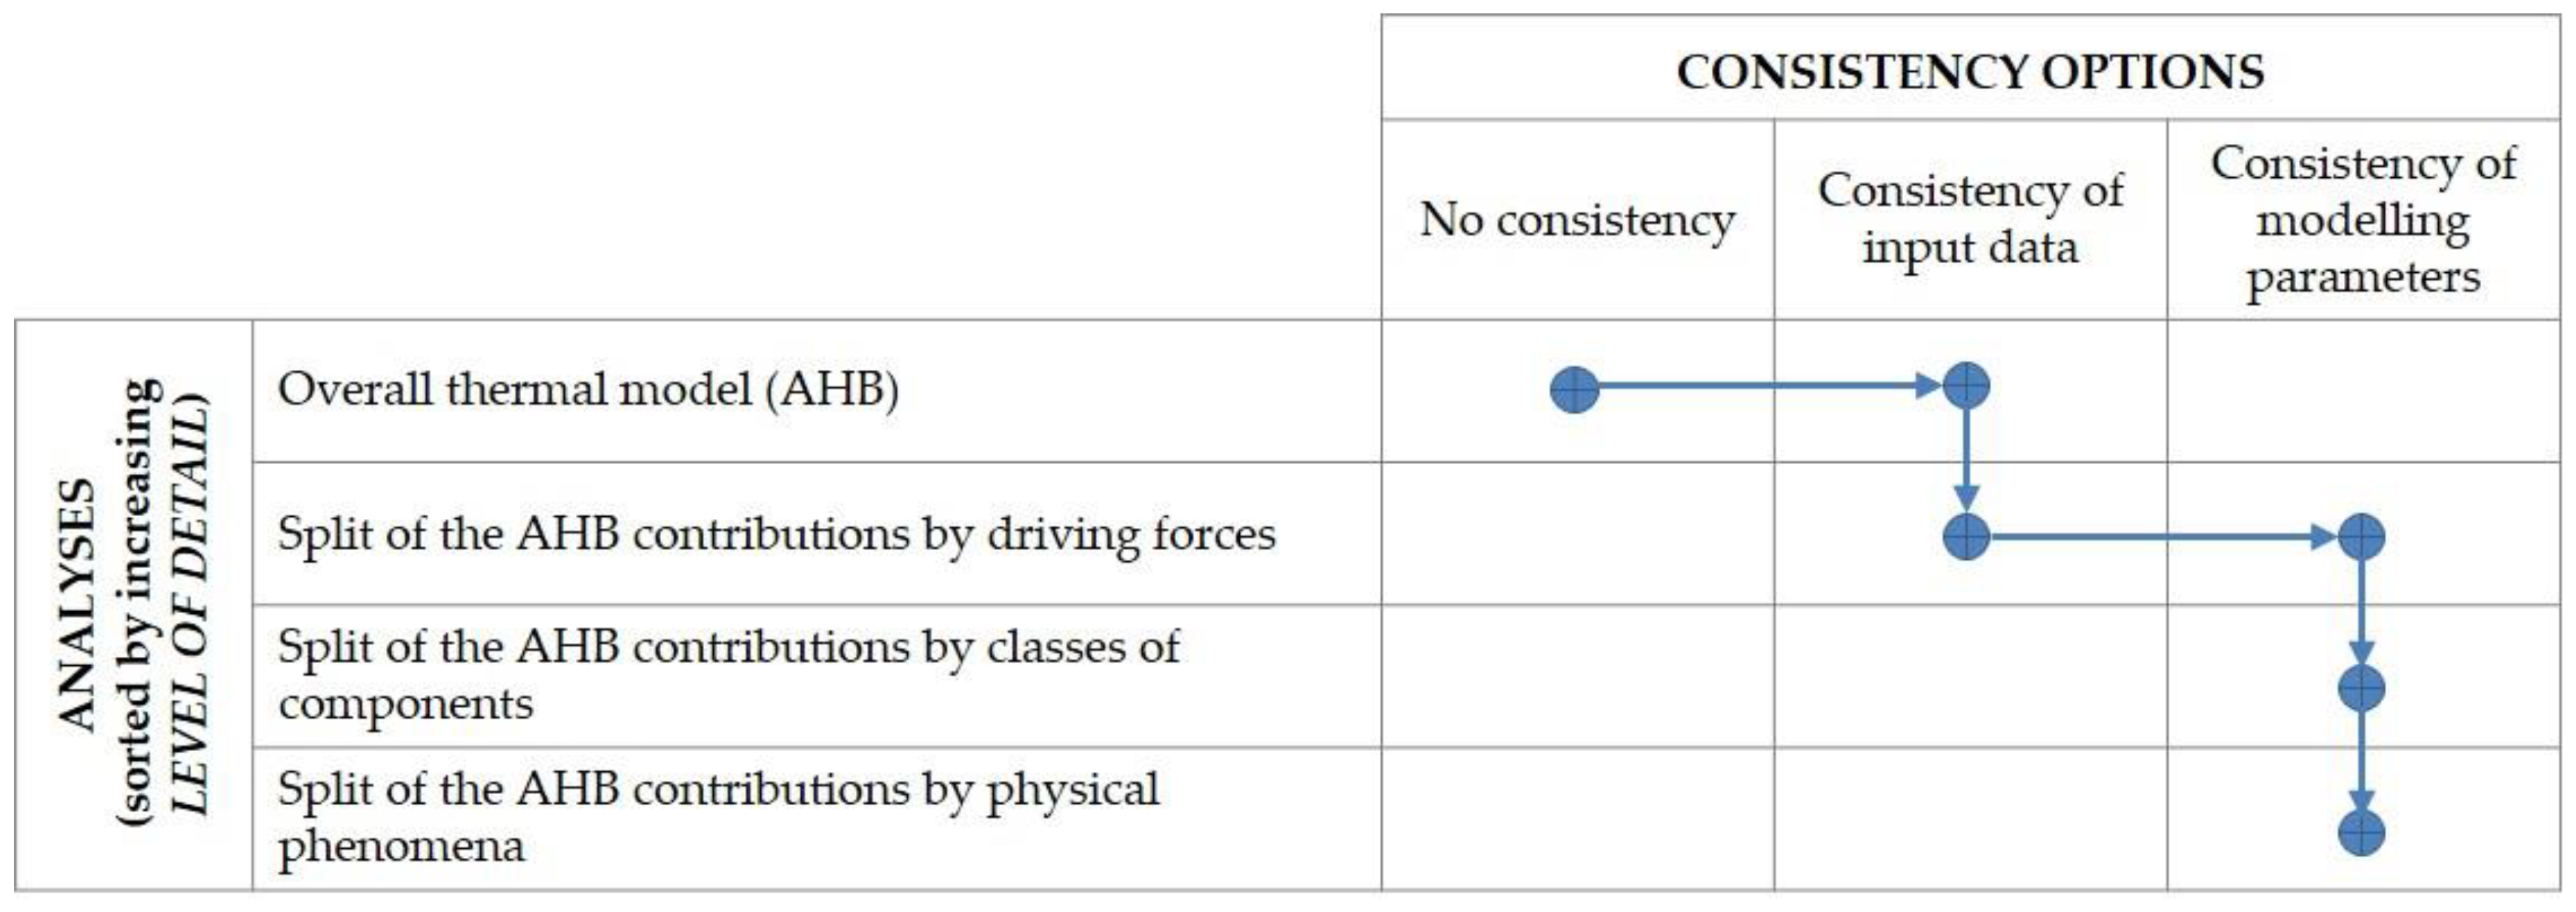
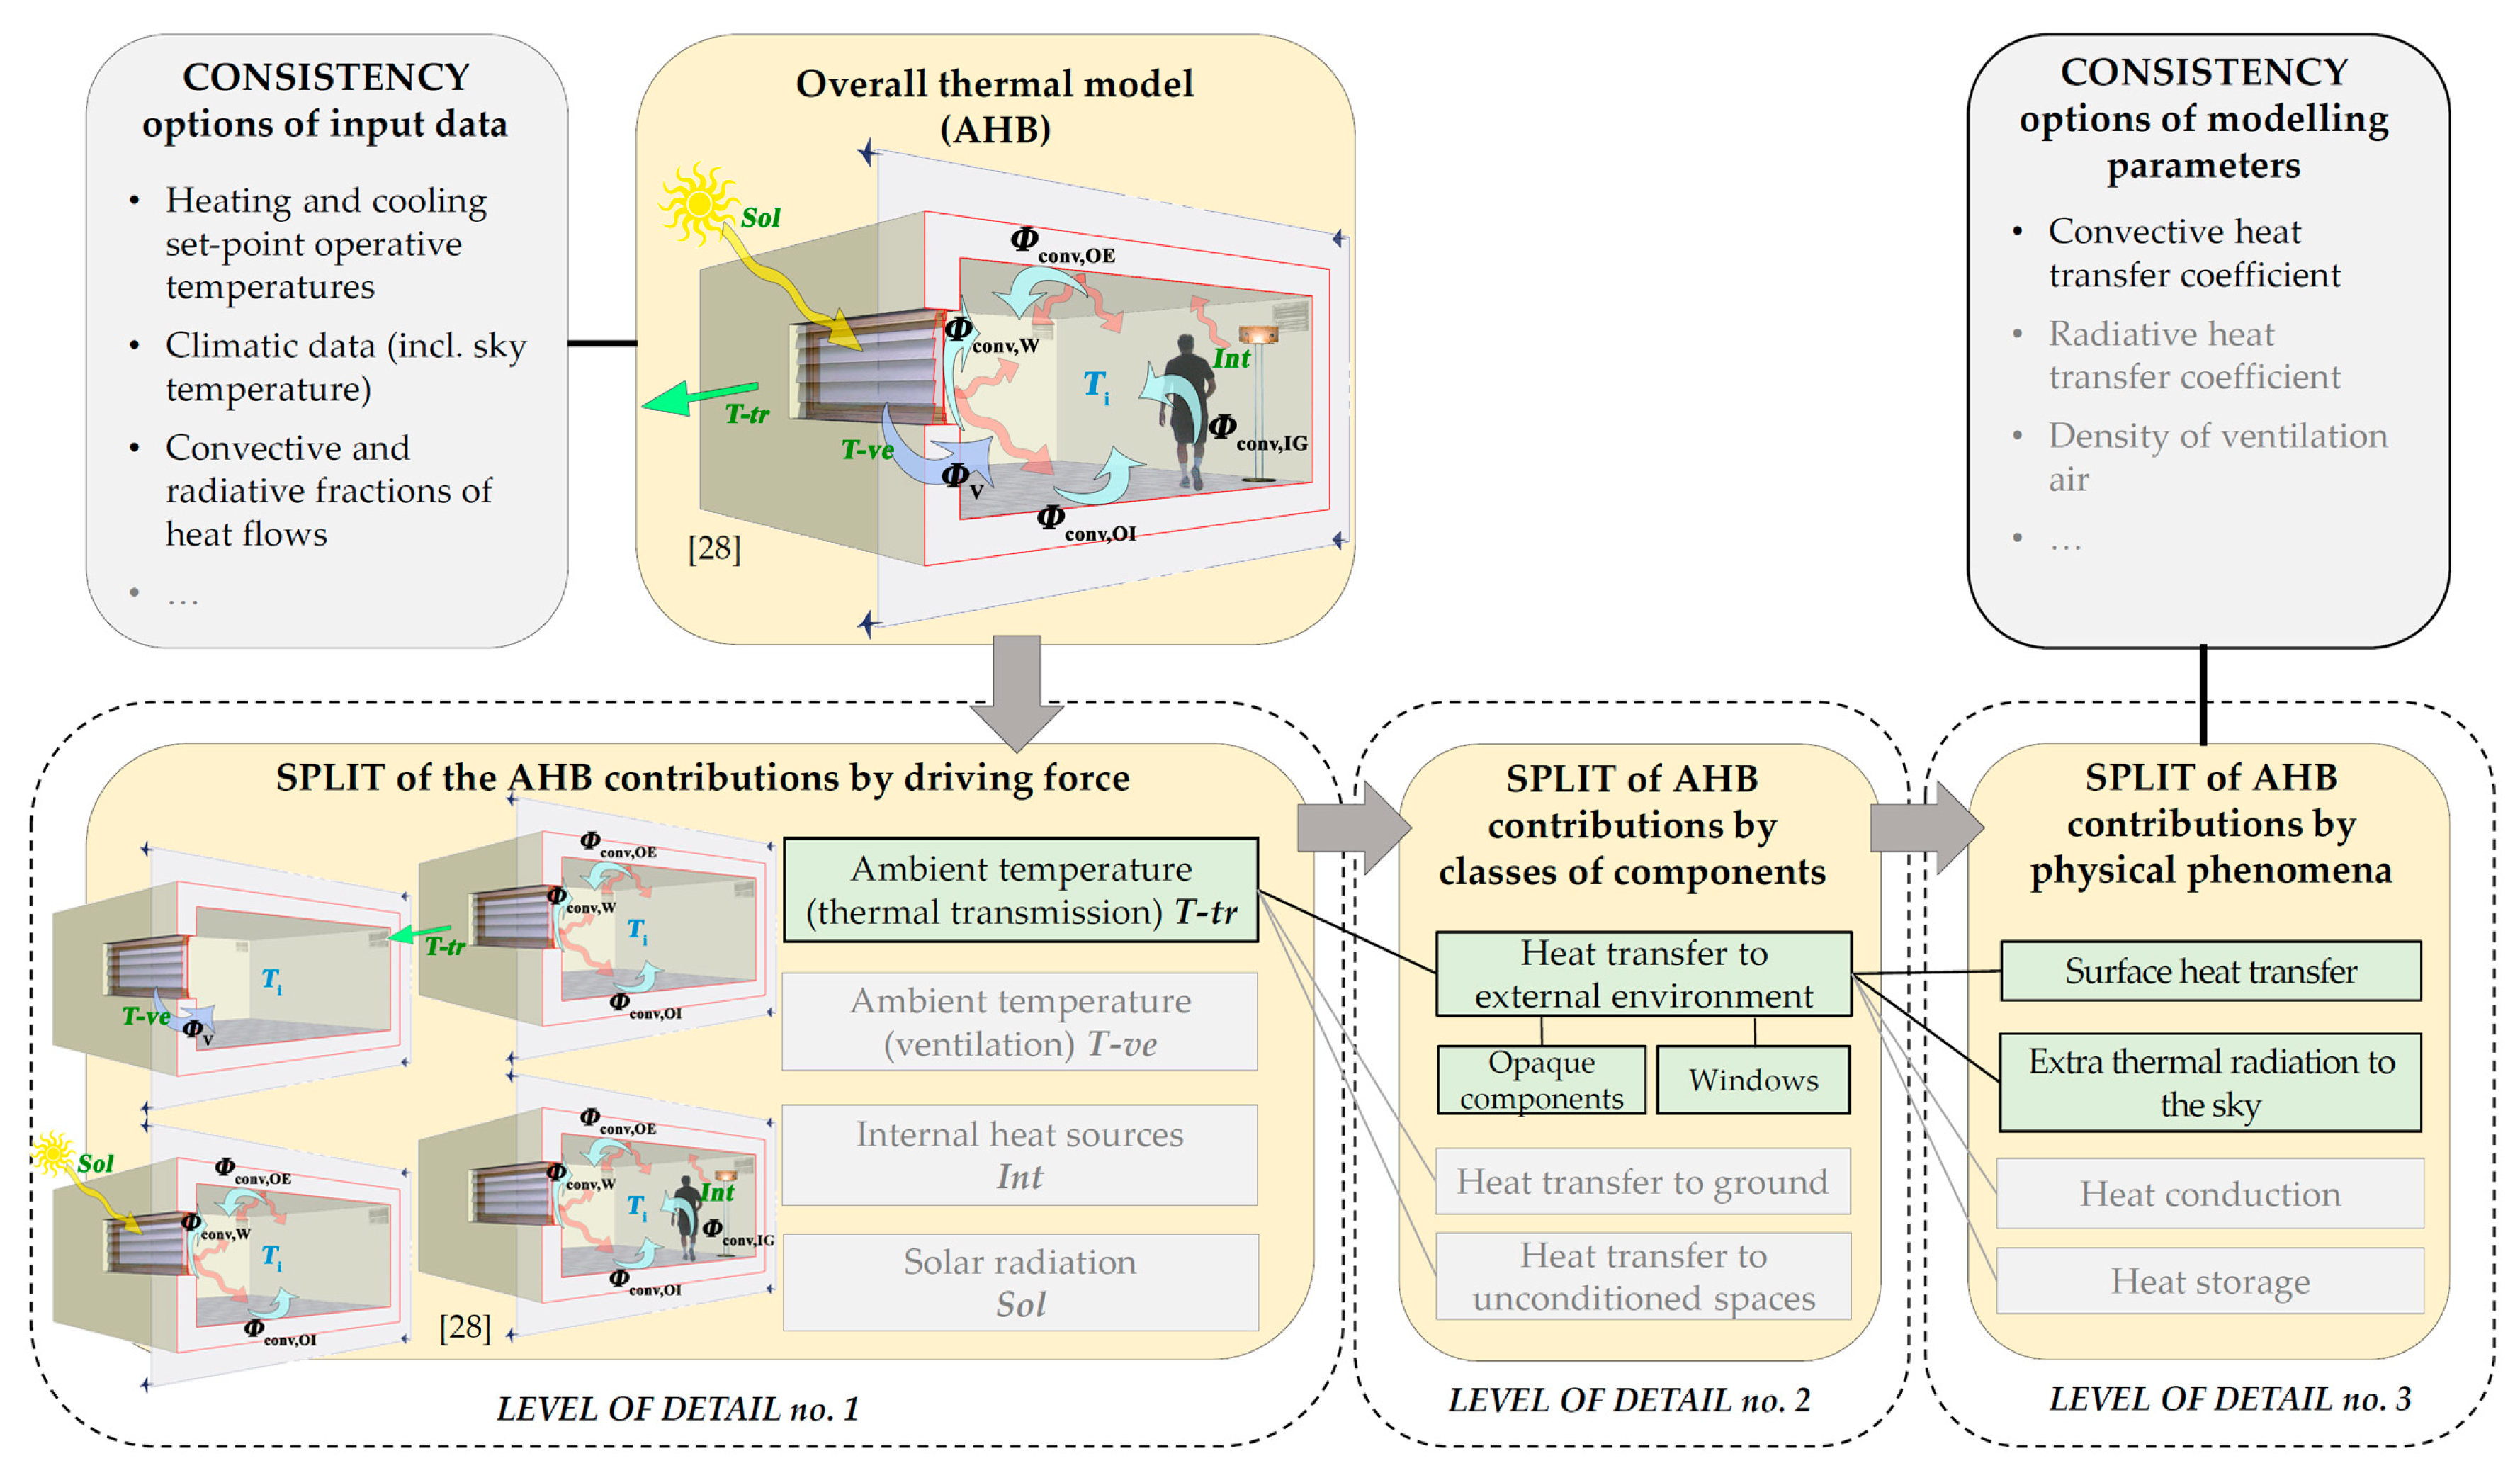
In order to identify the main causes of the deviation between the detailed dynamic method and the simple hourly method, the workflow of Figure 2, further detailed in Figure 3, has been followed.
Starting from the building thermal model, a preliminary activity consists in the application of consistency options of the input data as to make the results of the two calculation methods comparable. A detailed performing of this activity is described in [23] and summarized in Section 3.3 for the analyzed case study.
Subsequently, three different analyses characterized by different levels of detail are carried out. The first level analysis consists of the split of the AHB contributions by driving force. The dynamic driving forces that affect the different terms of the air heat balance (AHB) equation are identified, and listed as follows:
  • ambient temperature since it causes the heat transfer by thermal transmission, T-tr,
  • ambient temperature since it causes the heat transfer by ventilation, T-ve,
  • internal heat sources, Int,
  • solar radiation, Sol.
In each calculation method, the terms of the AHB equation (Equation (1)) are split as a function of the above-mentioned dynamic driving forces, following the methodology developed and validated in Ballarini et al. [28]. Sequential simulations are run on the same building model and in the same indoor conditions, adding a different driving force each time. This methodology adopts the principle of superposition of effects, in order to identify the amount of each driving force to the AHB. For each simulation in the sequence, the amount of each contribution is obtained by difference between the results of that simulation and the results of the previous one.
All the simulations have to be run under the same indoor temperature schedules so that the consistency of the results and the absence of mutual effects between the different driving forces are assured.
The performed simulations follow the sequence listed below.
  • A first simulation is run using a dead band thermostat with the lower limit equal to the heating set-point temperature, the upper limit equal to the cooling set-point temperature, and considering all the driving forces. The hourly values of the indoor temperature obtained as outputs are used as a fixed set-point temperature schedule in the subsequent simulations.
  • A second simulation is performed removing the solar radiation and the internal heat sources, so that the only considered driving force is the ambient temperature. In this way, it is possible to identify the only effect of the outdoor temperature (T-tr), which determines thermal transmission through the envelope components, on the AHB terms. The AHB terms are the convective heat flows that are exchanged between the internal air and the surfaces of the building components. The heating/cooling loads can be determined as well. The effect of ventilation due to the outdoor air temperature (T-ve), as a purely convective thermal load, can be obtained directly.
  • A third simulation includes the internal heat sources (Int). It is possible to identify the convective part of the internal heat gains, which is a direct load on the node air, and the convective heat flows exchanged between the internal air and the surfaces due to the radiative part of the internal heat gains, by difference from the second simulation.
  • Finally, the comparison between the third and the first simulation allows to identify the contribution of the solar radiation (Sol), in terms of the convective heat flows exchanged between the internal air and the surfaces, due to the solar radiation entering into the room through the envelope components.
The comparison between the results deriving by the application of this methodology to each calculation method allows to identify those contributions of the AHB equation for which the highest deviations occur.
The second and third (detailed) analyses allow to further split the AHB contribution of each driving force by class of components (e.g., walls, windows, slab-on-ground floors…) and by physical phenomena involved (e.g., infrared radiation, convection, conduction, storage), respectively.
For each driving force, it is possible to identify and to investigate the different physical phenomena that correlate the cause (i.e., driving force) to the effect (i.e., AHB contribution). In this way, it is possible to quantify the effect that a different modeling of the physical phenomenon by the simulation methods has on the building EP.
For each phenomenon, consistency options of modeling parameters are applied both to the simple hourly method and to the detailed dynamic one. In this way, it is possible to separate the effects of different modeling parameter from the effects of the model itself.
For both EnergyPlus and EN ISO 52016-1, the quantification of these effects is assessed by the differences with respect to the results obtained in the previous simulation, in which the modeling parameter or physical phenomenon has not been made consistent between the calculation methods. Thermal loads—in case of heating/cooling operation—and indoor operative temperature—in case of free-floating condition—are provided as outputs.
The present work focuses on the T-tr driving force. The deepening of the other driving forces was excluded at the moment, as justified later in Section 4.1. As concerns the T-tr driving force, the consistency of modeling parameters involved the surface heat transfer, by setting consistent convective heat transfer coefficients in EN ISO 52016-1 and EnergyPlus. Modeling parameters related to other physical phenomena, such as the heat transfer to ground and the heat transfer to unconditioned spaces, were excluded at the moment because such adjacent environments are absent in the analyzed case study.
According to the workflow shown in Figure 2 and Figure 3, the split of AHB contributions by physical phenomena proceeds with the removal of specific phenomena in both the models as to neutralize them. In the present study, as part of the T-tr driving force, the extra thermal radiation to the sky was annulled both in the simple hourly model and in the detailed dynamic one.

3. Application

3.1. Case Study Description

The analysis was applied to the archetype of a two-storey single-family house selected within the IEE-TABULA (Typology Approach for Building Stock Energy Assessment) project [29]. Its geometry is representative of the single-family house type in northern Italy.
The analysis was carried out for the second storey of the building (Figure 4). The main geometric data of the building storey are listed in Table 1, while the thermo-physical parameters values of the building envelope components are shown in Table 2. The materials that constitute the building envelope components are listed in Table 3 together with their thermo-physical parameters.
Table 4 reports the areal heat capacity of the building components that was calculated as:
C = i = 1 N layers s i ρ i c i ,
where for each i-th layer of the building component, si is the thickness (in m), ρi is the density (in kg·m−3), and ci is the mass specific heat capacity (in J·kg−1K−1). In Table 4, it is also provided the effective areal heat capacity (κ) that reflects the dynamic response of the opaque component to a harmonic temperature variation that occurs on the internal/external side of the component, in accordance with the EN ISO 13786 standard [30].
The thermal insulation is placed on the exterior side of external walls and of horizontal enclosures. The external opaque surfaces are clear colored. The windows have double low-e glazing and wood frame, without solar shading devices. The first storey of the building is conditioned at the same temperature as the second storey, hence the intermediate floor was assumed adiabatic.

3.2. Boundary Conditions and Simplifying Assumptions

The hourly schedules of the sensible internal heat gains and natural ventilation flow rate were defined for workdays and weekends, distinguishing between occupied and unoccupied periods. The weekly mean value of internal gains is 5.4 W·m−2 and 0.4 h−1 of ventilation air change; both refer to a standard residential use. Continuous thermal system operation with a dead-band thermostat range, with lowest limit at 20 °C (heating mode) and highest limit at 26 °C (cooling mode), was considered.
The building is located in Torino (north-west of Italy). Torino (45° North latitude, 230 m a.s.l. altitude) is characterized by 1.3 °C and by 23.7 °C as mean outdoor air temperature in the coldest month (January) and in the warmest month (July), respectively. The test reference year database of the Italian Thermotechnical Committee [31] was used as source of weather data.
To carry out a preliminary comparison of the calculation methods, some boundary aspects were excluded from the numerical simulations by adopting the following simplifying assumptions:
  • building envelope without thermal bridges,
  • neither ground nor unconditioned rooms as boundary spaces,
  • absence of external obstructions (no solar shading).

3.3. Consistency Options of Input Data

Consistency options of input data were adopted in the models to make the results comparable. In addition, some input parameters of the EN ISO 52016-1 method were calculated in a more accurate way, differently from the default values of the standard, as to allow the comparison with the detailed dynamic simulation. In this way, the deviations with respect to EnergyPlus only depend on the modeling options of the physical phenomena and not on the input data.
It is important to highlight that some input data are only required by one of the two calculation methods. An example of these data is shown in Table 5. The wind speed is only needed in EnergyPlus to assess the convective heat transfer coefficient, while the simple method adopts a fixed value of this coefficient. The air density is a fixed key parameter of the simple hourly method, while the detailed dynamic model evaluates it in function of the air temperature. The solar properties of the glazing differ in the two calculation methods: detailed properties (i.e., solar transmission and solar absorption factors provided by angle of incidence, for each side of the glazed pane) are required in EnergyPlus, while EN ISO 52016-1 requires the total solar energy transmittance (g-value) of the glazing. With the purpose of giving consistency to input data, the detailed solar properties were set in EnergyPlus as to provide the same g-value used in the simple hourly model.
Consistency options of the modeling parameters are then applied afterwards, as described in Section 2.2, to specifically derive the causes of deviations.
The adopted consistency options of the input data are listed and described as follows.
  • Heating and cooling set-point temperatures. For both models, heating and cooling set-points are referred to the operative temperature.
  • Sky temperature. The extra thermal radiation to the sky was modeled fixing an 11 K difference between the air temperature and the apparent sky temperature, as specified in EN ISO 52016-1.
  • Convective and radiative fractions of heat gains. In both models, the heat supplied by heating and cooling systems to the thermal zone was set completely convective, while the heat flow from internal sources was assumed 40% convective and 60% radiative.
The two calculation methods implement different models of the building heat capacity. In the present work, in EnergyPlus, external walls, roof and intermediate floor were geometrically modeled, and the finite difference heat conduction model was applied. Internal vertical partitions were modeled considering the thermo-physical properties of the internal walls layers and the area exposed to internal air. The partitions interact convectively and radiatively with the zone air and the other surfaces of the zone.
In EN ISO 52016-1, the building components were modeled as well. Following Table 4, the heat capacity of each envelope component was applied to the internal surface node, in accordance with the mass position class (Class I—mass concentrate at the internal side) defined in EN ISO 52016-1—Annex B [4]. In both dynamic models, furniture heat capacity was applied on the air node.
As the analysis has been focused on the assessment of the thermal loads for space heating and space cooling, the effects of specific technical building systems were not considered and an ideal system operating with an infinite heating/cooling capacity was assumed in both calculation models.

4. Results and Discussion

4.1. Split of the AHB Contributions by Driving Force

The monthly values of the energy needs for heating and cooling of the case study for the simple hourly method and EnergyPlus are shown in Figure 5. The annual heating energy need normalized on the conditioned net floor area amounts to 51.2 and to 49.5 kWh·m−2, assessed by the hourly method of EN ISO 52016-1 and by EnergyPlus, respectively. Thus, the simplified method overestimates the yearly heating need of 3.4% compared to the detained method. The annual cooling energy need normalized on the conditioned net floor area is 16.8 and 17.8 kWh·m−2, assessed by the hourly method of EN ISO 52016-1 and by EnergyPlus, respectively. Thus, the simplified method underestimates the yearly cooling need of 5.6% compared to the detailed method.
Despite the deviation in the energy needs being low, the main deviations occur in the hourly profile of the thermal loads for heating and cooling, as shown in Figure 6 and Figure 7 for a sample week of January and July, respectively. The root mean square deviation (RMSD) of the two calculation methods is 1.78 W·m−2 for the heating load and 2.33 W·m−2 for the cooling load, both normalized on the conditioned net floor area, in the respectively analyzed weeks.
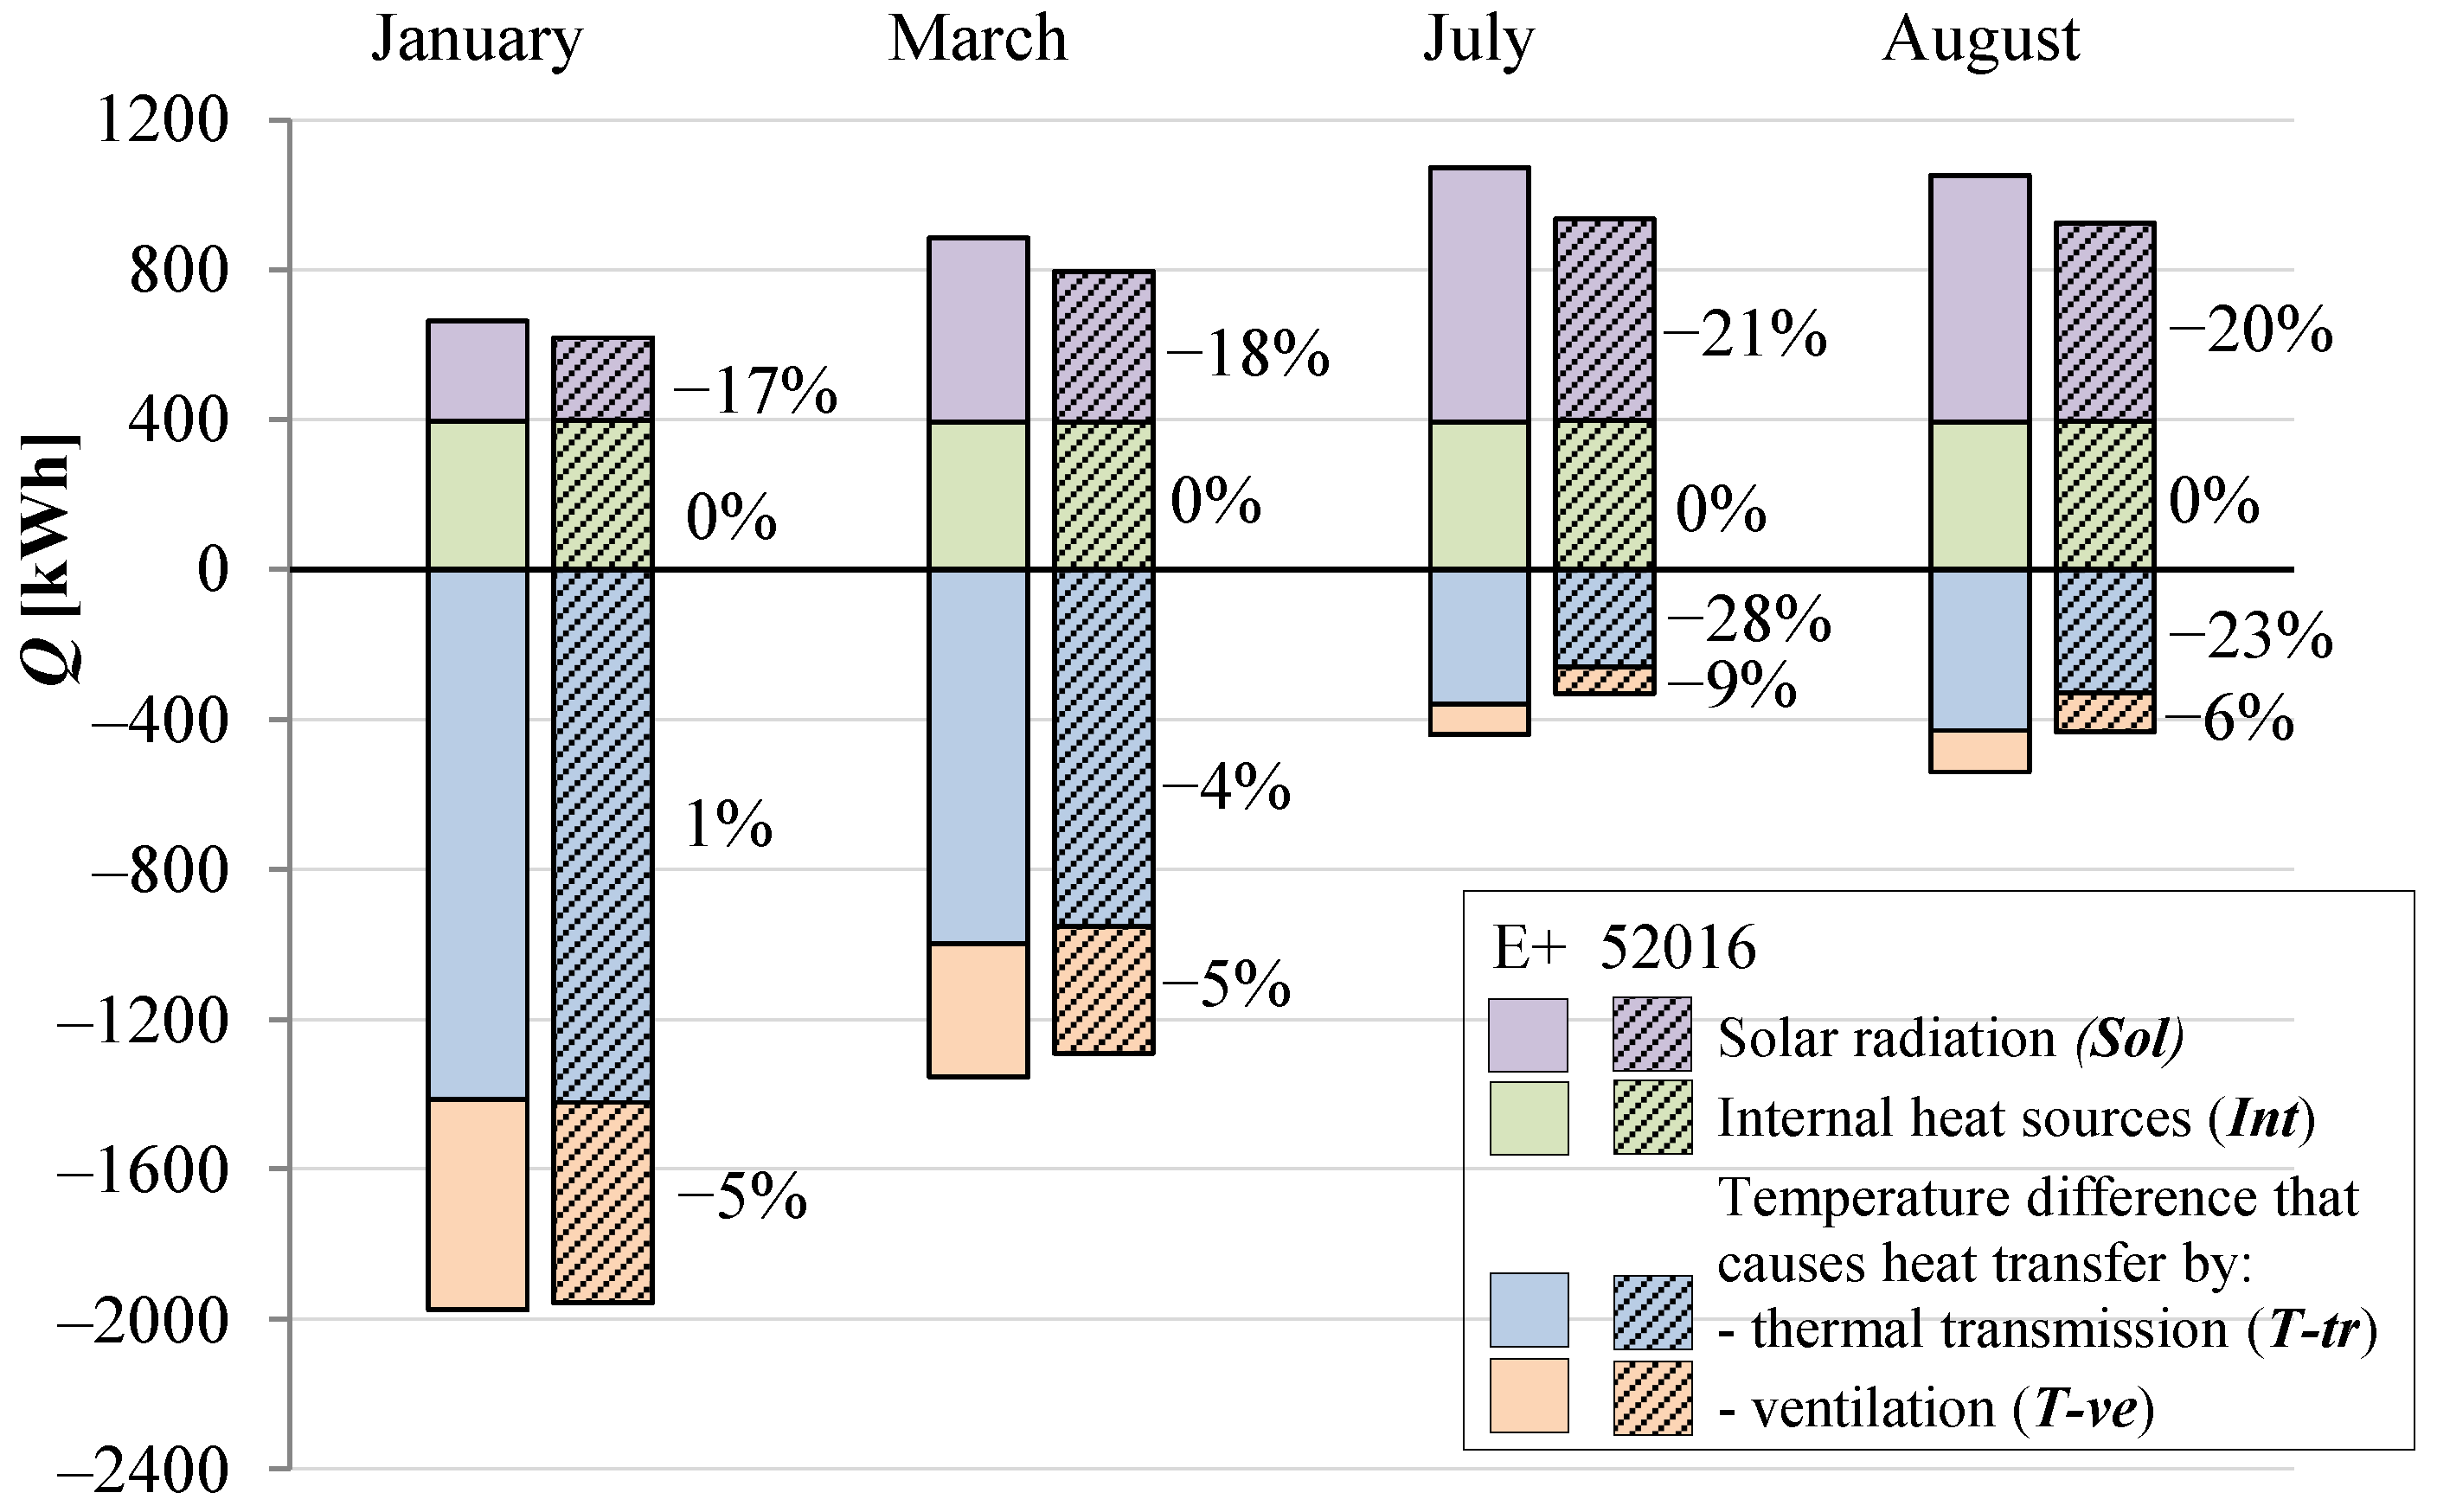
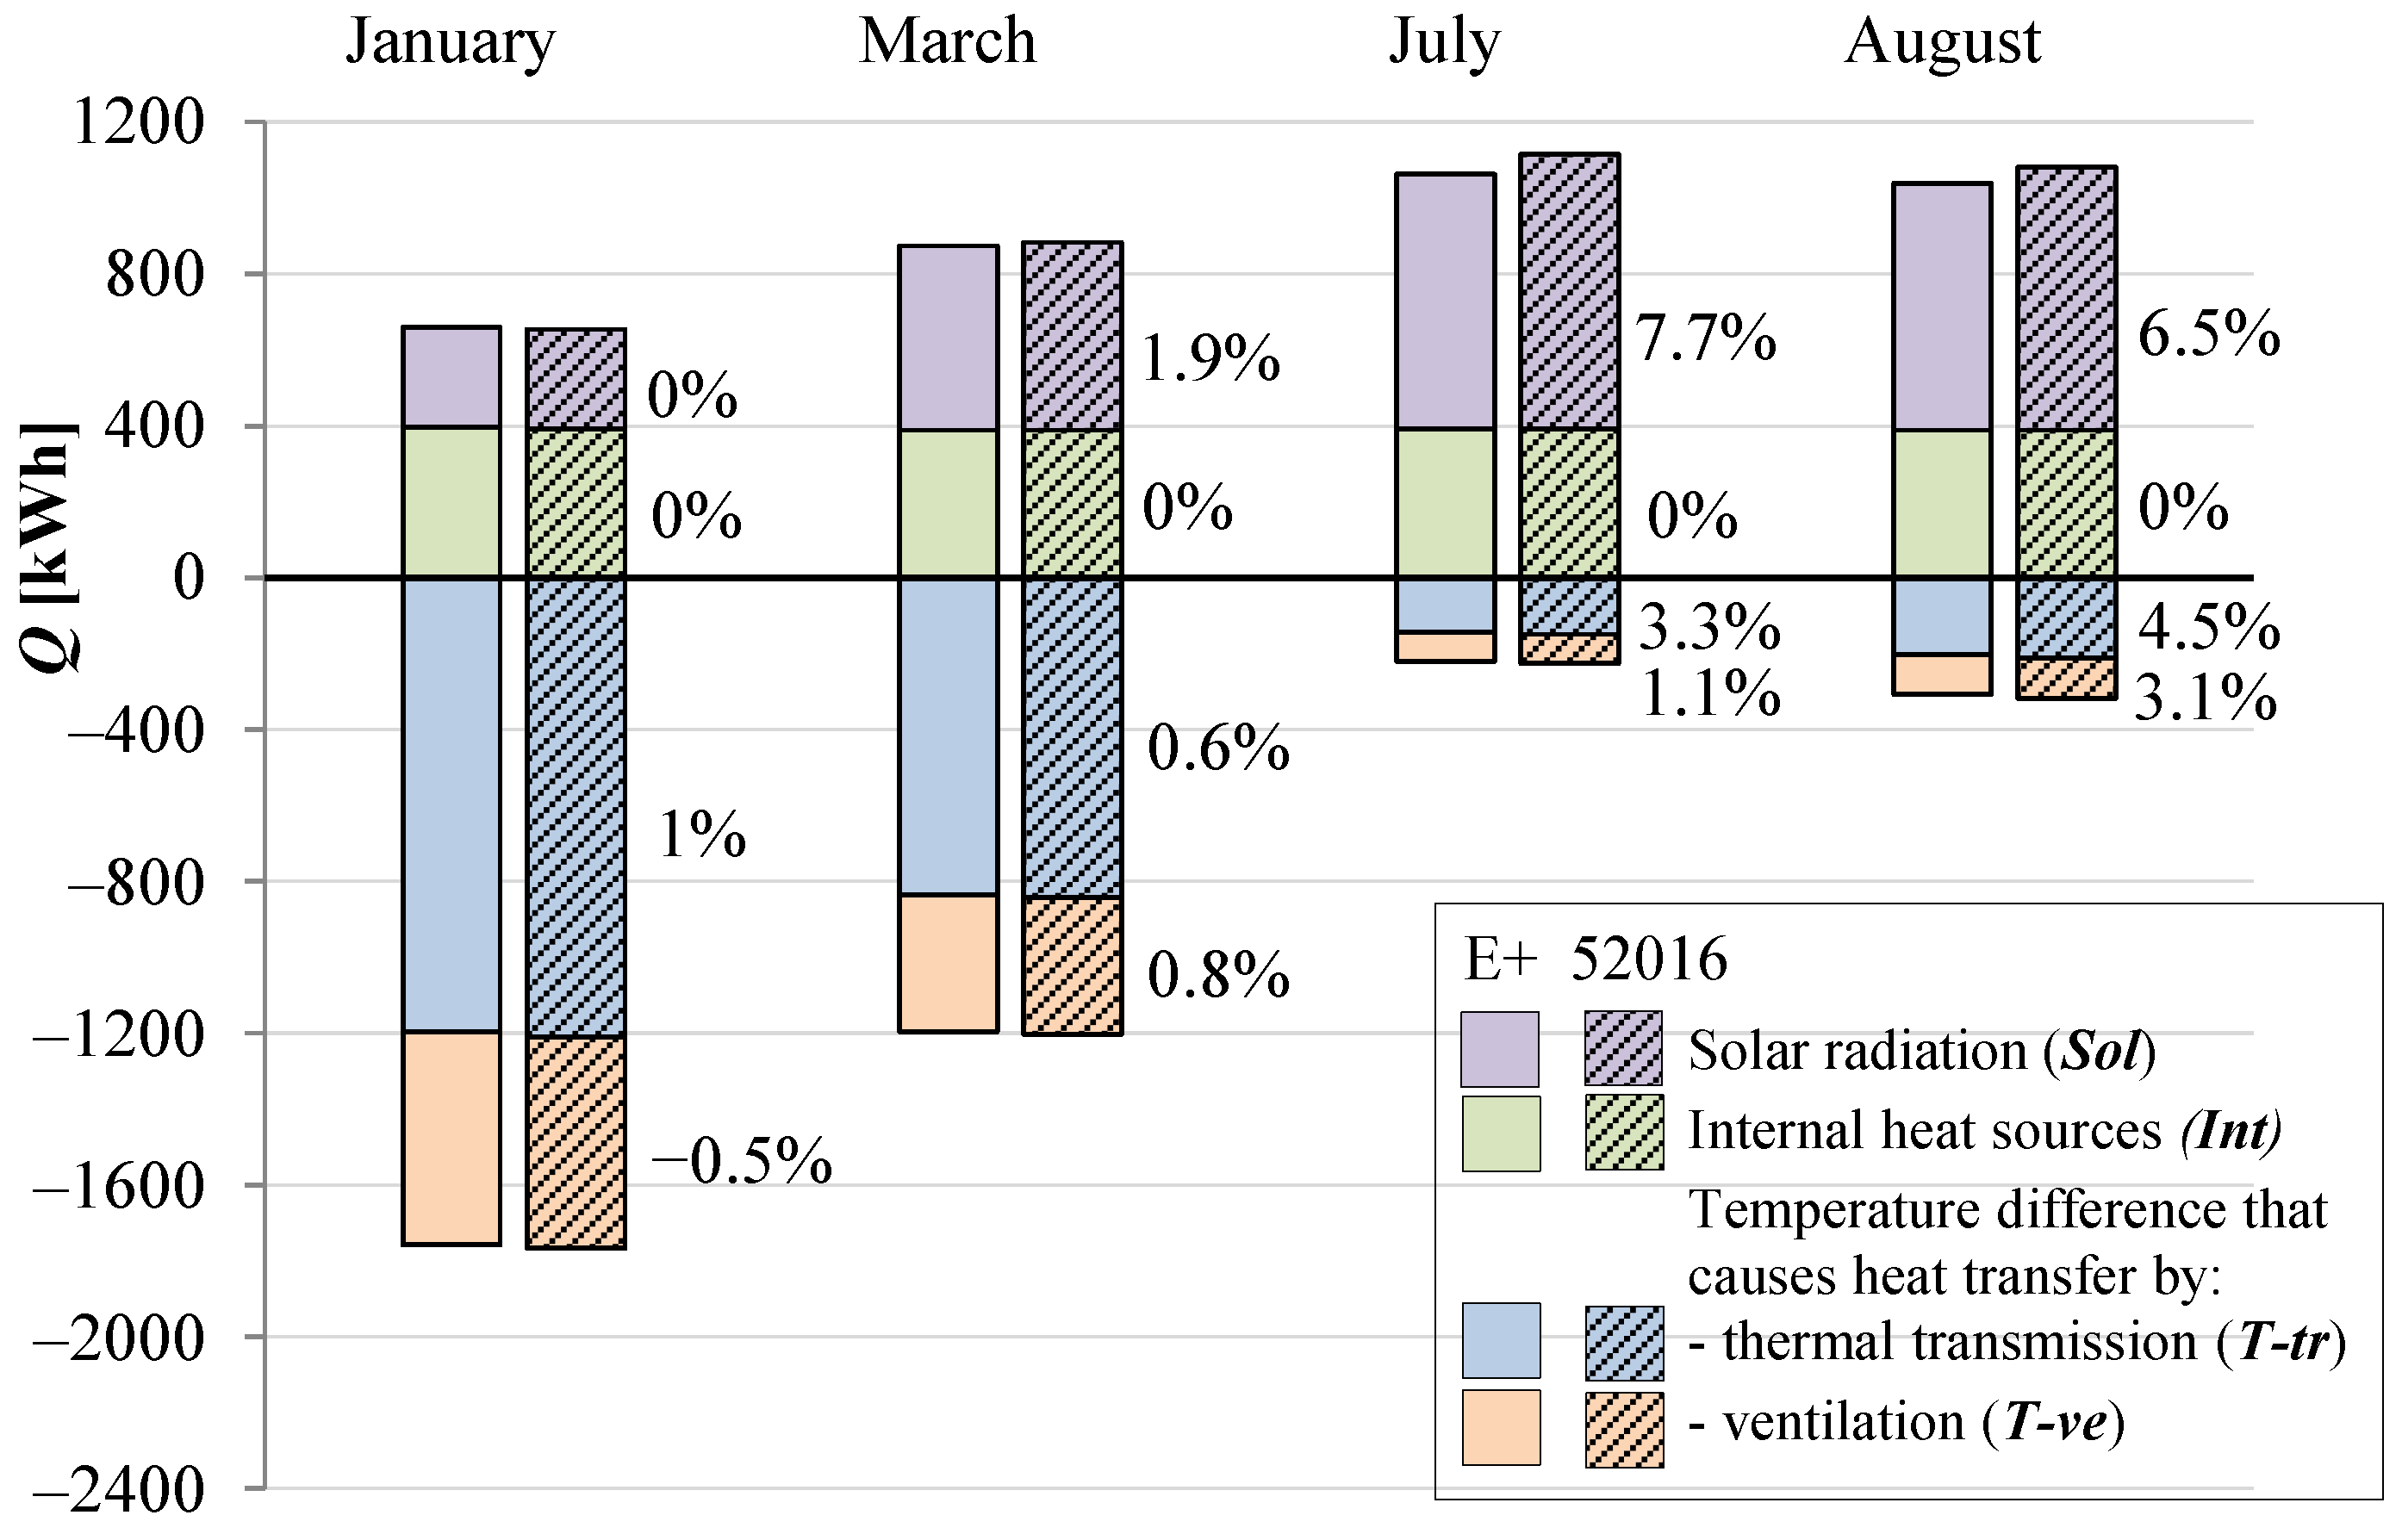
Through the split of the air heat balance contributions by dynamic driving force, it is possible to quantify to what extent the deviation between simulation models can be ascribed to each driving force, and consequently, to the related physical phenomena. In Figure 8, the AHB terms for each driving force are presented for some representative months.
Figure 8 highlights that the EN ISO 52016-1 hourly method always underestimates the contribution of each driving force if compared to EnergyPlus. More in detail, the analysis shows that the greatest percentage differences between the considered models regard thermal transmission (T-tr) during summer, being −23% and −28% in August and July, respectively. In winter, the difference is quite negligible.
Other important differences concern the effects of solar radiation (Sol). In both seasons, in fact, the EN ISO 52016-1 underestimation is between −17% and −21%.
As far as the ventilation heat exchange (T-ve) is concerned, the deviations are considerably lower, ranging from −5% in January and March up to −9% in July. These discrepancies are due to the value of the air density that is fixed in the simple hourly method while varies in function of the air temperature in EnergyPlus. At present, this modeling option has not been made consistent between the calculation methods and will be analyzed in future work.
Finally, no differences due to the effect of internal heat sources (Int) exist between the models.

4.2. Consistency Options of Modeling Parameters

The analysis proceeded to investigate the modeling of physical phenomena related to thermal transmission. As for ventilation, the solar radiation is excluded for now and will be analyzed in future works.
As concerns the T-tr driving force, the modeling parameters consistency involved the surface heat transfer, and the extra thermal radiation to the sky. In a first step, to make heat transfer consistent between the two models, the convective average heat transfer coefficients derived from EnergyPlus were applied to the EN ISO 52016-1 model. In sequence, the longwave thermal radiation to the sky was annulled.
The results are reported for January and July (one example week each), as representative months of the heating and the cooling season, respectively. For January, the heating loads are provided, while for July, the hourly profile of indoor operative temperature (free-floating) is given, because the absence of solar radiation and internal heat sources makes the cooling need equal to zero (i.e., indoor temperature lower than the set-point) in large part of the time.
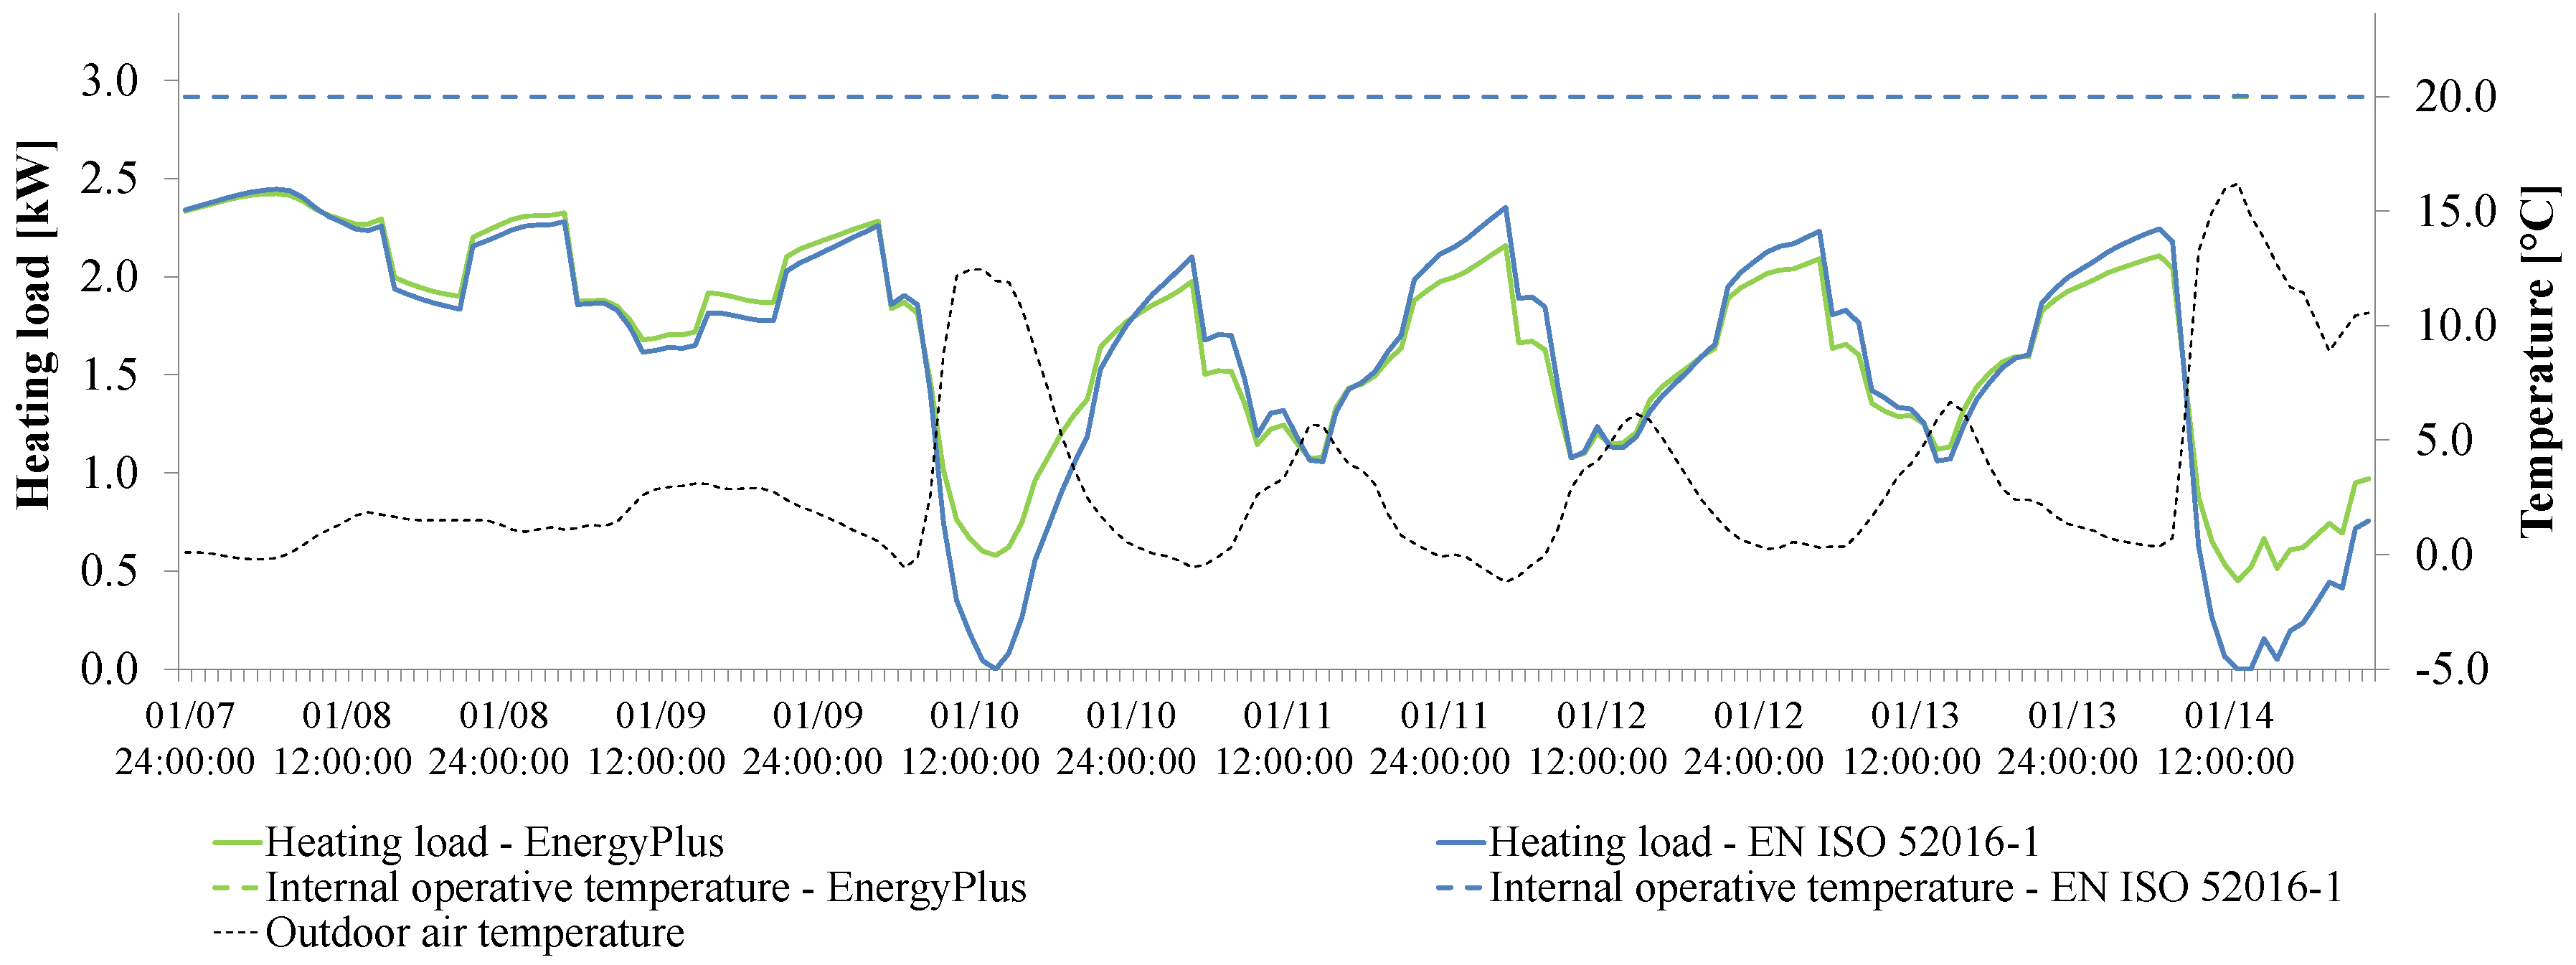
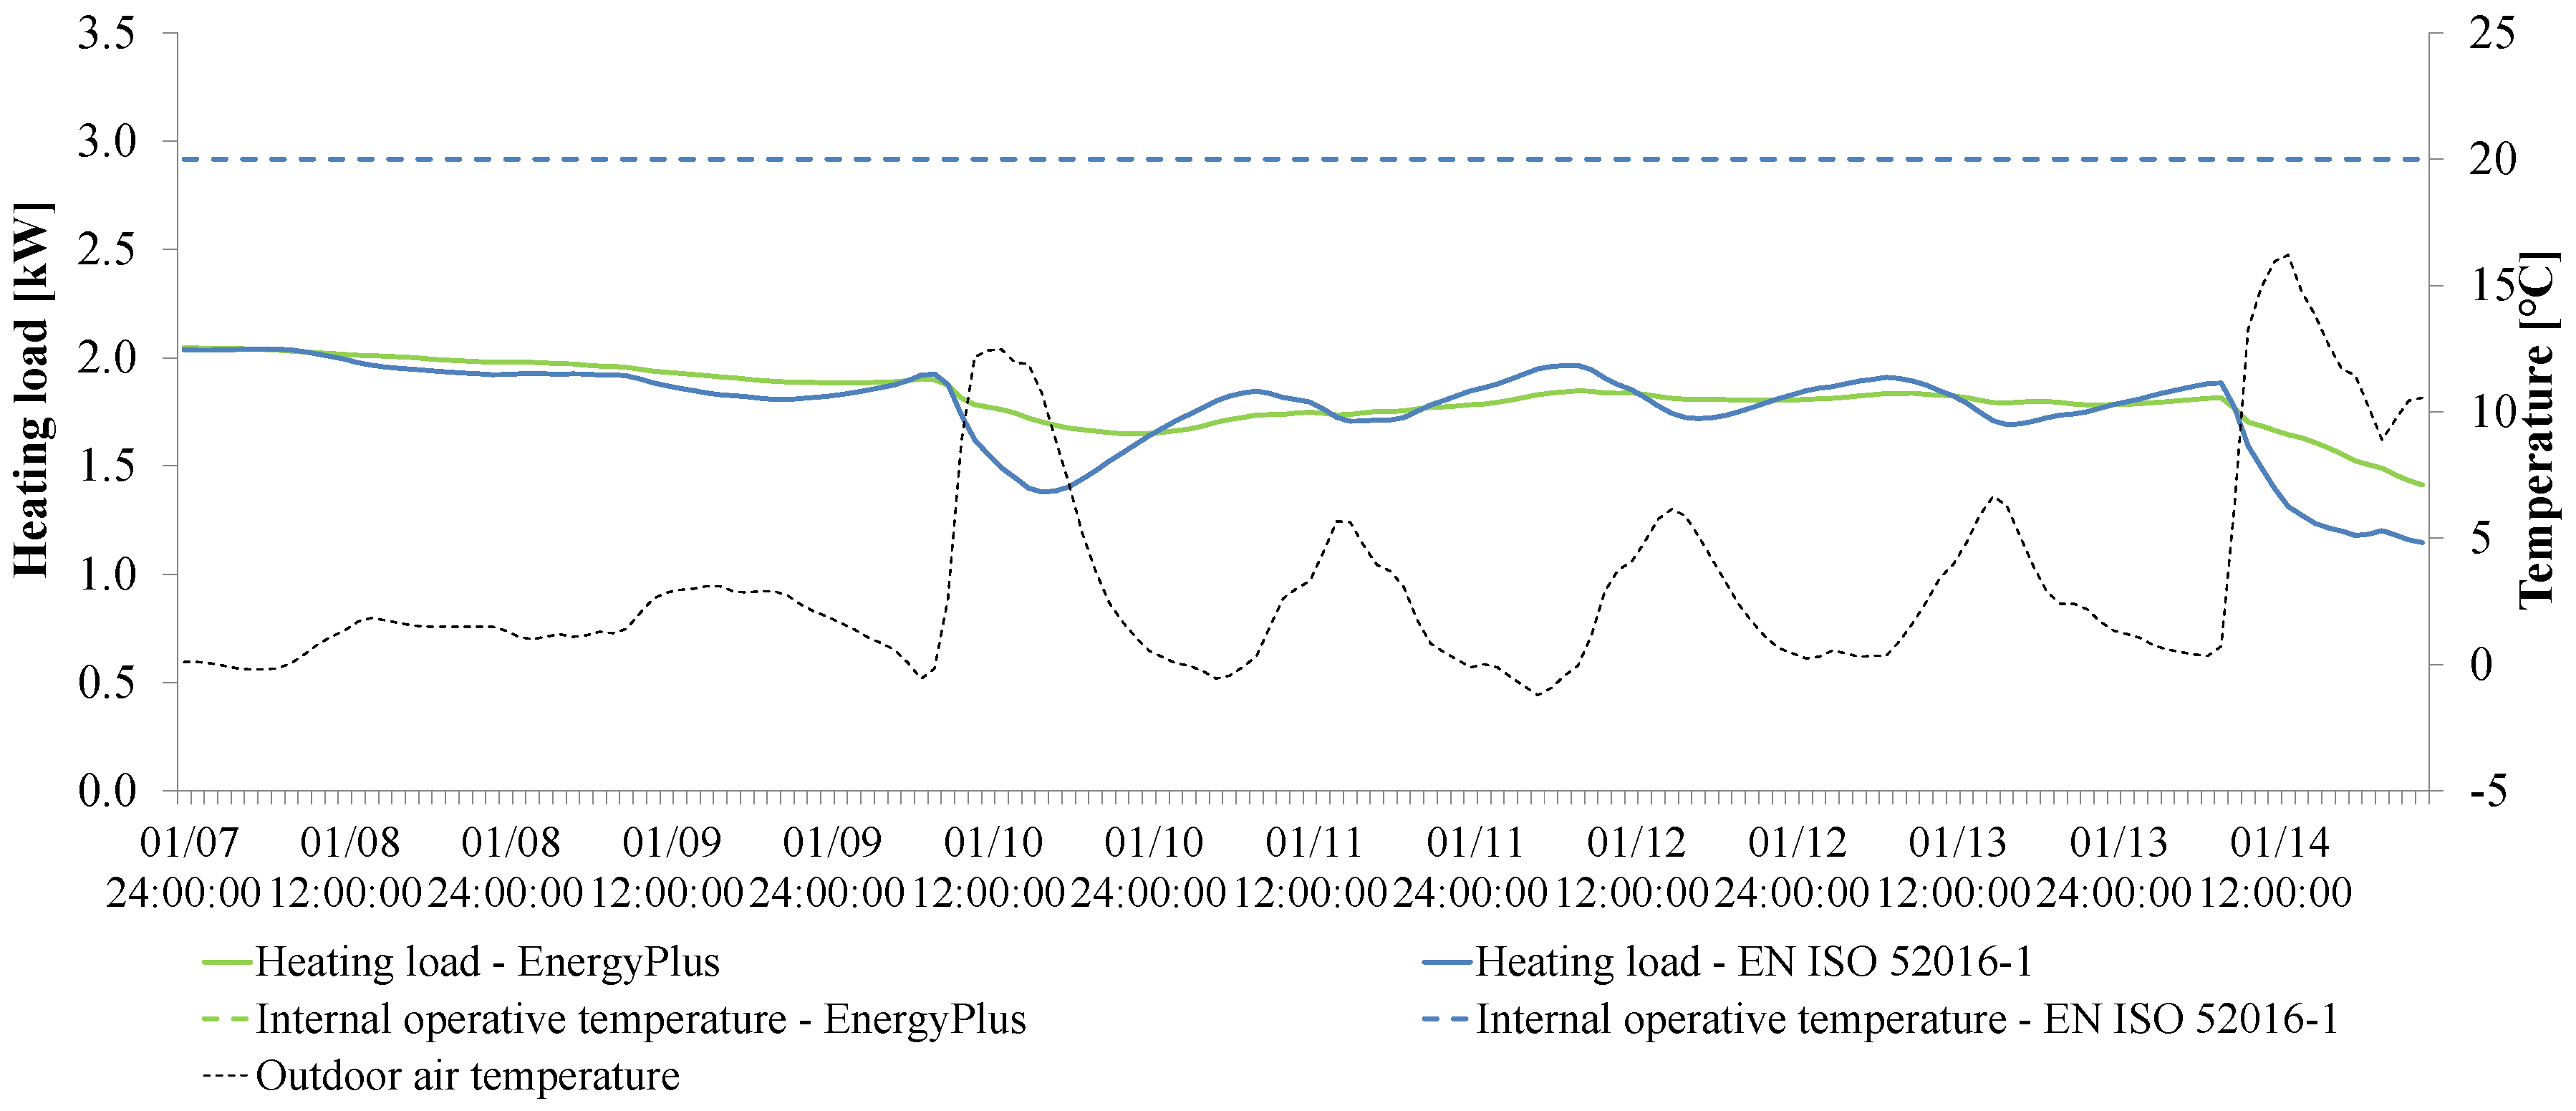
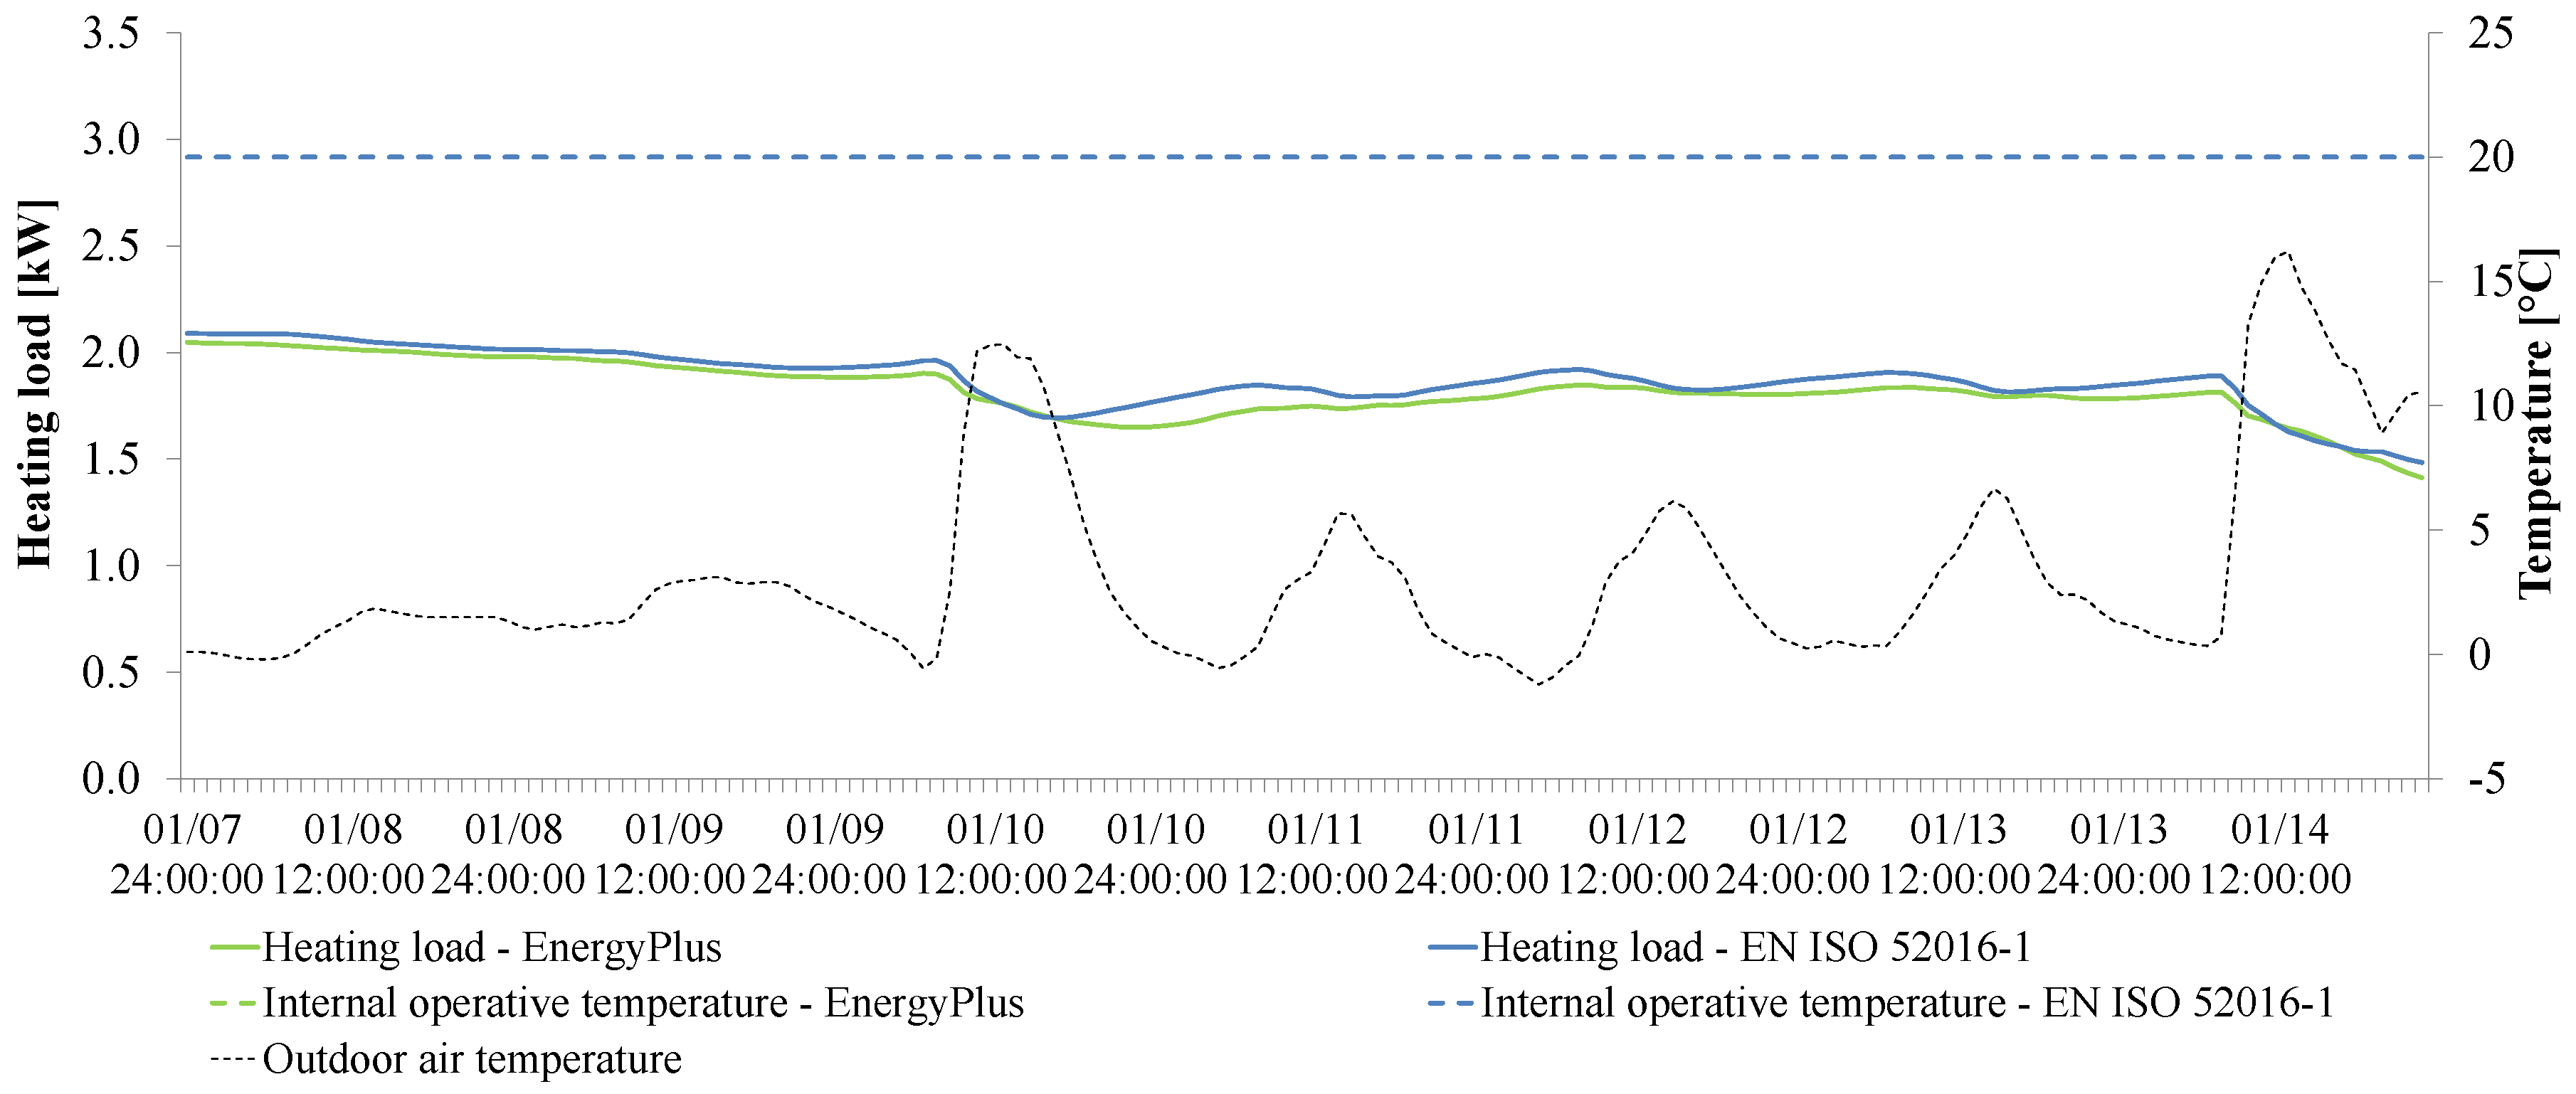
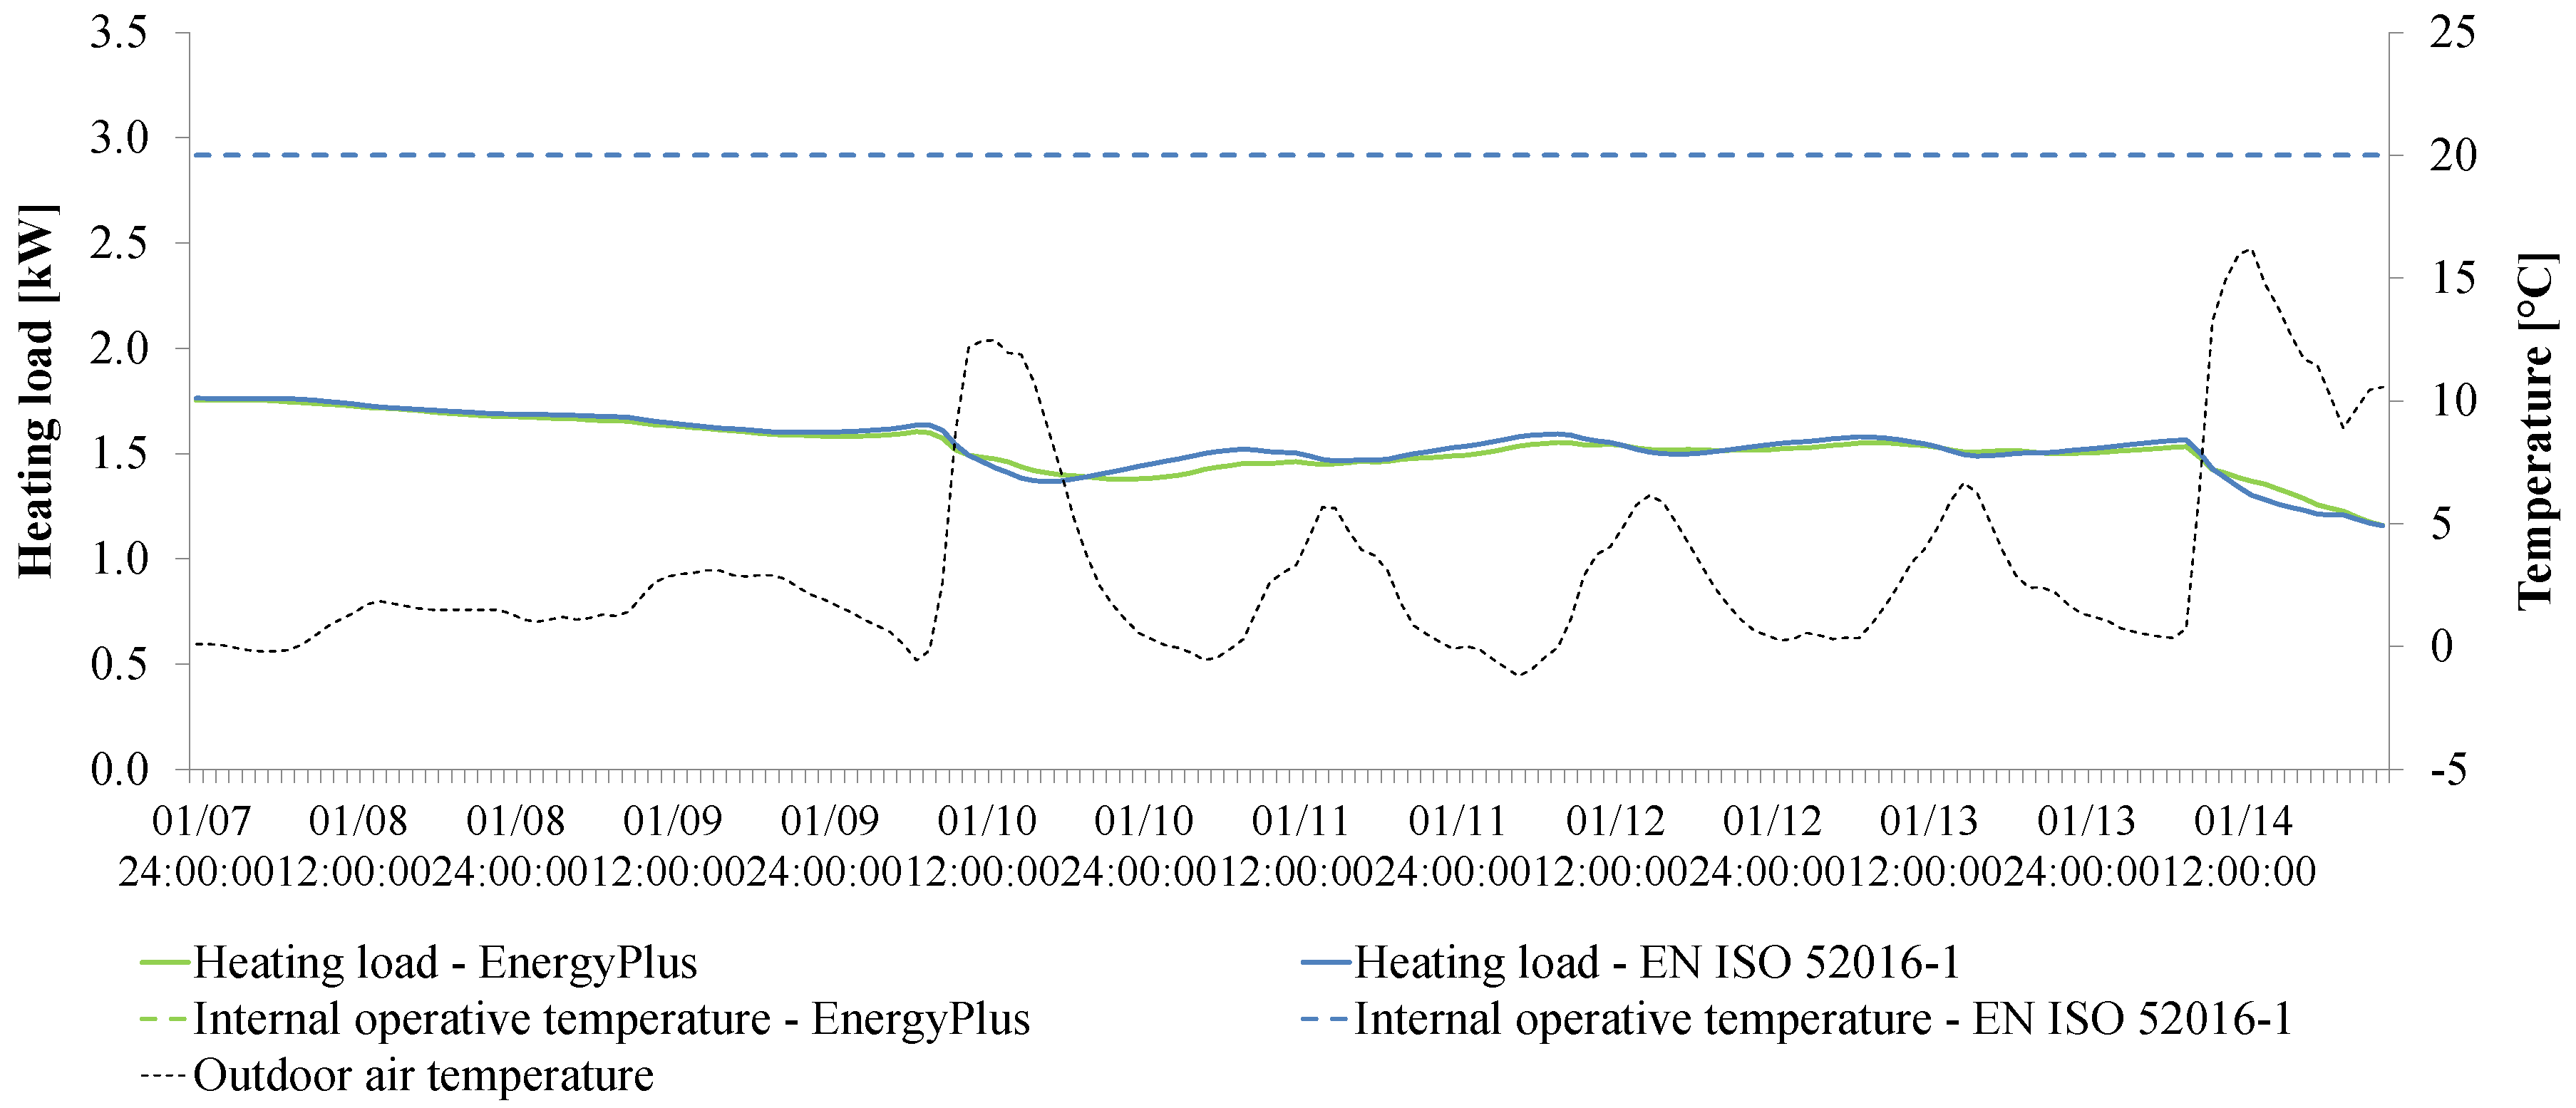
In Figure 9, the heating loads are shown for both EN ISO 52016-1 and EnergyPlus, considering the only effect of the T-tr driving force in the simulation of the case study. In Figure 10, the heating loads are provided assuming, in addition to the only effect of the T-tr driving force, consistent values of the convective heat transfer coefficients. To this purpose, the average convective heat transfer coefficients derived from EnergyPlus were applied to the EN ISO 52016-1 model. In sequence, the addition of the annulling of the longwave thermal radiation to the sky determines the heating loads shown in Figure 11 for both calculation methods.
Figure 9 shows that, when the only ambient temperature is applied as driving force, significant differences exist between the heating loads estimated by the two energy simulation methods (RMSD = 1.23 W·m−2). The heating load of EnergyPlus is less sensitive to the outdoor air temperature fluctuations compared to the EN ISO 52016-1 hourly method. This behavior is particularly evident, for example, on January 10th and 14th during which the sudden increases of the outdoor air temperature cause remarkable discrepancies between the heating loads.
A possible cause of this deviation consists in the convective heat transfer coefficients of the building envelope components, whose estimation differs between the models. In the simple hourly model of EN ISO 52016-1, fixed values of the surface heat transfer coefficients are assumed in compliance with the EN ISO 13789 standard [26], while EnergyPlus determines time-variant surface heat transfer coefficients as a function of wind speed. The former is generally higher than the latter, assessed on a monthly average. Higher external convective heat transfer coefficients in the simple dynamic model cause higher sensitivity of the heat transfer—and consequently of the heating load—to the outdoor temperature variation, compared to EnergyPlus. This hypothesis seems to be confirmed by the results of Figure 10, in which the consistency option adopted for the convective heat transfer coefficients (i.e., replacing of fixed values in the simple hourly model with those derived from EnergyPlus) reduced the amplitude of the heating load profile in the EN ISO 52016-1 model (RMSD = 0.58 W·m−2). In addition, by removing the effect of the extra longwave radiation to the sky (Figure 11), the deviation between the two assessment methods is further reduced (RMSD = 0.31 W·m−2); the heating loads now present very similar trends.
In Table 6, the root mean square deviations of the heating loads between the models are summarized for each consistency option applied. In winter, the effect of different modeling of the surface heat transfer on the heating loads deviation between the calculation methods is higher than that deriving from a different modeling of the extra thermal radiation to the sky.
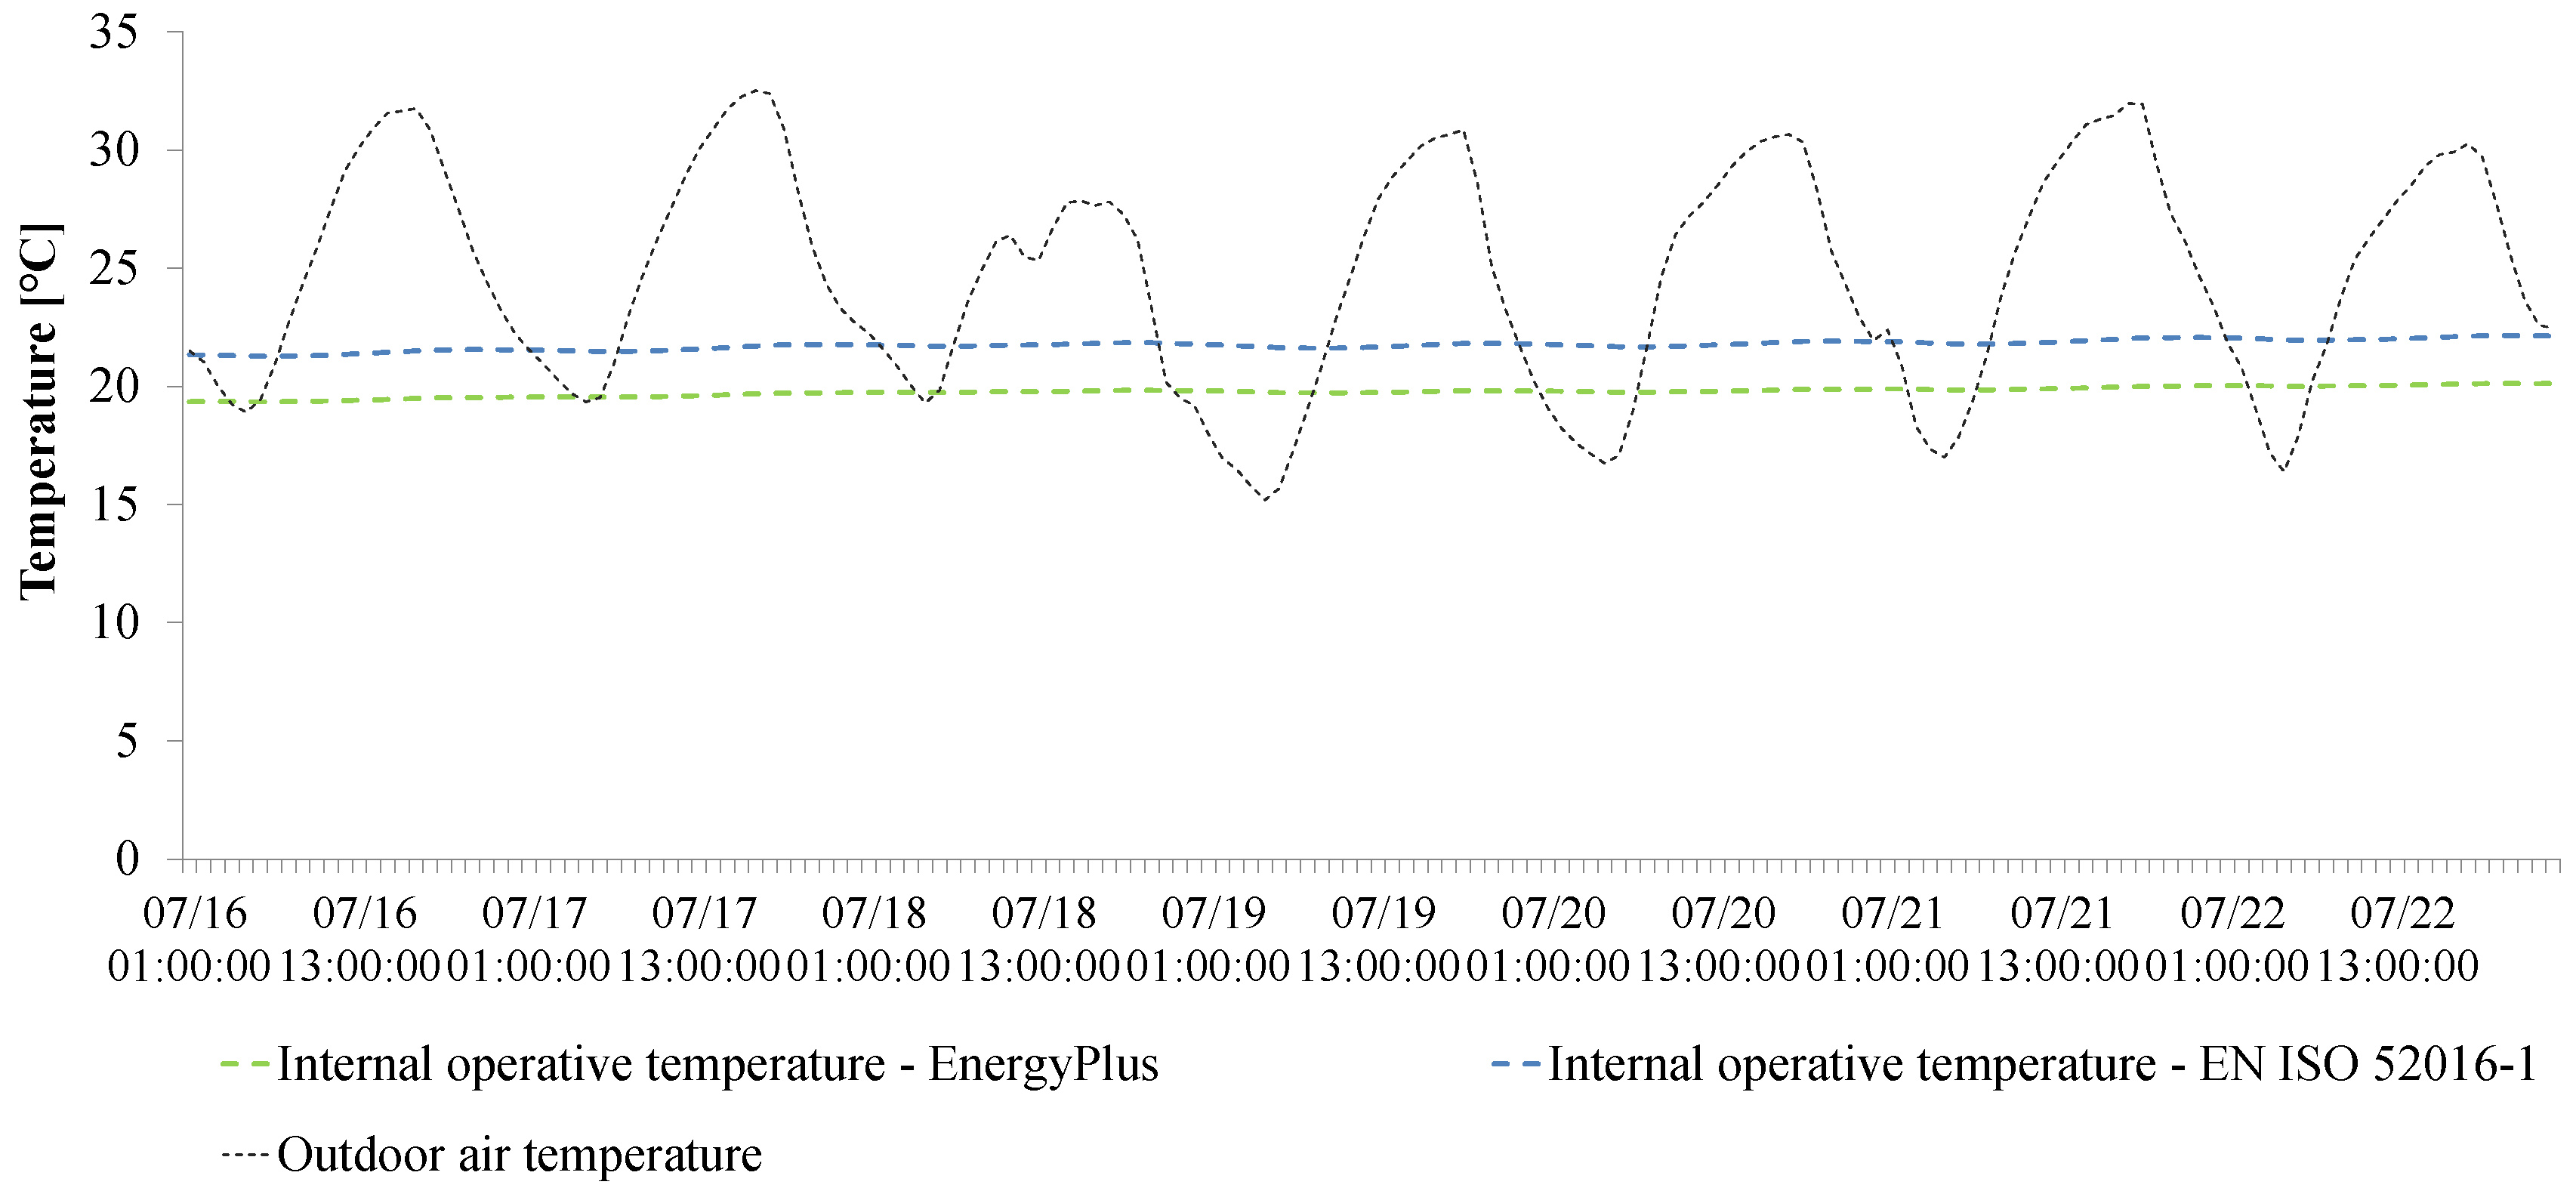
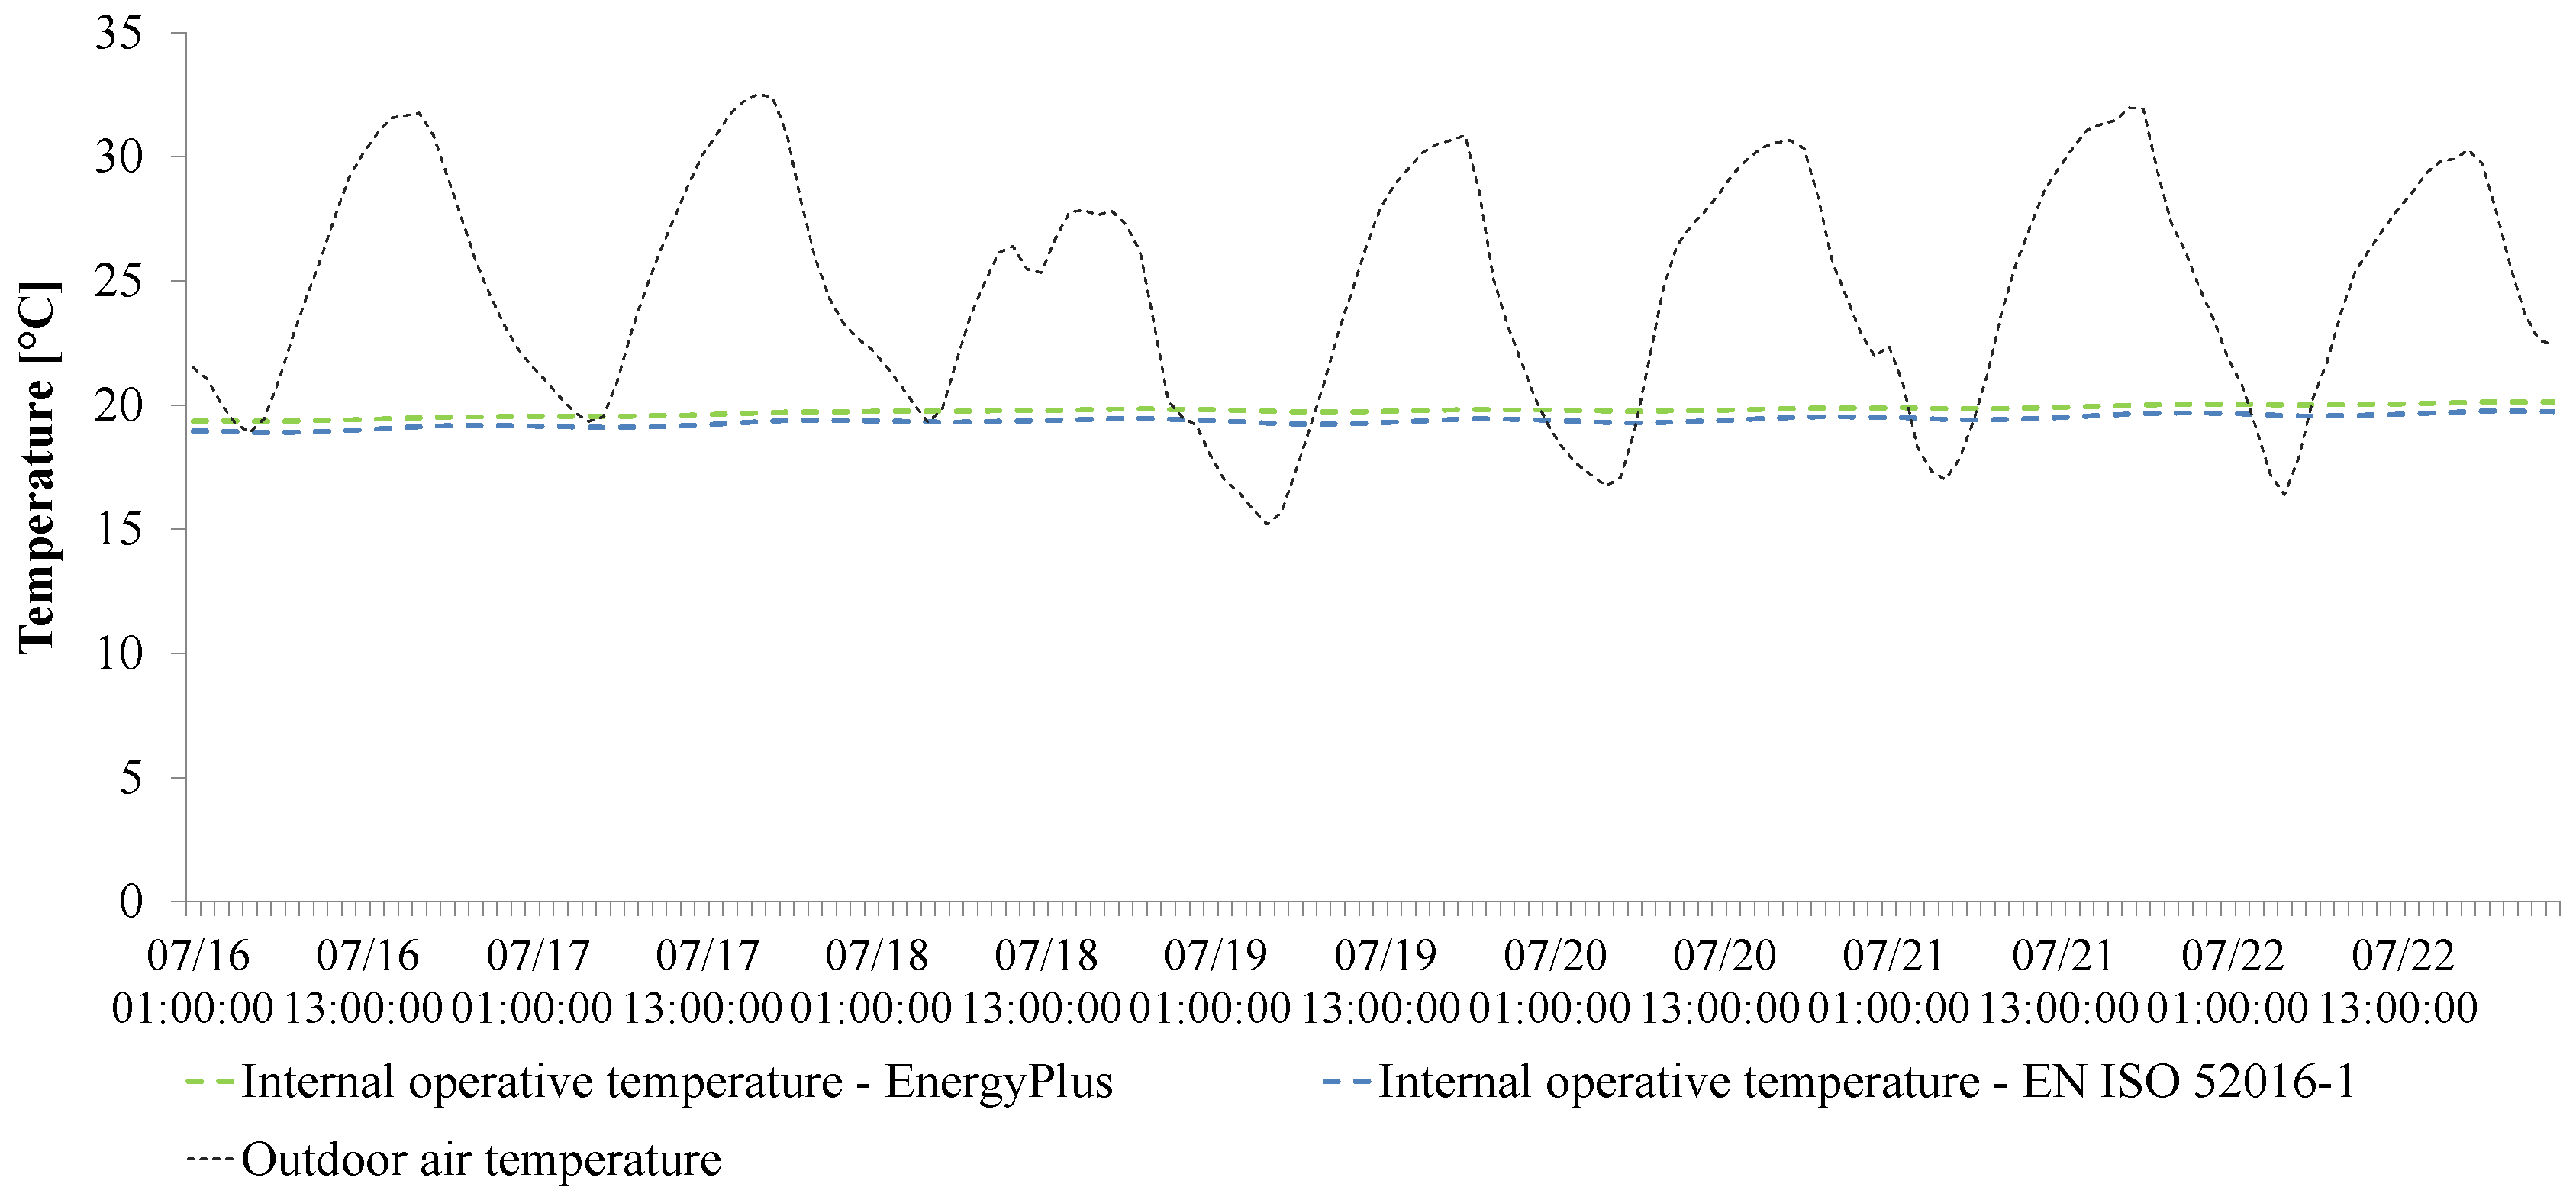
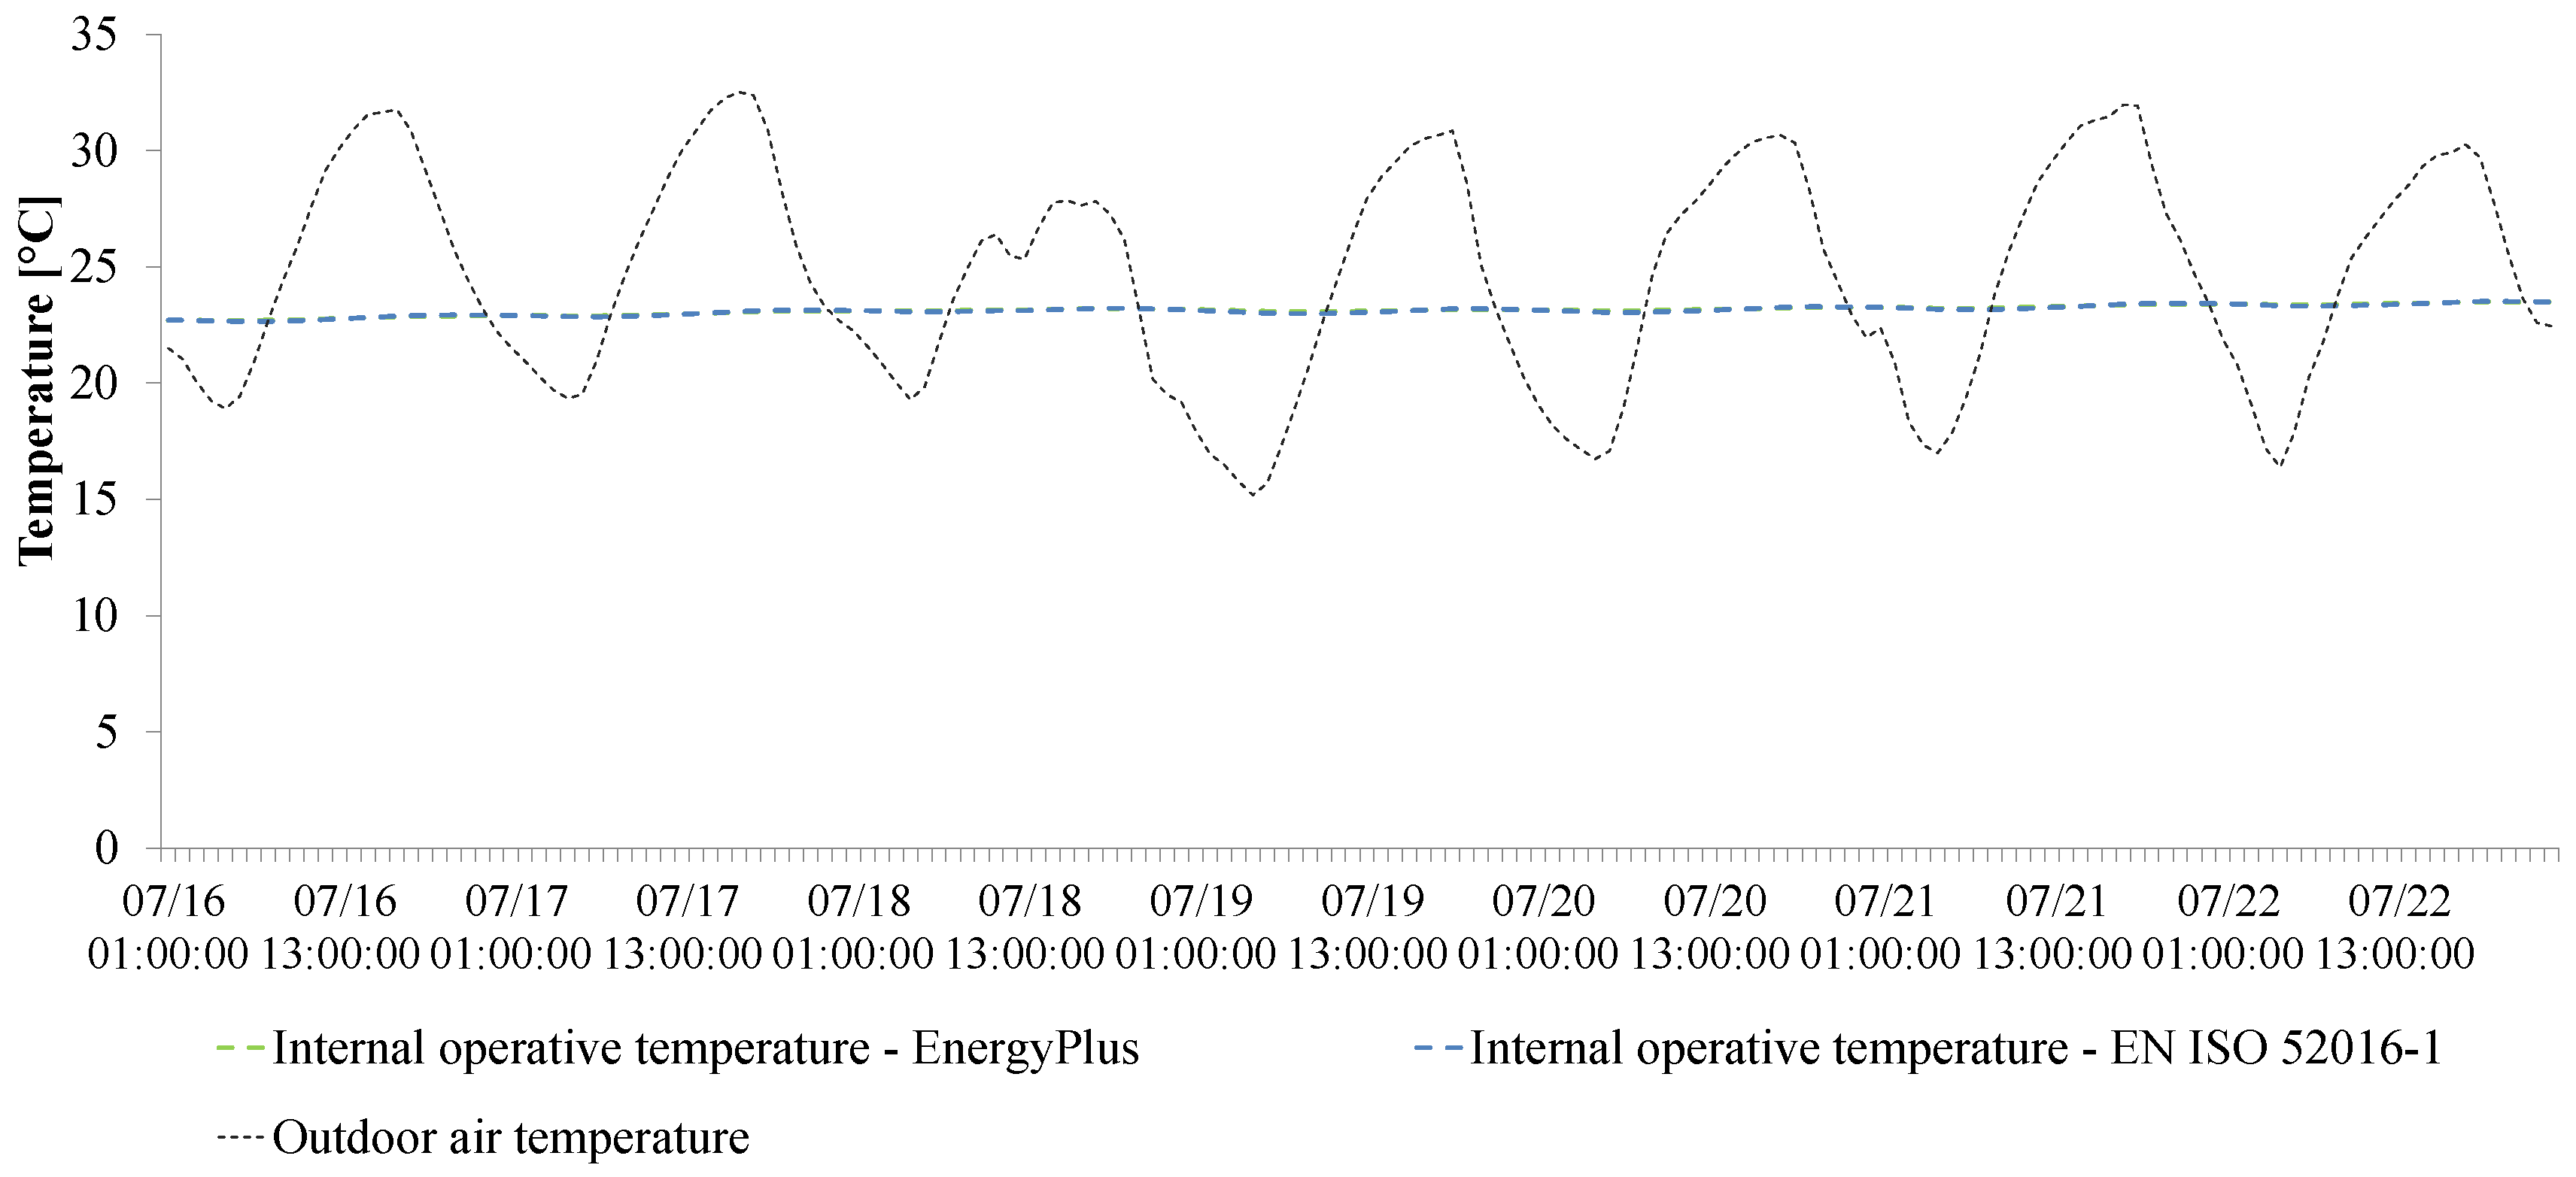
For the week of July, the output is the indoor operative temperature, considering the only effect of the T-tr driving force (Figure 12), and adding in sequence, the consistency option of the convective heat transfer coefficients (Figure 13), and the absence of the heat flow by extra thermal radiation to the sky (Figure 14).
Figure 12 shows a significant offset between the trends of indoor operative temperatures estimated by the two models. In particular, the EN ISO 52016-1 model overestimates the indoor operative temperatures during the analyzed period compared to EnergyPlus (RMSD = 2 °C).
The adoption of consistent convective heat transfer coefficients determines a reduction of the indoor operative temperature offset (Figure 13, RMSD = 0.4 °C). In addition, the exclusion of the extra thermal radiation to the sky from the simulations positively affects the estimation of the indoor operative temperature during the warm season (Figure 14), in such a way as to eliminate any difference between the simple hourly model and the detailed dynamic one.
In Table 7, the root mean square deviations (RMSD) of the indoor operative temperature between the calculation models are summarized for each consistency option applied, for the analyzed summer week.
The performed analysis is useful to identify the presence of compensations in the deviations between the calculation methods. In fact, the small difference (1%) that has been identified in Figure 8, related to the ambient temperature effect in the two simulation models, is not really due to a similarity between the models in simulating the thermal transmission in January. It is instead attributable to the compensation between the effect of the convective heat transfer coefficients and the effect of the extra thermal radiation to the sky. During winter, the overestimation of the convective heat transfer coefficients counterbalances the underestimation of the extra thermal radiation to the sky in the simple hourly model. In the warm season, since the convective heat transfer coefficients do not affect the heat balance as much as in winter, due to a reduced indoor–outdoor temperature difference, the influence of the extra thermal radiation to the sky increases and major deviations occur (28% and 23% in July and August, respectively, as shown in Figure 8).
Figure 15 provides updated results of the analysis of the AHB contributions by driving force, obtained by annulling the above-mentioned compensation effects. These modifications entail considerably differences if compared to Figure 8.
Figure 15 shows that the options applied to give consistency to modeling parameters and phenomena lead to a reduction of the deviations between the simulation methods as concerns the ambient temperature driving force. The deviations are almost nulled in winter, while some differences still occur in the warm season. Further analyses, mainly focused on the effect of the heat conduction models and the building heat capacity, are needed.
As far as the solar radiation is concerned, the underestimation of its effect by the EN ISO 52016-1 model highlighted in Figure 8 (−17% in January and −21% in July) is denied in Figure 15, even showing an overestimation, above all in summer. The previous underestimation is due to the effect of the convective heat transfer coefficients, whose overestimation by the simple hourly model in winter produces a reduction of the effect of the solar radiation absorbed by the external envelope surface. Future works will focus on the analysis of the deviations related to the effect of the solar heat source, that are evident in summer (about 7%), but less noticeable in winter due to the limited amount of the incident solar radiation.

5. Conclusions

The present work is aimed at investigating the main causes of deviation between the new simple hourly model of the building energy performance assessment, introduced by the EN ISO 52016-1 standard, and a detailed dynamic model (EnergyPlus).
To this purpose, a new validation methodology based on the split of different AHB contributions and on the adoption of consistency options of input data and modeling parameters was developed and applied to a case study. This analysis makes it possible to understand to what extent each specific driving force and each modeling simplification relates to the differences that stand out between the compared models.
The main goal of the present research is to provide a new effective approach to validation rather than deliver general figures on numerical deviations. The specific results here presented are closely related to the selected case study and to the considered climate location, but the provided approach could be used in other research works with similar purposes.
The adoption of modeling parameters consistency options performed in this work does not mean that there is the need to assure total congruency of the simulation models. However, the results of this work point out that attention should be paid in the construction of the models and in the input data, being aware that different modeling options may lead to not negligible deviations. To reduce the deviations, further work should be done to increase the accuracy of simple models.
In the next future, further models of physical phenomena will be analyzed, as for instance the modeling of the building heat capacity and the effect of solar radiation on the AHB contributions.

Author Contributions

Conceptualization, V.C., E.F., I.B. and A.C.; methodology, V.C. and I.B.; formal analysis, I.B. and E.F.; investigation, I.B. and A.C.; writing—original draft preparation, I.B. and A.C.; writing—review and editing, E.F. and V.C.; visualization, I.B.; supervision, V.C. All authors have read and agreed to the published version of the manuscript.

Funding

This research received no external funding.

Conflicts of Interest

The authors declare no conflict of interest.

References

  1. Barone, G.; Buonomano, A.; Forzano, C.; Palombo, A. Building Energy Performance Analysis: An Experimental Validation of an In-House Dynamic Simulation Tool through a Real Test Room. Energies 2019, 12, 4107. [Google Scholar] [CrossRef] [Green Version]
  2. Seyedzadeh, S.; Pour Rahimian, F.; Oliver, S.; Rodriguez, S.; Glesk, I. Machine learning modelling for predicting non-domestic buildings energy performance: A model to support deep energy retrofit decision-making. Appl. Energy 2020, 279, 115908. [Google Scholar] [CrossRef]
  3. Yassaghi, H.; Hoque, S. An Overview of Climate Change and Building Energy: Performance, Responses and Uncertainties. Buildings 2019, 9, 166. [Google Scholar] [CrossRef] [Green Version]
  4. European Committee for Standardization (CEN). EN ISO 52016-1, Energy Performance of Buildings—Energy Needs for Heating and Cooling, Internal Temperatures and Sensible and Latent Heat Loads—Part 1: Calculation Procedures; CEN: Brussels, Belgium, 2017. [Google Scholar]
  5. European Commission. M/480 EN, Mandate to CEN, CENELEC and ETSI for the Elaboration and Adoption of Standards for a Methodology Calculating the Integrated Energy Performance of Buildings and Promoting the Energy Efficiency of Buildings, in Accordance with the Terms Set in the Recast of the Directive on the Energy Performance of Buildings (2010/31/EU); European Union: Luxembourg, 2010. [Google Scholar]
  6. European Parliament. Directive 2010/31/EU of the European Parliament and of the Council of 19 May 2010 on the Energy Performance of Buildings (Recast); European Union: Luxembourg, 2010. [Google Scholar]
  7. Corrado, V.; Fabrizio, E. Steady-state and dynamic codes, critical review, advantages and disadvantages, accuracy, and reliability. In Handbook of Energy Efficiency in Buildings: A Life Cycle Approach; Asbrubali, F., Desideri, U., Eds.; Elsevier: Amsterdam, The Netherlands, 2018; pp. 263–294. [Google Scholar]
  8. Corrado, V.; Mechri, H.E.; Fabrizio, E. Building energy performance assessment through simplified models: Application of the ISO 13790 quasi-steady state method. In Proceedings of the Building Simulation 2007, Beijing, China, 3–6 September 2007; pp. 79–86. [Google Scholar]
  9. Millet, J.R. The simple hourly method of prEN 13790: A dynamic method for the future. In Proceedings of the Clima 2007 WellBeing Indoors, Helsinki, Finland, 10–14 June 2007. [Google Scholar]
  10. European Committee for Standardisation (CEN). EN ISO 13790, Energy Performance of Buildings—Calculation of Energy Use for Space Heating and Cooling; CEN: Brussels, Belgium, 2008. [Google Scholar]
  11. Marchio, D.; Millet, J.R.; Morisot, O. Simple modelling for energy consumption estimation in air conditionned buildings. In Proceedings of the Clima 2000, Brussel, Belgium, 30 August–2 September 1997; pp. 1–21. [Google Scholar]
  12. Roujol, S.; Fleury, E.; Marchio, D.; Millet, J.R.; Stabat, P. Testing the energy simulation building model of ConsoClim using BESTEST method and experimental data. In Proceedings of the Building Simulation 2003, Eindhoven, The Netherlands, 11–14 August 2003; pp. 1131–1138. [Google Scholar]
  13. Costantino, A.; Ballarini, I.; Fabrizio, E. Comparison between simplified and detailed methods for the calculation of heating and cooling energy needs of livestock housing: A case study. In Proceedings of the 3rd IBPSA Conference Italy, Bozen-Bolzano, Italy, 8–10 February 2017; pp. 193–200. [Google Scholar]
  14. Costantino, A.; Fabrizio, E.; Ghiggini, A.; Bariani, M. Climate control in broiler houses: A thermal model for the calculation of the energy use and indoor environmental conditions. Energy Build. 2018, 169, 110–126. [Google Scholar] [CrossRef]
  15. Kokogiannakis, G.; Strachan, P.; Clarke, J. Comparison of the simplified methods of the ISO 13790 standard and detailed modelling programs in a regulatory context. J. Build. Perform. Simul. 2008, 1, 209–219. [Google Scholar] [CrossRef] [Green Version]
  16. Atmaca, M.; Kalaycioglu, E.; Yilmaz, Z. Evaluation of the Heating & Cooling Energy Demand of a Case Residential Building by Comparing the National Calculation Methodology of Turkey and EnergyPlus through Thermal Capacity Calculations; Technical Report; Energy Systems Laboratory, Texas A&M University: College Station, TX, USA, 2011. [Google Scholar]
  17. Michalak, P. The simple hourly method of EN ISO 13790 standard in Matlab/Simulink: A comparative study for the climatic conditions of Poland. Energy 2014, 75, 568–578. [Google Scholar] [CrossRef]
  18. Van Dijk, D.; Spiekman, M.; Hoes-van Oeffelen, L. EPB standard EN ISO 52016: Calculation of the building’s energy needs for heating and cooling, internal temperatures and heating and cooling load. REHVA J. 2016, 53, 18–22. [Google Scholar]
  19. Zakula, T.; Bagaric, M.; Ferdelji, N.; Milovanovic, B.; Mudrinic, S.; Ritosa, K. Comparison of dynamic simulations and the ISO 52016 standard for the assessment of building energy performance. Appl. Energy 2019, 254, 113553. [Google Scholar] [CrossRef]
  20. Campana, J.P.; Morini, G.L. BESTEST and EN ISO 52016 Benchmarking of ALMABuild, a New Open-Source Simulink Tool for Dynamic Energy Modelling of Buildings. Energies 2019, 12, 2938. [Google Scholar] [CrossRef] [Green Version]
  21. Mazzarella, L.; Scoccia, R.; Colombo, P.; Motta, M. Improvement to EN ISO 52016-1:2017 hourly heat transfer through a wall assessment: The Italian National Annex. Energy Build. 2020, 210, 109758. [Google Scholar] [CrossRef]
  22. Bruno, R.; Bevilacqua, P.; Arcuri, N. Assessing cooling energy demands with the EN ISO 52016-1 quasi-steady approach in the Mediterranean area. J. Build. Eng. 2019, 24, 100740. [Google Scholar] [CrossRef]
  23. Ballarini, I.; Costantino, A.; Fabrizio, E.; Corrado, V. The Dynamic Model of EN ISO 52016-1 for the Energy Assessment of Buildings Compared to Simplified and Detailed Simulation Methods. In Proceedings of the Building Simulation 2019, Rome, Italy, 2–4 September 2019; pp. 3847–3854. [Google Scholar]
  24. EnergyPlus. Available online: https://energyplus.net/ (accessed on 30 October 2020).
  25. Karlsson, J.; Roos, A. Modelling the angular behaviour of the total solar energy transmittance of windows. Solar Energy 2000, 69, 321–329. [Google Scholar] [CrossRef]
  26. European Committee for Standardisation (CEN). EN ISO 13789, Thermal Performance of Buildings—Transmission and Ventilation Heat Transfer Coefficients—Calculation Method; CEN: Brussels, Belgium, 2017. [Google Scholar]
  27. European Committee for Standardisation (CEN). EN ISO 6946, Building Components and Building Elements—Thermal Resistance and Thermal Transmittance—Calculation Methods; CEN: Brussels, Belgium, 2017. [Google Scholar]
  28. Ballarini, I.; Corrado, V. Analysis of the building energy balance to investigate the effect of thermal insulation in summer conditions. Energy Build. 2012, 52, 168–180. [Google Scholar] [CrossRef]
  29. Loga, T.; Diefenbach, N.; Stein, B. Typology Approach for Building Stock Energy Assessment. Main Results of the TABULA Project; Institut Wohnen und Umwelt GmbH: Darmstadt, Germany, 2012. [Google Scholar]
  30. European Committee for Standardisation (CEN). EN ISO 13786, Thermal Performance of Building Components—Dynamic Thermal Characteristics—Calculation Methods; CEN: Brussels, Belgium, 2017. [Google Scholar]
  31. Italian Thermotechnical Committee. Test Reference Years for Thermotechnical Applications. Available online: http://try.cti2000.it/ (accessed on 30 October 2020).
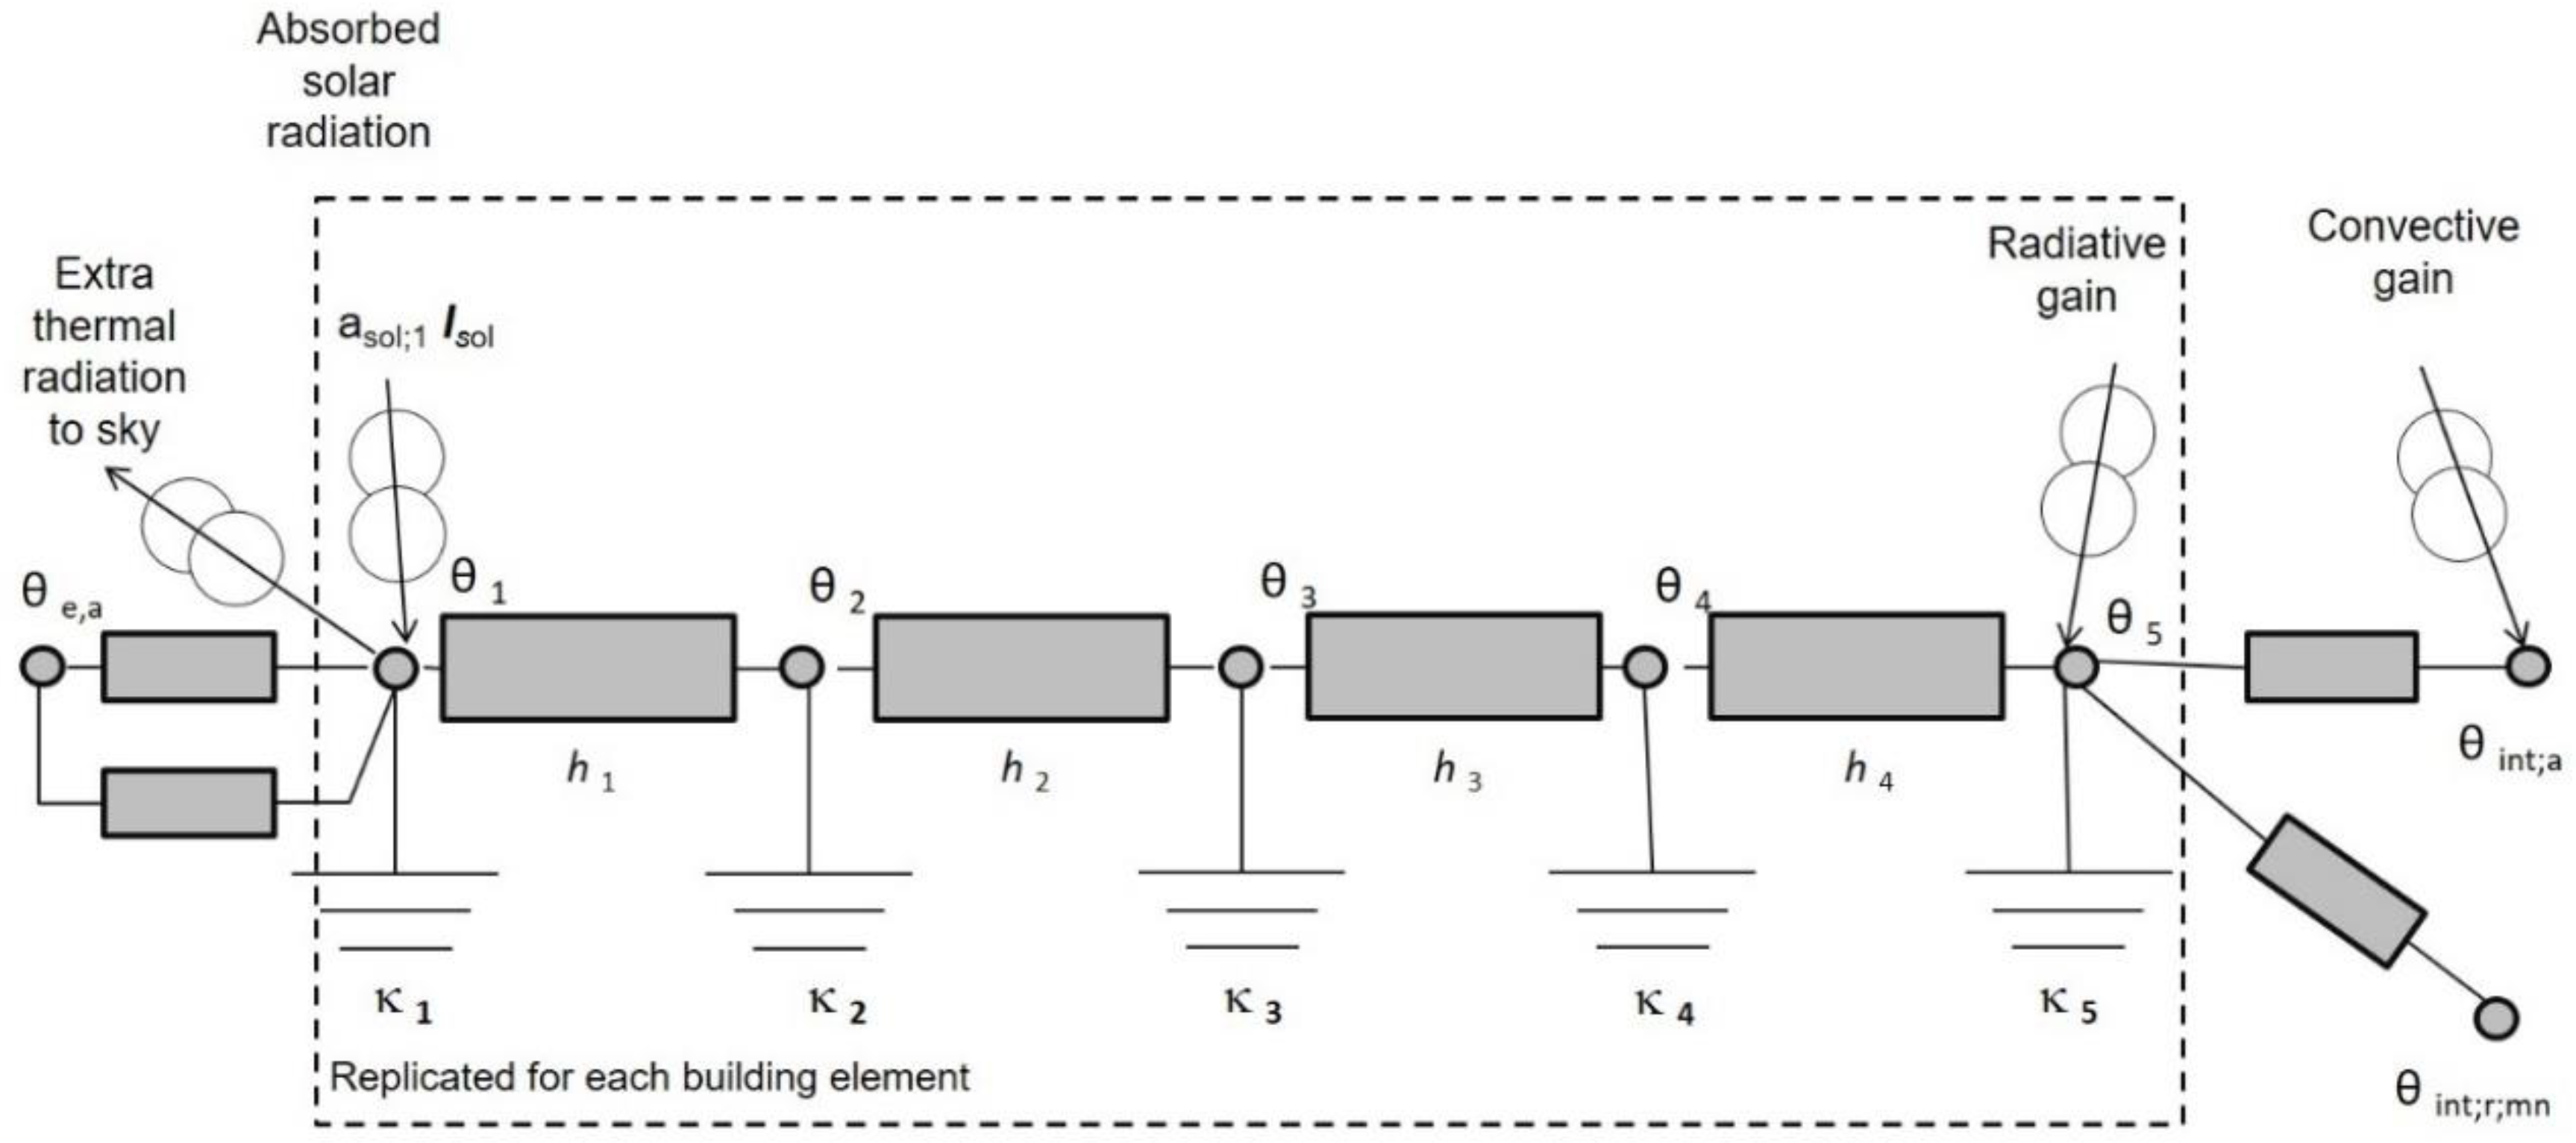
Figure 1. The equivalent Resistance-Capacitance (RC) model of an opaque element behind the EN ISO 52016-1 hourly method [7].
Energies 13 06217 g001
Figure 2. Workflow to identify the causes of deviation between calculation methods.
Energies 13 06217 g002
Figure 3. Description of the different steps of the workflow.
Energies 13 06217 g003
Figure 4. View of the case study model.
Energies 13 06217 g004
Figure 5. Monthly energy needs for heating and cooling.
Energies 13 06217 g005
Figure 6. Heating loads for a week of January.
Energies 13 06217 g006
Figure 7. Cooling loads for a week of July.
Energies 13 06217 g007
Figure 8. AHB contributions by driving force: comparison between the EnergyPlus (E+) and the EN ISO 52016-1 (52016) models.
Energies 13 06217 g008
Figure 9. Heating loads during a winter week, considering ambient temperature as the only driving force.
Energies 13 06217 g009
Figure 10. Heating loads during a winter week, considering ambient temperature as the only driving force, and adopting consistent convective heat transfer coefficients.
Energies 13 06217 g010
Figure 11. Heating loads during a winter week, considering ambient temperature as the only driving force, adopting consistent convective heat transfer coefficients, and removing the extra thermal radiation to the sky.
Energies 13 06217 g011
Figure 12. Indoor operative temperature during a summer week, considering ambient temperature as the only driving force.
Energies 13 06217 g012
Figure 13. Indoor operative temperature during a summer week, considering ambient temperature as the only driving force, and adopting consistent convective heat transfer coefficients.
Energies 13 06217 g013
Figure 14. Indoor operative temperature during a summer week, considering ambient temperature as the only driving force, adopting consistent convective heat transfer coefficients, and removing the extra thermal radiation to the sky.
Energies 13 06217 g014
Figure 15. AHB contributions by driving force: comparison between the EnergyPlus (E+) and the EN ISO 52016-1 (52016) models, with the application of modeling consistency (consistent convective heat transfer coefficients and absence of extra thermal radiation to the sky).
Energies 13 06217 g015
Table 1. Geometric data of the case study.
QuantityValueUnit
Conditioned gross volume, Vg362m3
Conditioned net volume, Vn269m3
Conditioned net floor area, Af,n99.5m2
Compactness ratio, Aenvelope/Vg0.69m−1
Windows area, Awin12.4m2
Window-to-wall ratio, WWR0.09-
Table 2. Thermal transmittance (U), periodic thermal transmittance (|Yie|), and time shift (Δt) of the building envelope components.
Building ComponentU [W·m−2K−1]|Yie| [W·m−2K−1]Δt [h]
External wall0.3650.0918.3
Upper floor (roof)0.3050.0499.8
Window1.62--
Table 3. Thermo-physical parameters of the materials constituting the envelope components.
Building ComponentMaterial
(from the Internal Side
to the External Side)
Thermo-Physical Parameters 1
s
[m]
ρ
[kg·m−3]
λ
[W·m−1K−1]
R
[m2·K·W−1]
c
[J·kg−1K−1]
External wallGypsum and mortar plaster0.01514000.700.021840
Brick masonry0.161600-0.271840
Expanded polystyrene0.10200.0442.2731250
Concrete and mortar plaster0.02518000.900.028840
Upper floor (roof)Concrete and mortar plaster0.0118000.900.011840
Reinforced brick-concrete slab0.181800-0.30840
Concrete0.0220001.160.0171250
Polyurethane and waterproof finishing0.09400.0322.8131250
1s is thickness, ρ is density, λ is thermal conductivity, R is thermal resistance, c is mass specific heat capacity.
Table 4. Areal heat capacity (C) and effective areal heat capacity (κ) of the building components.
Building ComponentC [kJ·m−2K−1]κinternal [kJ·m−2K−1]κexternal [kJ·m−2K−1]
External wall27360.439.2
Internal wall (partition)65.552.352.3
Upper floor (roof)34269.05.80
Intermediate floor20471.462.3
Table 5. Difference between the key input data and parameters of the two models (some examples).
ParameterEN ISO 52016-1EnergyPlus
Wind speednot usedrequired input
Air densityfixed valuevariable value
Total solar energy transmittance of glazingrequired inputnot required
Detailed solar properties of glazingnot requiredrequired input
Table 6. Results of the modeling consistency for a winter week: deviations of the heating load normalized on the floor area between the simple hourly model and the detailed dynamic model.
Modeling OptionsRMSD [W·m−2]
Ambient temperature as the only driving force1.23
-plus consistent values of convective heat transfer coefficients0.58
-plus removal of extra thermal radiation to the sky0.31
Table 7. Results of the modeling consistency for a summer week: deviation of the indoor operative temperature between the simple hourly model and the detailed dynamic model.
Modeling OptionsRMSD [°C]
Ambient temperature as the only driving force1.98
-plus consistent values of convective heat transfer coefficients0.41
-plus removal of extra thermal radiation to the sky0.04
Publisher’s Note: MDPI stays neutral with regard to jurisdictional claims in published maps and institutional affiliations.