Abstract
The present study addresses the coupling of hydrothermal carbonization (HTC) with anaerobic digestion (AD) in wastewater treatment plants. The improvement in biomethane production due to the recycling back to the anaerobic digester of HTC liquor and hydrochar generated from digested sludge is investigated and proved. Mixtures of different compositions of HTC liquor and hydrochar, as well as individual substrates, were tested. The biomethane yield reached 102 ± 3 mL CH4 g−1 COD when the HTC liquor was cycled back to the AD and treated together with primary and secondary sludge. Thus, the biomethane production was almost doubled compared to that of the AD of primary and secondary sludge (55 ± 20 mL CH4 g−1 COD). The benefit is even more significant when both the HTC liquor and the hydrochar were fed to the AD of primary and secondary sludge. The biomethane yield increased up to 187 ± 18 mL CH4 g−1 COD when 45% of hydrochar, with respect to the total feedstock, was added. These results highlight the improvement that the HTC process can bring to AD, enhancing biomethane production and promoting a sustainable solution for the treatment of the HTC liquor and possibly the hydrochar itself.
1. Introduction
Anaerobic digestion (AD) is a widely used process, successfully applied for stabilizing the sewage sludge produced from municipal wastewater treatment plants (WWTPs) [1]. The AD process is one of the most cost-effective and environmentally beneficial options, allowing simultaneous waste treatment, renewable energy production and resources recycling [2,3]. The main strengths of AD are represented by a reduction by 30–50% of the volume of the sludge to be disposed of and the production of renewable energy from methane, which helps reducing the net energy consumption of the WWTP.
In the last years a lot of progress has been made in the development and implementation of pre-treatment processes capable of increasing the anaerobic biodegradability of sewage sludge. The traditional use of sewage sludge digestate as soil amendment and organic fertilizer is becoming more and more restricted due to environmental and economic reasons [4,5]. As an alternative digestate could be used as an interesting feedstock for thermochemical conversion [6,7]: indeed, the digested sludge resulting from the AD process contains a large amount of non-biodegradable organic matter usable for additional energy production [8,9].
Thermal treatment processes are effective to promote the solubilization of particulate organic fractions and speed up the biological decomposition of organic polymers to monomers, thus enhancing the hydrolysis stage of the AD, which is often the rate-limiting step of the overall AD process [10].
Among all the thermal treatments, hydrothermal carbonization (HTC) has recently received attention as a way to improve the bio-energy production efficiency [11,12,13,14]. The feasibility of the hydrothermal conversion of digestate into hydrochar was fully demonstrated [15,16,17,18].
HTC is operated at temperatures in the range 180–280 °C for a duration from a few minutes up to several hours in a not-oxidising atmosphere [19,20]. Wet biomass is processed with hot compressed water under autogenous pressures. The HTC treatment results in a solid carbonaceous fraction called hydrochar, a liquid fraction called HTC liquor and a minor gas fraction.
The hydrochar, which contains a high amount of carbon, together with the fatty acids, the soluble proteins, the ammonia nitrogen and the phosphorous present in the HTC liquor can be used as feedstock to AD to improve biogas production. A possible scenario of the integration of the HTC process in a WWTP is reported in Figure 1. HTC liquor and hydrochar could be possibly accumulated in a storage tank (not shown in Figure 1) before being fed to the anaerobic digester in order to both spread the HTC slurry over time and continuously feed the anaerobic digester.
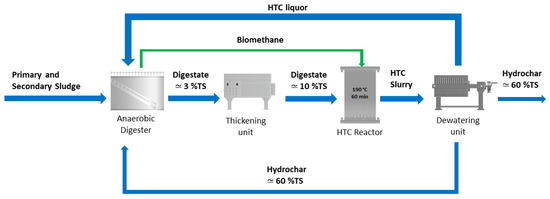
Figure 1.
Scheme of the integration of the AD with the HTC process: AD–HTC scenario. The green biomethane stream represents a heat input to HTC. Indicative total solid (TS) content is also reported.
This configuration offers several advantages [21]. The use of HTC as post-treatment of the AD: (1) it promotes energy savings, because the thermal energy required by HTC can be applied to a stream more concentrated in solids obtained after thickening; (2) it reduces the digestate volume, in the form of digestate hydrochar, thus contributing to the reduction of the costs for sludge management and disposal; (3) it improves the biogas production, where the recycling of the HTC liquor (and possibly the hydrochar) back to the anaerobic digester is applied. A deep investigation on this last technological possibility, i.e., the recycling of the HTC liquor (possibly with added hydrochar) back to the anaerobic digester represents the focus of this study. This aspect is actually not analysed enough into the scientific literature and the aim of this paper is to fill this research and technology knowledge gap. Considering that the integration of AD and HTC is nowadays considered a very interesting opportunity in the waste management sector [22,23,24,25,26,27,28], and in particular in the WWTP sector [29,30,31], trying to optimize such a process integration, or process symbiosis, becomes today mandatory, extremely important and challenging.
Nine sludge samples, which differed for their sewage sludge composition (primary and secondary sludge), HTC liquor, and digestate hydrochar, were subjected to biochemical methane potential (BMP) tests. Sewage sludge samples were added first only with HTC liquor and then with both HTC liquor and hydrochar, present in five different percentages. Thus, in the framework of a WWTP, the specific aim of this study is to evaluate the percentage of HTC liquor and hydrochar which should be added to sewage sludge in order to assure the highest biomethane production during AD: this in order to develop a process scheme that could be applied to full scale WWTPs, in particular to the sewage sludge treatment line, in order to optimize it.
2. Materials and Methods
2.1. Sludge Samples
Four samples were collected from the municipal WWTP of Trento, Italy, which uses a conventional activated sludge (CAS) and a membrane biological reactor (MBR) treatment in the water line. Figure 2 depicts the scheme of Trento WWTP.
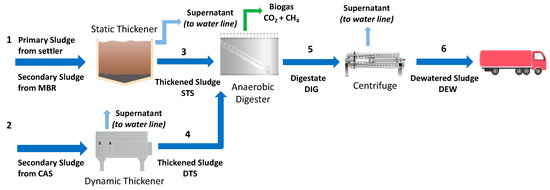
Figure 2.
Scheme of Trento municipal WWTP, Italy, identifying four sludge samples (STS–Pipe 3; DTS–Pipe 4; DIG–Pipe 5; DEW–Pipe 6). Figure modified from Merzari et al. [18].
The primary sludge, extracted from the primary settler, is mixed with the secondary sludge coming from the MBR system, and then sent to a static thickener (Pipe 1). The thickened sludge (Pipe 3) was the first sludge sample used in the experimental activity of the present work and was named STS. The secondary sludge, coming from the CAS treatment, is sent to a dynamic thickener (Pipe 2). The dynamic thickened sludge (Pipe 4) was the second sample taken for the present work and was named DTS. After that, both STS and DTS streams are sent to the AD process, which lasts 21 days at 33 °C. The digested sludge (Pipe 5), named DIG, was the third sample collected for the experimental activity. Polyelectrolyte is added to the digested sludge from Pipe 5; this stream is sent to a centrifuge where it reaches a total solids (TS) mass percentage of about 25% to facilitate solid handling. The dewatered sludge (DEW) after the centrifuge (Pipe 6) was the fourth sample used in the present study. Each sample was characterized and kept at 4 °C until use.
2.2. Input Data of the AD-HTC Scenario
The AD plant of Trento WWTP was chosen as case study to simulate the application of the HTC process and the recirculation of the HTC liquor, and possibly the hydrochar, to the existing anaerobic digester.
The point was thus to evaluate the amount of the HTC liquor that could be recycled back to the anaerobic digester, considering that such liquor would be generated by the HTC of the digestate deriving from the same anaerobic digester, after its thickening. The indicative scheme is reported in Figure 1, where after thickening the digestate stream reaches a TS mass percentage equal to 10%, so as to be quite rich in dry matter but still easily pumpable [32].
The following calculations allowed to determine the solid load, with a TS content equal to 10% at the input of the HTC treatment, which corresponds to the real solid load value of the anaerobic digester. This step is necessary to integrate the HTC treatment in Trento WWTP following the scheme reported in the AD-HTC scenario (Figure 1) and to simulate it by means of biochemical methane potential (BMP) tests. The average actual treatment capacity of the anaerobic digester of Trento municipal WWTP is 4850 m3 month−1 of sludge, consisting of three quarters of STS at 2–4.5% TS and a quarter of DTS at 4–4.5% TS.
The amount of sludge at 10% TS was calculated following Equations (1) and (2) [33]:
where γHTC is the density of the digestate sent to the HTC treatment (equal to 1026 kg m−3, Equation (1)), TS is the total solid mass percentage of digestate equal to 10%, TSS is the total suspended solid concentration of digestate (kg m−3), VSS is the volatile suspended solid concentration of digestate (kg m−3), VSS/TSS ratio was measured equal to 0.62, γw is the density of water equal to 1000 kg m−3, γorg is the density of the organic matter assumed equal to 1050 kg m−3, γash is the density of the inorganic content assumed equal to 2500 kg m−3, M is the moisture of digestate equal to 90%, x is the solid load of digestate (kg month−1) and Q is the sludge (STS+DTS) mass flow (m3 month−1).
γHTC = 1/[(((100 − TS)/100)/γW) + (((TS/100) × (VSS/TSS))/γorg) + ((TS/100) × (1 − VSS/TSS))/γash]
Q = x/[γHTC × (100 − M)/100]
The solid load x is equal to 97000 kg month−1 and was calculated considering that the average concentration of DIG sludge is about 20 kg m−3 and assuming a constant value for Q in the anaerobic digester. In order to obtain data for sample at 10% TS, γ and Q were computed, respectively, by means of Equations (1) and (2), corresponding to 967 ton month−1 of sludge at 10% TS.
Considering that the HTC process generated a solid yield of 70%, a liquid yield of 28%, and a gas yield of 2% as described in Section 3.1, and that the hydrochar in the proposed scheme is dewatered up to 60% of solid content (Figure 1), 113 ton month−1 of hydrochar at 60% of solid content and 852 m3 month−1 of HTC process water would be obtained. Thus, given the data and hypotheses above, the ratio between the amount of HTC liquor and the amount of sludge treated in the anaerobic digester would result equal to 0.17.
2.3. HTC Experimental Procedure
The sludge used for the HTC tests was obtained mixing the diluted sludge exiting the anaerobic digester (digestate sludge, DIG) and the same digestate downstream of the addition of polyelectrolyte and its centrifugation (dewatered sludge, DEW). The mixture so prepared allowed to feed the HTC reactor with a biomass sufficiently rich in dry matter content and fully submerged into a liquid phase and easily pumpable [32].
HTC of sewage sludge was conducted in a high-pressure reactor equipped with four thermocouples located at different heights within it, a pressure transmitter and two pressure gauges. The HTC reactor was described in more detail in Merzari et al. [34]. About 1.5 kg of mixture (940.0 ± 0.1 g of DIG and 600.0 ± 0.1 g of DEW) with a TS mass percentage of about 10% was introduced into the reactor. The HTC tests were performed in duplicate at a temperature of 190 °C with 1 and 3 h of reaction time. The HTC treated sludge was divided into two equal parts. One part, referred to as 1-HC and 3-HC respectively for 1 and 3 h of reaction time, was collected by filtration (filtration by gravity in a funnel using qualitative paper filter) and used as hydrochar for the biochemical methane potential tests. The other part was collected by filtration, then dried at 105 °C for 24 h to remove residual moisture and used to evaluate the hydrochar yield and the hydrocar moisture content after filtration (which resulted equal to 87.4%). The HTC liquor was collected by filtration and then characterized.
The yield of hydrochar was calculated using the following equation:
where W0 is the dry weight of the sewage sludge before HTC treatment, and W1 is the dry weight of the derived hydrochar. Gas yield was computed through the ideal gas law, assuming only CO2 as the gaseous product [34], using a water displacement cylinder as previously reported [34], and using the following equation:
where WCO2 is the weight of CO2. The liquid yield was calculated as the complement to 100% of the solid and gas yields.
Yieldhydrochar = W1/W0 × 100%
Yieldgas = WCO2/W0 ×100%
2.4. Biochemical Methane Potential Test
Biochemical methane potential (BMP) assays were performed in order to analyse the anaerobic biodegradability and determine the specific methane yields. The BMP assays were performed over 37 days using sealed 135 mL serum bottles at 35.0 ± 0.1 °C [35]. All the tests were carried out in triplicate. The method used is similar to that by Owen et al. [36], except that the anaerobically digested sludge from Trento WWTP, Italy, was used as inoculum, allowing very similar conditions between the actual Trento WWTP digester and the BMP tests. Nine samples were subjected to BMP assays, which differed from each other for their composition.
Blank and reference samples. The feedstock used in test #1 was the inoculum (100 g), referred to as blank sample, consisting of digestate pre-incubated for 28 days at mesophilic temperature in order to degrade its residual biodegradable organic matter content. The feedstock fed to test #2 was composed by inoculum (67 g) mixed with a portion of primary and secondary sludge (25 g STS and 8 g DTS) and was referred to as the reference mix. The amount of STS and DTS used were chosen considering the real composition of the sludge fed to the anaerobic digester of Trento WWTP as described in Section 2.2. Table 1 reports the characteristics of each sludge used in the HTC tests and BMP assays.

Table 1.
Characteristics of sludges used in the HTC tests and BMP assays.
HTC Liquor Samples. The sample 1-HC was fed to BMP tests, given its higher organic matter and nitrogen content in comparison to sample 3-HC. The feedstock of test #3 consisted of the HTC liquor (34 g) added to the inoculum (66 g), while the feedstock of test #4 was composed by the reference mix (95 g) and the HTC liquor (5 g), thus respecting the ratio HTC liquor over sewage sludge (STS + DTS) as calculated in Section 2.2.
HTC Liquor and Hydrochar Samples. Hydrochar (wet hydrochar retained by the paper filter, 1, 2, 5, 10 and 15 g) was added to the reference mix and the HTC liquor, respectively, in tests #5, #6, #7, #8 and #9. The amount of HTC liquor and the mass of the reference mix (STS + DTS + inoculum) remained unchanged in every test, while increasing the amount of hydrochar added. Thus, tests were performed with a percentage of hydrochar with respect to the total feedstock used in the BMP tests (excluding the inoculum) ranging from 3% (test #5) to 45% (test #9). Table 2 summarizes the composition of all BMP samples.
Table 2.
BMP sample composition.
Before the beginning of the BMP tests, all the bottles were purged with nitrogen for 5 min. BMP tests were performed with a feed/inoculum ratio (F/I) lower than 1.0 g COD g COD−1, as suggested in VDI 4630 [37], with a serum bottle volume fixed at 100 mL. Biogas and biomethane productions were measured according to the methods reported in Ferrentino et al. [35]. The produced biogas was evaluated measuring the gas pressure in the headspace of each bottle with a manometer. The produced CH4 was evaluated by flowing the gas present in the headspace of the bottle in a plastic graduated cylinder, having the lowest part submerged in a NaOH (2 M) solution, and considering the change in the liquid level inside the cylinder. The measured biogas and CH4 were then referred to standard conditions, using the ideal gas law (p0 = 1.01325 bar and T0 = 273.15 K).
2.5. Analysis
The digestate, the dewatered sludge, the HTC liquor and the inoculum were characterized by chemical analyses. TS, VS, NVS (non-volatile solids), TCOD and sCOD were measured in accordance with Standard Methods [38]. Norg-N, NH4+-N and TP concentrations were calculated according to APAT-CNR-IRSA [39]. The pH was measured using a Profi-Line pH 3310 (WTW, Milan, Italy) portable pH-meter.
The HTC liquor was subjected to measurements of readily biodegradable COD (RBCOD), following the procedure described in Andreottola et al. [40]. All measurements were conducted in triplicate and the average and standard deviation are reported. Data collected during BMP assay allowed the determination of the specific methane production (SMP). Because of the presence of several different substrates, to compare the results of all the samples the SMP was referred to the amount of COD entered the BMP test. Thus, the SMPs, expressed in mL CH4 g−1 COD, were evaluated following Equation (5):
where VCH4 is the cumulated volume of methane produced during 37 days of BMP test and the CODIN is the mass of COD present at the beginning of each BMP test.
SMP = VCH4/CODIN
2.6. Kinetic Analysis
Kinetic studies were conducted on the cumulative methane production data. The modified Gompertz model (Equation (6)) and the Cone model (Equation (7)) were used to fit the experimental data and the key kinetic parameters were obtained [41].
where G is the cumulative methane production (mL CH4 g−1 COD); Gmax is the maximum cumulative biomethane production (mL CH4 g−1 COD); Rmax is the maximum biomethane production rate (mL CH4 g−1 COD d−1); λ is the lag time of the methane production (d); t is the digestion time (d); e is equal to 2.718282; kh is the hydrolysis rate constant (1/d); n is the shape factor. The kinetic parameters Gmax, Rmax, λ and kh were determined using non-linear regression.
G = Gmax × exp {−exp [((Rmax × e)/Gmax) × (λ − t) + 1]}
G = Gmax/[1 + (kh × t)−n]
3. Results and Discussion
3.1. HTC Tests
The HTC tests were characterized by means of solid, liquid and gas yields. Table 3 reports the yield of the hydrochar, the liquor and the gas for the 1-HTC and 3-HTC tests, respectively, performed at 1 h and 3 h of reaction time and both at 190 °C.
Table 3.
Solid, liquid and gas yields after HTC treatment.
The hydrochar yield of the samples 1-HTC and 3-HTC were, respectively, equal to 72.8 ± 1.4% and 68.0 ± 2.0%. Test 1-HTC revealed a higher hydrochar yield than test 3-HTC underlighting that a lower reaction time allows 7% higher hydrochar yield to be obtained. This result is consistent with several literature studies [6,42,43,44,45], where it is reported that a higher reaction time causes a lower hydrochar yield, because of the formation of several hydro-soluble compounds. Correspondingly, the liquor yield was higher in test 3-HTC, 30.3 ± 1.3% than in test 1-HTC, 26.0 ± 1.4%.
Moreover, TS and VS of hydrochar were determined after drying. TS and VS were, respectively, equal to 98.6 ± 2.0% and 58.6 ± 1.3% for 1-HTC sample and 96.6 ± 1.9% and 57.7 ± 3.0% for 3-HTC sample. Samples showed more or less the same percentage of TS and VS revealing, moreover, up to 40% of NVS. Table 4 shows the characterization of the liquor obtained from the HTC tests.
Table 4.
Characteristics of the HTC liquor.
Results of the chemical analyses show that there are some parameters that do not seem affected by the reaction time of the HTC treatment. In particular, there was no differences between 1 h and 3 h of reaction time for the NH4+-N and TCOD concentrations. The NH4+-N concentration was equal to 2.7±0.1 g NH4+-N L−1 and 2.8±0.1 g NH4+-N L−1, respectively, for sample 1-HTC and 3-HTC, while the TCOD concentration was equal to 34 ± 2 g TCOD L−1 and 35 ± 2 g TCOD L−1. On the contrary, the RBCOD concentration was higher in the sample 1-HTC, accounting for 29 ± 2 g RBCOD L−1, compared to a concentration of 23 ± 2 g RBCOD L−1 for the sample 3-HTC. In this case, an increase in the reaction time to 3 h caused a decrease in the RBCOD of the sample; thus, in the liquor there were fewer rapidly biodegradable compounds, which can affect the subsequent treatment of the liquor.
Results evidence that a high reaction time had negative effects on both the hydrochar and liquor derived from the HTC tests, i.e., a lower hydrochar yield and a lower biodegradability of the liquor. These disadvantages add up to a greater energy demand required necessarily by a longer reaction time. Given this, only the hydrochar and the liquor derived from test 1-HTC, which showed the best results, were subjected to the BMP tests.
3.2. BMP Tests
BMP tests were performed in mesophilic conditions for more than 35 days, until biomethane production had almost ceased. The average SMP trends for test#1, #2, #3 and #4, evaluated according to Equation (5), are reported in Figure 3.
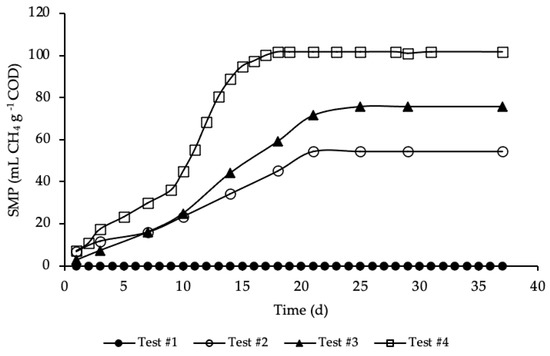
Figure 3.
SMP of tests #1, # 2, #3 and #4.
SMP trends with standard deviation are reported in Figure A1 in Appendix A. The methane production was referred to the grams of COD present in each sample, in order to facilitate test comparison. Thus, the average COD mass inside the bottle of test #2, #3 and #4 was respectively equal to 1.19, 1.15 and 1.18 g COD (details on Table A1 in Appendix A). BMP tests show that the addition of HTC liquor, after 1 h and 190 °C of HTC treatment, increased significantly the anaerobic biodegradability, enhancing the methane production rate. According to Figure 3, test #1 shows a SMP of the inoculum equal to zero, because it was pre-incubated for 28 days in order to minimize its residual biodegradable organic matter content. Test #2 shows the SMP of the reference sample, where a portion of STS and DTS where added to the inoculum. Results show that after 21 days the highest methane production was achieved, accounting for 55 ± 20 mL CH4 g−1 COD, proving the capacity of the STS and DTS sludges to produce methane. This methane production is lower than that reported in Ferrentino et al. [35] where BMP tests were performed after a thermal hydrolysis pre-treatment of sludge at 150 and 170 °C for one-hour, accounting, respectively, for 165 and 141 mL CH4 g−1 COD. However, it must be pointed out that these results refer to BMP tests carried out with a thickened sludge and an inoculum different from those used in the present study: the comparison between the results obtained with the two thermal treatments (thermal hydrolysis and HTC) is therefore only indicative.
The enhancement, due to the addition of the HTC liquor, is proved in test #3 and even more so in test #4. Test #3 shows the increase in methane production due to the addition of only liquor to the inoculum. As reported in Figure 3, the highest methane production was reached after 25 days and accounted for 76 ± 20 mL CH4 g−1 COD, a significant increase compared to test #2: in literature the biomethane yield of HTC liquor from sewage sludge ranges between 3 and 227 mL CH4 g−1 COD, depending on the kind of feedstock, the HTC operative conditions, the AD operative conditions and the efficiency of the solid/liquid separation [29,46,47,48]. Similar data to those here obtained were found by Nyktari et al. [49].
The effect of the addition of HTC liquor to the reference sample is showed in test #4. In this case, the maximum methane production was reached after 18 days of BMP test and accounted for 102 ± 3 mL CH4 g−1 COD, that is almost double compared to the reference mix. This is in contrast with experimental results showed in Villamil et al. [50] where the authors found that mixing HTC liquor with primary sludge reduces the biomethane production, but it is reasonable since the authors treated sewage sludge by means of HTC at 208 °C, increasing notably unbiodegradable compounds. Also, De la Rubia et al. [51] found a decrease in the methane yield at the same HTC conditions (208 °C) mixing HTC liquor of digestate with the organic fraction of municipal solid waste. Conversely, Lucian et al. [23] found a dramatic increase in biogas production hydrothermally carbonizing the organic fraction of municipal solid waste at 180 °C for both HTC liquor and HTC slurry, i.e., the mixture hydrochar-HTC liquor. Finally, Parmar and Ross [27] found a methane yield of 182 NmL CH4 g−1 COD when converting through AD the process water of hydrothermally carbonized sewage sludge.
As shown in Figure 3, the highest methane production in test #4 was reached in less time, one week before than in test #3, three day before compared to test #2, and the trend of the production was different from the other tests. In particular, the trend of SMP of test #4 was almost equal to tests #2 and #3 from day 1 to 9; after that, there was a rapid increase in the methane production till day 18, where the maximum production was reached. This trend could be ascribed to the complexity of the organic matter and, moreover, to the acclimation period needed by bacteria to adapt to the new substrate. All the SMP values, ascribed to the addition of HTC liquor, were notably higher than that of both the inoculum and the reference mix. The biomethane production was significantly increased due to the enhancement of the anaerobic biodegradability of the organic matter content present in the HTC liquor. Results of SMP and biogas production allowed an assessment of the percentage of CH4 produced in each BMP test, that was equal to 66% for test #2 and #4 and 67% for test #3. Considering the data reported in Figure 3, test #4 shows the highest increase in SMP, compared with test #2 (only STS and DTS), leading to 86% of CH4 overproduction, while in test #3 the overproduction accounted for 39%.
Figure 4 shows the SMP trends of samples where both the HTC liquor and hydrochar were added to the reference sample.
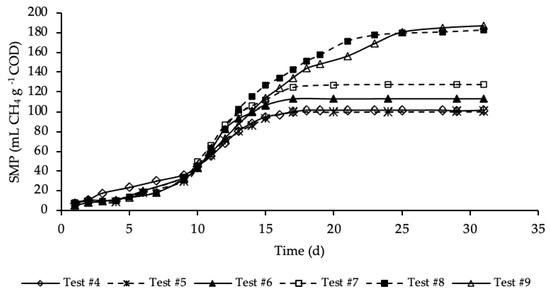
Figure 4.
SMP of tests #4, #5, #6, #7, #8 and #9.
SMP trends with standard deviation are reported in Figure A2 in Appendix A. Exponential increases in methane production were observed after initial periods with relatively reduced production. As for the previous set of tests, the SMP was referred to the mass of COD present into the sample at the beginning of the test, that was equal to 1.19, 1.21, 1.24, 1.32, 1.46 and 1.60 g COD, respectively, for test #4, #5, #6, #7, #8 and #9 (details on Table A1 in Appendix A). These tests were performed varying the mass of hydrochar that ranges from 3% of test #5 to 45% of test #9 of the total feedstock masses (STS + DTS + HTC liquor) used for the tests. Importantly, the COD mass present in the dry hydrochar was not included, because considered non-biodegradable, while its moisture (87.4%) was assumed having the same composition of the HTC liquor. Test #5 represents the sample where the lowest amount of hydrochar was added (3%). According to Figure 4, the SMP of this sample was equal to that of the sample free of hydrochar (test #4), accounting for 100 ± 25 mL CH4 g−1 COD, meaning that the addition of hydrochar in such a low amount did not have a positive effect on the methane production. On the contrary, already from test #6, where the percentage of hydrochar added was equal to 6%, there was a slightly increase of the methane production that, after 17 days of BMP tests, was equal to 113 ± 11 mL CH4 g−1 COD. A further increase of SMP was shown in test #7, where 15% of hydrochar was added. However, the highest methane production was observed, about equally, in test #8 and #9 where the percentage of hydrochar added was equal, respectively, to 30 and 45%. In these samples a significant increase in SMP was observed, accounting for 183 ± 4 and 187 ± 18 mL CH4 g−1 COD, respectively in test #8 and #9, about 80 mL CH4 g−1 COD higher than that of the sample without hydrochar added (test #4). This may be explained by the presence of degradable molecular organic compounds in the hydrochars. For each test, the methane production was slow from day 1 to day 10, and then increased suddenly until the maximum production was reached. Moreover, each sample reached its maximum production in a different time from the others. Samples with the hydrochar are characterized by a greater duration of the methane production period, which increased as the quantity of the hydrochar introduced increased. The maximum SMP was reached after 17 days in test #6 and #7, while it increased to 25 days in tests #8 and #9, where the amount of hydrochar added was greater. This variation could be ascribed to the increase of the degradable organic matter load subjected to the BMP test that increased the time required for its degradation. Moreover, more time was probably required also to degrade part of the hydrochar likely consisting also of slowly biodegradable organic compounds. Results reveal that the addition of hydrochar improved the methane production of the sludge subjected to anaerobic digestion. However, results show that increasing from 30 to 45% the percentage of hydrochar added in respect the total feedstock used in the reference mix and HTC liquor did not cause an increase in the methane production.
The percentages of CH4 in the biogas were in the range 67–70%. The highest CH4 percentage (70%) corresponded to test #9, where 45% of hydrochar was added; on the contrary, the lowest value corresponded to test #4 with no addition of hydrochar. Thus, this data reveals that an amount of hydrochar added to the HTC liquor and sludge could have not negligible effects on the methane concentration in the produced biogas.
The daily methane production (DMP) is reported in Figure 5a,b. DMP trends with standard deviation are reported in Figure A3 in Appendix A.
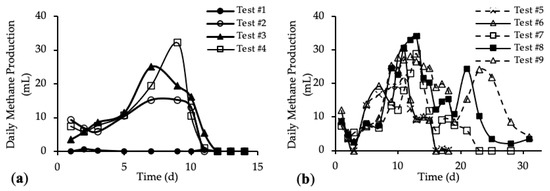
Figure 5.
Daily Methane Production (DMP) of (a) tests #1 to #4 and (b) tests #5 to #9.
The DMP obtained with the addition of the HTC liquor (tests #3 and #4) are reported in Figure 5a and compared with the blank (test #1) and reference sample (test #2). Figure 5b shows the DMP derived from the addition of both HTC liquor and hydrochar (from tests #5 to #9).
Figure 5a shows DMP trends closer to the classic biogas production trends. In the first 10 days, the methane production increased, reaching the maximum DMP between day 7 and day 11; after that, the methane production decreased quickly to zero. The curve trends show that the amount of organic substrate that can be easily anaerobically digested increased after the addition of the HTC liquor. In Figure 5b, tests #5, #6 and #7 show a peak methane production after 11 days; then the production decreased and remained stable for about 3 days, before going to zero completely after 23 days. On the contrary, tests #8 and #9 show a trend different from the previous ones. In both tests, the DMP curve shows a first peak of methane production after 11 days; from day 12 to day 19 a decrease in the methane production occurred, followed by a subsequent increase corresponding to a second peak of methane production between day 21 and 23. After that, the DMP decreased to zero. This trend could be linked to the different percentage of hydrochar added to the samples [52]. The presence of the second peak in the DMP trend is observed only for samples where the mass of hydrochar added was higher than 30% of the total feedstock, meaning that higher concentrations of organic substances were present, which could be also not readily biodegradable. Thus, the time required for their anaerobic digestion was higher than for the samples with less hydrochar but, however, lower than 30 days. Moreover, this evidence suggests that hydrochar cannot be assumed completely non-biodegradable, as per our working hypothesis above, but it consists also of slowly biodegradable organic compounds.
3.3. Kinetic of Methane Yield
The experimental data of cumulative methane production was fitted using the modified Gompertz and Cone models, according to Equations (6) and (7), and the R2 ranged from 0.983 to 0.998 and 0.981 to 0.999, respectively, indicating a good fitting between experimental data and the modelling results. The key parameters of the two models are reported in Table 5.
Table 5.
Key parameters of Gompertz and Cone Models.
According to the Gompertz model, the lag phase λ increased significantly after the addition of the HTC liquor in test #3 and #4, accounting for 3.7 and 3.5 days, respectively, compared to test #2, where it was extremely low (0.3 d). This may be because the HTC liquor contains organic compounds, which could be slowly biodegradable, and also due to an adaptation time required by methanogens to degrade a new substrate for them, i.e., the HTC liquor. The lag phase for test #5 to #9 ranged between 6.5 and 7.3 days, highlighting a net increase due to the addition of both the HTC liquor and the hydrochar.
Considering the maximum biomethane production rate, data shows that the addition of the HTC liquor enhanced significantly the Rmax values. In test #2 Rmax resulted equal to 2.6 mL CH4 g−1 COD d−1 while in test #3 and #4, where the HTC liquor was present, the Rmax was, respectively, 4.4 mL CH4 g-1 COD d−1 and 8.6 mL CH4 g−1 COD d−1. Thus, the presence of HTC liquor doubles the Rmax value (test #3), which increased even more when primary and secondary sludge were present in the sample (test #4). The addition of both HTC liquor and hydrochar caused a further increase in the Rmax value, ranging between 13.3 and 18.3 for tests #5 to #9. As for the lag phase, a change in the percentage of hydrochar added from 6 to 45% caused a slight variation in the Rmax value. However, the results obtained in the present work exceed the ones reported by Donoso-Bravo et al. [53] for the anaerobic digestion of two-phase olive pomace, for which the Rmax value was 1.6 mL CH4 g−1 VS d−1. On the contrary, the Rmax values of the samples from tests #5 to #8, where both HTC liquor and hydrochar were added, were quite similar to that reported by Abudi et al. [54] in the batch anaerobic digestion of untreated OFMSW (27.7 mL CH4 g−1 VS d−1). According to the Cone model, the parameter kh can be used to characterize the hydrolysis rate of the substrate, the larger the kh value, the higher the degradation rate [41]. The kh value of tests #2 and #3 were very small, respectively, 0.036 and 0.070 d−1. However, the value of kh increased to 0.100 d−1 in test #4, indicating that the hydrolysis rate was accelerated with the promotion of the HTC liquor. Thus, the addition of HTC liquor enhanced the hydrolysis of particulate organics in biomass. The addition of both the HTC liquor and the hydrochar did not cause a further increase in the kh value that in test #5 (0.096 d−1), #6 (0.095 d−1) and #7 (0.093 d−1) was equal to test #4. Furthermore, in tests #8 and #9, where the highest amount of hydrochar was added, a slight decrease in the kh value was observed (kh equal to 0.078 d−1 in both tests). Except for test #1, all the kh values are higher than those reported by Villamil et al. [29] for the anaerobic digestion of the liquid fraction of HTC of sewage sludge (0.031–0.043 d−1), but significantly lower than those reported by De la Rubia et al. [51] for the anaerobic co-digestion of OFMSW with the liquid fraction from HTC of sewage sludge (0.44–0.56 d−1). The results obtained in the present study are similar to those obtained by Villamil et al. [50] for the mesophilic anaerobic co-digestion of the liquid fraction from HTC of dewatered waste activated sludge with primary sewage sludge using flocculent sludge (0.100–0.168 d−1) and granular sludge (0.059–0.068 d−1) as inoculum.
3.4. Combined Effects of HTC and AD on Sludge Characteristics
At the end of the BMP tests, the samples were analyzed to evaluate the variation in COD, Norg-N and NH4+-N. Data before and after the BMP tests are reported in Table 6.
Table 6.
Sludge characteristics before and after the BMP tests.
To evaluate the TCOD removal, the TCOD concentration in STS, DTS, HTC liquor and hydrochar were computed. The contribution in terms of TCOD of the various streams fed to the BMP tests is reported in Table A1 in Appendix A. Results show an appreciable removal in almost every test performed. In particular, data reveals that test #4 had a TCOD removal slightly higher than test #3, accounting respectively for 19% and 17%, meaning that the addition of primary and secondary sludges did not improve the TCOD removal, probably due to the presence of non-biodegradable compounds. Moreover, the TCOD removal percentage of test #4 (19%) almost doubled that of test #2 (11%); thus, the addition of the HTC liquor improved notably the TCOD removal. Considering samples where both the HTC liquor and the hydrochar were present, results show that a low addition of hydrochar (tests #5 and #6) did not improve the TCOD removal compared to previous tests. The highest removal in TCOD was obtained in test #8 where the mass of hydrochar added was equal to 30% of the total feedstock. With a further increase in the mass of hydrochar added to the sample, a decrease in the removal percentage was observed accounting for 27% in test #9. Moreover, results show a correlation between the TCOD removal and the biomethane production: as it should be expected, when the TCOD removal increases, so does the production of CH4.
The Norg-N concentration, as it usually happens in the AD process, had a quite high removal, because Norg-N was to a significant extent converted to NH4+-N. Thus, results reveal that in both tests were only the HTC liquor was added, there was an increase in the Norg-N removal accounting for 64% in test #3 and 63% in test #4. Moreover, as for the COD removal, data highlights that the addition of HTC liquor had no negative effects on the Norg-N reduction, since the removal percentage of test #4 was higher than that of the reference sample (test #2), accounting, respectively, for 63% and 50%. On the contrary, samples from tests #5 to #9 did not show a clear trend in the Norg-N removal. Results reveal that when adding a mass of hydrochar, a Norg-N removal is still observed ranging from 5% (test #7) to 35% (test #5). Considering the NH4+-N concentration, an increase in all the tests was observed. For test #2, #3 and #4 the trend of NH4+-N concentration followed that of Norg-N concentration (i.e., it was reversed). Thus, the higher increase corresponded to tests #3 and #4, where the HTC liquor was added. On the contrary, from tests #5 to #9 the increase in NH4+-N concentration was lower ranging from 5% to 28%.
Furthermore, the C/N ratio plays an important role in the AD process. In general, municipal wastewater has a C/N ratio lower than 8.0 while the optimal ratio for AD is in the range 20–30 [55]. Thus, low values of C/N ratio correspond to a substrate with relatively high amount of N that contribute to inhibit the microbial growth and the AD [56]. On the contrary, when C/N ratio is too high, biogas production is not favored due to acidogenic bacterium that rapidly consume nitrogen compared to methanogenic bacteria [57]. Results show that the addition of HTC liquor and hydrochar promote the increase of the C/N ratio from 7.7 of test #1 to 13.4 of test #9, where the higher amount of HTC liquor and hydrochar was added, corresponding to the highest methane production obtained in the BMP tests. In the common practice of wastewater treatment, the organic carbon concentration is represented by COD [58]. Thus, the value of C was assumed equal to the TCOD0 value. Results revealed that methane production could be improved with the addition of both HTC liquor and hydrochar also due to the increase in the C/N ratio.
4. Conclusions
HTC was demonstrated to be a suitable option for post-treatment of sewage sludge AD, that could treat the HTC liquor and the hydrochar derived from the HTC process for further improvement of the biomethane production. Processing of digestate at 190 °C for 1 h resulted in an HTC liquor with a higher content of RBCOD, rather than treating the same sample for a longer time (3 h). Results of the BMP tests showed that, adding the HTC liquor to the sludge sample, a higher value of the SMP was obtained that was almost double compared to that of the reference mix sample. Moreover, the SMP value was much higher when both HTC liquor and hydrochar were added to the sludge sample, in particular when the ratio between the hydrochar and the total feedstock added ranged between 30% and 45%. Thus, this study contributes to demonstrate that the digestate is suitable to be used as feedstock for the HTC process and, which is the main focus here, the HTC process can be integrated in a WWTP promoting an improvement in biomethane production and contributing to reduce the sludge to be disposed.
Author Contributions
Conceptualization, F.M., L.F. and G.A.; methodology, R.F., F.M., L.F. and G.A.; formal analysis, F.M.; investigation, F.M.; resources, L.F. and G.A.; data curation, R.F. and F.M.; writing—original draft preparation, R.F. and F.M.; writing—review and editing, R.F., L.F. and G.A.; supervision, L.F. and G.A.; funding acquisition, L.F. and G.A. All authors have read and agreed to the published version of the manuscript.
Funding
This research was partially funded by ECOOPERA Coop.
Acknowledgments
The authors wish to thank Andrea Boschele for his help and support during the experimental activity.
Conflicts of Interest
The authors declare no conflict of interest. The funders had no role in the design of the study; in the collection, analyses, or interpretation of data; in the writing of the manuscript, or in the decision to publish the results
Appendix A

Figure A1.
SMP of tests #1, # 2, #3 and #4 with standard deviation.
Figure A1.
SMP of tests #1, # 2, #3 and #4 with standard deviation.


Figure A2.
SMP of tests #4, #5, #6, #7, #8 and #9 with standard deviation.
Figure A2.
SMP of tests #4, #5, #6, #7, #8 and #9 with standard deviation.


Figure A3.
Daily methane production (DMP) with standard deviation of (a) tests #1 to #4 and (b) tests #5 to #9.
Figure A3.
Daily methane production (DMP) with standard deviation of (a) tests #1 to #4 and (b) tests #5 to #9.

Table A1.
Contribution in terms of TCOD of the various streams fed to the BMP tests.
Table A1.
Contribution in terms of TCOD of the various streams fed to the BMP tests.
| Test | TCOD0 Inoculum (g) | TCOD0 HTC Liquor (g) | TCOD0 STS (g) | TCOD0 DTS (g) | TCOD0 Hydrochar Moisture (g) | TCOD0 Dry Hydrochar * (g) | TCOD0 (g) |
|---|---|---|---|---|---|---|---|
| 1 | 1.86 ± 0.20 | - | - | - | - | - | 1.80 ± 0.09 |
| 2 | 1.25 ± 0.15 | - | 0.91 ± 0.12 | 0.29 ± 0.15 | - | - | 2.46 ± 0.12 |
| 3 | 1.23 ± 0.51 | 1.15 ± 0.10 | - | - | - | - | 2.38 ± 0.12 |
| 4 | 1.25 ± 0.15 | 0.17 ± 0.07 | 0.76 ± 0.08 | 0.25 ± 0.10 | - | - | 2.43 ± 0.12 |
| 5 | 1.25 ± 0.15 | 0.17 ± 0.07 | 0.76 ± 0.08 | 0.25 ± 0.10 | 0.03 ± 0.01 | 0.24 ± 0.05 | 2.70 ± 0.13 |
| 6 | 1.25 ± 0.15 | 0.17 ± 0.07 | 0.76 ± 0.08 | 0.25 ± 0.10 | 0.06 ± 0.01 | 0.61 ± 0.07 | 3.10 ± 0.16 |
| 7 | 1.21 ± 0.12 | 0.17 ± 0.07 | 0.76 ± 0.08 | 0.25 ± 0.10 | 0.15 ± 0.07 | 0.16 ± 0.01 | 2.70 ± 0.13 |
| 8 | 1.21 ± 0.12 | 0.17 ± 0.07 | 0.76 ± 0.08 | 0.25 ± 0.10 | 0.29 ± 0.06 | 1.02 ± 0.05 | 3.70 ± 0.18 |
| 9 | 1.21 ± 0.12 | 0.17 ± 0.07 | 0.76 ± 0.08 | 0.25 ± 0.10 | 0.44 ± 0.09 | 2.54 ± 0.04 | 5.37 ± 0.27 |
* computed by difference from TCOD0 and TCOD0 (inoculum + HTC liquor + STS + DTS + hydrochar moisture).
References
- Esposito, G.; Frunzo, L.; Giordano, A.; Liotta, F.; Panico, A.; Pirozzi, F. Anaerobic co-digestion of organic wastes. Rev. Environ. Sci. Bio/Technol. 2012, 11, 325–341. [Google Scholar] [CrossRef]
- Ding, H.H.; Chang, S.; Liu, Y. Bioresource Technology Biological hydrolysis pretreatment on secondary sludge: Enhancement of anaerobic digestion and mechanism study. Bioresour. Technol. 2017, 244, 989–995. [Google Scholar] [CrossRef] [PubMed]
- Garcia-Peña, E.; Parameswaran, P.; Kang, D.; Canul-Chan, M.; Krajmalnik-Brown, R. Anaerobic digestion and co-digestion processes of vegetable and fruit residues: Process and microbial ecology. Bioresour. Technol. 2011, 102, 9447–9455. [Google Scholar] [CrossRef] [PubMed]
- Monlau, F.; Sambusiti, C.; Antoniou, N.; Barakat, A.; Zabaniotou, A. A new concept for enhancing energy recovery from agricultural residues by coupling anaerobic digestion and pyrolysis process. Appl. Energy 2015, 148, 32–38. [Google Scholar] [CrossRef]
- Sheets, J.P.; Yang, L.; Ge, X.; Wang, Z.; Li, Y. Beyond land application: Emerging technologies for the treatment and reuse of anaerobically digested agricultural and food waste. Waste Manag. 2015, 44, 94–115. [Google Scholar] [CrossRef]
- Kim, D.; Lee, K.; Park, K.Y. Hydrothermal carbonization of anaerobically digested sludge for solid fuel production and energy recovery. Fuel 2014, 130, 120–125. [Google Scholar] [CrossRef]
- Mumme, J.; Titirici, M.-M.; Pfeiffer, A.; Lüder, U.; Reza, M.T.; Mašek, O. Hydrothermal Carbonization of Digestate in the Presence of Zeolite: Process Efficiency and Composite Properties. ACS Sustain. Chem. Eng. 2015, 3, 2967–2974. [Google Scholar] [CrossRef]
- Aragón-Briceño, C.; Ross, A.; Camargo-Valero, M. Evaluation and comparison of product yields and bio-methane potential in sewage digestate following hydrothermal treatment. Appl. Energy 2017, 208, 1357–1369. [Google Scholar] [CrossRef]
- Aragón-Briceño, C.; Grasham, O.; Ross, A.; Dupont, V.; Camargo-Valero, M.A. Hydrothermal carbonization of sewage digestate at wastewater treatment works: Influence of solid loading on characteristics of hydrochar, process water and plant energetics. Renew. Energy 2020, 157, 959–973. [Google Scholar] [CrossRef]
- Xue, Y.; Liu, H.; Chen, S.; Dichtl, N.; Dai, X.; Li, N. Effects of thermal hydrolysis on organic matter solubilization and anaerobic digestion of high solid sludge. Chem. Eng. J. 2015, 264, 174–180. [Google Scholar] [CrossRef]
- Lucian, M.; Fiori, L. Hydrothermal Carbonization of Waste Biomass: Process Design, Modeling, Energy Efficiency and Cost Analysis. Energies 2017, 10, 211. [Google Scholar] [CrossRef]
- Basso, D.; Weiss-Hortala, E.; Patuzzi, F.; Baratieri, M.; Fiori, L. In Deep Analysis on the Behavior of Grape Marc Constituents during Hydrothermal Carbonization. Energies 2018, 11, 1379. [Google Scholar] [CrossRef]
- Volpe, M.; Wüst, D.; Merzari, F.; Lucian, M.; Andreottola, G.; Kruse, A.; Fiori, L. One stage olive mill waste streams valorisation via hydrothermal carbonisation. Waste Manag. 2018, 80, 224–234. [Google Scholar] [CrossRef] [PubMed]
- Lucian, M.; Fiori, L.; Fiori, L. Hydrothermal Carbonization Kinetics of Lignocellulosic Agro-Wastes: Experimental Data and Modeling. Energies 2019, 12, 516. [Google Scholar] [CrossRef]
- Funke, A.; Mumme, J.; Koon, M.; Diakité, M. Cascaded production of biogas and hydrochar from wheat straw: Energetic potential and recovery of carbon and plant nutrients. Biomass Bioenergy 2013, 58, 229–237. [Google Scholar] [CrossRef]
- Mumme, J.; Eckervogt, L.; Pielert, J.; Diakité, M.; Rupp, F.; Kern, J. Hydrothermal carbonization of anaerobically digested maize silage. Bioresour. Technol. 2011, 102, 9255–9260. [Google Scholar] [CrossRef]
- Oliveira, I.; Blöhse, D.; Ramke, H.-G. Hydrothermal carbonization of agricultural residues. Bioresour. Technol. 2013, 142, 138–146. [Google Scholar] [CrossRef]
- Merzari, F.; Goldfarb, J.; Andreottola, G.; Mimmo, T.; Fiori, L.; Fiori, L. Hydrothermal Carbonization as a Strategy for Sewage Sludge Management: Influence of Process Withdrawal Point on Hydrochar Properties. Energies 2020, 13, 2890. [Google Scholar] [CrossRef]
- Wirth, B.; Reza, T.; Mumme, J. Influence of digestion temperature and organic loading rate on the continuous anaerobic treatment of process liquor from hydrothermal carbonization of sewage sludge. Bioresour. Technol. 2015, 198, 215–222. [Google Scholar] [CrossRef]
- Ischia, G.; Orlandi, M.; Fendrich, M.; Bettonte, M.; Merzari, F.; Miotello, A.; Fiori, L. Realization of a solar hydrothermal carbonization reactor: A zero-energy technology for waste biomass valorization. J. Environ. Manag. 2020, 259, 110067. [Google Scholar] [CrossRef]
- Nuchdang, S.; Frigon, J.-C.; Roy, C.; Pilon, G.; Phalakornkule, C.; Guiot, S.R. Hydrothermal post-treatment of digestate to maximize the methane yield from the anaerobic digestion of microalgae. Waste Manag. 2018, 71, 683–688. [Google Scholar] [CrossRef] [PubMed]
- Cao, Z.; Hülsemann, B.; Wüst, D.; Illi, L.; Oechsner, H.; Kruse, A. Valorization of maize silage digestate from two-stage anaerobic digestion by hydrothermal carbonization. Energy Convers. Manag. 2020, 222, 113218. [Google Scholar] [CrossRef]
- Lucian, M.; Volpe, M.; Merzari, F.; Wüst, D.; Kruse, A.; Andreottola, G.; Fiori, L. Hydrothermal carbonization coupled with anaerobic digestion for the valorization of the organic fraction of municipal solid waste. Bioresour. Technol. 2020, 314, 123734. [Google Scholar] [CrossRef] [PubMed]
- Pagés-Díaz, J.; Huiliñir, C.C. Valorization of the liquid fraction of co-hydrothermal carbonization of mixed biomass by anaerobic digestion: Effect of the substrate to inoculum ratio and hydrochar addition. Bioresour. Technol. 2020, 317, 123989. [Google Scholar] [CrossRef] [PubMed]
- Marin-Batista, J.D.; Villamil, J.A.; Qaramaleki, S.V.; Coronella, C.J.; Mohedano, A.F.; de la Rubia, M.A. Energy valorization of cow manure by hydrothermal carbonization and anaerobic digestion. Renew. Energy 2020, 160, 623–632. [Google Scholar] [CrossRef]
- Pagés-Díaz, J.; Alvarado, A.O.C.; Montalvo, S.; Diaz-Robles, L.; Curio, C.H. Anaerobic bio-methane potential of the liquors from hydrothermal carbonization of different lignocellulose biomasses. Renew. Energy 2020, 157, 182–189. [Google Scholar] [CrossRef]
- Parmar, K.R.; Ross, A. Integration of Hydrothermal Carbonisation with Anaerobic Digestion; Opportunities for Valorisation of Digestate. Energies 2019, 12, 1586. [Google Scholar] [CrossRef]
- Ischia, G.; Fiori, L. Hydrothermal Carbonization of Organic Waste and Biomass: A Review on Process, Reactor, and Plant Modeling. Waste Biomass Valorization 2020, 1–28. [Google Scholar] [CrossRef]
- Villamil, J.; De La Rubia, M.; Rodriguez, J.J.; De La Rubia, M. Valorisation of the liquid fraction from hydrothermal carbonisation of sewage sludge by anaerobic digestion. J. Chem. Technol. Biotechnol. 2017, 93, 450–456. [Google Scholar] [CrossRef]
- Gaur, R.Z.; Khoury, O.; Zohar, M.; Poverenov, E.; Darzi, R.; Laor, Y.; Posmanik, R. Hydrothermal carbonization of sewage sludge coupled with anaerobic digestion: Integrated approach for sludge management and energy recycling. Energy Convers. Manag. 2020, 224, 113353. [Google Scholar] [CrossRef]
- Chen, Y.-D.; Wang, R.; Duan, X.; Wang, S.; Ren, N.-Q.; Ho, S.-H. Production, properties, and catalytic applications of sludge derived biochar for environmental remediation. Water Res. 2020, 187, 116390. [Google Scholar] [CrossRef] [PubMed]
- Ferrentino, R.; Ceccato, R.; Marchetti, V.; Andreottola, G.; Fiori, L. Sewage Sludge Hydrochar: An Option for Removal of Methylene Blue from Wastewater. Appl. Sci. 2020, 10, 3445. [Google Scholar] [CrossRef]
- Tchobanoglous, G.; Burton, F.L.; Stensel, H.D. Wastewater Engineering: Treatment and Reuse, 4th ed.; McGraw-Hill: Boston, MA, USA, 2003; pp. 1–1890. [Google Scholar]
- Merzari, F.; Lucian, M.; Volpe, M.; Andreottola, G.; Fiori, L. Hydrothermal carbonization of biomass: Design of a bench-Scale reactor for evaluating the heat of reaction. Chem. Eng. Trans. 2018, 65, 43–48. [Google Scholar]
- Ferrentino, R.; Merzari, F.; Fiori, L.; Andreottola, G. Biochemical Methane Potential Tests to Evaluate Anaerobic Digestion Enhancement by Thermal Hydrolysis Pretreatment. Bioenergy Res. 2019, 12, 722–732. [Google Scholar] [CrossRef]
- Owen, W.; Stuckey, D.; Healy, J.; Young, L.; Mccarty, P. Bioassay for monitoring biochemical methane potential and anaerobic toxicity. Water Res. 1979, 13, 485–492. [Google Scholar] [CrossRef]
- VDI 4630. Fermentation of Organic Materials, Characterisation of the Substrate, Sampling, Collection of Material Data; Verlag des Vereins Deutscher Ingenieure: Düsseldorf, Germany, 2006; pp. 1–132. [Google Scholar]
- Rice, E.W.; Baird, R.B.; Eaton, A.D. Standard methods for the examination of water and wastewater. Am. Public Heal. Assoc. 2017, 23, 1–159. [Google Scholar]
- APAT-CNR-IRSA. Metodi Analitici per le Acque, Volume Primo. 2003. ISBN 8844800837. Available online: www.irsa.cnr.it/Docs/Capitoli/1000.pdf (accessed on 2 September 2019).
- Andreottola, G.; Foladori, P.; Ferrai, M.; Ziglio, G. Respirometria Applicata alla Depurazione delle Acque; Università di Trento: Trento, Italy, 2002; Volume 1, pp. 1–153. [Google Scholar]
- Cheng, J.; Lu, X.; Kobayashi, T.; Cheng, J.; Xu, K.; Zhao, Y. Mesophilic anaerobic co-digestion of waste activated sludge and Egeria densa: Performance assessment and kinetic analysis. Appl. Energy 2015, 148, 78–86. [Google Scholar] [CrossRef]
- Funke, A.; Ziegler, F. Hydrothermal carbonization of biomass: A summary and discussion of chemical mecha- nisms for process engineering. Biofuels Bioprod. Biorefin. 2010, 4, 160–177. [Google Scholar] [CrossRef]
- Berge, N.D.; Ro, K.S.; Mao, J.; Flora, J.R.V.; Chappell, M.A.; Bae, S. Hydrothermal Carbonization of Municipal Waste Streams. Environ. Sci. Technol. 2011, 45, 5696–5703. [Google Scholar] [CrossRef]
- Ekpo, U.; Ross, A.; Camargo-Valero, M.; Williams, P. A comparison of product yields and inorganic content in process streams following thermal hydrolysis and hydrothermal processing of microalgae, manure and digestate. Bioresour. Technol. 2016, 200, 951–960. [Google Scholar] [CrossRef]
- Danso-Boateng, E.; Shama, G.; Wheatley, A.; Martin, S.; Holdich, R. Hydrothermal carbonisation of sewage sludge: Effect of process conditions on product characteristics and methane production. Bioresour. Technol. 2015, 177, 318–327. [Google Scholar] [CrossRef] [PubMed]
- Merzari, F.; Langone, M.; Andreottola, G.; Fiori, L. Methane production from process water of sewage sludge hydrothermal carbonization. A review. Valorising sludge through hydrothermal carbonization. Crit. Rev. Environ. Sci. Technol. 2019, 49, 947–988. [Google Scholar] [CrossRef]
- Chen, H.; Rao, Y.; Cao, L.; Shi, Y.; Hao, S.; Luo, G.; Zhang, S. Hydrothermal conversion of sewage sludge: Focusing on the characterization of liquid products and their methane yields. Chem. Eng. J. 2019, 357, 367–375. [Google Scholar] [CrossRef]
- De La Rubia, M.; Villamil, J.; Rodriguez, J.; Mohedano, A. Effect of inoculum source and initial concentration on the anaerobic digestion of the liquid fraction from hydrothermal carbonisation of sewage sludge. Renew. Energy 2018, 127, 697–704. [Google Scholar] [CrossRef]
- Nyktari, E.; Danso-Boateng, E.; Wheatley, A.; Holdich, R. Anaerobic digestion of liquid products following hydrothermal carbonisation of faecal sludge at different reaction conditions. Desalin. Water Treat. 2017, 91, 245–251. [Google Scholar] [CrossRef]
- Villamil, J.; De La Rubia, M.; Rodriguez, J.J.; De La Rubia, M. Anaerobic co-digestion of the aqueous phase from hydrothermally treated waste activated sludge with primary sewage sludge. A kinetic study. J. Environ. Manag. 2019, 231, 726–733. [Google Scholar] [CrossRef]
- De La Rubia, M.; Villamil, J.; Rodriguez, J.; Borja, R.; Mohedano, A. Mesophilic anaerobic co-digestion of the organic fraction of municipal solid waste with the liquid fraction from hydrothermal carbonization of sewage sludge. Waste Manag. 2018, 76, 315–322. [Google Scholar] [CrossRef]
- Luz, F.C.; Volpe, M.; Fiori, L.; Manni, A.; Cordiner, S.; Mulone, V.; Rocco, V. Spent coffee enhanced biomethane potential via an integrated hydrothermal carbonization-anaerobic digestion process. Bioresour. Technol. 2018, 256, 102–109. [Google Scholar] [CrossRef]
- Donoso-Bravo, A.; Ortega-Martinez, E.; Ruizfilippi, G. Impact of milling, enzyme addition, and steam explosion on the solid waste biomethanation of an olive oil production plant. Bioprocess Biosyst. Eng. 2015, 39, 331–340. [Google Scholar] [CrossRef]
- Abudi, Z.N.; Hu, Z.; Sun, N.; Xiao, B.; Rajaa, N.; Liu, C.; Guo, D. Batch anaerobic co-digestion of OFMSW (organic fraction of municipal solid waste), TWAS (thickened waste activated sludge) and RS (rice straw): Influence of TWAS and RS pretreatment and mixing ratio. Energy 2016, 107, 131–140. [Google Scholar] [CrossRef]
- Kwietniewska, E.; Tys, J. Process characteristics, inhibition factors and methane yields of anaerobic digestion process, with particular focus on microalgal biomass fermentation. Renew. Sustain. Energy Rev. 2014, 34, 491–500. [Google Scholar] [CrossRef]
- Ceron-Vivas, A.; Cáceres-Cáceres, K.T.; Rincón-Pérez, A.; Cajigas, A.A. Influence of pH and the C/N ratio on the biogas production of wastewater. Rev. Fac. Ing. Univ. Antioq. 2019, 70–79. [Google Scholar] [CrossRef]
- Choi, Y.; Ryu, J.; Lee, S. Influence of carbon type and carbon to nitrogen ratio on the biochemical methane potential, pH, and ammonia nitrogen in anaerobic digestion. J. Anim. Sci. Technol. 2020, 62, 74–83. [Google Scholar] [CrossRef] [PubMed]
- Sobieszuk, P.; Szewczyk, K.W. Estimation of (C/N) Ratio for Microbial Denitrification. Environ. Technol. 2006, 27, 103–108. [Google Scholar] [CrossRef] [PubMed]


Publisher’s Note: MDPI stays neutral with regard to jurisdictional claims in published maps and institutional affiliations. |
© 2020 by the authors. Licensee MDPI, Basel, Switzerland. This article is an open access article distributed under the terms and conditions of the Creative Commons Attribution (CC BY) license (http://creativecommons.org/licenses/by/4.0/).