1. Introduction
Starting from the beginning of the 21st century, renewable energy sources (RES) became the main area of scientific research [
1]. Even though scientists have developed practical, reliable, and cutting-edge technologies in the field of RES, the process of shifting from nonrenewable energy sources to RES, especially in developing countries, has been quite slow. However, most of the developing countries have significant RES and great potential, such as sun and wind, which cover vast geographical zones and do not require a centralized approach for spreading. However, for some reason, the current use of RES in these countries is insignificant compared to their potential. In addition to this, the rapid population growth in these countries, as well as the growing energy demand, is leading to an energy crisis, which increases people’s dependence on nonrenewable energy sources.
Whereas traditional energy is the major energy in the global energy balance, it is the main source of carbon dioxide emissions into the atmosphere (carbon dioxide emissions (CO2) greenhouse gases). This has led to serious problems in modern times, such as global warming. The promotion of RES became one of the essential strategies used to decrease CO2 emissions, including finding substitutes for mining energy (traditionally—coal, gas, oil, and radioactive ore) in the transport and electricity sectors. However, geothermal energy and small hydropower, and in some countries even wind energy, can also compete with traditional technologies, but the same cannot be claimed about solar technology.
The United Nations General Assembly has declared the period of 2014–2024 as the Decade of Sustainable Energy for All, emphasizing the significance of energy matters for long-term development and the amplification of the post-2015 development agenda [
2]. As a result of this, renewable energy-related policies, production, and financing of renewable energy sources continue to expand in developing countries, as well as transition economies. Investment models have also shifted from conventional government and foreign benefactor funding sources to private, generally local enterprises and banks [
3,
4]. The implementation of renewable energy sources is increasing between public establishment, industry, NGO’s, and business.
Currently, the spread of the pandemic COVID-19 infection in the world is also affecting the energy sector: whereas there have been dramatic changes in the level of conventional fuel prices, electro energetic systems that utilize a large share of renewable energy sources are operating efficiently [
5]. Under the conditions of the spread of the virus, the drop in production has led to a temporary contraction in greenhouse gas emissions. However, this is not significant enough to achieve key climate goals. These issues further increase the value of the use of RES.
Nowadays, the importance of sustainable development is promoted, and consequently, this trend stimulates economic growth and mitigates the consequences of climate change. The development of technology using RES allows us to assort the energy balance and expand energy security, helping to reduce dependence on conventional fuels and greenhouse gases [
6]. The International Energy Agency has stated that RES technology is the only solution in the world to reduce dependence on traditional fuels. The RES is increasingly being perceived as an investment that is able to provide economic benefits by decreasing dependence on imported fossil fuels, developing air quality and health safety, rising access to energy security, and increasing economic growth and reducing unemployment.
For many developing countries, the establishment of supportive actions for the implementation of the RES is a priority. These countries adopt support policies and conduct experiments. By the end of 2013, developing countries and states in which a market economy was improving were the main leaders in increasing policies to support renewable energy sources [
4]. RES-supporting policies typically involve the use of administrative and economic instruments like direct investments toward improving infrastructure, which include greenhouse gas emission quotas (GHGs) or green certificates, tax or financial incentives, and market initiatives. It has been found that economic as well as financial instruments have a strong impact on alternative energy formation in developing countries [
7].
The renewable energy market continues to be a growing and successful area. However, it is always accompanied by financial problems. In particular, there are gaps in the financing of alternative energy sources in developing countries [
8].
Capital and other investments, infrastructure costs, operating costs, credit mechanism, availability of benefits, and subsidies are important factors determining the growing of RES implementation.
In 2004, the Republic of Azerbaijan adopted “The State Program on the Utilization of Alternative and Renewable Energy Sources”. As a consequence of the successful implementation of the planned programs and orders, the IRENA Renewable Energy Statistics 2019 report highlighted that the total amount of renewable energy in the country during 2009–2018 was accompanied by a steady increase from 989 megawatt (MW) to 1394 MW [
5].
From a future perspective, alternative and renewable energy sources are important for Azerbaijan. However, with the exception for hydropower, renewable energy sources are rarely used in the country. Azerbaijan has alternative and renewable energy potential such as water, wind, solar, and biomass. Among them, wind energy is more useful than other alternative energy sources in terms of cost, environmental friendliness, and renewable properties. There are 12 large and seven small hydropower plants in Azerbaijan, as well as six wind, 10 solar, and six biomass power plants.
The total capacity of renewable energy in the country is 4.5 MW, which constitutes a very small part of the total installed capacity (6452 MW). Currently, the technical potential for renewable electricity installed is 115,200 MW for a solar photoelectric system, 4500 MW for wind, 1500 MW for biomass, and 400 MW for a small hydropower plant [
9].
Azerbaijan aims to rise the portion of renewable energy sources in total electricity output up to 30% by 2030 [
9]. Financing such energy sources requires an assessment of the financial risks of these projects in the area. However, certain problems emerge due to the fact that electricity generation from alternative and renewable sources is often more expensive compared with traditional electricity formation. In order to solve this problem, several positive incentives have been prepared. One example could be an exemption from customs duties and VAT (till the end of 2020) for all imported equipment and replacement parts that are used in all fields of alternative and renewable energy. The other similar measure is full availability of tax-free operations in the alternative and renewable energy sector until the end of 2020. To ensure the development of this sector, the state allocates loans and investments. In addition to tax and customs benefits for local enterprises that use international experience and produce equipment and machinery for alternative and renewable energy, guaranteed subsidies and capital investments are also widespread in the country.
Azerbaijan is capable of earning some income from alternative and renewable energy. One of the most significant elements is that the production of heat and electricity from alternative and renewable energy sources means the protection of conventional energy sources in the country. This can plausibly lead to the effective use of oil and gas reserves and boost Azerbaijan’s export potential. This, in turn, can have a significant effect on Azerbaijan’s key economic indicators.
Currently, alternative and renewable energy sources do not form the main part of electricity production in Azerbaijan. However, a change in this ratio in favor of alternative and renewable energy has led to a new source of profit. Thus, all necessary conditions, such as the buying of new technologies, creation of new workplaces, and the acquisition of new knowledge is ensured. Increasing the production of alternative and renewable energy can help to develop other fields of the economy and supply the country with dividends and other nonfinancial benefits.
Based on the predictions of well-known international organizations (International Energy Agencies (IEA), Bloomberg, GlobalData, Ember, Rystad Energy), the ongoing pandemic Covid-19 and the economic crisis that it created will foster the shifting process to a “clean” or “green” economy, which will eventually accelerate the use of renewable energy sources. More specifically, changes in the geopolitical situation in the Middle East’s oil and gas supply markets are anticipated to raise the demand worldwide for renewable energy sources. Finally, the economic crisis stemming from the Covid-19 pandemic will lead to the sharpest decline in CO2 emissions in a year in the history of mankind and the shutdown of production, halting of trade opportunities, a sharp decline in international and regional transportation, and diminishing energy demand will persist in this situation.
Development in the financial sector promotes the financial proficiency of a nation, enables financial capital and FDI inflows to the country, improves the activities of financial intermediaries, decreases the expenses related to borrowing and the risk in the finance sector, and reduces asymmetric information between lenders and borrowers. Eventually, this situation could have an impact on the demand for energy by raising consumption and fixed capital investment. There is plenty of research in which the existence of a cause–effect association between financial development and alternative energy consumption can be justified from several perspectives. Based on the results of Sadorsky [
10], Mahalik et al. [
11], and Kassi [
12], we concluded that financial development can affect energy consumption through the following ways: (a) The improvement of the financial system can facilitate the movement and allocation of funds to the private sector at an affordable interest rate to finance profitable investments and high-tech projects, which, in most cases, are highly reliant on energy use. Therefore, assigning banking credits to the private sector assists firms to increase their assets, physical capital, factors of production, and eventually, all of these result in an expansion in the construction of electric machines, rises in manufacturing processes, and increases in energy consumption by labor. The total energy consumed by companies affects overall energy utilization in a country [
13]. (b) The development in the financial sector may lead to finding more innovative and efficient financial tools, such as online payments through electronic cards, mobile banking, and other online financial services. These highly developed financial services will motivate and create a positive incentive for consumers to easily expend their bank savings to buy energy-consuming products; houses; electronic devices such as automobiles; or household appliances like washing machines, air conditioners, and refrigerators. All of the components will foster energy demand. Furthermore, improvement in the financial sector may have a contribution in creating different types of financial products, which will lead to rising household credits. This means that thanks to the well-developed financial sector, the credits at affordable interest rates will be given to support households’ daily demand, which includes energy-demanding apparatuses [
13,
14]. (c) The development of the financial sector shows a country’s prosperity and generates wealth effect by improving confidence between commercial enterprises and consumers, which refine the business environment. Furthermore, improvement in equity and debt markets, in addition to certitude between firms and consumers, assist them to get access to financial markets efficiently and obtain extra funds. Therefore, the equity market expands economic activities, and this eventually raises energy consumption [
14]. From these points of view, a positive relationship is anticipated between financial development and the demand for renewable energy.
One of the plausible expectations is that the demand for renewable energy sources will resume increasing in the future. This should be considered as a positive incentive for potential future research. While energy demand in the world dropped significantly due to the pandemic, it is important to acknowledge that the portion of the consumption of renewable energy in total energy consumption will continue to rise. An efficiently working financial system is a basis for the development of the country’s utilization of alternative energy sources. The use of renewable energy sources can also serve as a positive driver for economic development, as well as financial development. Moreover, the utilization of alternative energy sources can provide higher socio-economic benefits, as well as favorable environmental effects in Azerbaijan, or in any other countries that are considered to be emerging market or developing economics. Thus, large governmental investments in the utilization of renewable energy sources can motivate the private sector involvement in the process of financing new projects in this area. The government’s role as a last resort investor can stimulate the participation of non-bank financial institutions in such projects.
Taking into consideration the aforementioned facts, it is crucial to investigate the link between financial development and renewable energy use for the 20th economy in the world in regards to displayed oil reserves, the third-biggest oil producer among the post-Soviet economies in 2019, and the 86th biggest economy in the world and the fifth-largest country among the former Soviet Union members in terms of GDP—Azerbaijan [
15]. Azerbaijan is an oil-abundant country and depends greatly on its petroleum, natural gas, heavy industry, and agricultural sectors. The oil and gas industries roughly constituted 54% of GDP in 2010 and 90% of exports in 2019 [
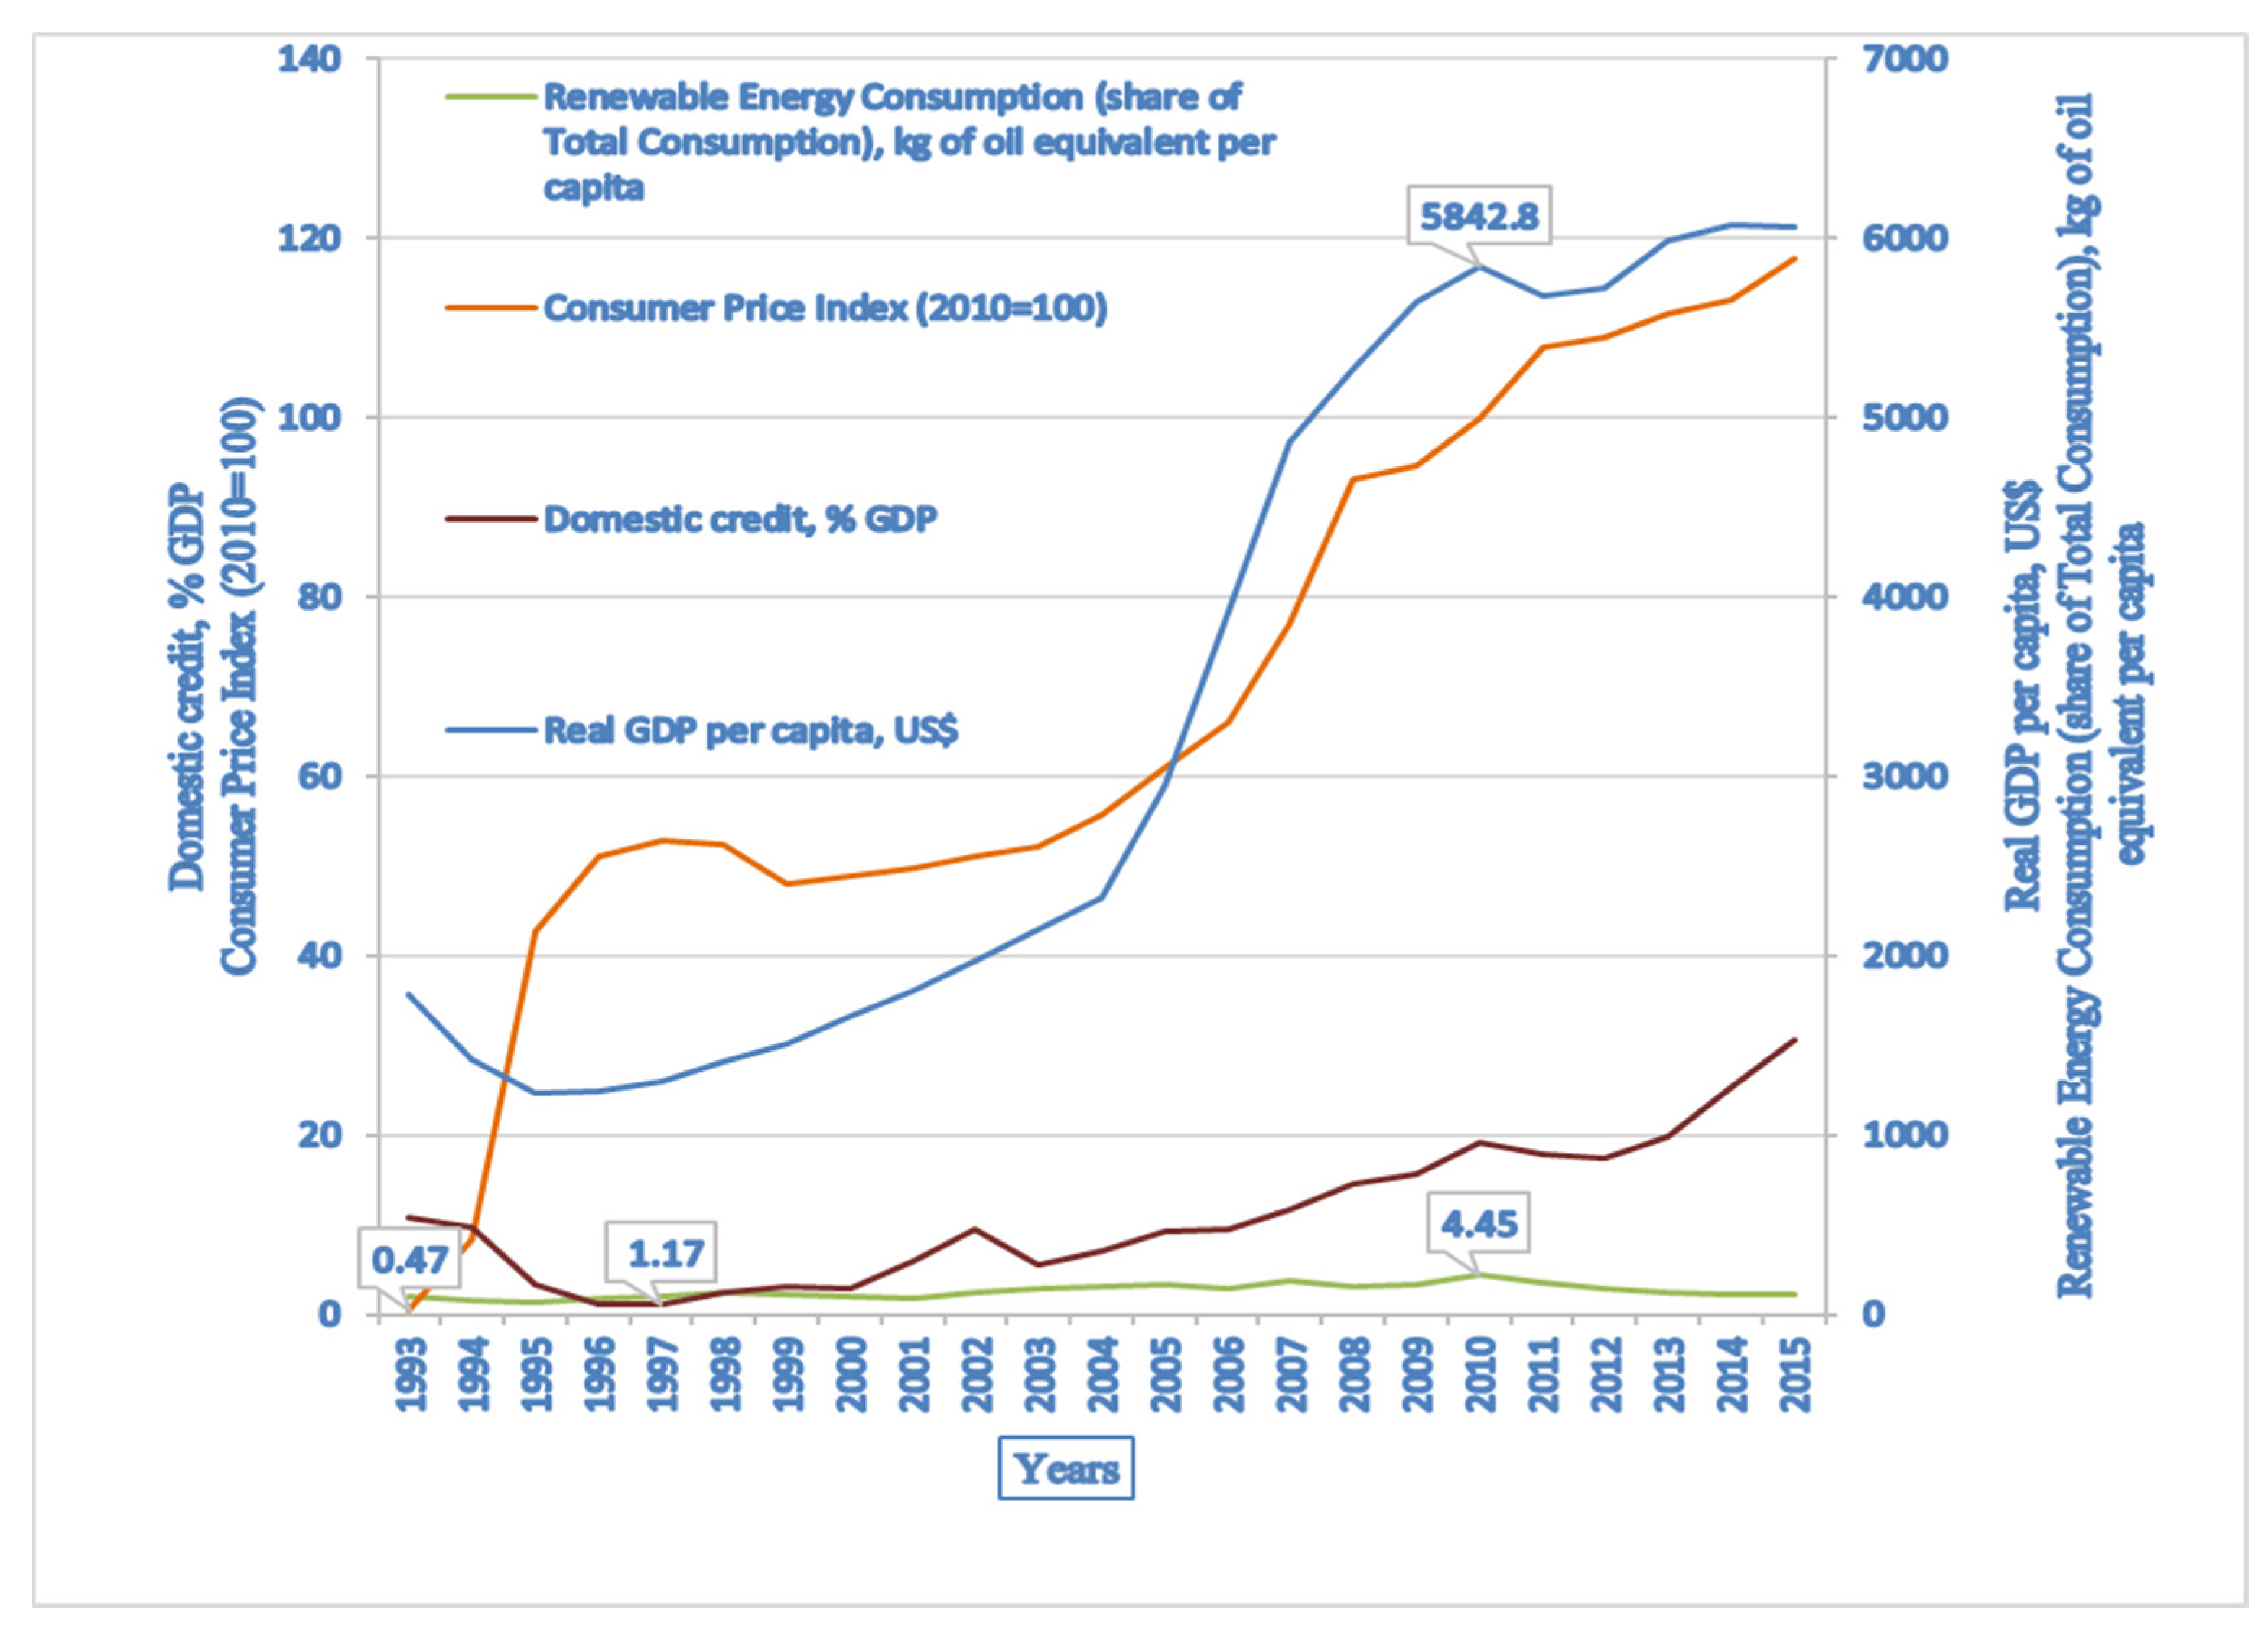
16]. Azerbaijan’s GDP increased 12 times from 3.97 billion US in 1993 to 48.05 billion US in 2019. However, since 2015, adverse oil price shock (decreasing oil revenue) has hindered the economic growth in Azerbaijan. The GDP growth rate of Azerbaijan decreased from 5.8% in 2013 to 2.8% in 2014 and −3.1% in 2015 [
16]. The main reason is that Azerbaijan is a less diversified economy and resources for output (including energy) do not have an important position in non-oil sectors. This could be either because of deficient and ineffective usage or a low level of demand for them in these sectors due to the Dutch disease issues. To prevent this, we believe that it is necessary to define and evaluate the key influencers of renewable energy use, which are believed to have a significant role in boosting economic growth in Azerbaijan.
To the best of our knowledge, there is no research devoted to analyzing the relationship between renewable energy consumption and financial development for the Azerbaijani case, utilizing time-series data that permit the exploration of country-specific characteristics of this link. Therefore, the aim of this study is to fill in this gap by exploring the impact of financial development on renewable energy consumption in Azerbaijan, which is one of the resource-rich economies blessed also with abundant renewable energy resources, making it a particular example for the current study. For the analysis, we employed the autoregressive distributed lagged (ARDL) method. The ARDL performs better than all the alternative techniques in small samples, which is the case here in this article. The findings of the research are significant for policymakers to formulate suitable policies in favor of sustainable energy use. In addition, the findings of this article are also important for the other former Soviet Union and developing oil-rich countries.
The structure of the current research is as follows: The literature review is given in
Section 2.
Section 3 presents a description of the data and research methodology. The discussion and results of the article are given in
Section 4. The conclusion and recommendation are presented in
Section 5.
2. Literature Review
There are some studies in the literature that investigated the relationship between renewable energy consumption (REC) and financial development (FD). In this section, we review similar recent studies dedicated to the financial development–renewable energy consumption relationship in the case of several distinct countries. The recent related previous studies are presented in
Table 1. The table covers only studies investigated after 2015.
Wu and Broadstock [
17] explored the effect of FD on REC using data for the period of 1990–2010 for 22 emerging market countries. According to the findings of the analysis, FD was found to have a statistically significant positive influence on REC. Moreover, Lin et al. [
18] evaluated the relationship between REC and FD in the case of China, concentrating on the electricity sector. They found that FD promoted REC between 1980–2011.
Kutan et al. [
19] evaluated the development of stock market influences on REC for India, China, Brazil, and South Africa. The estimation results confirmed the statistically significant effect of stock market development on REC. The causal relationship between REC and FD also was examined by Hassine and Harrathi [
20] in the case of the Gulf Cooperation Council (GCC) economies during 1980–2012. They revealed a unidirectional causal link running from REC to FD. Burakov and Freidin [
21] evaluated the association between REC and FD in Russia. For estimation, they used the vector error correction model (VECM). The results confirmed that there is a positive association between variables both in the short run and long run. In addition, Khoshnevis Yazdi and Shakouri [
22] revealed a positive link between REC and FD in China by applying ARDL method.
Pata [
23] explored the link between FD and REC per capita for Turkey by applying ARDL bounds testing approach and the Gregory–Hansen and Hatemi-J cointegration tests to the annual data period of 1974–2014. The results concluded the presence of a long-run cointegration association between variables. Ari and Cergibozan [
24] found a bidirectional causal link between REC and FD for Turkey.
Eren et al. [
25] analyzed the FD impact on REC using data for the period of 1971–2011 in the case of India. They used dynamic ordinary least squares (DOLS) method and concluded a positive and statistically significant of FD on REC. Alsaleh and Abdul-Rahim [
26] examined the link between FD and bioenergy consumption in 28 European Union economies for the period of 1990–2013 by employing the panel ARDL approach. The results indicated that FD has a significant positive effect on bioenergy consumption.
Qamruzzaman and Jianguo [
27] evaluated the relationship between REC and FD by employing panel nonlinear ARDL to data over the period of 1990–2017 for 113 countries. The panel non-linear ARDL test concluded the presence of a long-run asymmetric relationship between variables. Liu et al. [
28] investigated the relationship between FD and REC for BRICS countries by employing 3SLS method for the data period from 1999 to 2015. They found that there was a positive impact of FD on REC. Anton and Afloarei Nucu [
29] analyzed the impact of FD on REC by employing a fixed-effect panel model. They used annual data spanning of 1990–2015 for 28 countries in the European Union (EU). They stated that FD had a statistically significant positive impact on the share of REC. Additionally, Khan et al. [
30] obtained a positive effect from financial development to renewable energy consumption for 192 countries employing panel quantile regression method.
In the case of Azerbaijan, Mukhtarov et al. [
31] only analyzed the influence of FD and economic growth on energy consumption and did not consider REC. The authors used different cointegration techniques named ARD bounds, Gregory–Hansen, and Johansen cointegration tests for estimation. The results revealed positive influences of FD and economic growth on energy consumption.
As it can be observed from the literature, there has been no research investigating the impact of FD on REC in the case of Azerbaijan, applying country-specific timeseries data. Taking into account all the aforesaid facts, the essential aim of this article was to fill in this gap by using an autoregressive distributed lagged (ARDL) technique to see association between FD and REC. The contribution of the article is listed as follows: (a) it explored the FD–REC link in Azerbaijan, which has not been examined and is a good sample for countries with similar characteristics and (b) to the best of our knowledge, it is the single individual time-series study examining the effect of FD on REC in the case of Azerbaijan.
4. Empirical Results and Discussions
First, ADF and PP tests were applied for testing stationarity features of the model variables. The test results are presented in
Table 3. The unit root test results of ADF and PP indicated that REC, FD, GDP, and CPI were nonstationary at I(0), but stationary at I(1). As shown in
Table 3, the ZA test could not reject the null hypothesis of presence of a unit root with a structural break at level but could reject the null hypothesis at first difference form. Hence, we could conclude that the variables were nonstationary in levels but stationary in their first differences, which meant that they could be tested for cointegration.
The bounds cointegration test results are presented on the right side of
Table 4. The test results concluded that there was a cointegrating relationship among the variables. To end, we used the ARDL technique to evaluate the long-run coefficients. The results of the ARDL method are presented on the left side of
Table 4. According to residual diagnostics results, Gauss-Markov conditions were satisfied. In addition, misspecification test results found no misspecification problem in the model. Lastly, we used the VECM in order to get more robust inferences. The results of the VECM are depicted in
Table 4. Also, the residuals of the VECM were tested and all the results met the requirements. In order to save space, we do not report the diagnostics test results here (they are available upon request).
The results of estimation showed that there is a positive and statistically significant influence of FD on REC at 5% level. The results designated that a 1% rise in FD raises REC by 0.16%. Our results coincide with the economic theory and the results of Wu and Broadstock [
17] for 22 emerging markets countries, Burakov and Freidin [
21] for Russia, Eren et al. [
25] for India, Anton and Afloarei Nucu [
29] for 28 European Union countries, Khan et al. [
30] for 192 countries. From a theoretical viewpoint, the reached positive effect of FD, measured by domestic credit as a share of GDP indicates that developing financial systems enables businesses and households to get more affordable financial sources easily to start or expand their businesses and buy durable goods, and in turn, all these activities will increase the renewable energy demand. In addition, estimation results concluded a positive and statistically significant influence of GDP on REC at the 5% level. The results reveal that REC responses by 0.60% rise to a 1% rise in economic growth. This finding implies that an increase in economic growth raises REC. Having positive and significant effect of economic growth on REC, our result is in line with the results of Mukhtarov [
44] for Azerbaijan. We also revealed that the effect of the CPI as a proxy for energy price is negative and statistically significant, which coincide with the economic theory.
In addition, the Toda–Yamamoto causality test [
45] under the VAR approach was employed to see a causality link between the variables. The results are presented in
Table 5.
Based on Toda–Yamamoto causality test, bidirectional causality between renewable energy consumption and financial development and unidirectional causality running from CPI to renewable energy consumption were observed. Moreover, the estimation results indicate bi-directional causal associations between renewable energy consumption and economic growth.
5. Conclusions
The study explored the relationship between financial development, renewable energy consumption, energy prices, and economic growth. For this purpose, the ARDL technique was employed to evaluate the long-run relationship among the variables. Our findings confirmed the presence of cointegration link among the variables in Azerbaijan. Results of the estimation revealed that there were statistically significant positive impacts of financial development and economic growth on renewable energy consumption. On the other hand, estimation results concluded a negative effect of energy prices on renewable energy consumption. In addition, estimation results revealed that a 1% rise in financial development, proxied by domestic credit as a percentage of GDP, and economic growth raise renewable energy consumption by 0.16% and 0.60%, respectively.
The acquired positive effect of financial development, measured by domestic credit as a portion of GDP, means that financial development in Azerbaijan is able to play a vital role in shaping RES-based energy demand. This is because the financial environment allows households, legal entities, and individuals to easily access cash (and credit) from financial institutions and increase their consumption and production potential. These situations and circumstances result in an increase in energy consumption. The positive influence of financial development on energy demand is important in the implementation of appropriate energy policies based on alternative energy sources. If the financial development leads to a decrease in energy use from fossil fuels, it can be concluded that this phenomenon, as well as increasing the use of efficient and environmentally friendly energy sources (RES), is achieved through financial development. At the same time, maintaining a balance between energy use and financial development is important for sustainable development. In other words, the expansion of economic activities of economic entities and the inclination of households to neglect energy standards because of cheaper energy prices can lead to a deterioration of the environment. In this regard, Azerbaijani policymakers and relevant authorities should study and approach energy-related measures as priorities to financial development, as well as RES-based energy policy in similar countries.
The pursued investigation allows us to conclude that not all possible tools and schemes have been used recently for the development of renewable energy sources in Azerbaijan. Increasing interest in this area is possible through a system of concessional mechanisms, which will allow forming a more sustainable innovation infrastructure with an attractive investment climate. In addition, policymakers should develop policies and take additional measures to increase energy efficiency, improve local energy resources, diversify energy supply sources, reduce taxes on energy products, and promote environmentally friendly energy production.
As a result, we concluded that while Azerbaijan can be considered as an emerging market and developing country, it is at the level of developed countries according to some indicators. Therefore, its financial development can exert a positive impact on the energy consumption. This means that as the country’s level of development particularly financial development increases, the utilization of alternative energy sources will also rise. However, due to the underdevelopment of the industrial sector, enterprises are trying to expand production rather than energy-saving technologies. Therefore, this can partially reduce the positive impact of financial development on the use of alternative energy sources. Thus, we recommend that policymakers in these countries should thoroughly evaluate the positive impact of financial development on the use of renewable energy sources and formulate a strategy for the development of the financial sector.
Whereas the study found a positive impact of financial development on renewable energy consumption, the complexity of their nexus remains a major topic of discussion in both theoretical and empirical research. Thus, although the influence of financial development on renewable energy consumption varies by region and country, the results of our study may also have theoretical significance in the development of state policy in this area. Additionally, it should be noted that financial development can raise the innovative activity and productivity of economic entities, reduce the use of traditional energy, and thus create a demand for alternative energy sources and stimulate its development. However, it should be logically claimed that it is not rational to remain unchanged in this area. Further broad investigations must be pursued. In conclusion, the results of the current study can be considered as an instrument for comparison of policy measurement goals in Azerbaijan and other resource-rich developing countries.


