Article

Gate-Opening Criterion for Generating Dam-Break Flow in Non-Rectangular Wet Bed Channels

1
State Key Laboratory of Hydraulics and Mountain River Engineering, Sichuan University, Chengdu 610065, China
2
Faculty of Engineering & Informatics, University of Bradford, Bradford BD71DP, UK
*
Author to whom correspondence should be addressed.
Energies 2020, 13(23), 6280; https://doi.org/10.3390/en13236280
Submission received: 23 September 2020 / Revised: 25 November 2020 / Accepted: 25 November 2020 / Published: 28 November 2020

Abstract

:
A sudden dam failure is usually simulated by the rapid removal of a gate in laboratory tests and numerical simulations. The gate-opening time is often determined according to the Lauber and Hager instantaneous collapse criterion (referred to as the Lauber–Hager criterion), which is established for a rectangular open channel with a dry bed. However, this criterion is not suitable for non-rectangular channels or initial wet-bed conditions. In this study, the effect of the gate-opening time on the wave evolution is investigated by using the large eddy simulation (LES) model. The instantaneous dam-break, namely, a dam-break without a gate, is simulated for comparison. A gate-opening criterion for generating dam-break flow in a non-rectangular wet-bed channel is proposed in this study, which can be used as an extension of the Lauber–Hager criterion and provides a more comprehensive and reasonable estimate of the gate opening time.

1. Introduction

Dam-break floods usually cause considerable economic and loss of life [1,2,3,4]. Due to its practical importance and difficulty for obtaining the field data, extensive studies on dam-break floods have been carried out using laboratory experiments, numerical simulation, and theoretical analysis [5,6,7,8,9,10]. The propagation of the dam-break wave is significantly affected by the cross-sectional shape of channels [7,11]. Wang et al. [12] conducted laboratory experiments to investigate the difference of dam-break wave evolution in both the rectangular and triangular channels. Their results showed that the propagation velocity of the negative wave in the triangular channels was smaller than that in the rectangular channels. When the ratio of initial downstream water depth over initial upstream water depth is smaller than 0.4, no extra negative waves propagate towards upstream in the triangular channel.
Dam failure time has a significant impact on the evolution of dam-break floods, such as frontal velocity and the free water surface. Lauber and Hager [13] experimentally investigated the dam-break flows in a horizontally smooth rectangular dry bed channel. They defined the gate-opening criterion time tLH for an instantaneous dam failure, as follows (referred to as the Lauber–Hager criterion in this paper):
t L H 2 h u / g
where hu = the initial upstream water depth, g = the gravitational acceleration. The Lauber–Hager criterion is widely adopted for simulating an instantaneous dam-break in the recent studies of dam-break flows [14,15,16,17,18,19,20]. Ye et al. [17] numerically simulated the influence of the moving gate on the dam-break flow. They showed that the gate movement had an important influence on the dam-break process, which cannot be ignored in the dam-break study. Even if the gate movement satisfies the Lauber–Hager criterion of an instantaneous dam-break, applying the gate movement to the numerical simulation of dam-break will produce a considerable difference compared with the no-gate situation. Von Häfen et al. [21] analyzed the effect of the gate-opening time based on the Lauber–Hager criterion on the dam-break flow in a rectangular dry bed channel. They found that the difference between the dam-break waves generated with and without a gate was significantly large near the dam. Such difference decreased with the increasing distance from the gate.
The shape of the channel cross-section and whether the downstream is wet-bed has a great influence on the opening time of the gate in the instantaneous dam-break. Zanuttigh and Lamberti [11] assumed the variation of the channel width as a power-law variation and investigated the effect of the cross-sectional shape on the dam-break wave propagation along channels. At the same relative flow depth difference, an increase in the power-law index results in a decrease in celerity, whereas both the velocity and the front speed increase. Wang et al. [22] established the analytical solution of the one-dimensional shallow water equations to simulate the instantaneous bank break flow under the triangular wet-bed. They also compared their solution with the known analytical solution of the rectangular channel. They found that with the changes in the ratio of dimensionless distance to time, the dimensionless depth in the triangular channel was larger than that in the rectangular channel.
The influence of gate motion on dam-break flow in rectangular and non-rectangular channels (taking a triangular channel as an example) is studied by numerical simulation in this paper. The downstream tailwater causes the displacement of the dam-break water flow to fall from the upstream is no longer simply the value of the upstream water depth. However, the Lauber–Hager criterion only considers the initial upstream water depth; it may not provide a gate opening time satisfying the requirement of instantaneous dam-break for the non-rectangular channels or initial downstream wet-bed. In order to make up for this deficiency, a new criterion is proposed to meet the instantaneous dam-break gate opening time of the non-rectangular wet-bed channels, which is the innovation of this article. At the same time, any test or numerical simulation that requires the use of a gate to simulate an instantaneous collapse process can refer to the standard proposed in this article.

2. New Criterion for the Gate Motion

The cross-section of the natural river channel is often non-rectangular, and tailwater usually exists downstream of a dam. In this paper, the cross-section of the non-rectangular channels is generalized as a trapezoidal section, and the rectangle and triangle are special trapezoids. As the widely used criterion of gate opening time for instantaneous dam-break (i.e., the Lauber–Hager criterion) was established for the rectangular channels with dry bed downstream, it is necessary to extend this criterion to non-rectangular channels and consider the influence of the downstream tailwater.
Assume that the direction indicated by the arrow in Figure 1 is the motion path of the upstream water falling into the downstream at the gate. It can be seen that this displacement is exactly the same in the rectangular channel. However, the size of the displacement in the trapezoidal channel is not the same, such as the domain of the red arrow in Figure 1b shows a linear change in its displacement. This displacement is characterized by the difference between the upstream and downstream average water depths in the present study. Using the initial static water depths upstream and downstream of the dam, a new gate-opening criterion time tnew for the channel with a non-rectangular cross-section is proposed as:
t n e w 2 Δ h / g
Δ h = h ¯ u h ¯ d = A u B u A d B d
where ∆h = the difference between the average water depths at upstream and downstream sections; h ¯ u = the average depth of upstream section; h ¯ d = the average depth of downstream section; Au and Ad = the cross-sectional areas of upstream and downstream water bodies, respectively; Bu and Bd = the initial upstream and downstream water surface widths, respectively. This new gate opening time will be used in the numerical simulation to compare with the results obtained by using instantaneous dam failure and the Lauber–Hager criterion.

3. Numerical Model

3.1. Governing Equations

The FLOW-3D [23] has been widely used in hydrodynamic calculations [24,25] and dam-break wave simulations [26,27]. FLOW-3D uses the complete Navier-Stokes equations to simulate the fluid motion. The governing equations are:
( u i A i ) x i = 0
u i t + 1 V F u j A j u j x j = 1 ρ P x i + G i + f i
where ui and uj = the mean velocity components in the orthogonal Cartesian coordinates; ρ and P = the fluid density and the pressure; Ai and Aj = the fractional areas open to flow in three orthogonal Cartesian coordinates; VF, Gi and fi = the fractional volume open to flow, the body accelerations and the viscous accelerations in x, y and z directions, respectively.

3.2. Turbulence Modeling

Previous studies [28,29,30] show that the large eddy simulation (LES) model can obtain more accurate results when applied to the simulation of the dam-break flow phenomenon. The LES directly solves large scales, and the small scales are modeled by a turbulence closure model. LES can provide a reliable prediction of the dam-break flow with reasonable computational time by eliminating the minimum turbulence length scale.
The filtering operation in LES can be implicit or explicit. The filter length represents the characteristic length of the grid size as Equation (6). In LES, sub-grid-scale closure is used to parameterize the effects of smaller-scale eddies. The Smagorinsky-type closure is the most commonly parameterized, and the sub-grid-scale stress tensor is parameterized as Equation (7) [31,32].
Δ = ( Δ x Δ y Δ z ) 1 / 3
τ i j 1 3 δ i j τ k k = 2 υ t S i j = 2 ( C s Δ ) 2 S i j S i j
where ∆x, ∆y and ∆z = the grid sizes in x, y and z directions; τij = the sub-grid stress tensor; δij = the Kronecker delta; υt = the sub-grid viscosity; Sij = strain rate tensor; S i j = the magnitude of the strain rate; and Cs = the Smagorinsky constant.
With the Tru-VOF [33] method, the value of empty cells is 0, the value of full cells is 1, and the value of cells containing free surfaces represents the ratio of fluid volume to cell volume. According to the volume ratio of fluid to cells and the position of fluid in surrounding cells, the water surface is then described as a first-order approximation. Using the Tru-VOF method, FLOW-3D [23] can track the free-form surfaces in time and space.

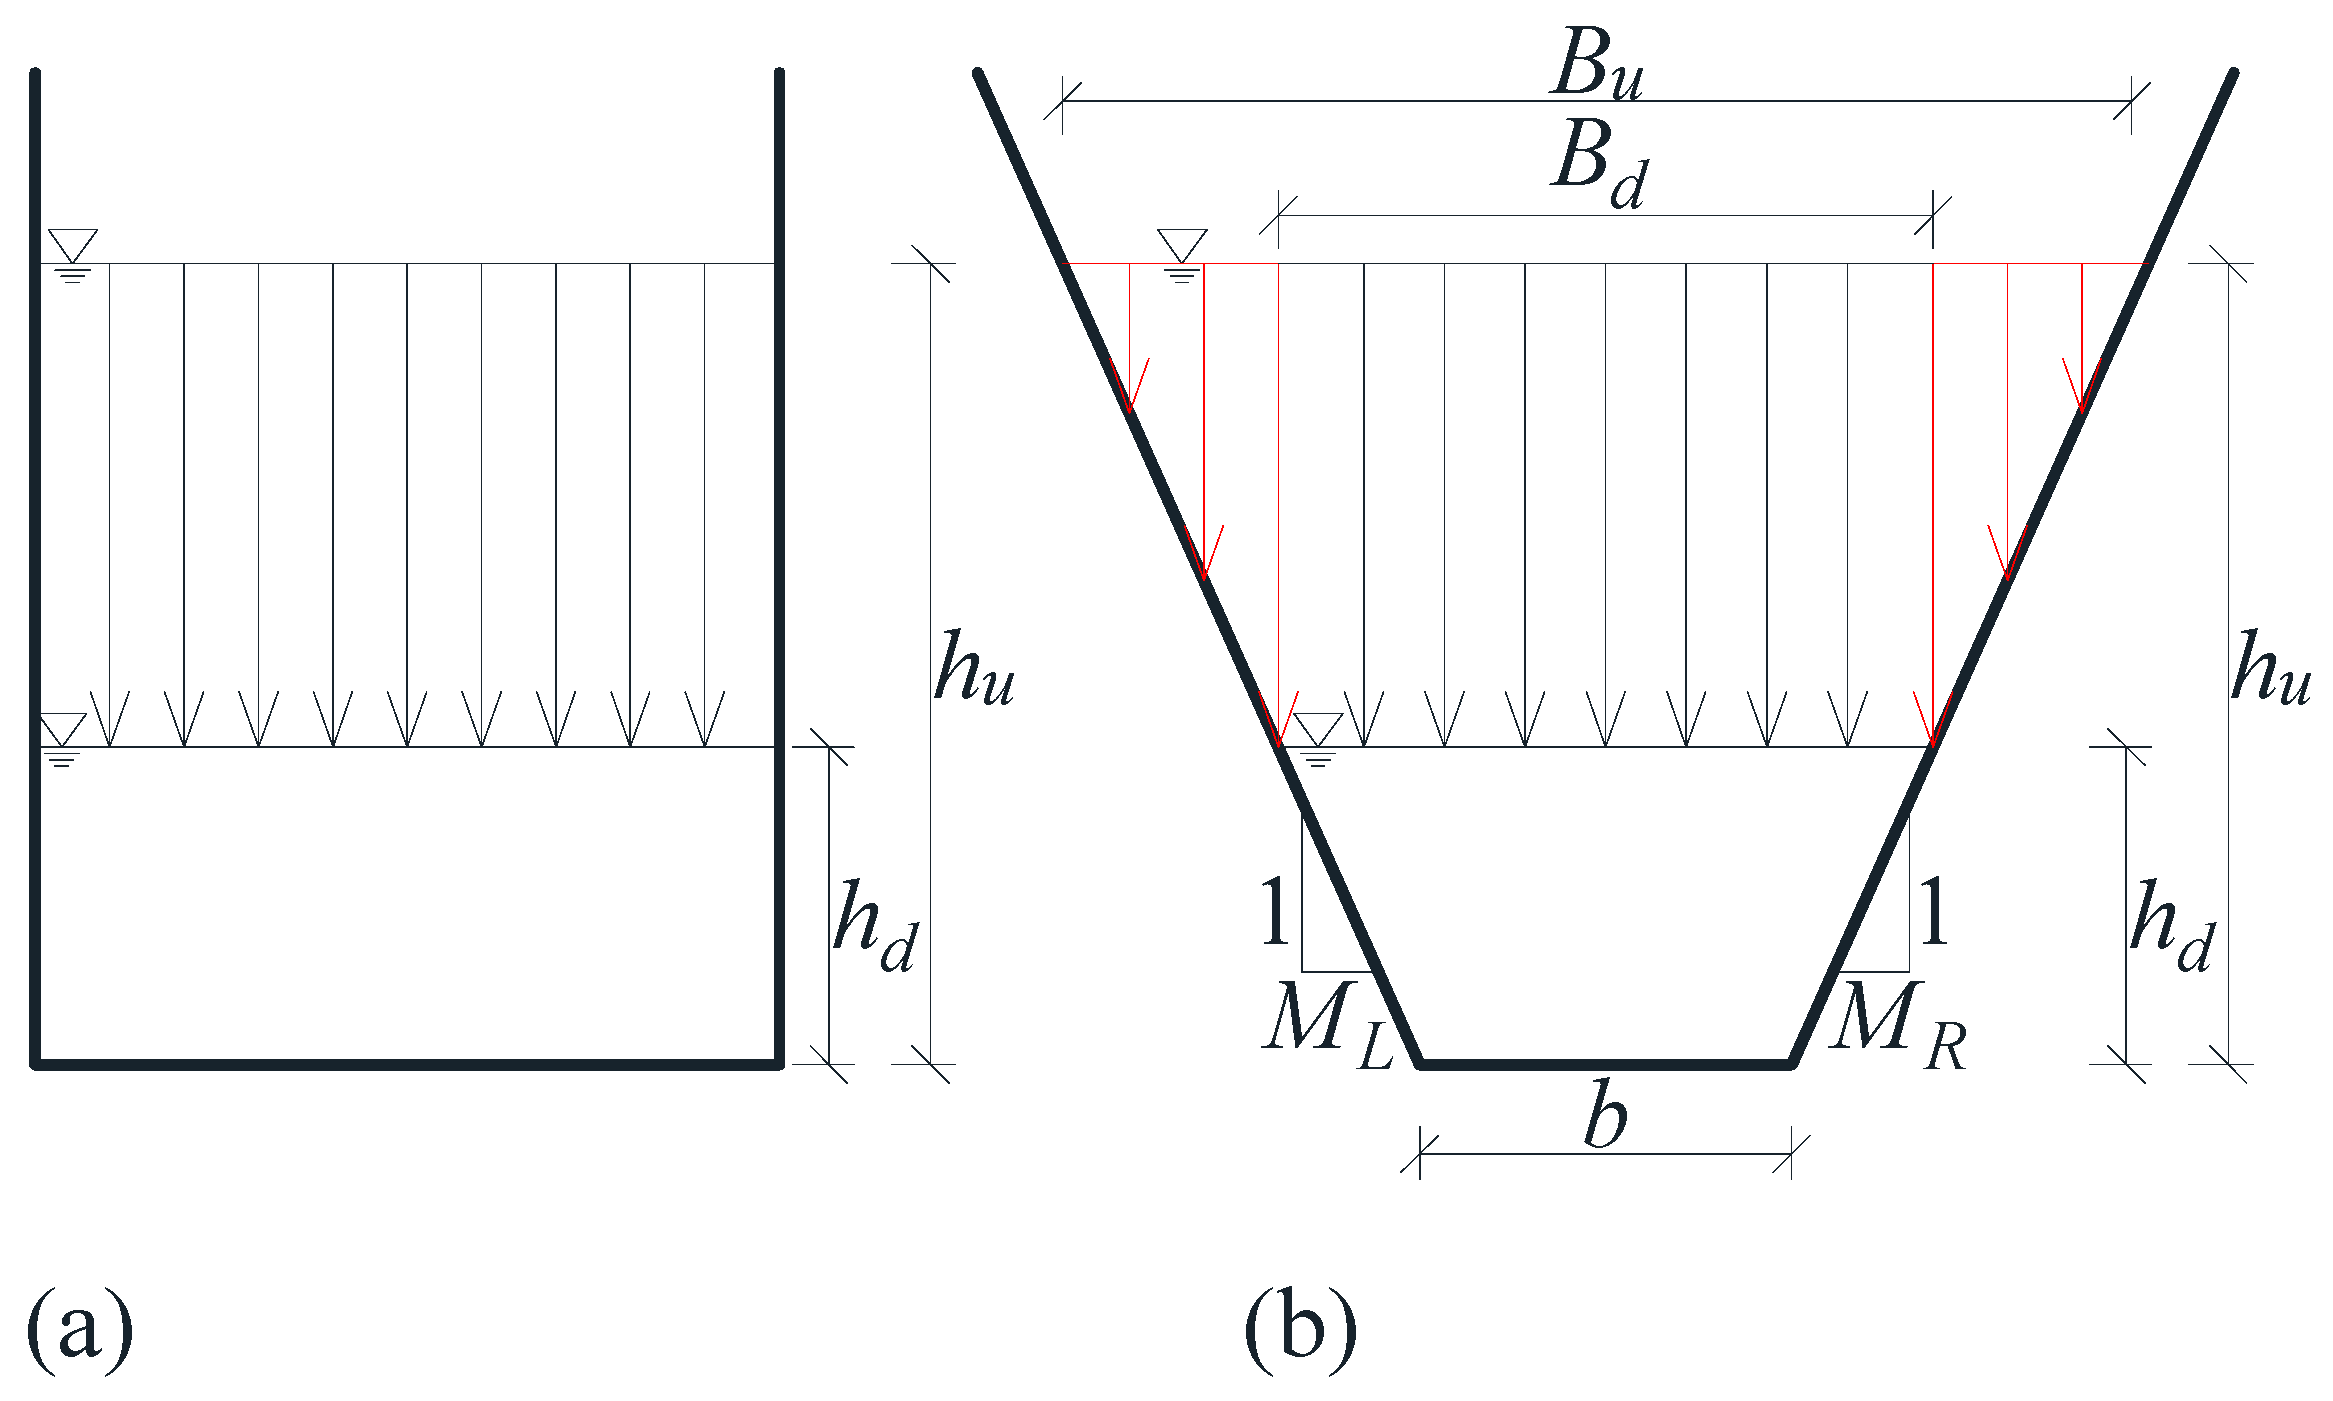
3.3. Computational Domain, Boundary, and Initial Conditions

Figure 2 is the sketch of the model for both the triangular and rectangular channels. The slope of one sidewall is 45°, and the other sidewall is vertical in the triangular channel. The dashed lines in the triangular and rectangular channels represent virtual wave gauges. As there is no fluid entering the reservoir, the upstream boundary is set as a wall. The downstream boundary is set to outflow because the downstream end of the channel remains open. The top boundary is set to symmetry to consider the atmospheric pressure on the free surface. The bottom boundary and the sidewall of the channel are taken as the wall. The tangential velocity and normal velocity at the solid boundary are zero, due to the no-slip condition. The calculation domain of the rectangular channel is −8.37 m to 9.63 m in the x direction, 0 m to 1 m in the y direction, and 0 m to 0.5 m in the z direction. The calculation domain of the triangular channel is the same as the rectangle in the x and z directions, and 0 m to 0.5 m in the y direction, as shown in Table 1. The computational domain is selected to ensure that the dam-break flow can be completely simulated with a reasonable computational cost. The initial upstream water level is 0.4 m, and the downstream water level is 0, 0.04, 0.08, 0.12 and 0.16 m (i.e., α = h d h u = 0, 0.1, 0.2, 0.3, and 0.4), respectively.

3.4. General Moving Objects

A gate is arranged at x = 0 m, and the General Moving Objects [34] model is used to simulate the gate motion. The gate is lifted with constant acceleration in z direction until the distance of gate displacement is greater than the upstream water depth. The gate acceleration, a is calculated as:
a = 2 h u t 0 2
where t0 = the gate opening time (i.e., tnew or tLH). For the tLH criterion, the opening time of the gate does not change with the downstream water depth, and a maintains as 9.81 m/s2 for both the rectangular and triangular channels. Each water depth ratio in the tnew criterion corresponds to a different gate opening time and different gate acceleration. Specifically, the gate acceleration a corresponding to the α of the triangular channels from 0 to 0.4 is 19.62, 21.80, 24.53, 28.03, and 32.70 m/s2, respectively; and the values of a corresponding to the rectangular channels from 0 to 0.4 are 9.81, 10.90, 12.26, 14.01 and 16.35 m/s2, respectively. It can be seen that for the same α value, the value of a in the triangular channels is twice as much as that in the rectangular channel.

3.5. Sensitivity of Grid Size

The sensitivity of grid size on the simulation accuracy is performed in the rectangular and triangular channels. FLOW-3D [23] uses a structured mesh to define cells, and the resolution is controlled by the value specified for the size of cells, the total cells, or the total of the cells specified in each of the coordinate directions.
Three grid sizes (i.e., ∆x = ∆y = ∆z 0.009 m, 0.02 m and 0.03 m) in the rectangular channel and three total of the cells specified in each of the coordinate directions in the triangular channel (i.e., (I) ∆x = 0.018 m, ∆y = 0.0125 m and ∆z = 0.01 m, (II) ∆x = 0.015 m, ∆y = 0.01 m and ∆z = 0.005 m, (III) ∆x = 0.015 m, ∆y = 0.0067 m and ∆z = 0.005 m), are used for analyzing the dependence of the simulation accuracy on the grid size. Finally, taking the computational time and the accuracy of the numerical simulation results into account, ∆x = ∆y = ∆z = 0.02 m is used as the grid sizes of the rectangular channels, and the corresponding number of grids is 1,125,000, as shown in Figure 3a; while set in (II) as the grid size of the triangular channels, the number of grids is 6 million, as shown in Figure 3b.

4. Results

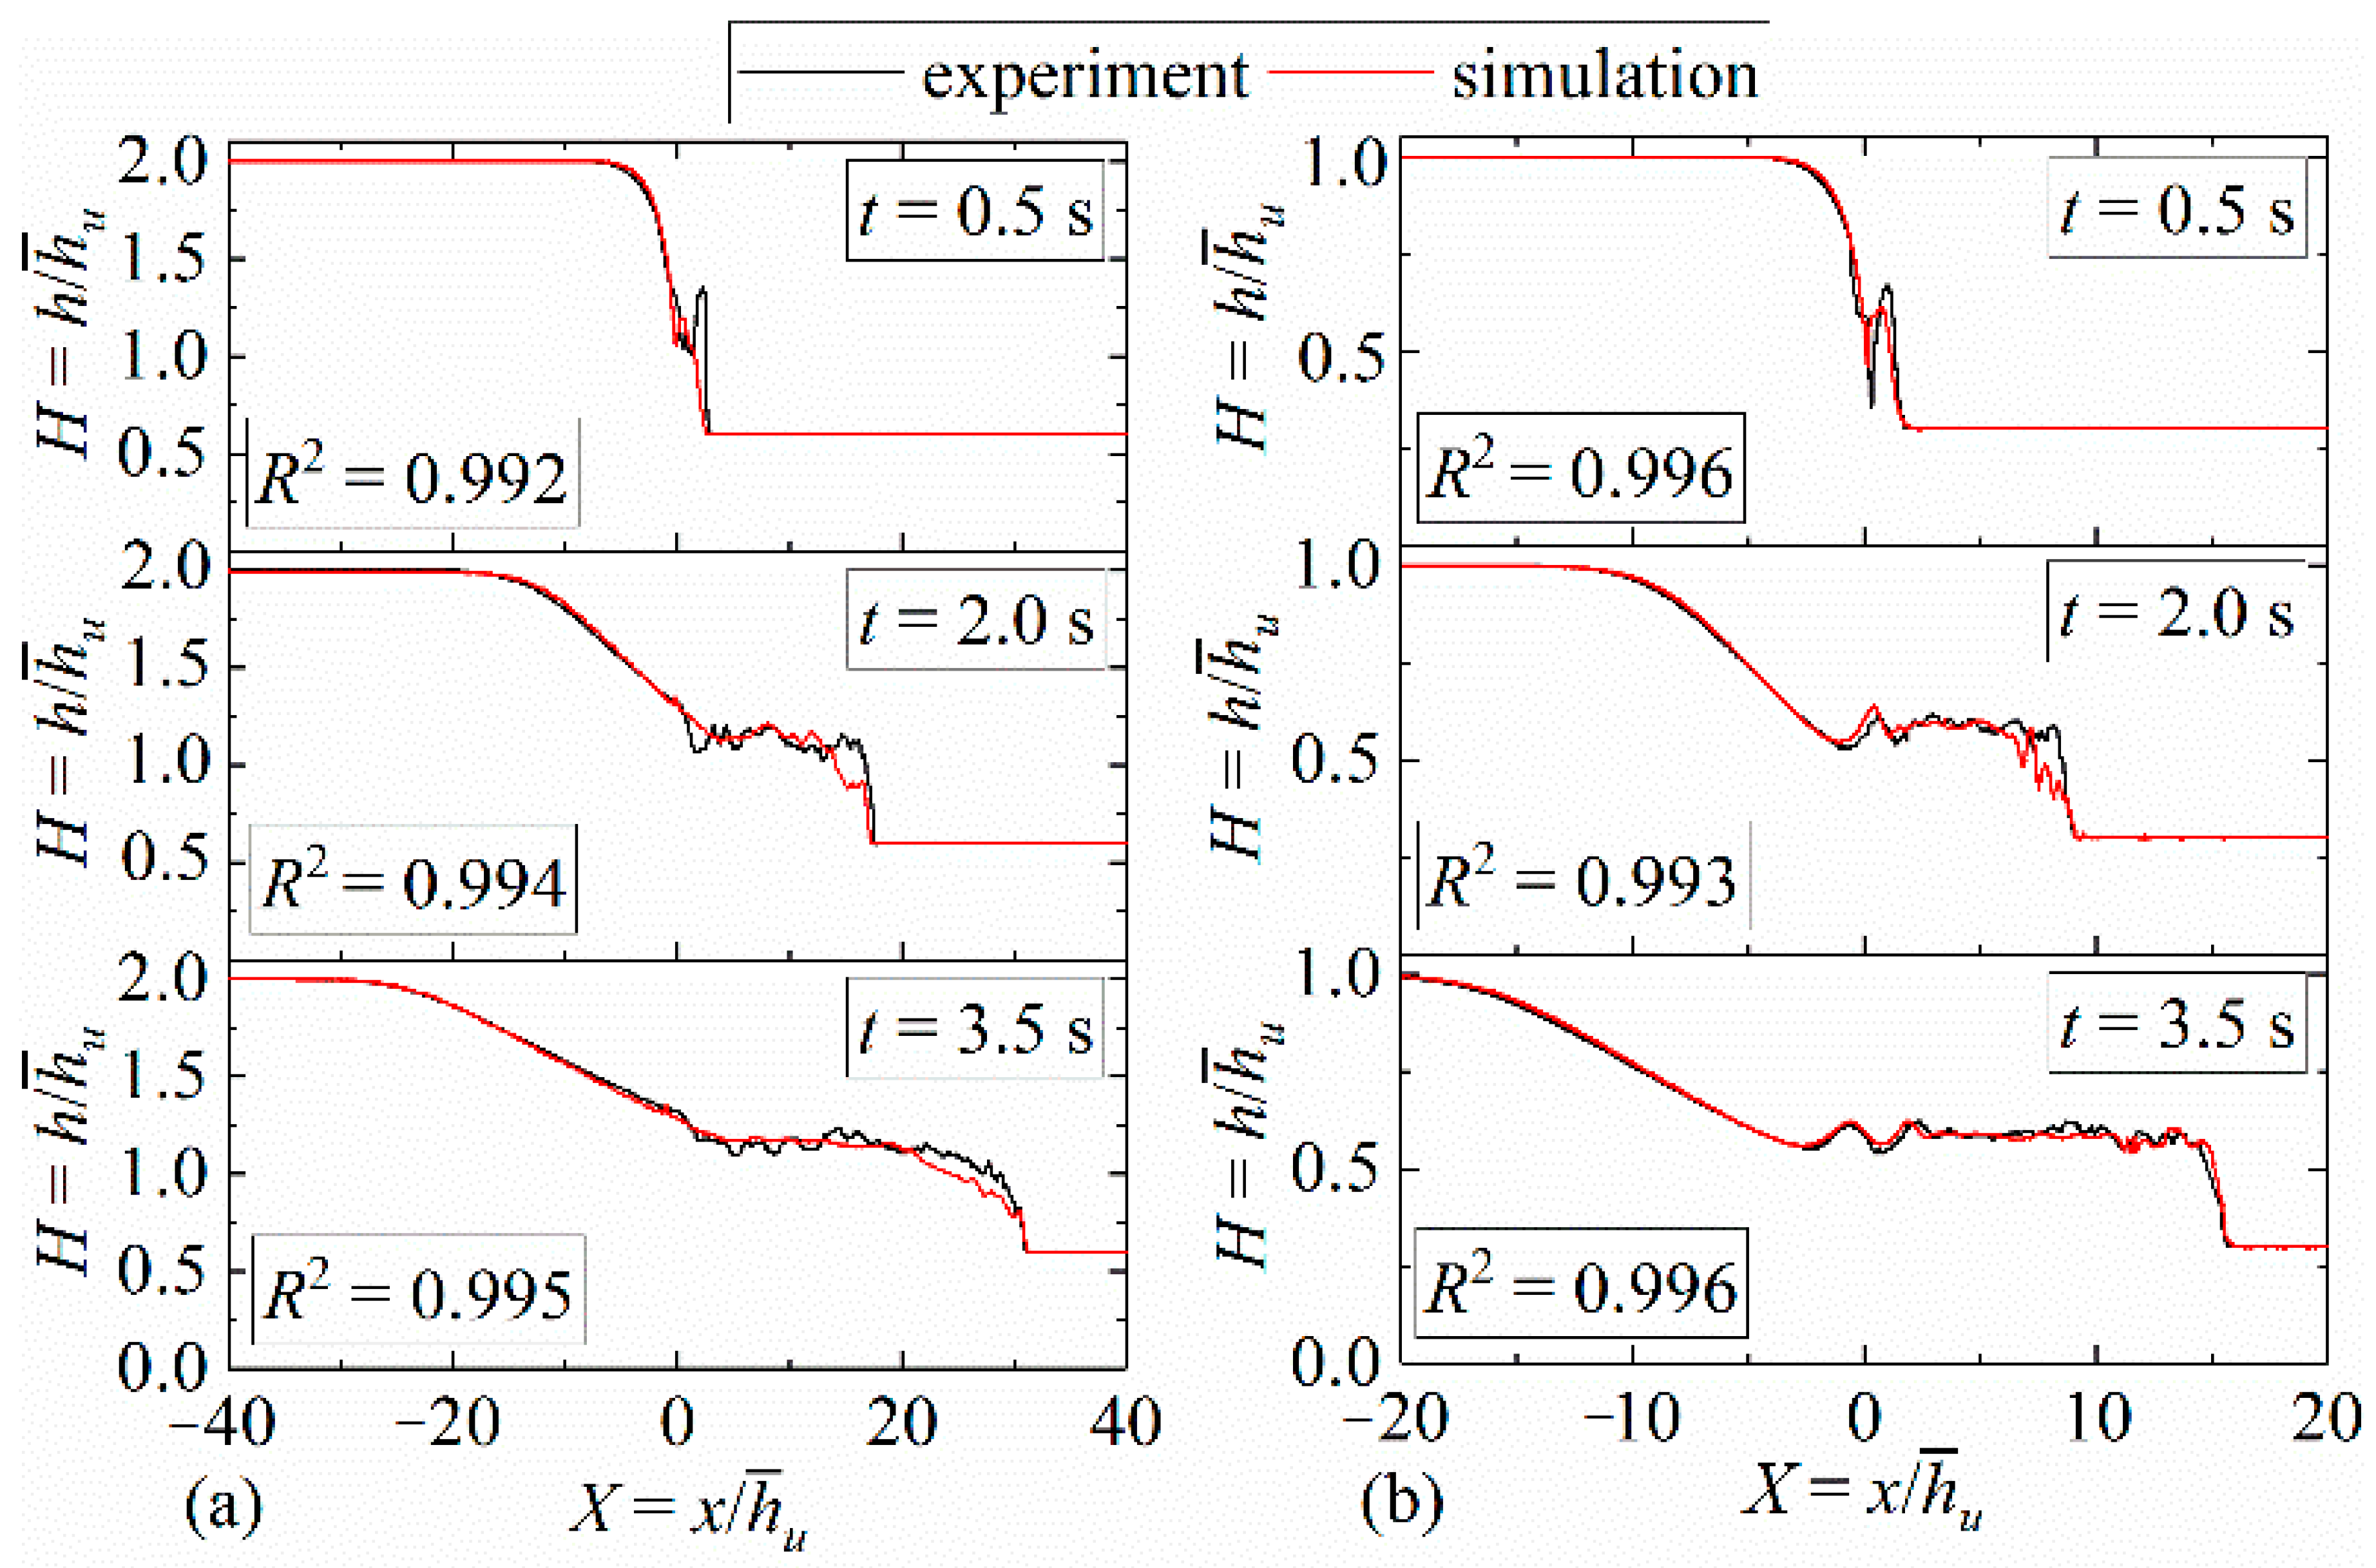
4.1. Model Validation

For validation, the numerical model has been applied to the dam-break cases of the rectangular and triangular channels under α = 0.3. The simulated water surface profiles along the channel are compared with the measurements of Wang et al. [12]. For the convenience of analysis, the following dimensionless hydraulic parameters are defined:
X = x / h ¯ u
T = t ( g / h ¯ u ) 1 / 2
H = h / h ¯ u
where t = time; x = the distance along flow direction originated from dam site; h = the water depth; X, T, and H = the dimensionless position, time, and water depth, respectively.
Figure 4 shows the comparison of simulated (red lines) and measured (black lines) water surface profiles at different times for triangular (Figure 4a) and rectangular (Figure 4b) channels, in which the determination coefficient R2 between the numerical and experimental results is determined using the following expression:
R 2 = 1 i = 1 n ( h s h m ) 2 i = 1 n ( h s h ¯ m ) 2
where hs = the simulated water depth, hm = the measured water depth, h ¯ m = the measured average water depth. It is seen that the simulated water surface profiles agree well with the measurements for both the triangular and rectangular channels, indicating that the numerical model can accurately simulate the propagation of dam-break waves.

4.2. Water Depth at Fixed Position

The pattern of dam-break flows varies along the channel. Figure 5 shows the stage hydrographs of the dam-break water flow at different positions based on two opening times (i.e., tnew and tLH). The initial condition for the rectangular channel is the same as that for the triangular channel. The case of the instantaneous dam-break without a gate is plotted in Figure 4 for comparison. The instantaneous dam-break shows that the reservoir water immediately collapses at the start of the simulation. Rapid change of water surface in the reservoir and the downstream reach is seen. It can be seen from Figure 4 that the instantaneous dam-break flow (i.e., without gate) is faster than that with tnew, while the dam-break flow using tnew is faster than that using tLH. Figure 5 also reveals that the dam-break flow during each gate opening time has different phase phenomena in the propagation of the dam-break wave. Additionally, the water surface within the reservoir fluctuates weakly, while strong fluctuation of water surface is observed to occur at the downstream reach.

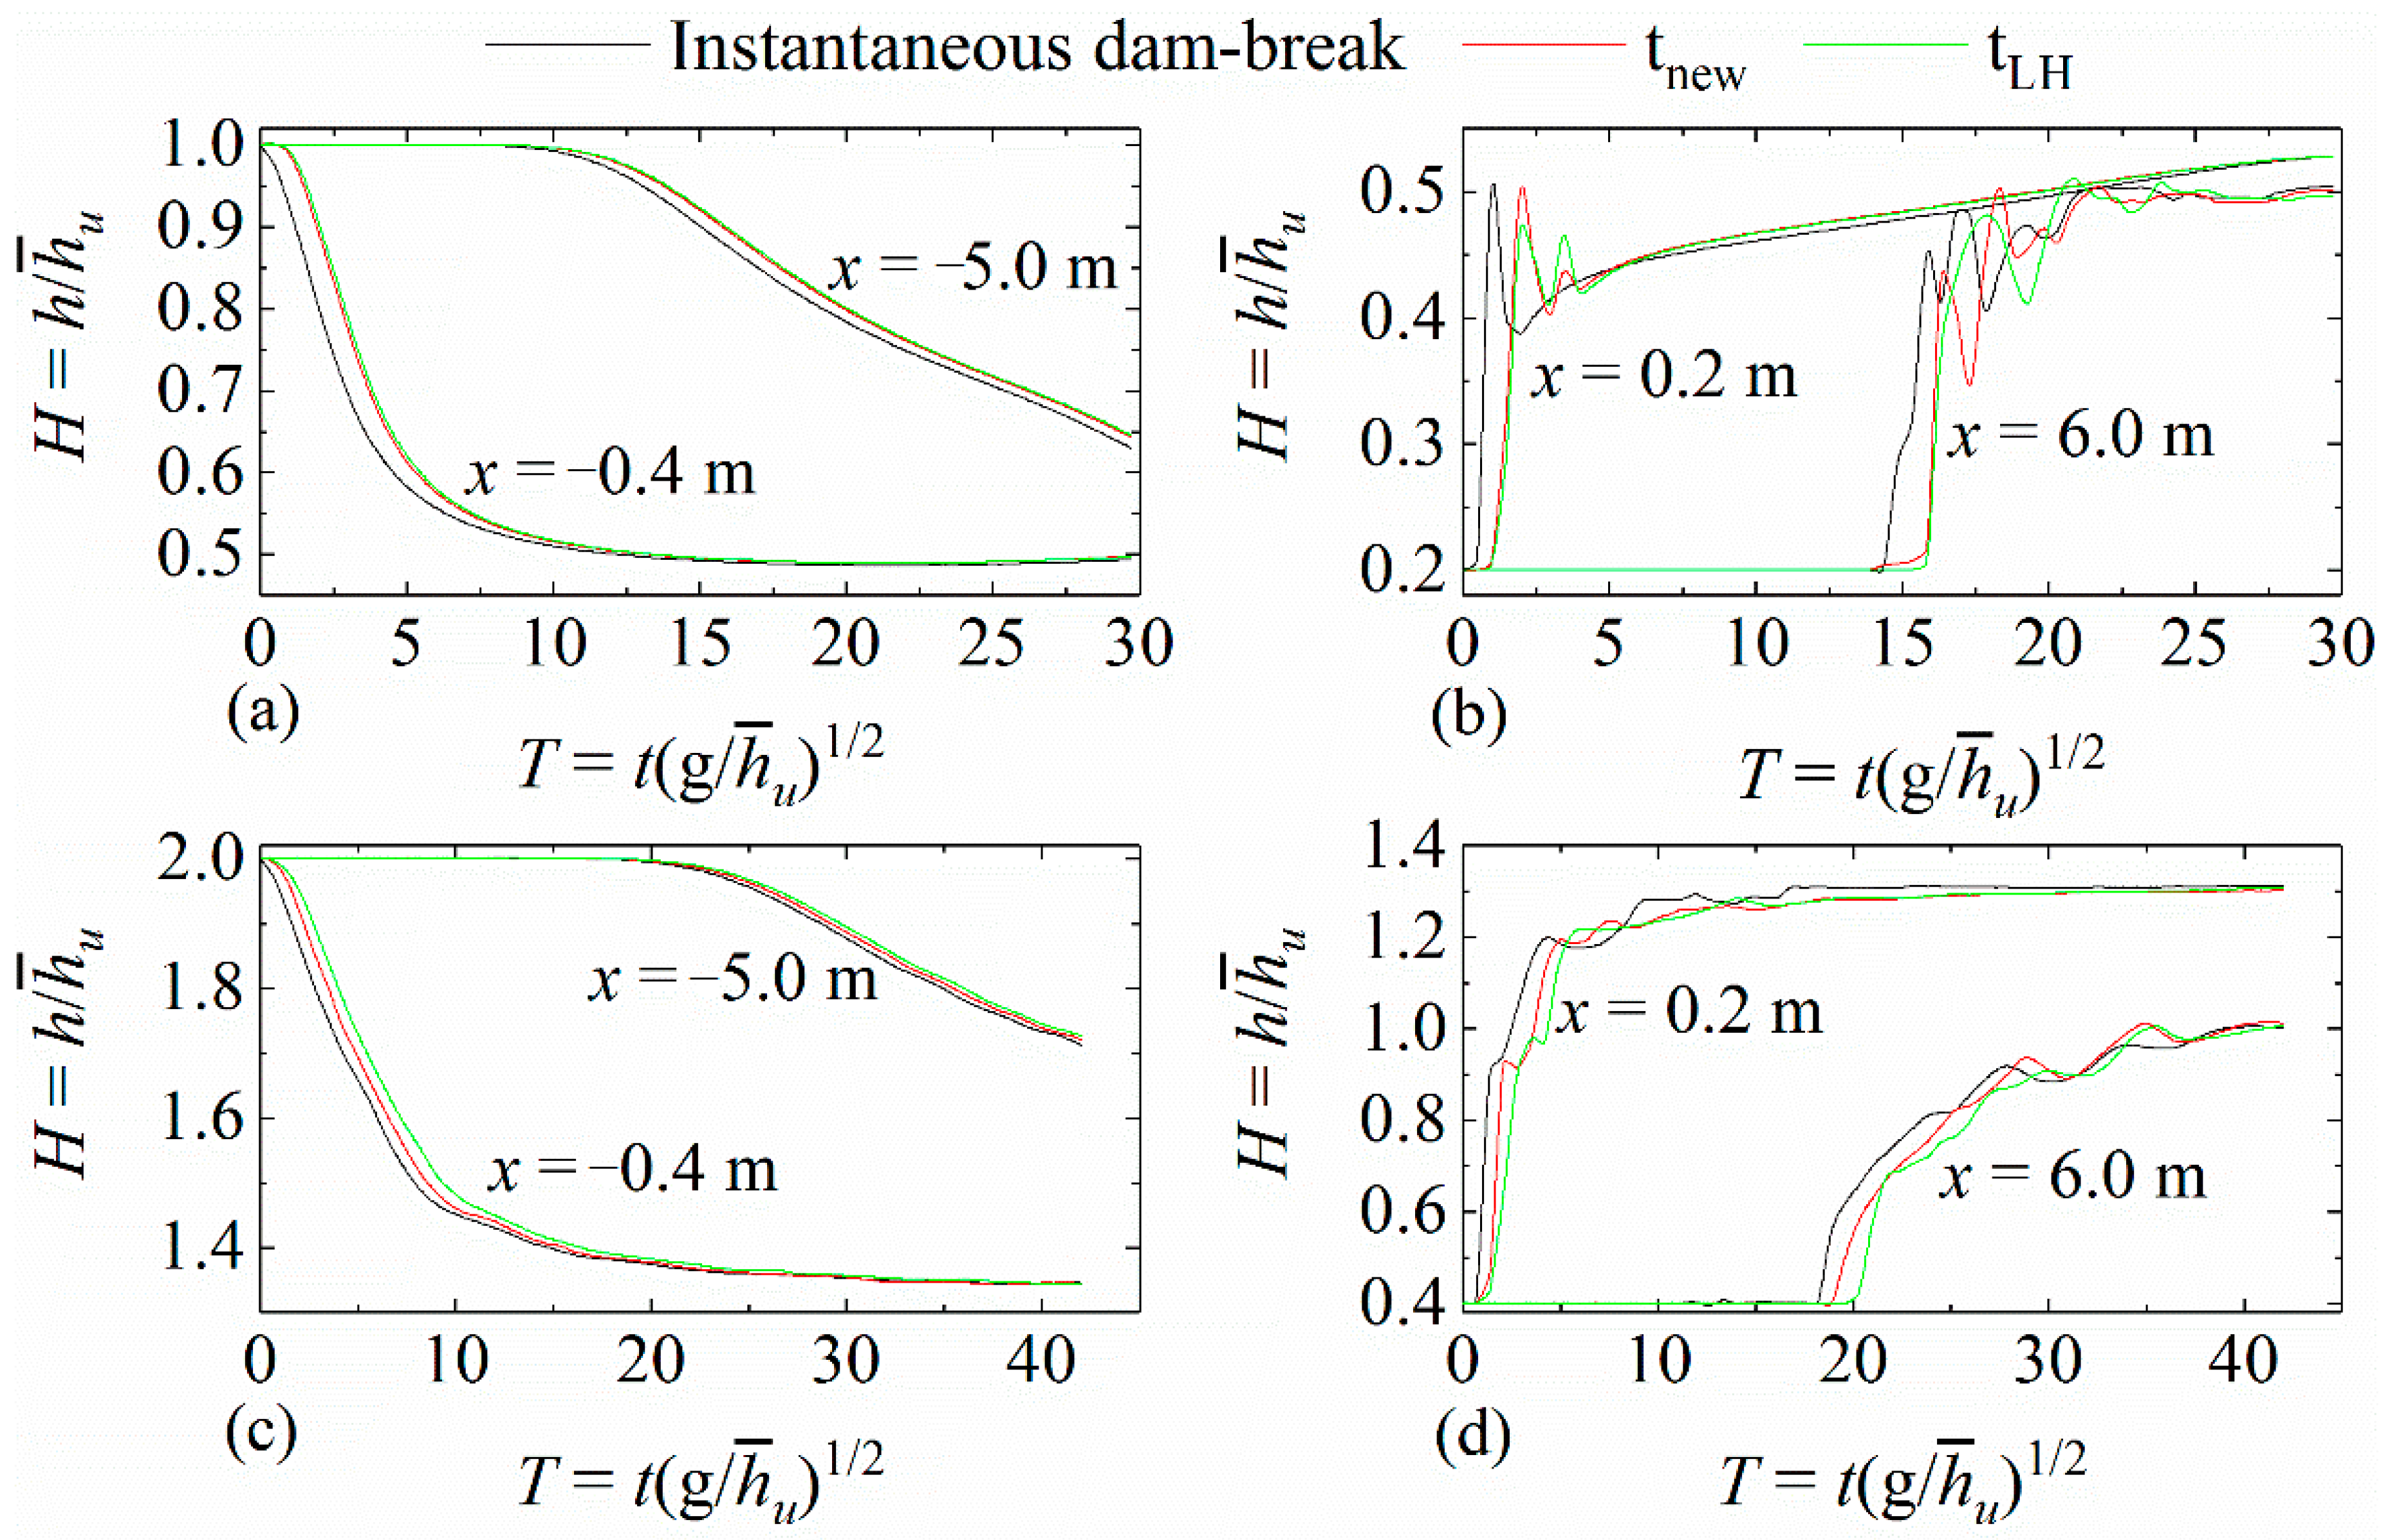
4.3. Influence of the Gate Motion

This section focuses on the error evolution between dam-break with gate and instantaneous dam-break. The relative root mean square errors (RRMSE) between instantaneous dam-break and numerical test (with gate) are used:
R R M S E = 1 h ¯ u i = 1 n ( h w g h n g ) 2 n
where hwg = the water depth with gate; hng = the water depth without gate; n = the number of samples. Two types of RRMSE (i.e., RRMSEx and RRMSEt) are used based on its variation with either distance or time. The RRMSEx is a mean error over time and is calculated along the x-axis at the locations of virtual probes presented in Figure 2 i.e., x = −8.37, −8.0, −7.0, −6.0, −5.0, −4.0, −3.0, −2.0, −1.0, −0.8, −0.6, −0.4, −0.2, 0, 0.2, 0.4, 0.6, 0.8, 1.0, 2.0, 3.0, 4.0, 5.0, 6.0, 7.0, 8.0, 9.0, 9.63 m. The RRMSEt is a mean error over the channel length and calculated using the water surfaces along the channel at a series of moments.
Figure 6 and Figure 7 show the evolution of the RRMSE of the triangle (the left column) and the rectangle (the right column) with the x-axis and time. Due to limited space, this article selects α = 0, 0.2, and 0.4 as examples for analysis. For the dry bed conditions, as expected, RRMSEx reaches the maximum near the gate and decreases with the increase of the distance away from the gate. RRMSEt has a sharp increase and significantly decreases at the early stage of dam-break, which may be caused by the interaction between the gate and the water flow. RRMSEt then gradually decreases with the time, because the fully open gate does not affect the flow longer at the later stage of dam-break. This finding is consistent with that obtained by Von Häfen et al. [21] for the rectangular channel with a dry-bed condition. In their paper, the upstream water depth hu = 0.5 m, according to the above formula, the gate opening time is 0.2822 s, and the gate acceleration a = 12.5568 m/s2. In our study, the upstream water depth hu = 0.4 m, the corresponding gate opening time is 0.2855 s, and the gate acceleration a is 9.8147 m/s2. Therefore, in Figure 6d and Figure 7d, the results of Von Häfen et al. [21] are slightly lower than those of this paper. The RRMSE corresponding to the tnew standard is less than that corresponding to the tLH for the dry bed condition of the triangular channel.
For the wet-bed conditions, RRMSEx reaches the maximum near the gate and decreases with the increase in the distance from the gate for both the triangular and rectangular flume. It is seen that RRMSEx corresponding to different gate opening times has a small difference in the upstream, and the downstream RRMSEx is generally larger than the upstream RRMSEx. RRMSEt has a sharp increase at the initial stage in which the removal of the gate takes place and gradually decreases with the time when the gate no longer affects the dam-break flow. Some slight fluctuations of RRMSEt are observed, resulting from the interaction of the initial downstream water and the dam-break flow released from the reservoir.
For the same initial conditions, the difference of RRMSE between the tnew criterion and the Lauber–Hager criterion of the triangular channel is larger than that of the rectangular channel. It can be concluded that the advantage of the tnew criterion in the triangular channel is more significant under the same conditions. The difference between the results associated with the two gate-opening times (i.e., tnew and tLH) becomes larger with increasing the value of α. This demonstrates that tnew criterion is required to define the instantaneous dam-break for a non-rectangular channel. From Figure 6 and Figure 7, we can see that under the condition of the triangular channel with wet-bed, the new criterion proposed in this paper significantly differs from the Lauber–Hager criterion, implying the requirement for the new gate opening time criterion, as well as the novelty of this work.

4.4. Wave Front Velocity

The wave front velocity represents the speed at which the dam-break flood wave reaches a certain downstream section. The wave velocity is normalized using the following formula:
C s = s g h ¯ u
where Cs = the dimensionless wave front velocity; s = the mean wave velocity, which is calculated by the formula s = x/t, where x is the distance of wave propagation, and t is the time required for the wave to travel to x.
Figure 8 shows the wave front velocity against the dimensionless time T. For both the triangular and the rectangular channels, take α = 0.3 and hu = 0.4 m as an example. Figure 8a,b, respectively, represent dimensionless wave front velocities of the rectangular and the triangular channels. It can be seen that the evolution speed of the dam-break flood waves also increases with the increase of the gate opening speed for both the rectangular and the triangular channels. It can also be seen from Figure 8a,b that, under the same initial conditions(i.e., α = 0.3 and hu = 0.4 m), the rectangular channel is less affected by the opening of the gate, but the opening time of the gate in the triangle has a greater impact on the flood wave of dam-break. In the triangular channel, the gate has an obvious blocking effect on the flow of dam-break.

5. Discussion

The Lauber–Hager criterion can well define the instantaneous dam-break for the rectangular dry bed and is not applicable for defining the dam-break flow with non-rectangular or/and initial wet-bed channel. A rectangular channel and a 45° right triangle channel at different gate opening velocities (i.e., tnew and tLH) and their effects on dam-break waves are investigated in this study. Comparing with the Lauber–Hager criterion, the simulation results of the tnew criterion are closer to instantaneous dam-break. Especially when the water depth ratio increases gradually and the channel cross-section shape is non-rectangular, the tnew criterion can reduce the influence of gate on dam-break wave. The water depth ratio simulated in this study is from 0 to 0.4 with a triangular channel. Further study is required for the water depth ratio being greater than 0.4 and the cross-section of the channel being other shapes.
The influence of the upstream initial water depth on the dam-break wave is yet to be investigated because it has been kept constant in this study. Theoretically, the larger the initial water depth in the upstream, the greater the impact of the gate on the dam-break wave. However, the specific quantitative impact needs to be studied in more detail.
This research mainly focuses on the instantaneous dam-break that collapses quickly. The study reveals that the effect of the failure geometries and failure time on the dam-break flood is different. Therefore, the influence of the failure geometries can be considered in the study of the gradual collapse of earth-rock dams and barrier dams, providing a better solution for the emergency rescue.

6. Conclusions

Currently, the practice of evaluating the influence of gate on a dam-break wave is based on the study by Lauber and Hager [13] in the rectangular dry bed channel. To extend the work of Lauber and Hager [13], a new criterion of gate-opening time is proposed in this study for generating dam-break waves in a non-rectangular channel with downstream wet-bed conditions. This new criterion provides a reasonable determination of the gate-opening time. As an example, the influence of gate-opening time on the propagation of the dam-break wave in the rectangular and triangular channels is analyzed by using LES. Through the numerical simulations on the dam-break flows for several scenarios, the water surface profiles along the channel and stage hydrographs at several positions are obtained, and the wave front velocities of dam-break under various gate opening times are also obtained. The following conclusions are drawn:
(1)
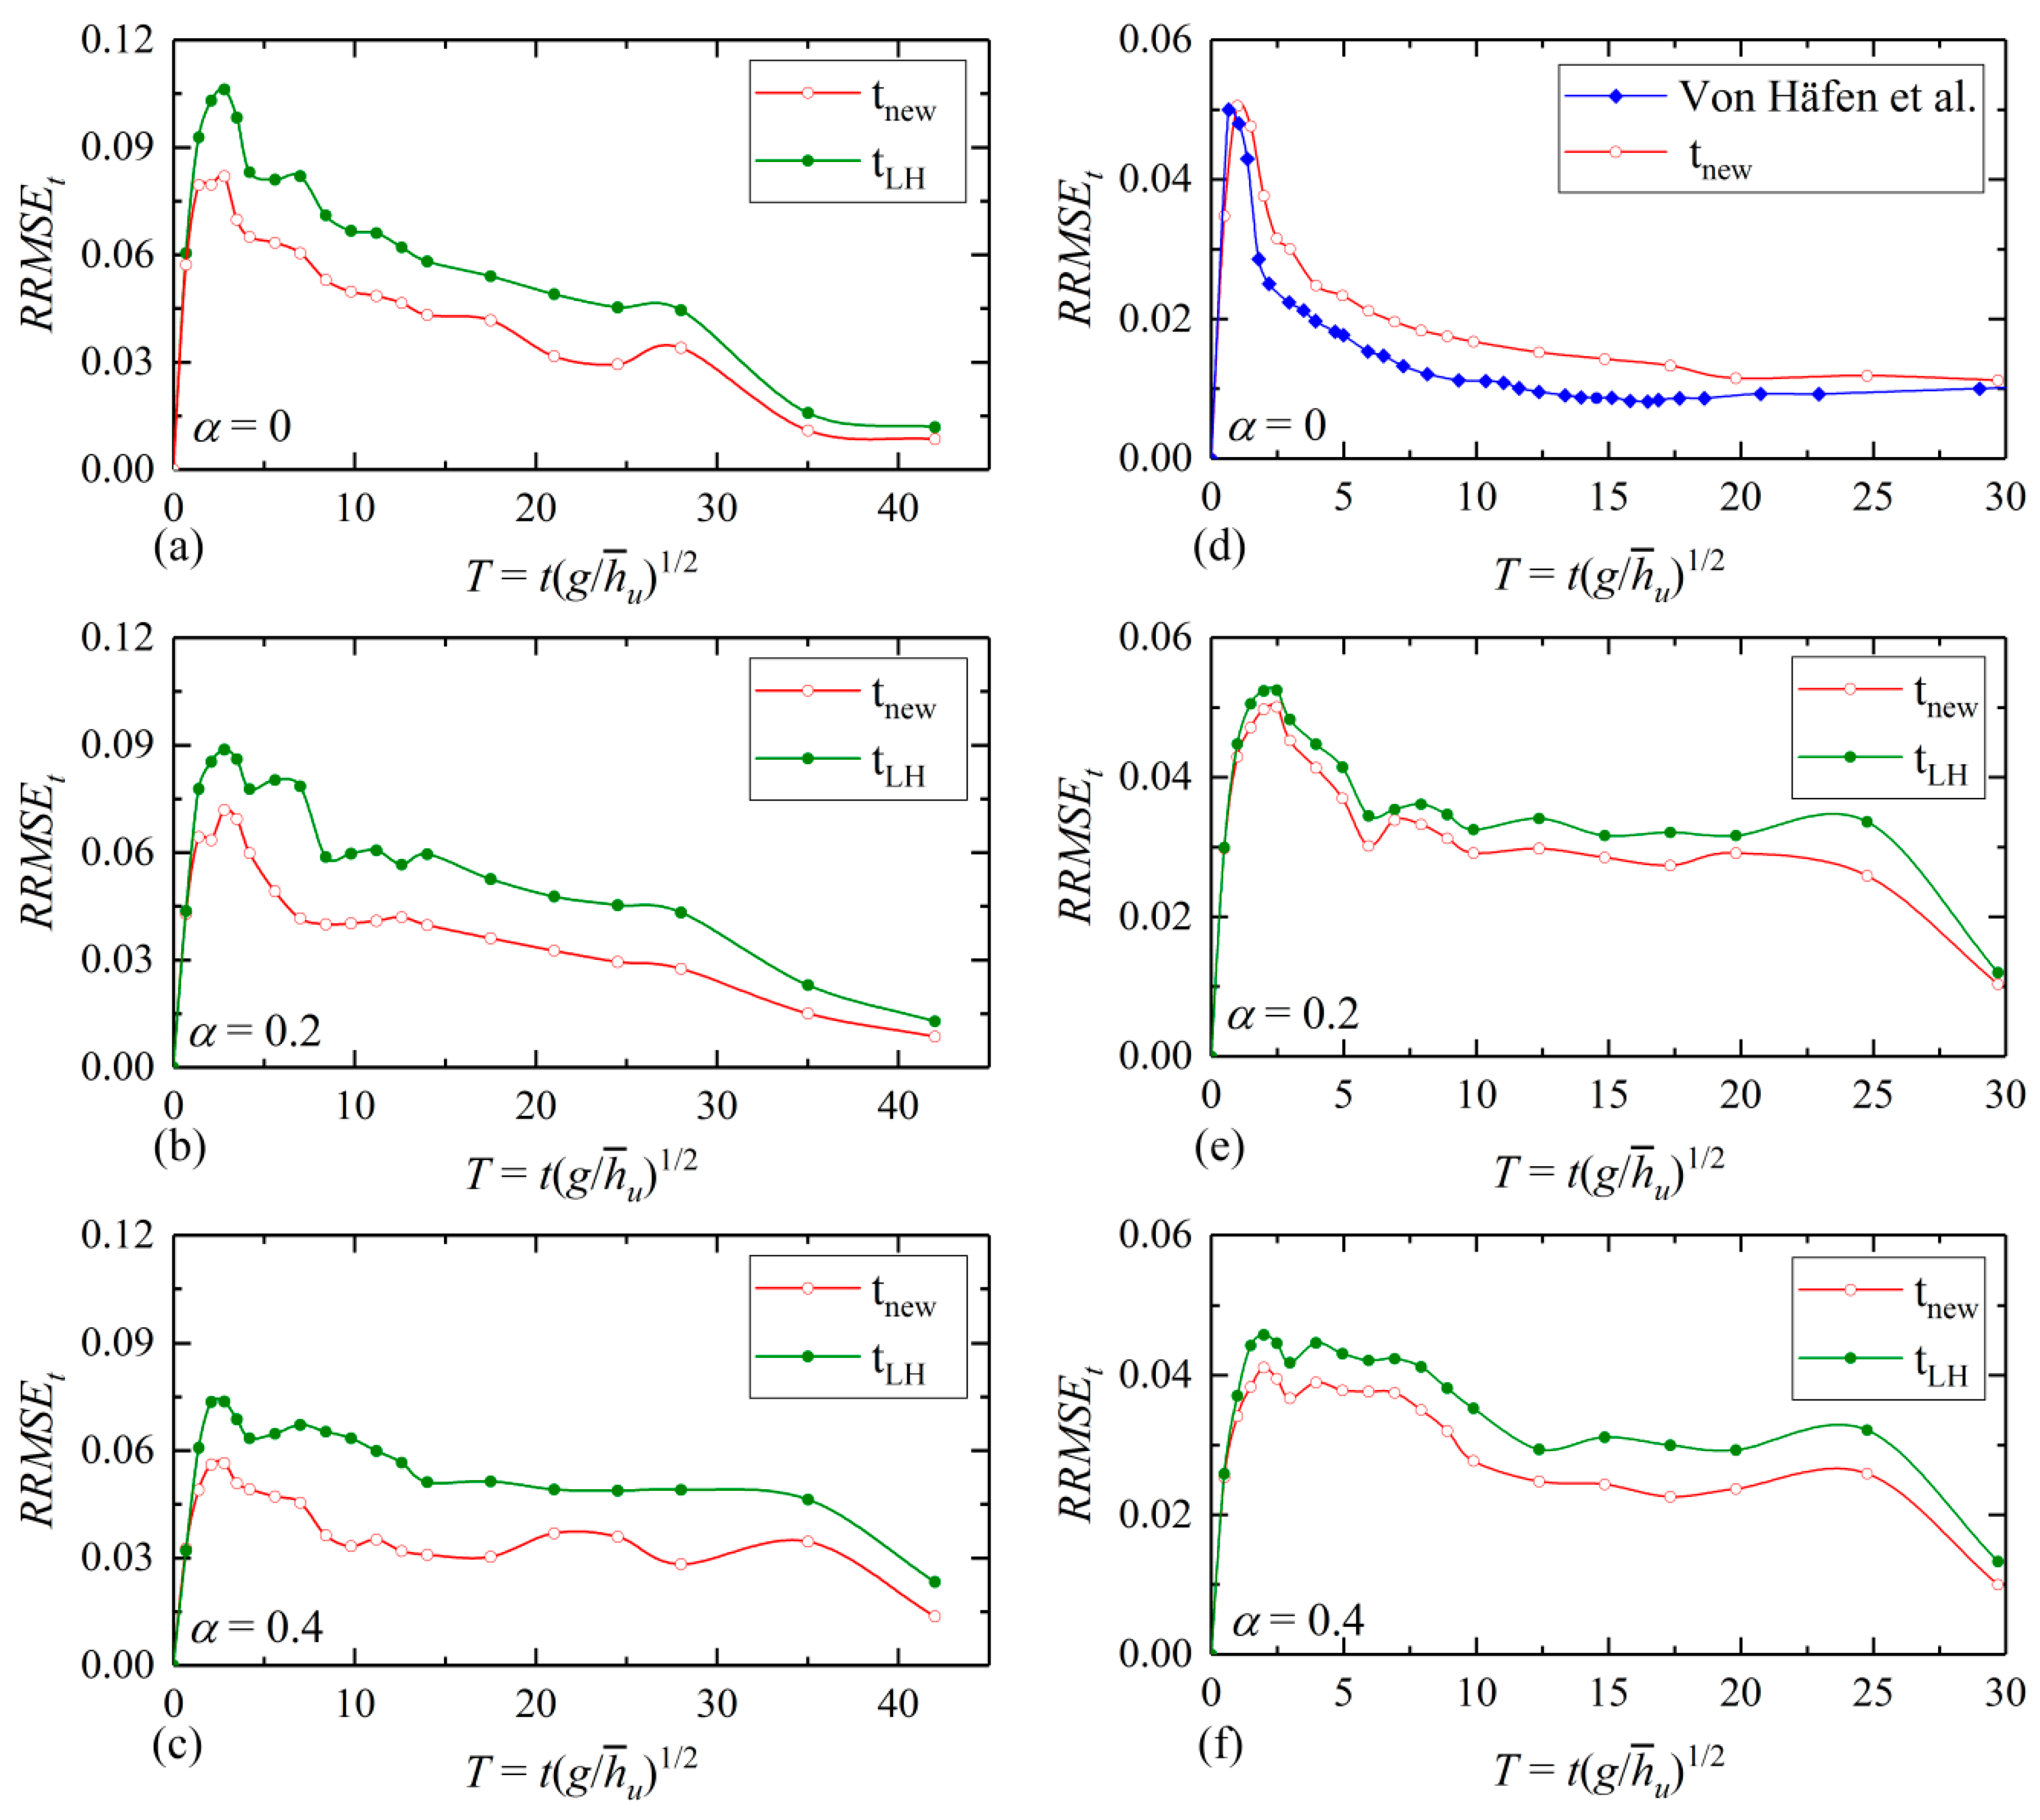
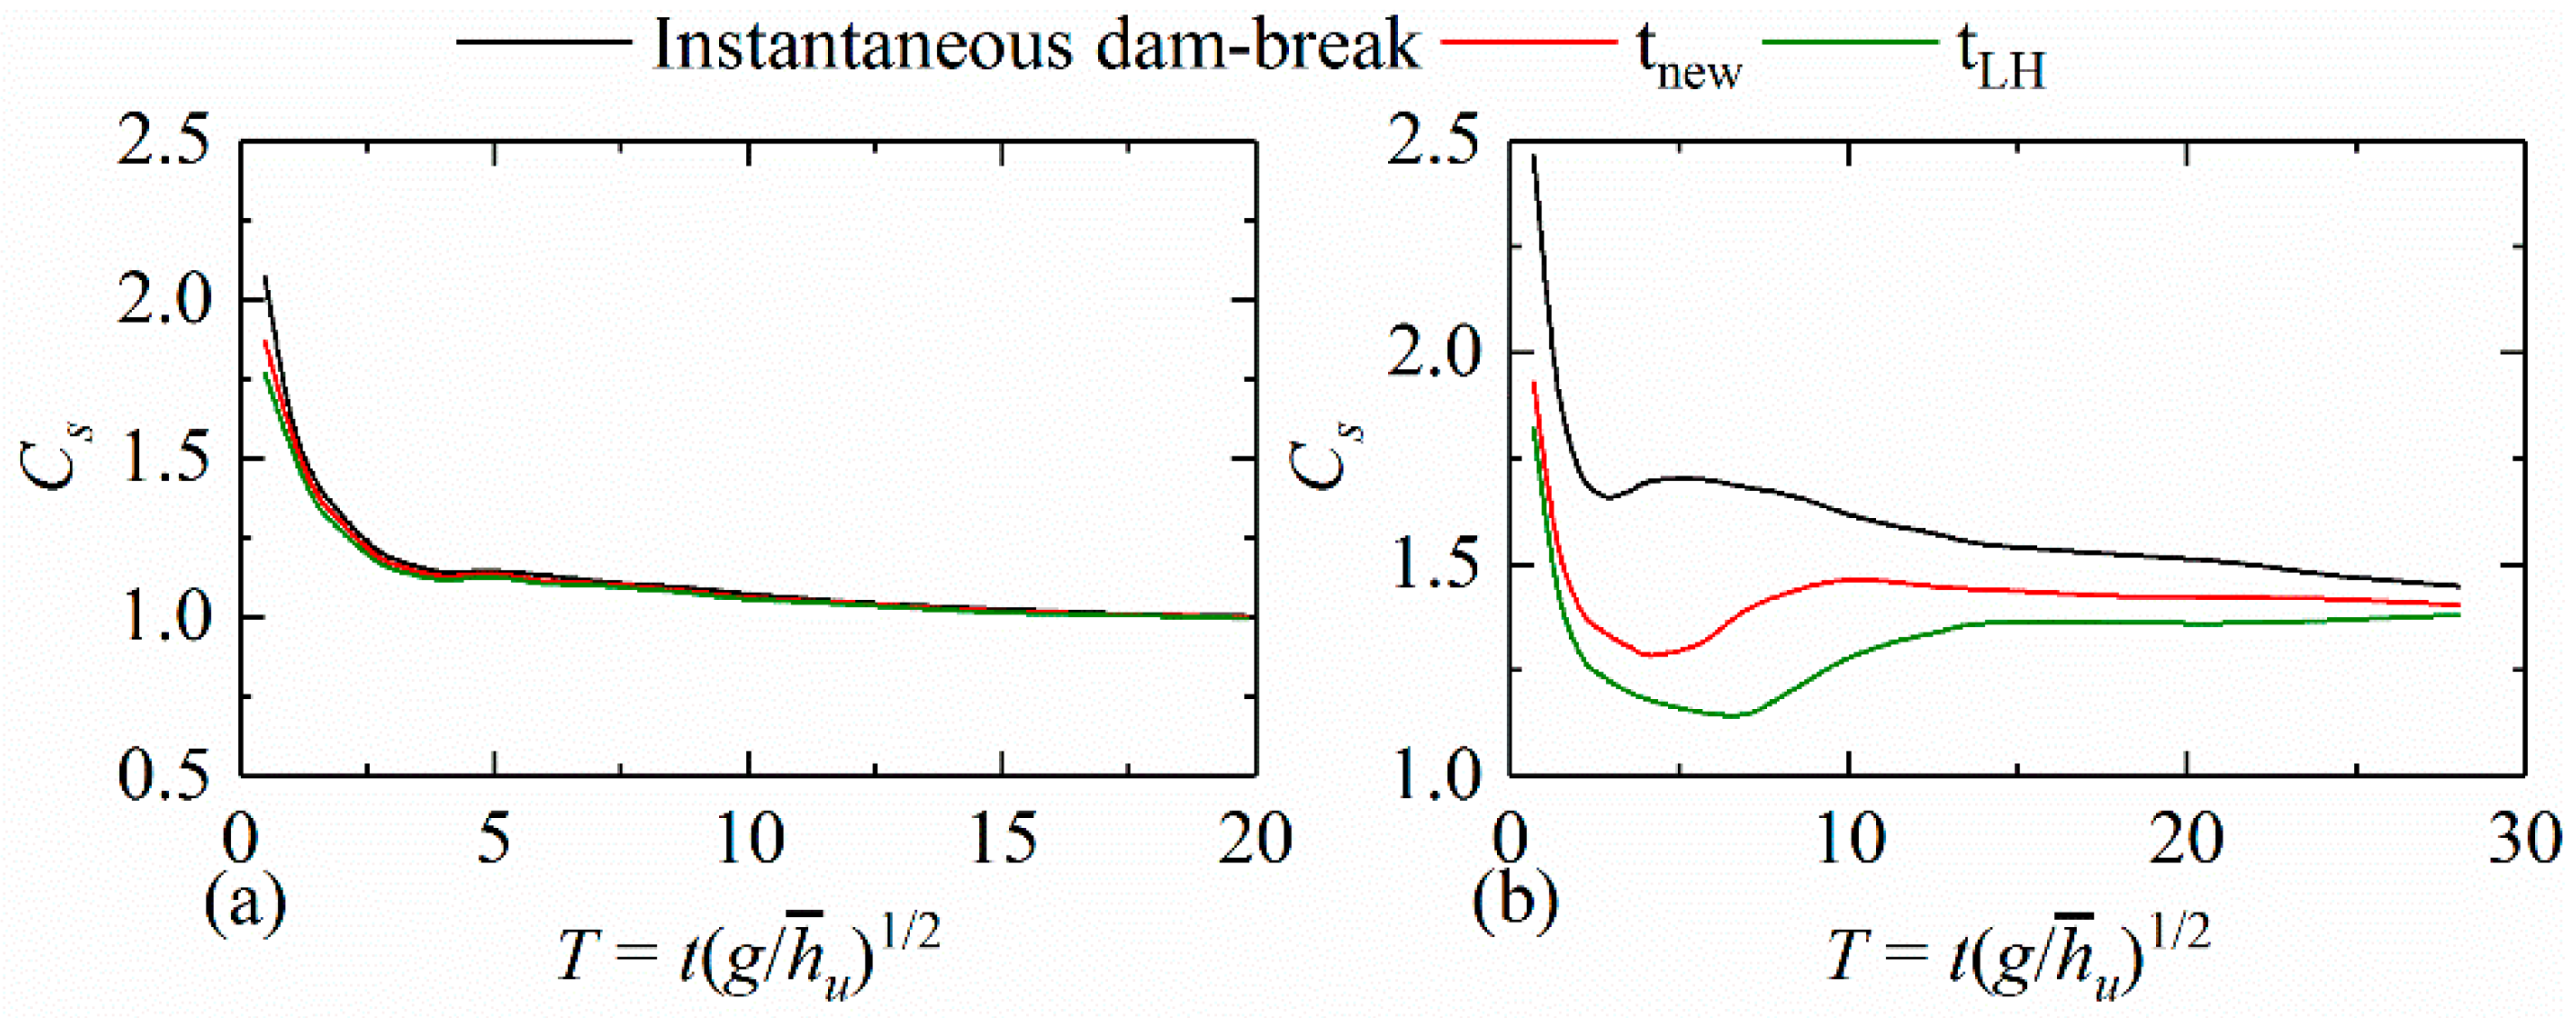
In the triangular channel, the dam-break simulated by removing a gate with the proposed criterion time (i.e., Equation (2)) approximates the instantaneous dam-break better than the Lauber–Hager criterion time. In particular, the Lauber–Hager criterion is invalid for generating the dam-break flow in wet-bed channels. The gate-opening time adopted in the laboratory facility should be determined based on the channel cross-sectional shape and the downstream/upstream water depth ratio.
(2)
At the initial stage of dam-break, the wave front velocity under the influence of the gate is much smaller than that of the instantaneous dam-break. This means that the gate has a great blocking effect on the dam-break flood. For the same condition, the opening time of the triangular channel is significantly affected by the gate compared with the rectangular channel. In non-rectangular channels, even if the gate is opened quickly, the influence of the gate cannot be ignored.
(3)
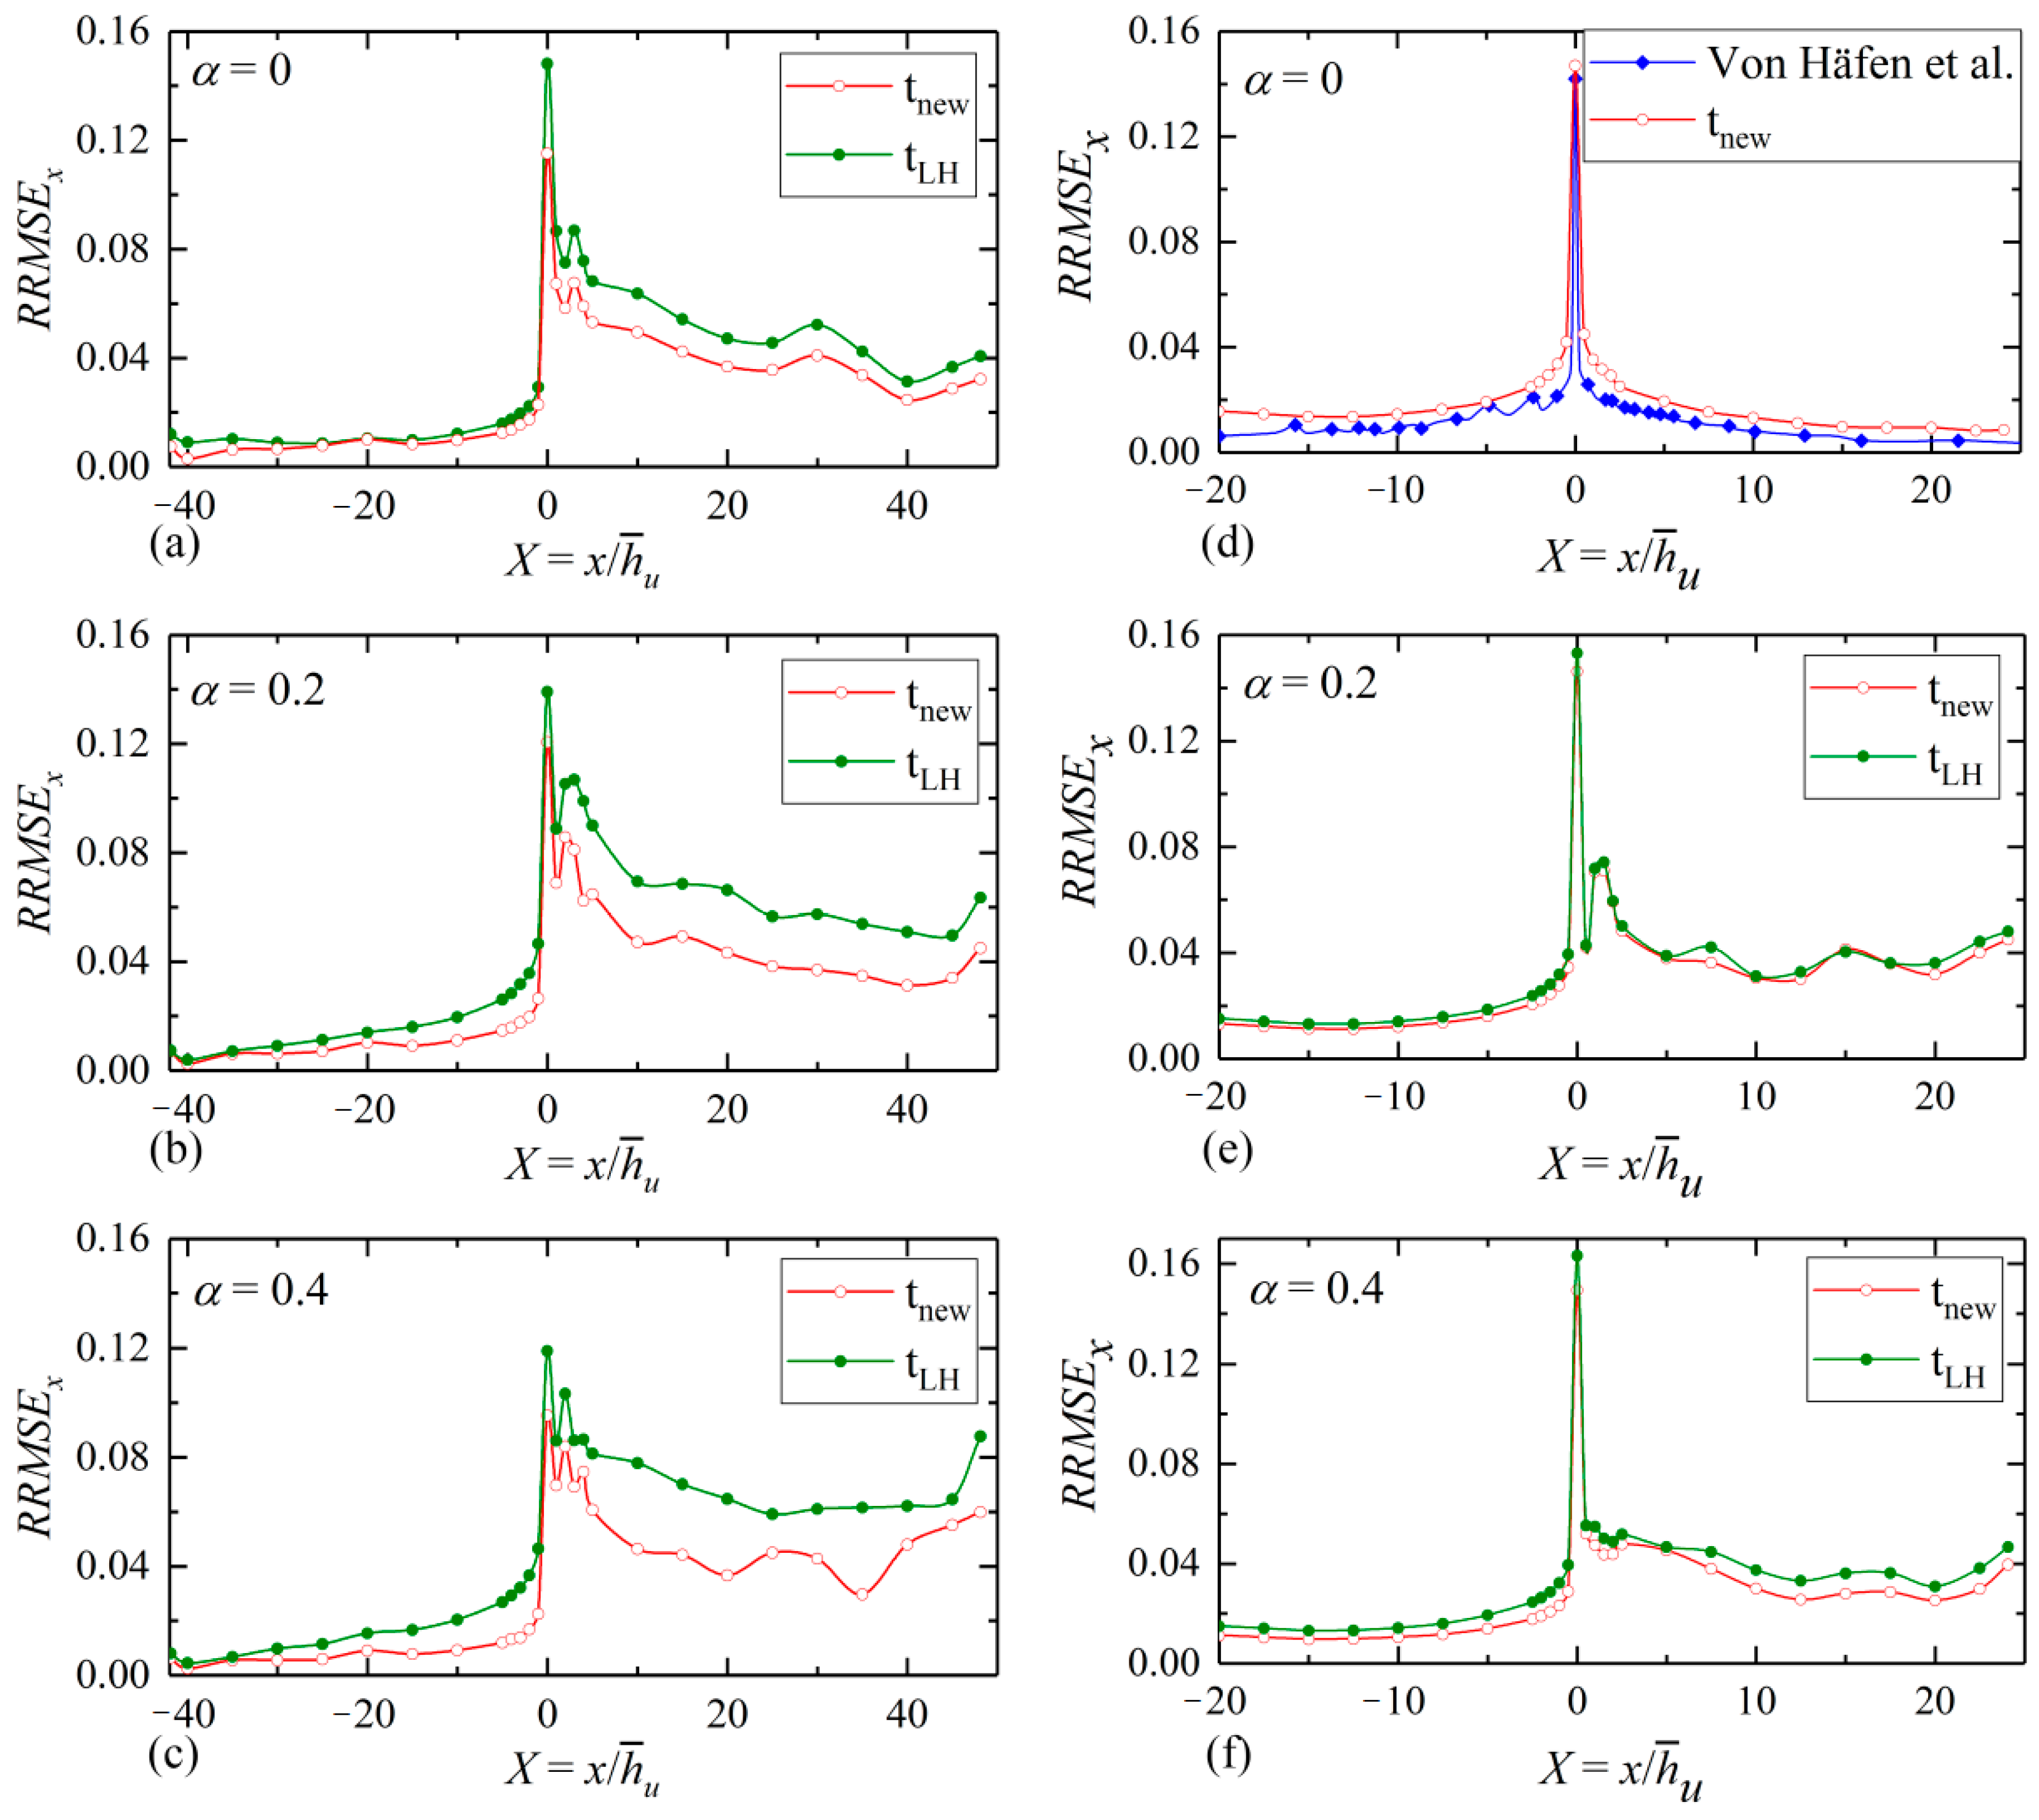
The gate motion leads to the variation of RRSME, representing the difference between the water depths related to the instantaneous dam failure and the dam-break generated by lifting a gate. The RRSME increases with the increase of the gate-opening time and decreases with the increase of the distance from the gate. This is particularly pronounced near the gate.
(4)
The Lauber–Hager criterion provides a conservative estimation of the gate opening time in the rectangular dry bed.

Author Contributions

Conceptualization, B.W.; Methodology, S.Y.; Software, S.Y.; Validation, B.W. and Y.C.; Formal Analysis, B.W.; Investigation, S.Y.; Data Curation, S.Y.; Writing—Original Draft Preparation, Y.G. and S.Y.; Writing—Review and Editing, B.W. and S.Y.; Visualization, S.Y.; Supervision, J.Z. and B.W.; Project Administration, B.W.; Funding Acquisition, B.W. and Y.G. All authors have read and agreed to the published version of the manuscript.

Funding

This research was funded by [the National Natural Science Foundation of China] grant number [51879179], [the State Key Laboratory of Hydraulics and Mountain River Engineering, Sichuan University] grant number [SKHL1809] and [Sichuan Science and Technology Program] grant number [2019JDTD0007] And the APC was funded by [Bo Wang].

Acknowledgments

This study is supported by the National Natural Science Foundation of China (Grant No: 51879179), the Open Fund from the State Key Laboratory of Hydraulics and Mountain River Engineering, Sichuan University (SKHL1809) and Sichuan Science and Technology Program (No. 2019JDTD0007). Thanks to Wenjun Liu, Xin Liu, and Fengjie Zhang for their help with the numerical simulation. The comments made by Reviewers have greatly improved the quality of the paper.

Conflicts of Interest

The authors declare no conflict of interest.

References

  1. Bosa, S.; Petti, M. A numerical model of the wave that overtopped the Vajont dam in 1963. Water Resour. Manag. 2013, 27, 1763–1779. [Google Scholar] [CrossRef]
  2. Wang, B.; Zhang, T.; Zhou, Q.; Wu, C.; Chen, Y.L.; Wu, P. A case study of the Tangjiashan landslide dam-break. J. Hydrodyn. 2015, 27, 223–233. [Google Scholar] [CrossRef]
  3. Wang, B.; Chen, Y.L.; Wu, C.; Dong, J.H.; Ma, X.; Song, J.J. A semi-analytical approach for predicting peak discharge of floods caused by embankment dam failures. Hydrol. Process. 2016. [Google Scholar] [CrossRef]
  4. Wang, B.; Chen, Y.L.; Wu, C.; Peng, Y.; Song, J.J.; Liu, W.J.; Liu, X. Empirical and semi-analytical models for predicting peak outflows caused by embankment dam failures. J. Hydrol. 2018, 562, 692–702. [Google Scholar] [CrossRef]
  5. Alcrudo, F.; Mulet, J. Description of the Tous Dam break case study (Spain). J. Hydraul. Res. 2007, 45 (Suppl. 1), 45–57. [Google Scholar] [CrossRef]
  6. Kocaman, S.; Ozmen-Cagatay, H. Investigation of dam-break induced shock waves impact on a vertical wall. J. Hydrol. 2015, 525, 1–12. [Google Scholar] [CrossRef]
  7. Wang, B.; Chen, Y.L.; Wu, C.; Peng, Y.; Ma, X.; Song, J.J. Analytical solution of dam-break flood wave propagation in a dry sloped channel with an irregular-shaped cross-section. J. Hydro-Environ. Res. 2017, 14, 93–104. [Google Scholar] [CrossRef]
  8. Wang, B.; Chen, Y.L.; Peng, Y.; Guo, Y.K.; Zhang, J.M.; Song, J.J.; Liu, W.J. Approximate solution of shallow water equations for ideal dam-break flood along a wet bed slope. J. Hydraul. Eng. 2020, 146, 06019020. [Google Scholar] [CrossRef] [Green Version]
  9. Wang, B.; Liu, W.J.; Wang, W.; Zhang, J.M.; Chen, Y.L.; Peng, Y.; Liu, X.; Yang, S. Experimental and numerical investigations of similarity for dam-break flows on wet bed. J. Hydrol. 2020, 124598. [Google Scholar] [CrossRef]
  10. Wang, B.; Liu, W.J.; Zhang, J.M.; Chen, Y.L.; Wu, C.; Peng, Y.; Wu, Z.Y.; Liu, X.; Yang, S. Enhancement of semi-theoretical models for predicting peak discharges in breached embankment dams. Environ Fluid Mech. 2020, 20, 885–904. [Google Scholar] [CrossRef]
  11. Zanuttigh, B.; Lamberti, A. Dam-break waves in power-law channel section. J. Hydraul. Eng. 2001, 127, 322–326. [Google Scholar] [CrossRef]
  12. Wang, B.; Zhang, J.M.; Chen, Y.; Peng, Y.; Liu, X.; Liu, W.J. Comparison of measured dam-break flood waves in triangular and rectangular channels. J. Hydrol. 2019, 575, 690–703. [Google Scholar] [CrossRef]
  13. Lauber, G.; Hager, W.H. Experiments to dambreak wave: Horizontal channel. J. Hydraul. Res. 1998, 36, 291–307. [Google Scholar] [CrossRef]
  14. Aleixo, R.; Soares-Frazão, S.; Zech, Y. Velocity-field measurements in a dam-break flow using a PTV Voronoï imaging technique. Exp. Fluids 2011, 50, 1633–1649. [Google Scholar] [CrossRef]
  15. Hu, K.C.; Hsiao, S.C.; Hwung, H.H.; Wu, T.R. Three-dimensional numerical modeling of the interaction of dam-break waves and porous media. Adv. Water Res. 2012, 47, 14–30. [Google Scholar] [CrossRef]
  16. Ozmen-Cagatay, H.; Kocaman, S.; Guzel, H. Investigation of dam-break flood waves in a dry channel with a hump. J. Hydro-Environ. Res. 2014, 8, 304–315. [Google Scholar] [CrossRef]
  17. Ye, Z.; Zhao, X.; Deng, Z. Numerical investigation of the gate motion effect on a dam break flow. J. Mar. Sci. Technol. 2016, 21, 579–591. [Google Scholar] [CrossRef]
  18. Stolle, J.; Goseberg, N.; Nistor, I.; Petriu, E. Probabilistic investigation and risk assessment of debris transport in extreme hydrodynamic conditions. J. Waterw. Port Coast. Ocean Eng. 2017, 144, 04017039. [Google Scholar] [CrossRef]
  19. Lu, S.; Liu, H.; Deng, X. An experimental study of the run-up process of breaking bores generated by dam-break under dry-and wet-bed conditions. J. Earthq. Tsunami 2018, 12, 1840005. [Google Scholar] [CrossRef]
  20. Kamra, M.M.; Al Salami, J.; Sueyoshi, M.; Hu, C. Experimental study of the interaction of dambreak with a vertical cylinder. J. Fluids Struct. 2019, 86, 185–199. [Google Scholar] [CrossRef]
  21. Von Häfen, H.; Goseberg, N.; Stolle, J.; Nistor, I. Gate-opening criteria for generating dam-break waves. J. Hydraul. Eng. 2019, 145, 04019002. [Google Scholar] [CrossRef]
  22. Wang, B.; Liu, X.; Zhang, J.M.; Guo, Y.; Chen, Y.L.; Peng, Y.; Liu, W.J.; Yang, S.; Zhang, F.J. Analytical and Experimental Investigations of Dam-Break Flows in Triangular Channels with Wet-Bed Conditions. J. Hydraul. Eng. 2020, 146, 4020070. [Google Scholar] [CrossRef]
  23. FLOW-3D v11.2 Users Manual; Flow Science, Inc.: Santa Fe, NM, USA, 2017.
  24. Bradford, S.F. Numerical simulation of surf zone dynamics. J. Waterw. Port Coast. Ocean Eng. 2000, 126, 1–13. [Google Scholar] [CrossRef]
  25. Ran, D.; Wang, W.; Hu, X. Three-dimensional numerical simulation of flow in trapezoidal cutthroat flumes based on FLOW-3D. Front. Agric. Sci. Eng. 2018, 5, 168–176. [Google Scholar] [CrossRef] [Green Version]
  26. Oertel, M.; Bung, D.B. Initial stage of two-dimensional dam-break waves: Laboratory versus VOF. J. Hydraul. Res. 2012, 50, 89–97. [Google Scholar] [CrossRef]
  27. Yang, S.; Yang, W.; Qin, S.; Li, Q.; Yang, B. Numerical study on characteristics of dam-break wave. Ocean Eng. 2018, 159, 358–371. [Google Scholar] [CrossRef]
  28. Özgökmen, T.M.; Iliescu, T.; Fischer, P.F.; Srinivasan, A.; Duan, J. Large eddy simulation of stratified mixing in two-dimensional dam-break problem in a rectangular enclosed domain. Ocean Model. 2007, 16, 106–140. [Google Scholar] [CrossRef]
  29. Biscarini, C.; Francesco, S.D.; Manciola, P. CFD modelling approach for dam break flow studies. Hydrol. Earth Syst. Sci. 2010, 14, 705–718. [Google Scholar] [CrossRef] [Green Version]
  30. LaRocque, L.A.; Imran, J.; Chaudhry, M.H. Experimental and numerical investigations of two-dimensional dam-break flows. J. Hydraul. Eng. 2012, 139, 569–579. [Google Scholar] [CrossRef]
  31. Smagorinsky, J. General circulation experiments with the primitive equations: I. The basic experiment. Mon. Weather Rev. 1963, 91, 99–164. [Google Scholar] [CrossRef]
  32. Khoshkonesh, A.; Nsom, B.; Gohari, S.; Banejad, H. A comprehensive study on dam-break flow over dry and wet beds. Ocean Eng. 2019, 188, 106279. [Google Scholar] [CrossRef]
  33. Hirt, C.W.; Nichols, B.D. Volume of fluid (VOF) method for the dynamics of free boundaries. J. Comput. Phys. 1981, 39, 201–225. [Google Scholar] [CrossRef]
  34. Wei, G. A fixed-mesh method for general moving objects. Flow Sci. Tech. Note 2005. [Google Scholar] [CrossRef] [Green Version]
Figure 1. Pathways of water particles released from the upstream to downstream water surfaces with a wet-bed in: (a) A rectangular channel; (b) a trapezoidal channel.
Energies 13 06280 g001
Figure 2. Schematic diagram of the channels in the present study: (a) A triangular channel; (b) a rectangular channel.
Energies 13 06280 g002
Figure 3. Plot of the computational mesh: (a) a triangular channel; (b) a rectangular channel.
Energies 13 06280 g003
Figure 4. Comparison between simulated water surface profiles and measurements in: (a) A triangular channel; (b) a rectangular channel.
Energies 13 06280 g004
Figure 5. Stage hydrographs at different locations: (a) Upstream of the dam in a rectangular channel; (b) downstream of the dam in a rectangular channel; (c) upstream of the dam in a triangular channel; (d) downstream of the dam in a triangular channel.
Energies 13 06280 g005
Figure 6. Profiles of RRMSEx for triangular channel (the left column) and rectangular channel (the right column). (a) α = 0 in the triangular channel; (b) α = 0.2 in the triangular channel; (c) α = 0.4 in the triangular channel; (d) α = 0 in the rectangular channel; (e) α = 0.2 in the rectangular channel; (f) α = 0.4 in the rectangular channel.
Energies 13 06280 g006
Figure 7. Variation of RRMSEt with time in a triangular channel (the left column) and rectangular channel (the right column). (a) α = 0 in the triangular channel; (b) α = 0.2 in the triangular channel; (c) α = 0.4 in the triangular channel; (d) α = 0 in the rectangular channel; (e) α = 0.2 in the rectangular channel; (f) α = 0.4 in the rectangular channel.
Energies 13 06280 g007
Figure 8. Front velocity for different criterion: (a) A rectangular channel; (b) a triangular channel.
Energies 13 06280 g008
Table 1. Computational domain and boundary conditions.
Cross-SectionBlocks’ Domain (m) [x; y; z]xminxmaxyminymaxzminzmax
Rectangle[−8.37~9.63; 0~1; 0~0.5]No-slipOutflowNo-slipNo-slipNo-slipSymmetry
Triangle[−8.37~9.63; 0~1; 0~0.5]No-slipOutflowNo-slipNo-slipNo-slipSymmetry
Publisher’s Note: MDPI stays neutral with regard to jurisdictional claims in published maps and institutional affiliations.

