Article

Flow Characteristics of a Straight-Bladed Vertical Axis Wind Turbine with Inclined Pitch Axes

Key Laboratory for Advanced Materials Processing Technology of MOE, Department of Mechanical Engineering, Tsinghua University, Beijing 100084, China
*
Author to whom correspondence should be addressed.
Energies 2020, 13(23), 6281; https://doi.org/10.3390/en13236281
Submission received: 21 October 2020 / Revised: 18 November 2020 / Accepted: 25 November 2020 / Published: 28 November 2020
(This article belongs to the Section A3: Wind, Wave and Tidal Energy)

Abstract

:
Currently, vertical axis wind turbines (VAWT) are considered as an alternative technology to horizontal axis wind turbines in specific wind conditions, such as offshore farms. However, complex unsteady wake structures of VAWTs exert a significant influence on performance of wind turbines and wind farms. In the present study, instantaneous flow fields around and downstream of an innovative VAWT with inclined pitch axes are simulated by an actuator line model. Unsteady flow characteristics around the wind turbine with variations of azimuthal angles are discussed. Several fluid parameters are then evaluated on horizontal and vertical planes under conditions of various fold angles and incline angles. Results show that the total estimated wind energy in the shadow of the wind turbine with an incline angle of 30° and 150° is 4.6% higher than that with an incline angle of 90°. In this way, appropriate arrangements of wind turbines with various incline angles have the potential to obtain more power output in a wind farm.

1. Introduction

Modern wind turbines can be divided into horizontal axis wind turbines (HAWT) and vertical axis wind turbines (VAWT). VAWTs perform competitive advantages over their counterparts [1], especially a faster wake recovery leading to a more compact turbine arrangement and higher power density of wind farms [2]. However, strong blade–vortex interactions and complex unsteady wake structures are inherent attributes of VAWTs, which exert a significant influence on performance of wind turbines and wind farms [2,3,4]. Much research has been carried out and reported in previous literature that focuses on the wake of VAWTs. Brochier et al. [5] obtained velocity measurements of the wake by laser Doppler velocimetry (LDV) in a water channel to study periodic vortex phenomena. Tescione et al. [2] investigated asymmetric wake and vortex structures of a straight-bladed VAWT using stereoscopic particle image velocimetry (PIV). A more noticeable expansion of the wake is shown in the windward side on midspan horizontal planes. Moreover, on vertical planes at several cross-stream locations, the wake contracts in the middle part but expanses at the edges with a wider divergence in the windward side. Rolin and Porte-Agel [6] illustrated boundary layer effect on the wake using PIV. Larger momentum at higher altitudes is entrained downwards to aid with the velocity recovery. Li et al. [7,8] assessed velocity deficits of the wake in a wind tunnel by LDV with three tip speed ratios (TSR). Additionally, further study manifested that the wake in field test performed a faster recovery than that in the wind tunnel. Ryan et al. [9] revealed the three-dimensional flow field around and downstream of a VAWT using magnetic resonance velocimetry in a water tunnel, and flow reversal was observed just behind the wind turbine. Abkar and Dabiri [10] described velocity deficits in the wake as a two-dimensional multivariate Gaussian distribution. Based on that, a rectangular porous plate model was proposed to predict the far wake of VAWTs. Kadum et al. [11] conducted a wind tunnel experiment to illuminate downstream development of the wake behind a model VAWT. The wake is skewed within 2.5 times the turbine diameter downstream and then experiences a declined expansion and growing velocity recovery. Franchina et al. [4] analyzed unsteady flow fields in the vicinity of the wind turbine in two- and three-dimensional computational fluid dynamics (CFD) simulations.
Furthermore, geometric and operational parameters of wind turbines have remarkable effects on flow characteristics of the wake. Parker et al. [3] presented the effect of chord-to-diameter ratios using both PIV and a hot-wire anemometer. Higher dynamic solidity leads to greater blockage effect and steeper gradients on the retreating side of the wake. Hezaveh et al. [1] examined the effect of turbine design parameters including solidities, aspect ratios, and TSRs, which altered the wake geometries and intensities in an interconnected way. Shamsoddin and Porte-Agel [12] assessed the effect of the rotor aspect ratio on the wake by an actuator line model (ALM). A normalization length scale was proposed to acquire an identical cross-section of the wake in a circular shape with various aspect ratios. They [13] also exhibited velocity deficits and turbulence intensity in the wake for a VAWT in the atmospheric boundary layer. Clear vertical asymmetries of both turbulence intensity and turbulent momentum flux fields were shown. Posa [14] evaluated wake features of a VAWT with various TSRs. A higher momentum deficit but also a faster recovery in the wake is produced with increased TSRs, since the instability of the shear layers at both edges of the wake occurs closer to the wind turbine. In addition, peaks of turbulence kinetic energy moving downstream become higher at higher TSRs. However, results by Yang et al. [15] showed that the effect of tip vortex on the wake was larger at low TSRs with a faster velocity recovery than that at high TSRs. Bachant and Wosnik [16,17] drew conclusions that increasing Reynolds numbers result in lower levels of turbulence and recommended that the Reynolds number of a physical model based on the rotor diameter be over 106 to obtain reliable predictions of full-scale wake performance. Orlandi et al. [18] demonstrated complex three-dimensional flow characteristics around a VAWT under tower tilting conditions. Mendoza et al. [19] compared the wake of HAWTs and VAWTs in the atmospheric boundary layer with different surface roughness of terrain. Souaissa et al. [20] focused on flows around a cambered blade profile and confirmed that the instantaneous torque is highly related to generated-separated blade vortex.
Some innovative designs of VAWTs have been proposed in previous literature, and flow fields of these novel designs have been studied, too. Xu et al. [21] compared the evolution and mutual interaction of shedding vortices and tip vortices of a VAWT with and without a blade tip winglet. The winglet raises the tip vortices far away from the blade surface and reduces the three-dimensional effect, so as to improve power output of the wind turbine. Villeneuve et al. [22] investigated effect of detached end-plates with two geometries on the overall performance and velocity recovery in the near-wake. The circular detached end-plates are detrimental to the wake recovery rate. However, the semiannular ones are found to enhance recovery of streamwise velocities because increased spanwise velocities are induced by circulations on the interior edge of detached end-plates. Su et al. [23] came up with a novel VAWT with V-shaped blades that were proven to suppress the flow separation over the blade surface and change the distribution of the wake behind the wind turbine. Brownstein et al. [24] investigated velocity fields of an isolated VAWT and of co- and counter-rotating pairs of VAWTs to optimize turbine configurations in wind farms.
Pitch regulation plays a significant role in the aerodynamics of VAWTs. So far, much attention has been paid to power performance and aerodynamic behavior of VAWTs with fixed or variable pitch angles [25,26]. An increase of 22.6% in the power efficiency with variable pitch angles was found compared to that with fixed pitch angles [25]. Moreover, related pitch strategies and pitch controllers were investigated and optimized as well [27]. As is known to all, conventional pitch axes of a VAWT are coincident with the aerodynamic center lines of blades. However, an innovative VAWT with inclined pitch axes was proposed in previous literature, which can mitigate mechanical complexity and structural loads [28,29]. As shown in Figure 1, a pitch axis is at an incline angle to the aerodynamic center line. When the blade is folded around the inclined pitch axis, the direction of the blade chord changes to achieve pitch movement. Meanwhile, movements of the blade in the other two directions, flapwise movement and edgewise movement, are exhibited. In this way, the three dimensional movement of the blade with an inclined pitch axis is notably different from that of a conventional pitch-regulated blade, resulting in distinct power performance and flow fields of wind turbines. Power output of an innovative VAWT with inclined pitch axes has been illustrated in previous literature, but distinct flow characteristics around and downstream of it need to be further investigated, which are focused on in the present study.
The ALM is an unsteady aerodynamic model of wind turbines developed by Sørensen and Shen [30], which combines CFD with blade element theory (BET). It has been validated and widely implemented in previous studies [12,31,32]. Shamsoddin and Porte-Agel [33] employed the actuator swept-surface model and the ALM and the latter better depicted the unsteady-periodic nature of the wake validated by experimental flow measurements. Bachant et al. [34] pointed out that the ALM is able to capture crucial flow features of VAWTs. At the same time, the computational costs of the ALM with the k–ε turbulence model can be reduced by nearly four orders of magnitude compared with that of three-dimensional CFD simulations with the same turbulence model. Mendoza et al. [35] examined spatial and temporal discretization of the ALM to simulate near wake of a VAWT. The ALM was proven to be able to characterize the flow pattern and wake structures. Mendoza and Goude [36] compared the power coefficient curve and instantaneous normal forces of a VAWT using an actuator line model with experimental data so as to validate the numerical method. Therefore, the ALM is validated and employed in the present study.
In summary, in the present study, instantaneous flow fields around and downstream of a straight-bladed VAWT with inclined pitch axes are simulated by an actuator line model. Unsteady flow characteristics around the wind turbine with variations of azimuthal angles are discussed. Several fluid parameters are then evaluated on horizontal and vertical planes under conditions of various fold angles and incline angles. Lastly, the effect of pitch parameters on the wake is discussed in detail.

2. Methodology and Computational Model

2.1. Actuator Line Model

As is mentioned above, the actuator line model (ALM) combines computational fluid dynamics (CFD) with the blade element theory (BET). In BET, a blade is discretized into finite blade elements, and aerodynamic loads of a blade element are calculated by tabled lift and drag coefficients curves of two-dimensional airfoil profiles: [35]
d F N = 1 2 ρ U r e l 2 c d l · C N ,
d F T = 1 2 ρ U r e l 2 c d l · C T ,
where d F N and d F T are normal and tangential forces of a blade element, C N and C T are normal and tangential force coefficients, ρ is air density, U r e l is the local relative flow velocity, c is the blade chord length, and d l is the blade element length. In the present study, experimental data of aerodynamic load coefficients of airfoil profiles from Sandia National Laboratory [37] are employed. Then, point forces of a blade element are smoothed using a three-dimensional Gaussian kernel: [38]
η ϵ = 1 π 3 / 2 ϵ 3 e r 2 / ϵ 2 ,
where η ϵ is the smoothing factor, ϵ is the Gaussian distribution width that is set to blade chord length in the present study, and r is the distance to the point force.
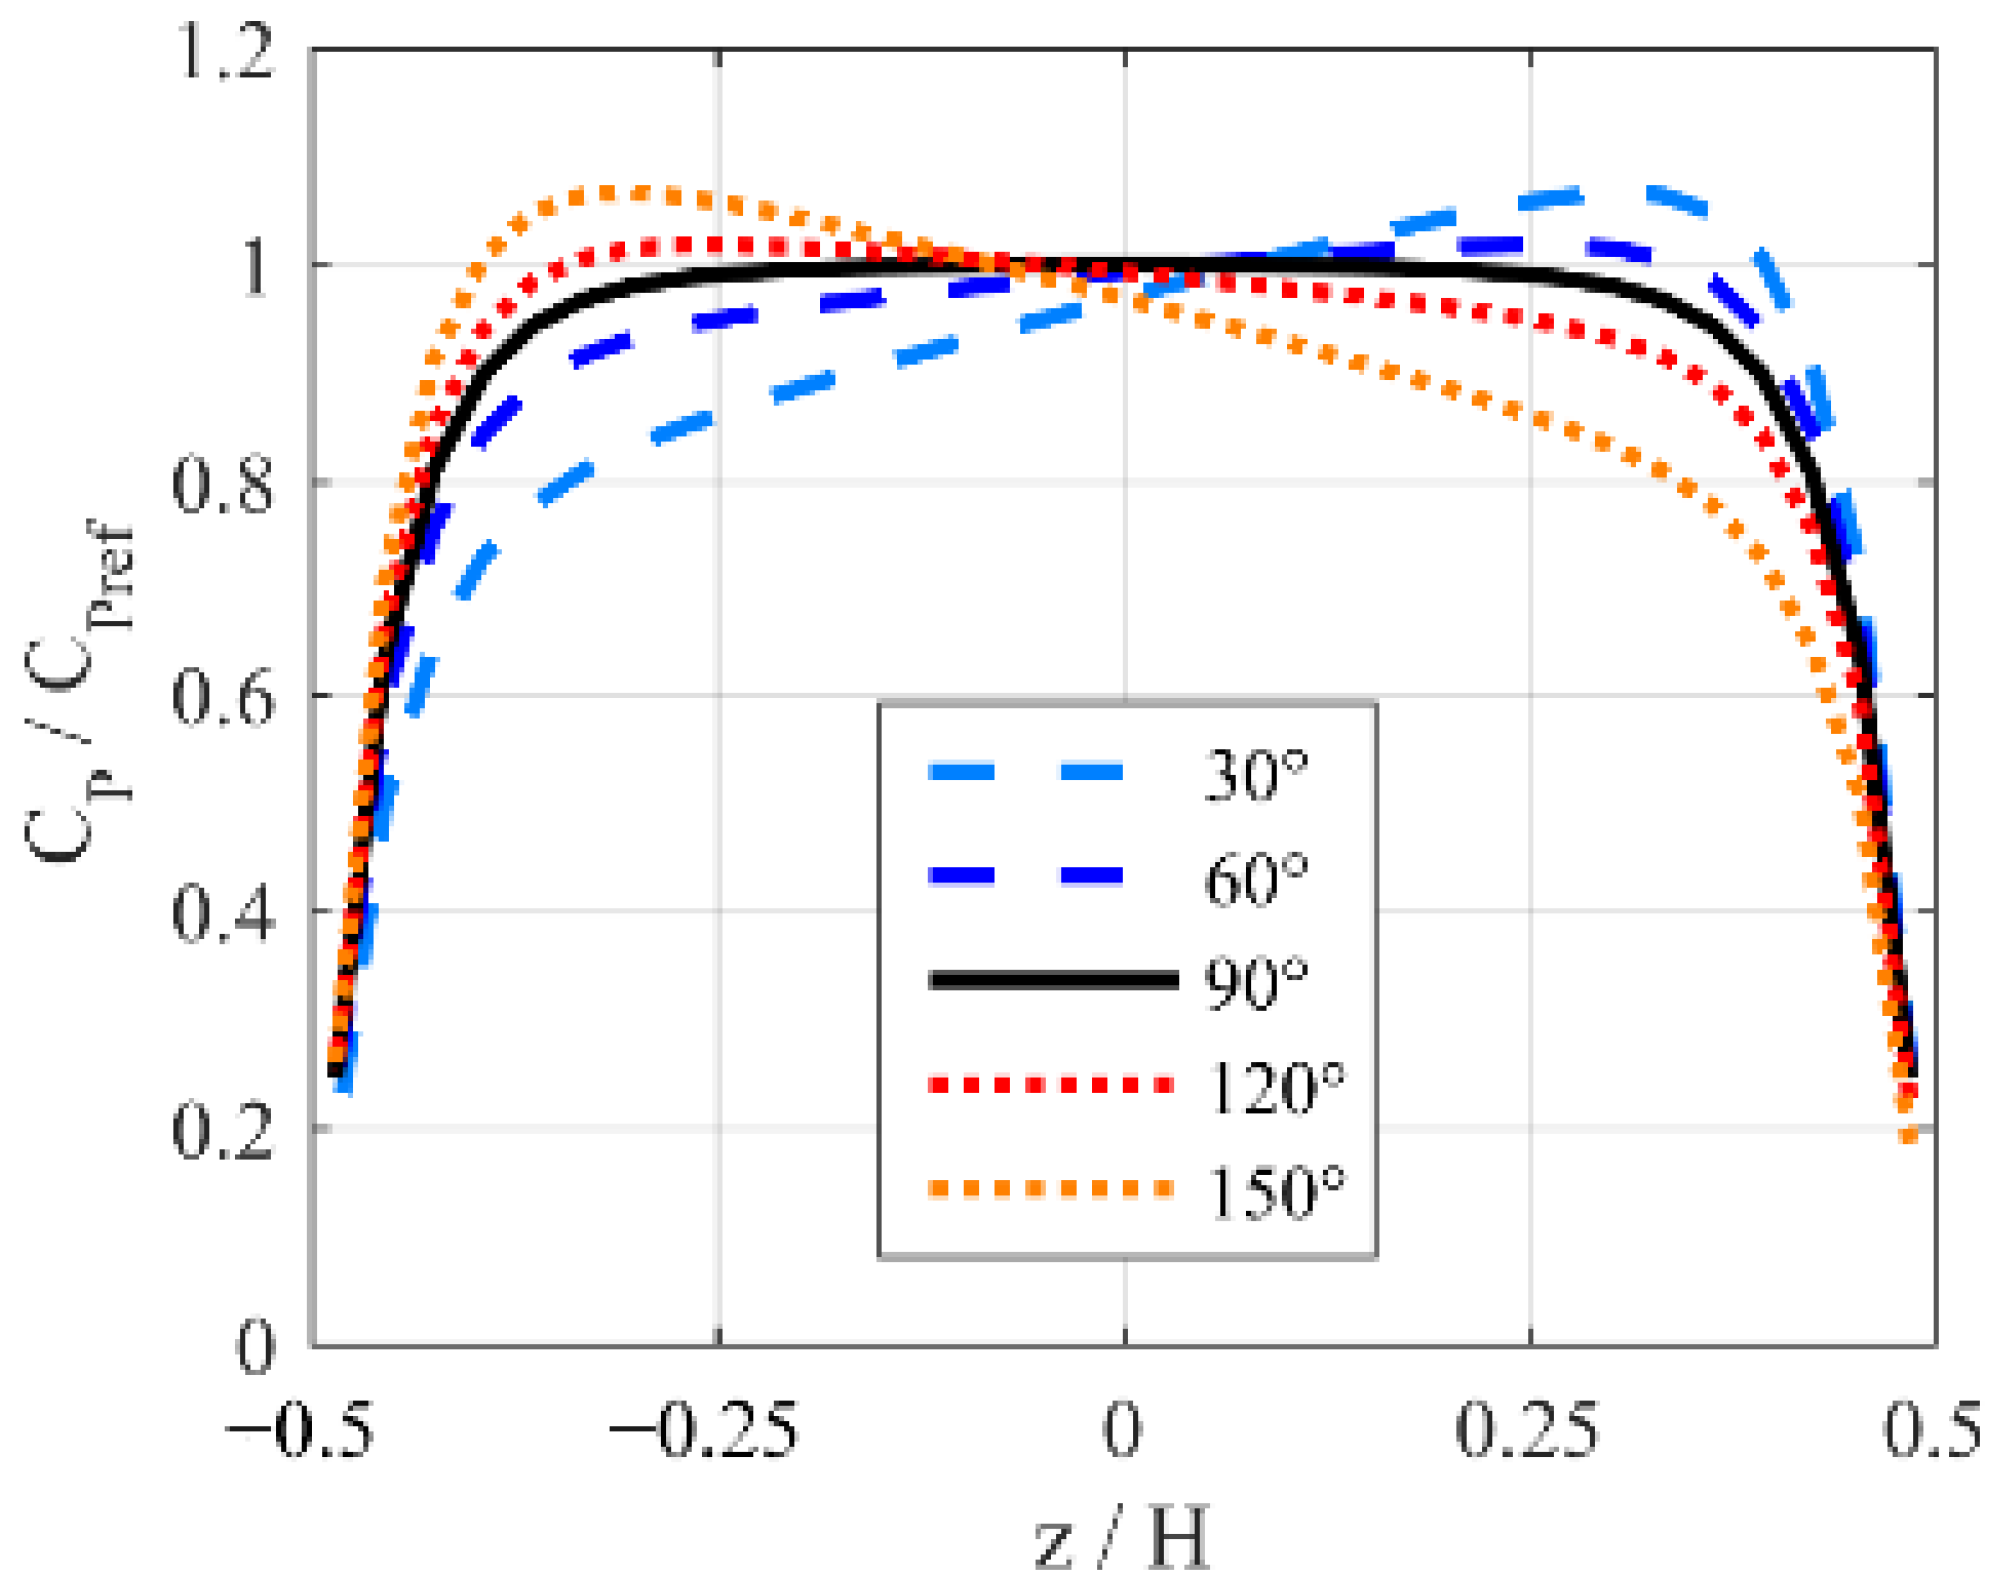
In CFD, models of blades and corresponding wall boundaries are replaced with body forces. Aerodynamic loads of blade elements calculated as above are added into the source term S in the Navier–Stokes momentum equation:
t ( ρ U ) + · ( ρ U U ) = · ( μ U ) p + S ,
where U is velocity, t is time, μ is kinetic viscosity, and p is static pressure.
Details of the ALM employed have been described in previous literature, so they are omitted here for brevity. Taking the circular blade movement of VAWTs and three-dimensional flow into consideration, several modifications need to be introduced to obtain higher accuracy of the simulation.
Angles of attack (AoA) of VAWT blades vary rapidly when blades rotate around the main shaft. As a result, the blades usually experience dynamic stall, which makes it necessary to utilize a dynamic stall model in the simulation. A Leishman–Beddoes (LB) dynamic stall model is employed in the present study. The LB model has been described in detail by Dyachuk et al. (so referred to as the LB SH model) [39] and examined in various stall conditions, fitting well with experimental results [40]. Moreover, it should be mentioned that the attached flow correction in the LB model is omitted [41,42].
Since blades of VAWTs perform a circular movement, they experience curved flow instead of uniform flow fields. Consequently, AoAs of blades are not constant along the chord length. It is called flow curvature effect or virtual incidence effect [43]. To account for the phenomenon, a full derivation of modifications of effective AoAs was performed by Goude [44] and the expression for the virtual incidence angle is:
α v i = Ω x 0 r c U r e l + Ω c 4 U r e l ,
where α v i is the virtual incidence angle, Ω is the turbine rotational speed, and x 0 r is the normalized blade attachment point (the origin is the aerodynamic center and the direction is from the trailing edge to the leading edge).
The circulation distribution of blades changes along the finite blade span so that trailing vortices develop, especially at the tips of blades, reducing the blade’s effectiveness. Therefore, tip loss correction is also considered in the present study. A commonly used model, derived from Prandtl’s theory, modifies the relative normal velocity by a factor F : [44]
F = arccos ( exp ( N Ω ( H 2 | z | ) U x ) ) arccos ( exp ( N Ω H 2 U x ) ) ,
where N is the blade number, H is the blade span length, z is the position (with zero defined at the center of the blade), and U x is the local streamwise velocity. In this way, the relative velocity and the geometrical AoA is calculated as [44]:
U r e l = ( Ω R + U cos ϕ ) 2 + ( F U sin ϕ ) 2 ,
α g e o = arctan ( F U sin ϕ U cos ϕ + Ω R ) ,
where U is the component in the blade element profile of the local wind velocity and ϕ is the local inflow angle. It should be noted that the relative velocity excludes the component of the wind velocity along the blade span.

2.2. Wind Turbine Model and Coordinate Systems

A 200 kW straight-bladed VAWT is chosen in the present study. The turbine with a rotor diameter (D) of 26 m includes three blades with a span length (H) of 24 m and a chord length (c) of 0.75 m. The airfoil is symmetric NACA0015. The turbine operates at a moderate tip speed ratio of 3.8 with the freestream velocity ( V ) of 8 m/s. Inclined pitch axes are set to be at the equator of blades.
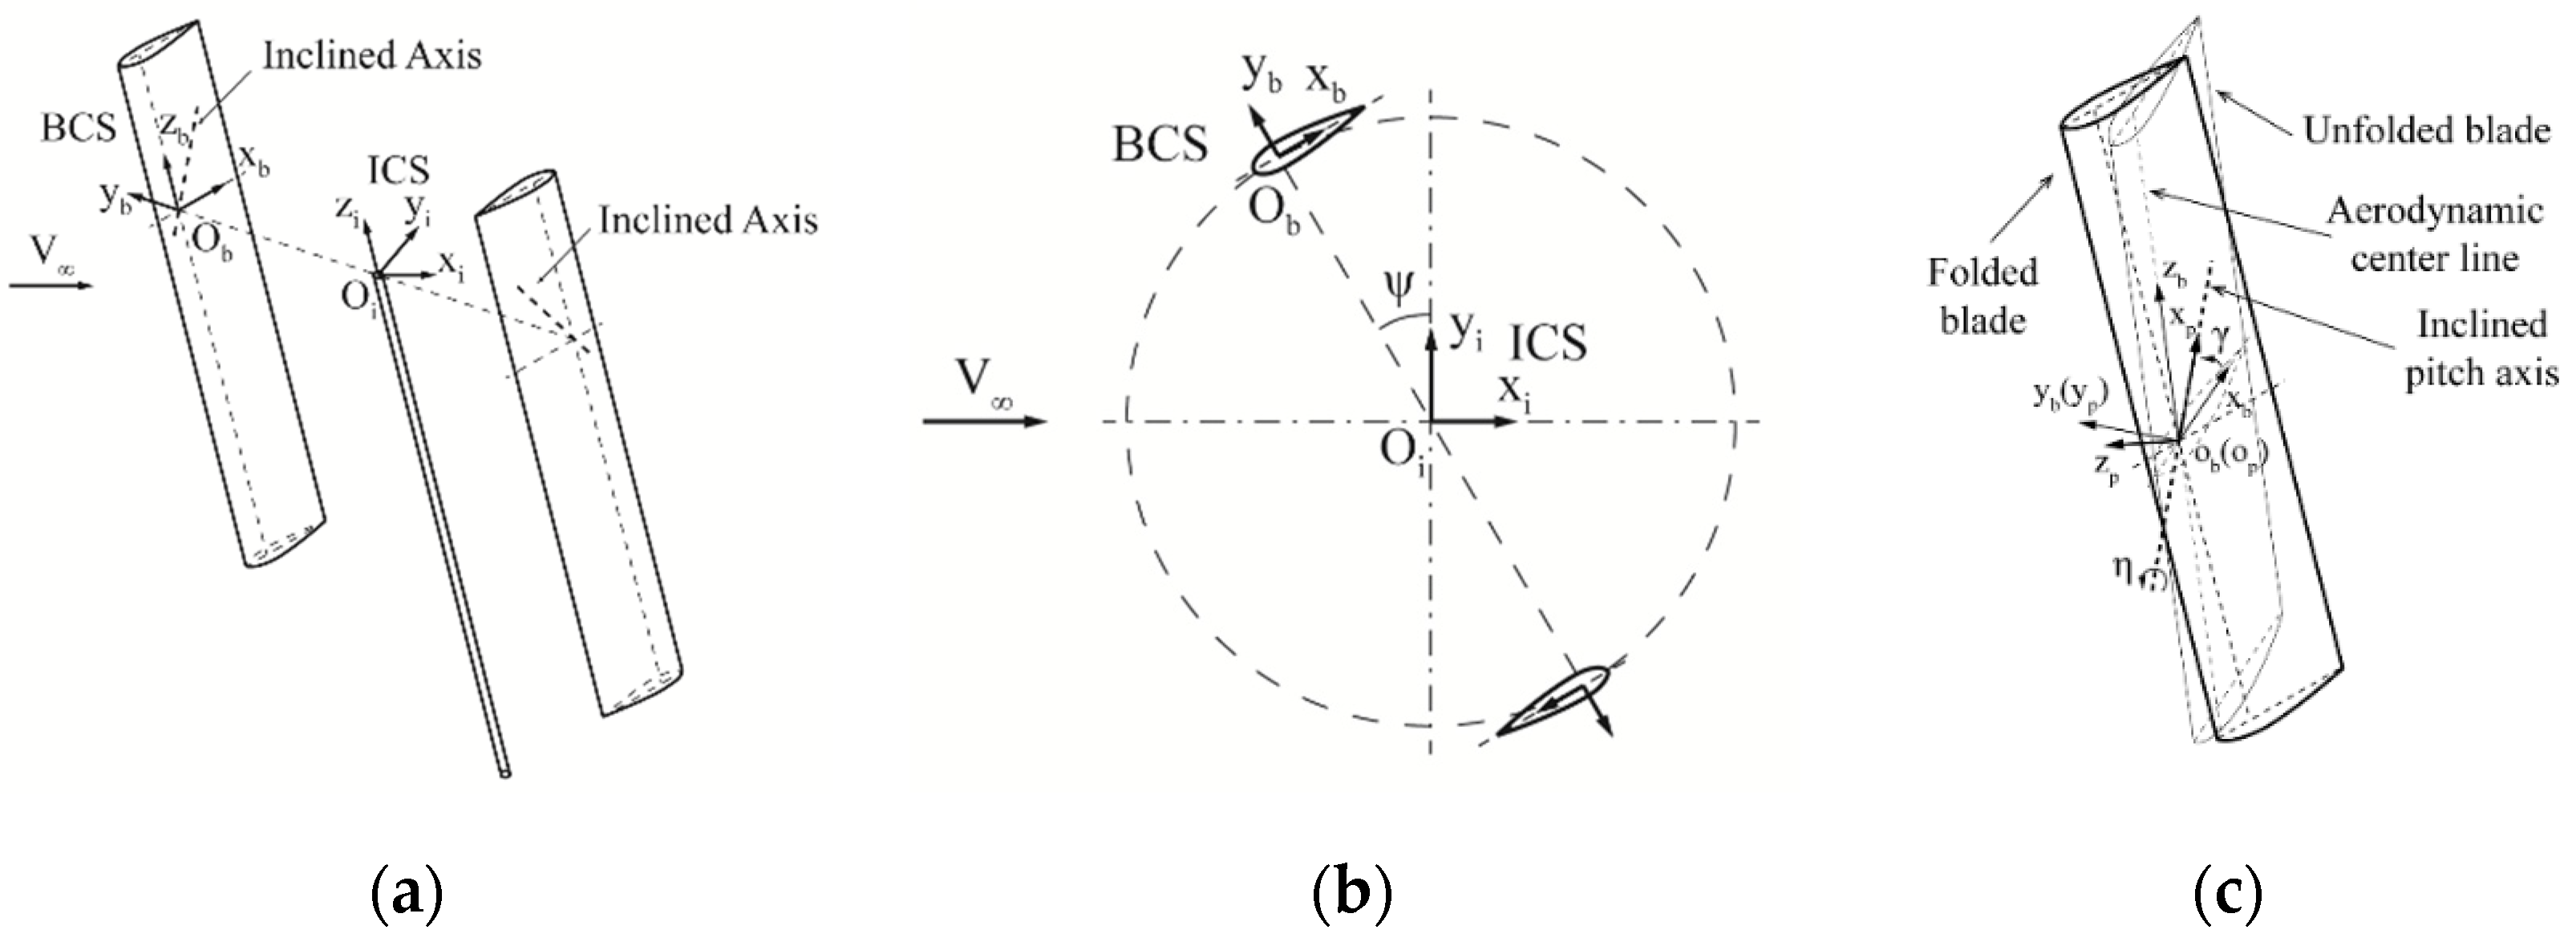
To elaborate the innovative VAWT clearly, three coordinate systems are established as shown in Figure 2. The first is an inertial coordinate system (ICS), of which the origin is located at the main shaft as high as the inclined pitch axes of the blades, the x axis is in the downstream direction, the y axis is in the lateral direction, and the z axis is in the upward vertical direction. ICS is attached to a single VAWT, excluding the location of the VAWT in the computational domain. The second is an unfolded blade coordinate system (BCS), of which the origin is located at the intersection of the inclined pitch axis and the aerodynamic center line of a blade, the x axis is in the chord direction from the leading edge to the trailing edge, the y axis is in the direction of blade thickness, and the z axis is in the upward vertical direction. BCS is attached to a blade, excluding the azimuth of the blade. The third is an inclined pitch axis coordinate system (PCS), which is the transformation of BCS rotating the incline angle ( γ ) around its negative y axis so that the x axis of PCS coincides with the inclined pitch axis. In PCS, the blade folding movement can be described as the blade rotating the fold angle ( η ) around negative x axis of PCS.
The sign convention of fluid parameters and aerodynamic loads are shown in Figure 3. The azimuth angle ( ψ ) is set to zero when the blade is at the windward position. The streamwise force, lateral force, and vertical force are defined in the direction of the x, y, and z axes of ICS, respectively. The normal force and tangential force of a blade are defined in the direction of y and negative x axis of BCS. The fore half of a revolution refers to 0 ° ψ 180 ° , while the aft half refers to 180 ° ψ 360 ° .

2.3. Computational Setup

In the present study, commercial CFD software ANSYS Fluent is utilized with user defined functions (UDF) to conduct the simulation. The computational domain sizes are set to be 30   D × 6   D × 6   D as shown in Figure 4a. The turbine is placed at the center of the domain so that the global coordinate system coincides with the ICS of the wind turbine. The inlet boundary is a uniform velocity of 8 m/s with a turbulence intensity of 5% and the outlet boundary is a zero gauge pressure outlet. Translational periodic conditions are imposed in the lateral boundaries while symmetry ones are imposed in the top and bottom boundaries. Hexagonal mesh is generated in ANSYS ICEM CFD. The whole domain is divided into three zones, an inner zone with a size of 2   D × 2   D × 2   H , a transition zone with a size of 3   D × 3   D × 3   H , and an outer zone (Figure 4b). Elements in the inner zone have a minimum size of 0.5   c × 0.5   c × c while those in the outer zones have a large size of 2   c × 2   c × 4   c and grow larger to the boundaries (Figure 4c). Hanging nodes are imposed at the interface between zones. The total number of elements is 1,967,560; the mesh sensitivity is analyzed below.
Numerical settings in Fluent are selected according to recommendations of previous literature. Sheer stress transport (SST) kω turbulence model is chosen and the pressure-based incompressible unsteady Reynolds-averaged Navier–Stokes (URANS) equations are solved using the Semi-Implicit Method for Pressure-Linked Equations Consistent (SIMPLEC) algorithm. Second order upwind spatial discretization schemes and second order implicit temporal discretization schemes are employed. The time step size for the unsteady simulations is 0.007473842 s, corresponding to an azimuthal angle step of 1.0°. Related sensitivity analysis is described below. The number of iterations per time step is set to 20 and the residual criteria are set to 10 5 for continuity equations, 10 3 for velocity equations and 10 6 for turbulent kinetic energy equations.

3. Validation

Dozens of revolutions of the wind turbine are required until simulation results reach convergence. For aerodynamic loads of blades, the average tangential force per revolution is calculated and the relative error compared with the last revolution is less than 0.25%, as a convergence criterion. In terms of flow field of the wind turbine, the local normalized streamwise velocities in the wake are extracted for each revolution and the maximum error compared with the last revolution is less than 0.25%, as a convergence criterion. Simulation results are analyzed after the convergence is confirmed.
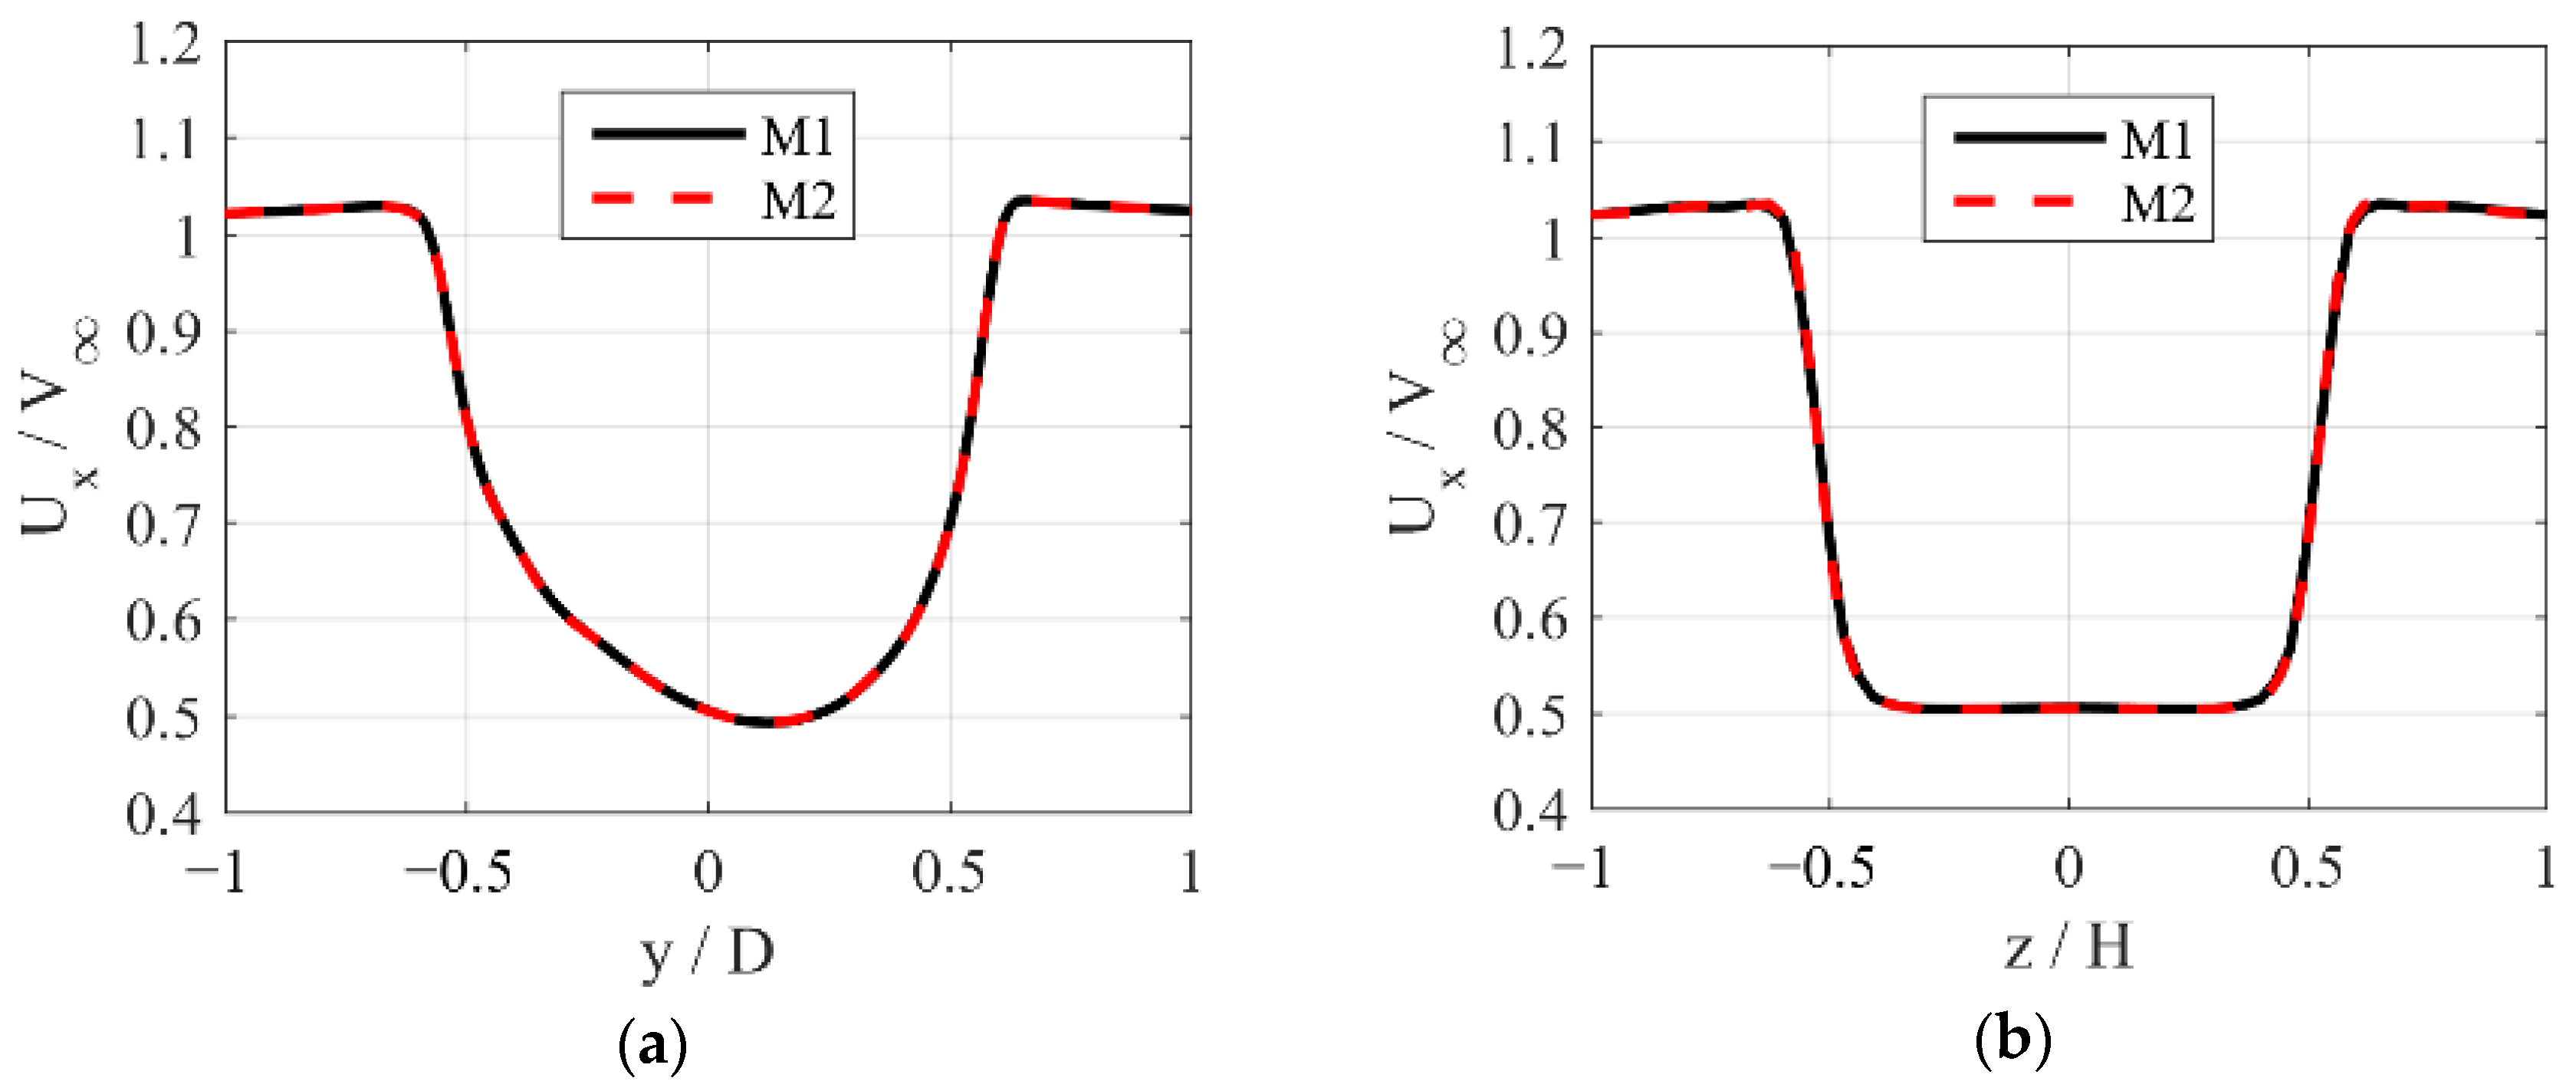
A spatial discretization sensitivity analysis is carried out on two meshes, a basic mesh M1 whose parameters are mentioned above, and a refined one M2 with the same topology but smaller element size. The minimum element size in M2 is 0.4   c × 0.4   c × 0.8   c and the total number of elements of M2 is 3,560,482, almost twice that of M1. Results of aerodynamic forces with two meshes are in good agreement, with less than a 1.0% relative error of the average tangential force coefficient. The flow field is examined by extracting two profiles of the streamwise velocities (normalized by the freestream velocity) at x/D = 1 downstream, a horizontal one where z/H is 0 and y/D is −1 to 1, and a vertical one where y/D is 0 and z/H is −1 to 1. From Figure 5, it is clear that velocities of the wake simulated by two meshes are very close. The errors of normalized average streamwise velocities in two meshes are 0.1% (horizontal profile) and 0.2% (vertical profile). Based on this mesh sensitivity analysis, the mesh M1 is found to be capable to obtain satisfying computational accuracy. Therefore, the mesh M1 is selected for the rest of simulations.
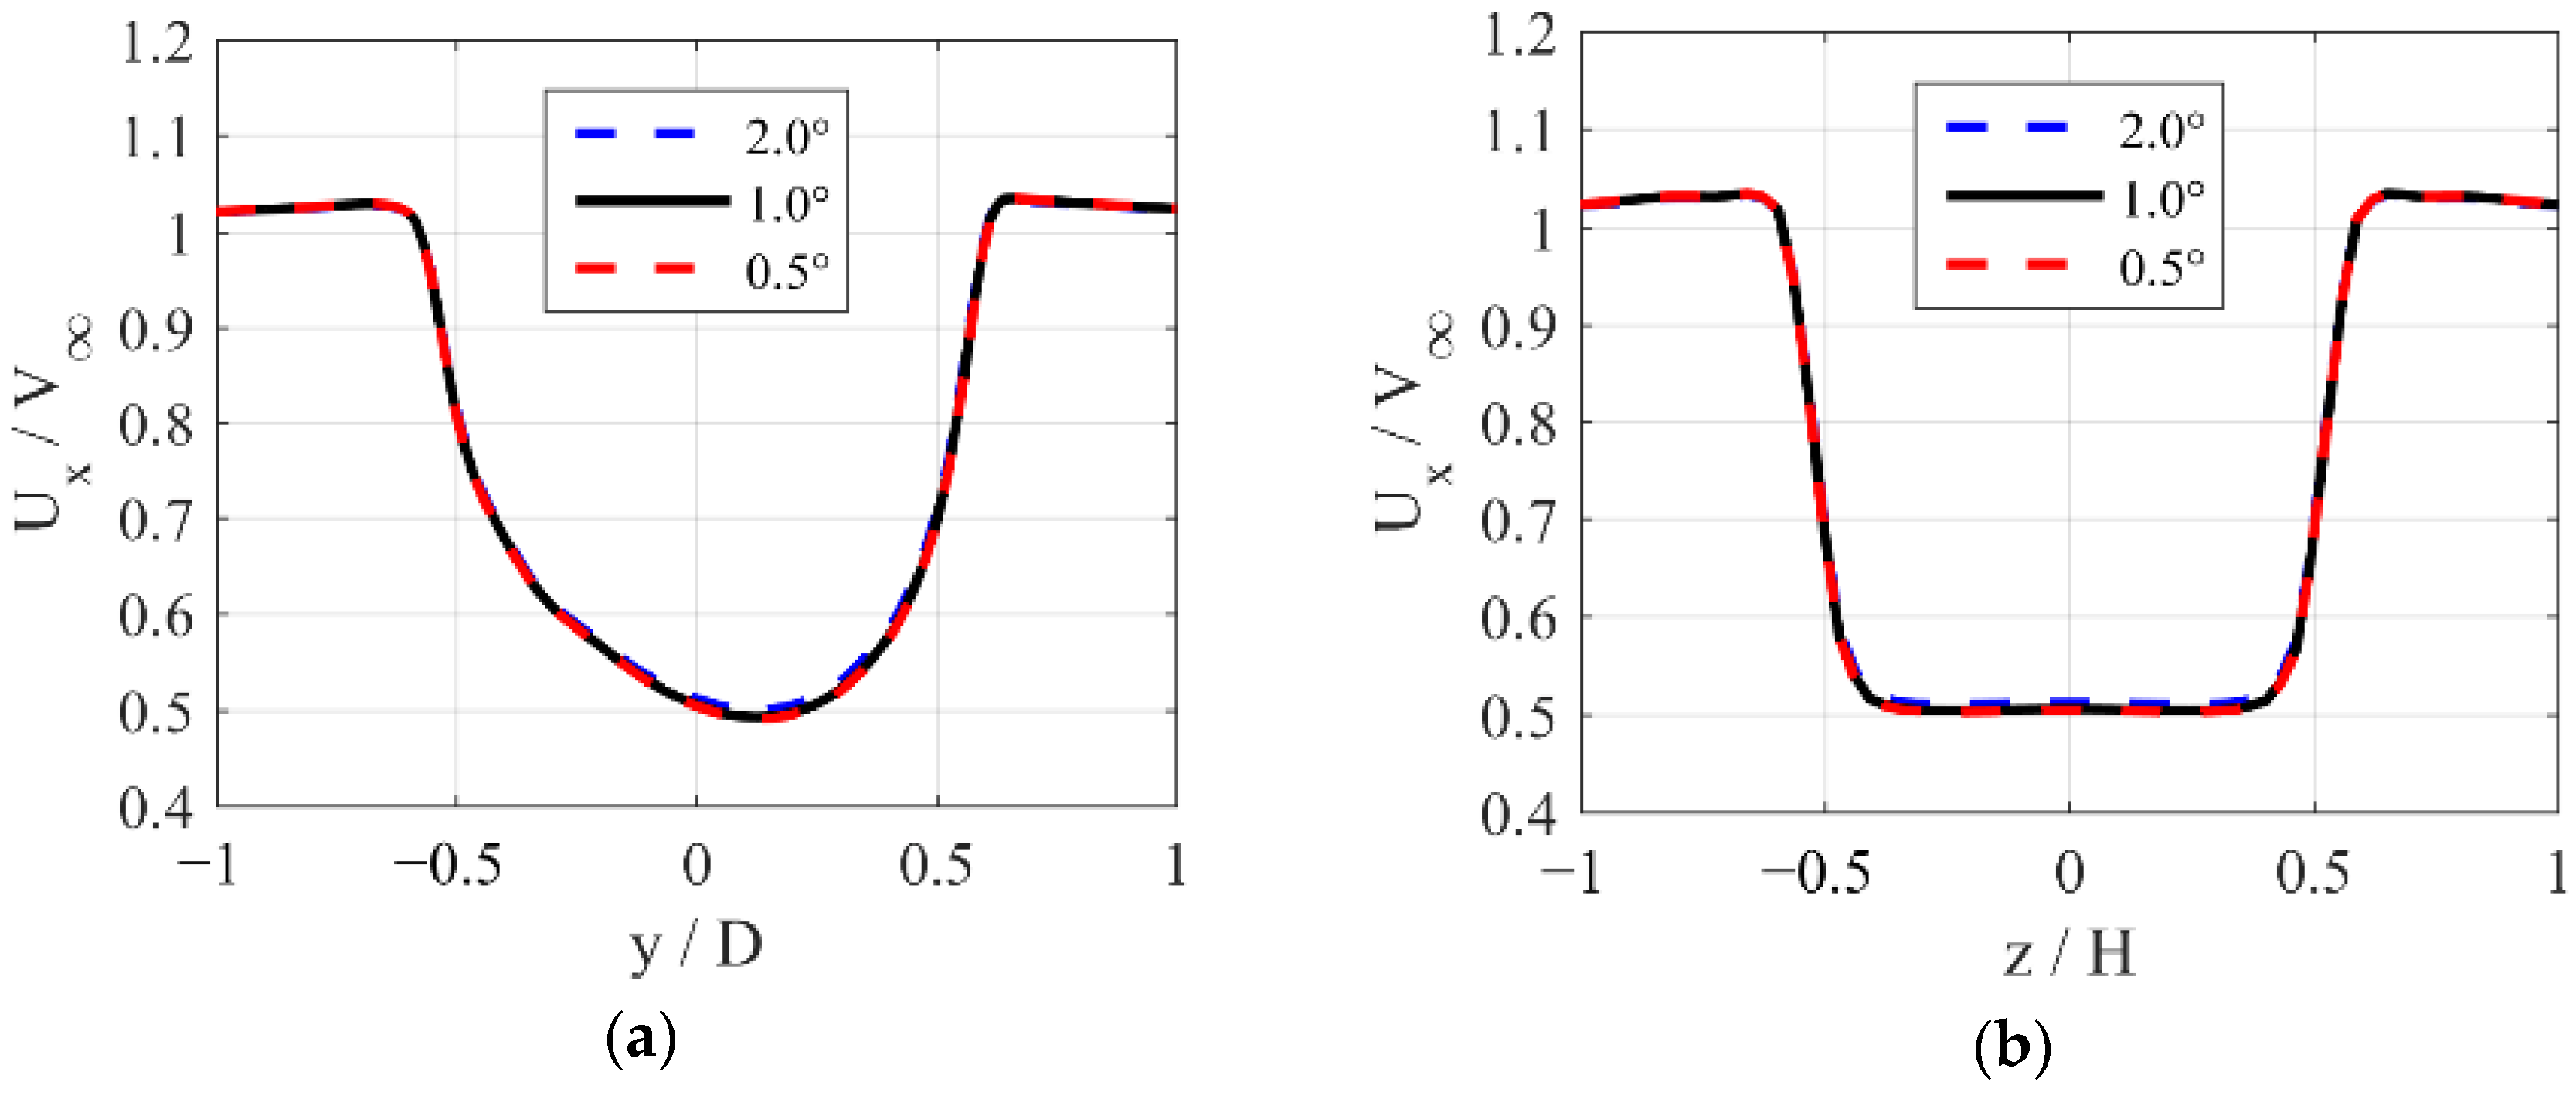
In order to investigate the sensitivity of the results to the temporal discretization, simulations are performed with azimuthal increments of 2.0°, 1.0°, and 0.5°. Results in Figure 6 show that streamwise velocities at the center of the wake are slightly overpredicted with the azimuthal increment of 2.0°. Differences between results with the other two azimuthal increments are quite small. In fact, the relative errors of average tangential force coefficients with azimuthal increments of 2.0° and 1.0° compared to those with the azimuthal increment of 0.5° are 3.0% and 0.7%, respectively. In addition, the maximum errors of normalized streamwise velocities with azimuthal increments of 2.0° and 1.0° are 1.0% and 0.2% (horizontal profile) and 0.8% and 0.1% (vertical profile), respectively. Therefore, an azimuthal increment of 1.0° is selected for the following study.
In BET, the appropriate length of a blade element needs to be determined. The number of blade elements with equal length of a blade is set to be 21, 33, and 49, corresponding to a length of 1.5 ε, ε, and 2/3 ε, respectively. It is found that the relative errors of average tangential force coefficients with blade element lengths of 1.5 ε and ε compared to those with the length of 2/3 ε are 1.4% and 0.2%, respectively, and the maximum errors of normalized streamwise velocities are 0.2% and 0.1% (horizontal profile) and 1.1% and 0.5% (vertical profile), respectively (Figure 7). Thus, the number of blade elements of a blade is set to 33, so that a blade element length of ε is selected.
In order to ensure the accuracy of the results simulated by ALM in the present study, two validation studies are discussed below. Computational settings employed in validation studies are the same as those mentioned above.
The first validation study focuses on power coefficients ( C p ) of a VAWT. Simulation results using ALM are compared with experiments by Castelli et al. [45] and simulations using CFD by Rezaeiha et al. [46]. Geometric and operational parameters of the wind turbine are listed in Table 1, Case 1. The results are shown in Figure 8. As can be seen, the C p curve calculated by the present method is generally coincident with that of experimental data, especially the peak of the curve at the optimal tip speed ratio. However, relatively large differences exist at low tip speed ratios, which may result from errors of the dynamic stall model and exclusion of aerodynamics of supporting structures of the wind turbine.
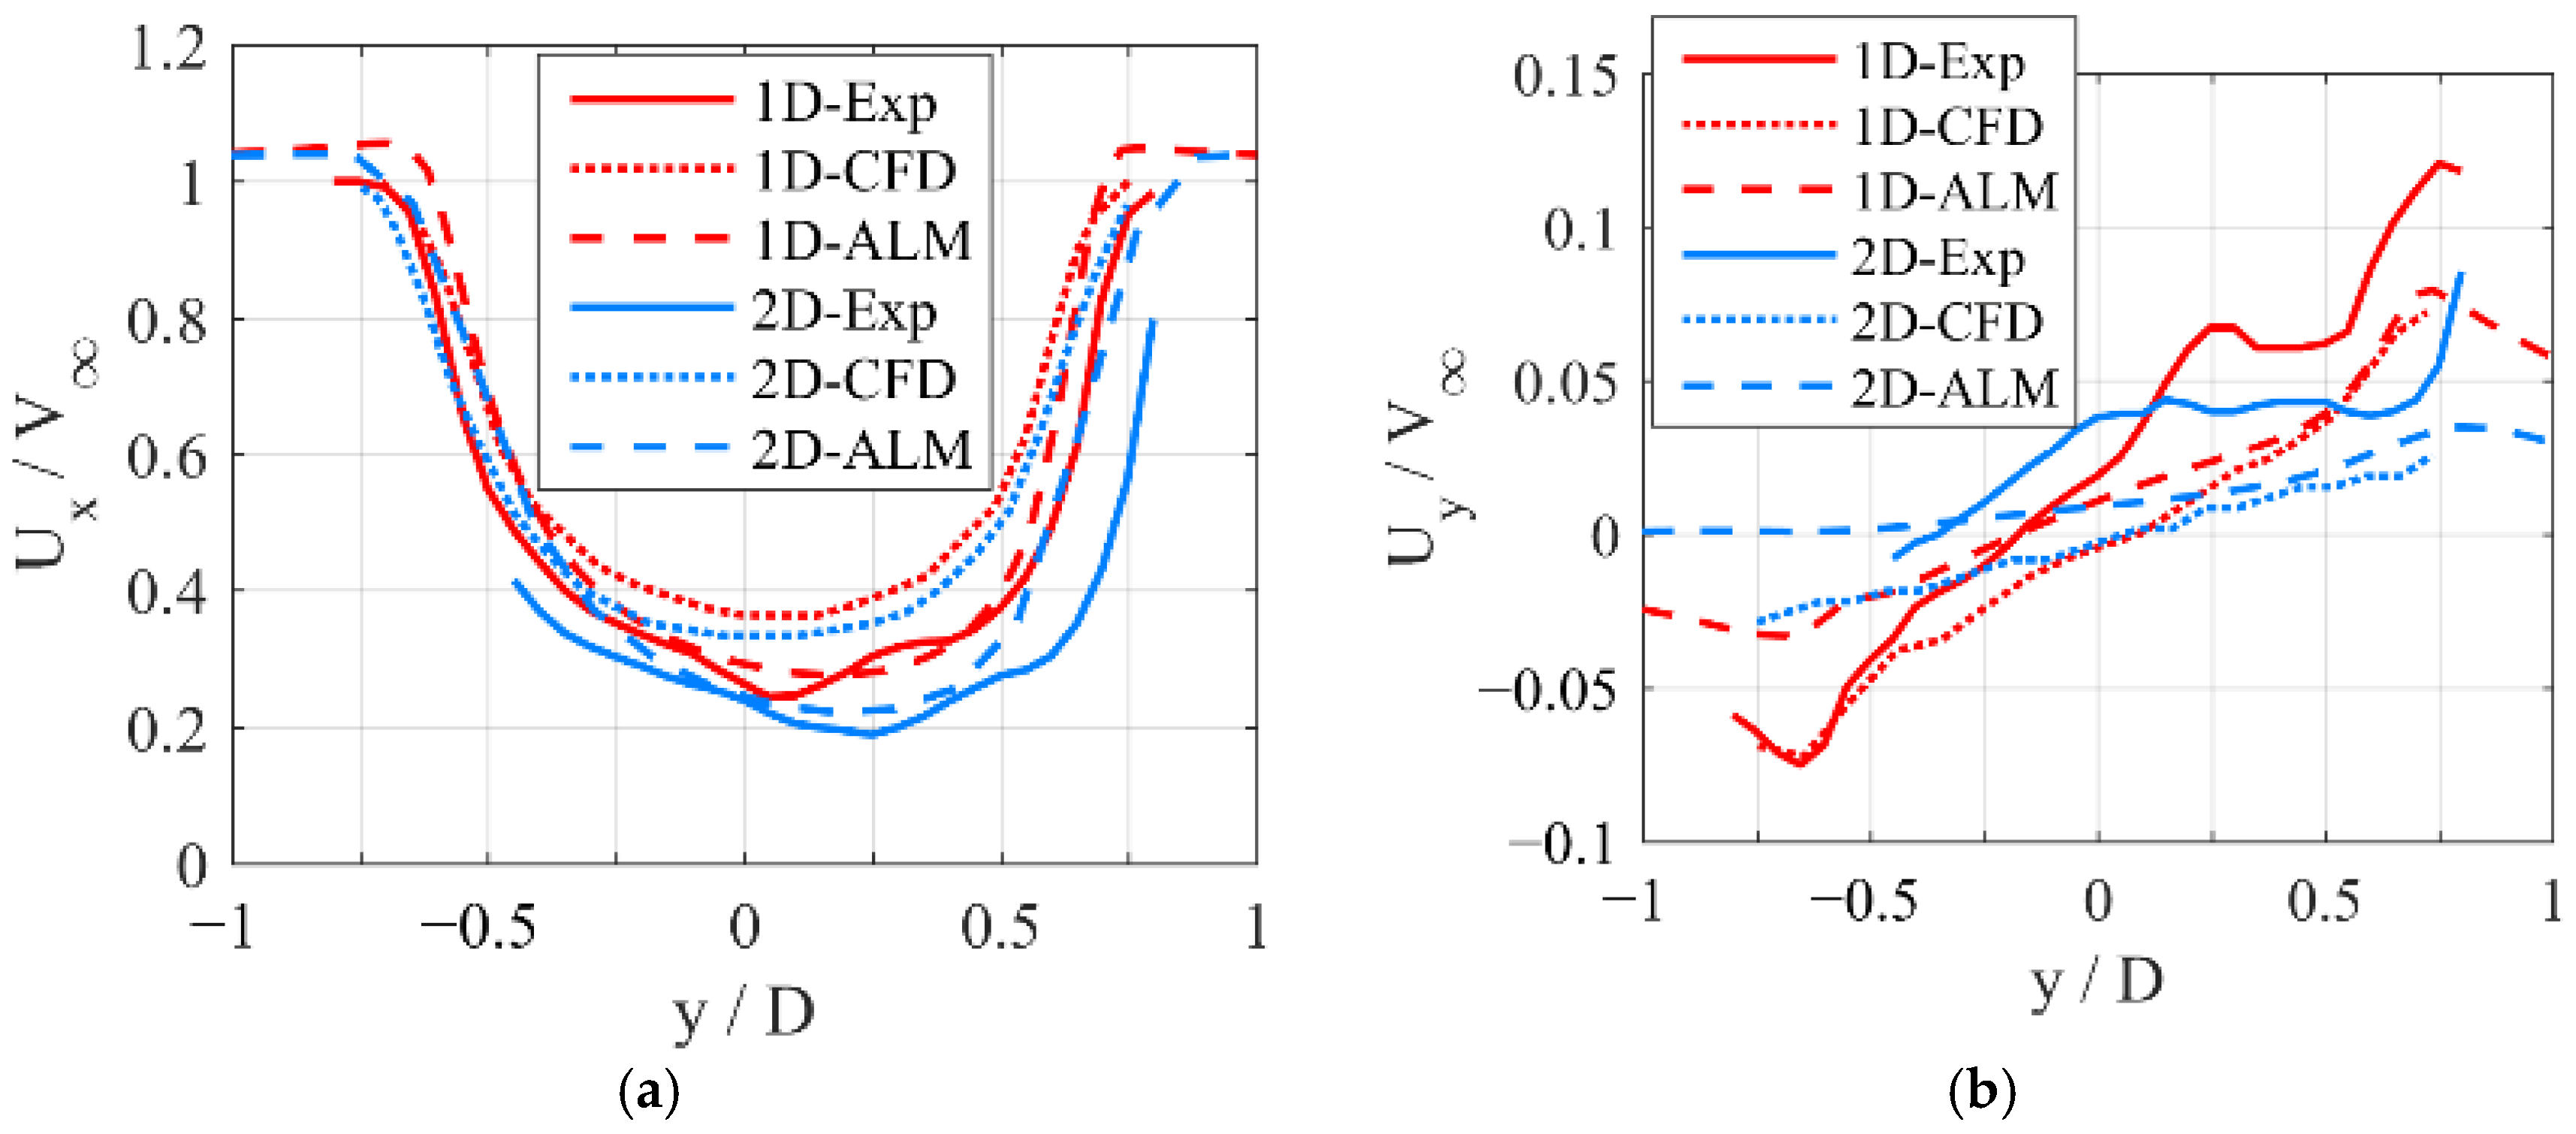
The second validation study focuses on the flow field of a VAWT. Streamwise and lateral velocities at x/D = 1, 1.5, and 2 in the wake on the equator of the wind turbine are compared with those measured by Tescione et al. [2] and CFD simulation by Rogowski [47] (Figure 9). Geometric and operational parameters of the wind turbine are listed in Table 1, Case 2. For streamwise velocities, the maximum deficits of the profiles in the wake are simulated close to experimental data while the breadth of deficits is somewhat underestimated. As for lateral velocities, values are generally underestimated, but in view of the fact that values of lateral velocities are one order of magnitude lower than the freestream velocity, obvious relative errors are reasonable.
Thus, based on the validation studies above, the ALM used in the present study is believed to provide a reliable simulation of a VAWT.

4. Results and Discussion

In the present study, flow fields around the wind turbine and downstream are acquired with various fold angles and incline angles and fluid parameters on the xy, xz, and yz planes, as discussed in detail. The analysis mainly focuses on flow fields downstream in a range of x/D from −1 to 5, y/D from −1 to 1, and z/H from −1 to 1. In addition, the trajectory of unfolded blades and the shadow area of the wind turbine are marked by dashed curves in the contours that follow.

4.1. Unsteady Flow Fields around the Wind Turbine with Various Fold Angles

To investigate the effect of the fold angle, simulations in three cases are accomplished where the fold angle is set to −5.0°, 0.0°, and 5.0°. The incline angle is set to 90° so the inclined pitch axis is degraded into the conventional pitch axis design. Unsteady flow fields around the wind turbine over a revolution with an azimuthal increment of 30° are illustrated.
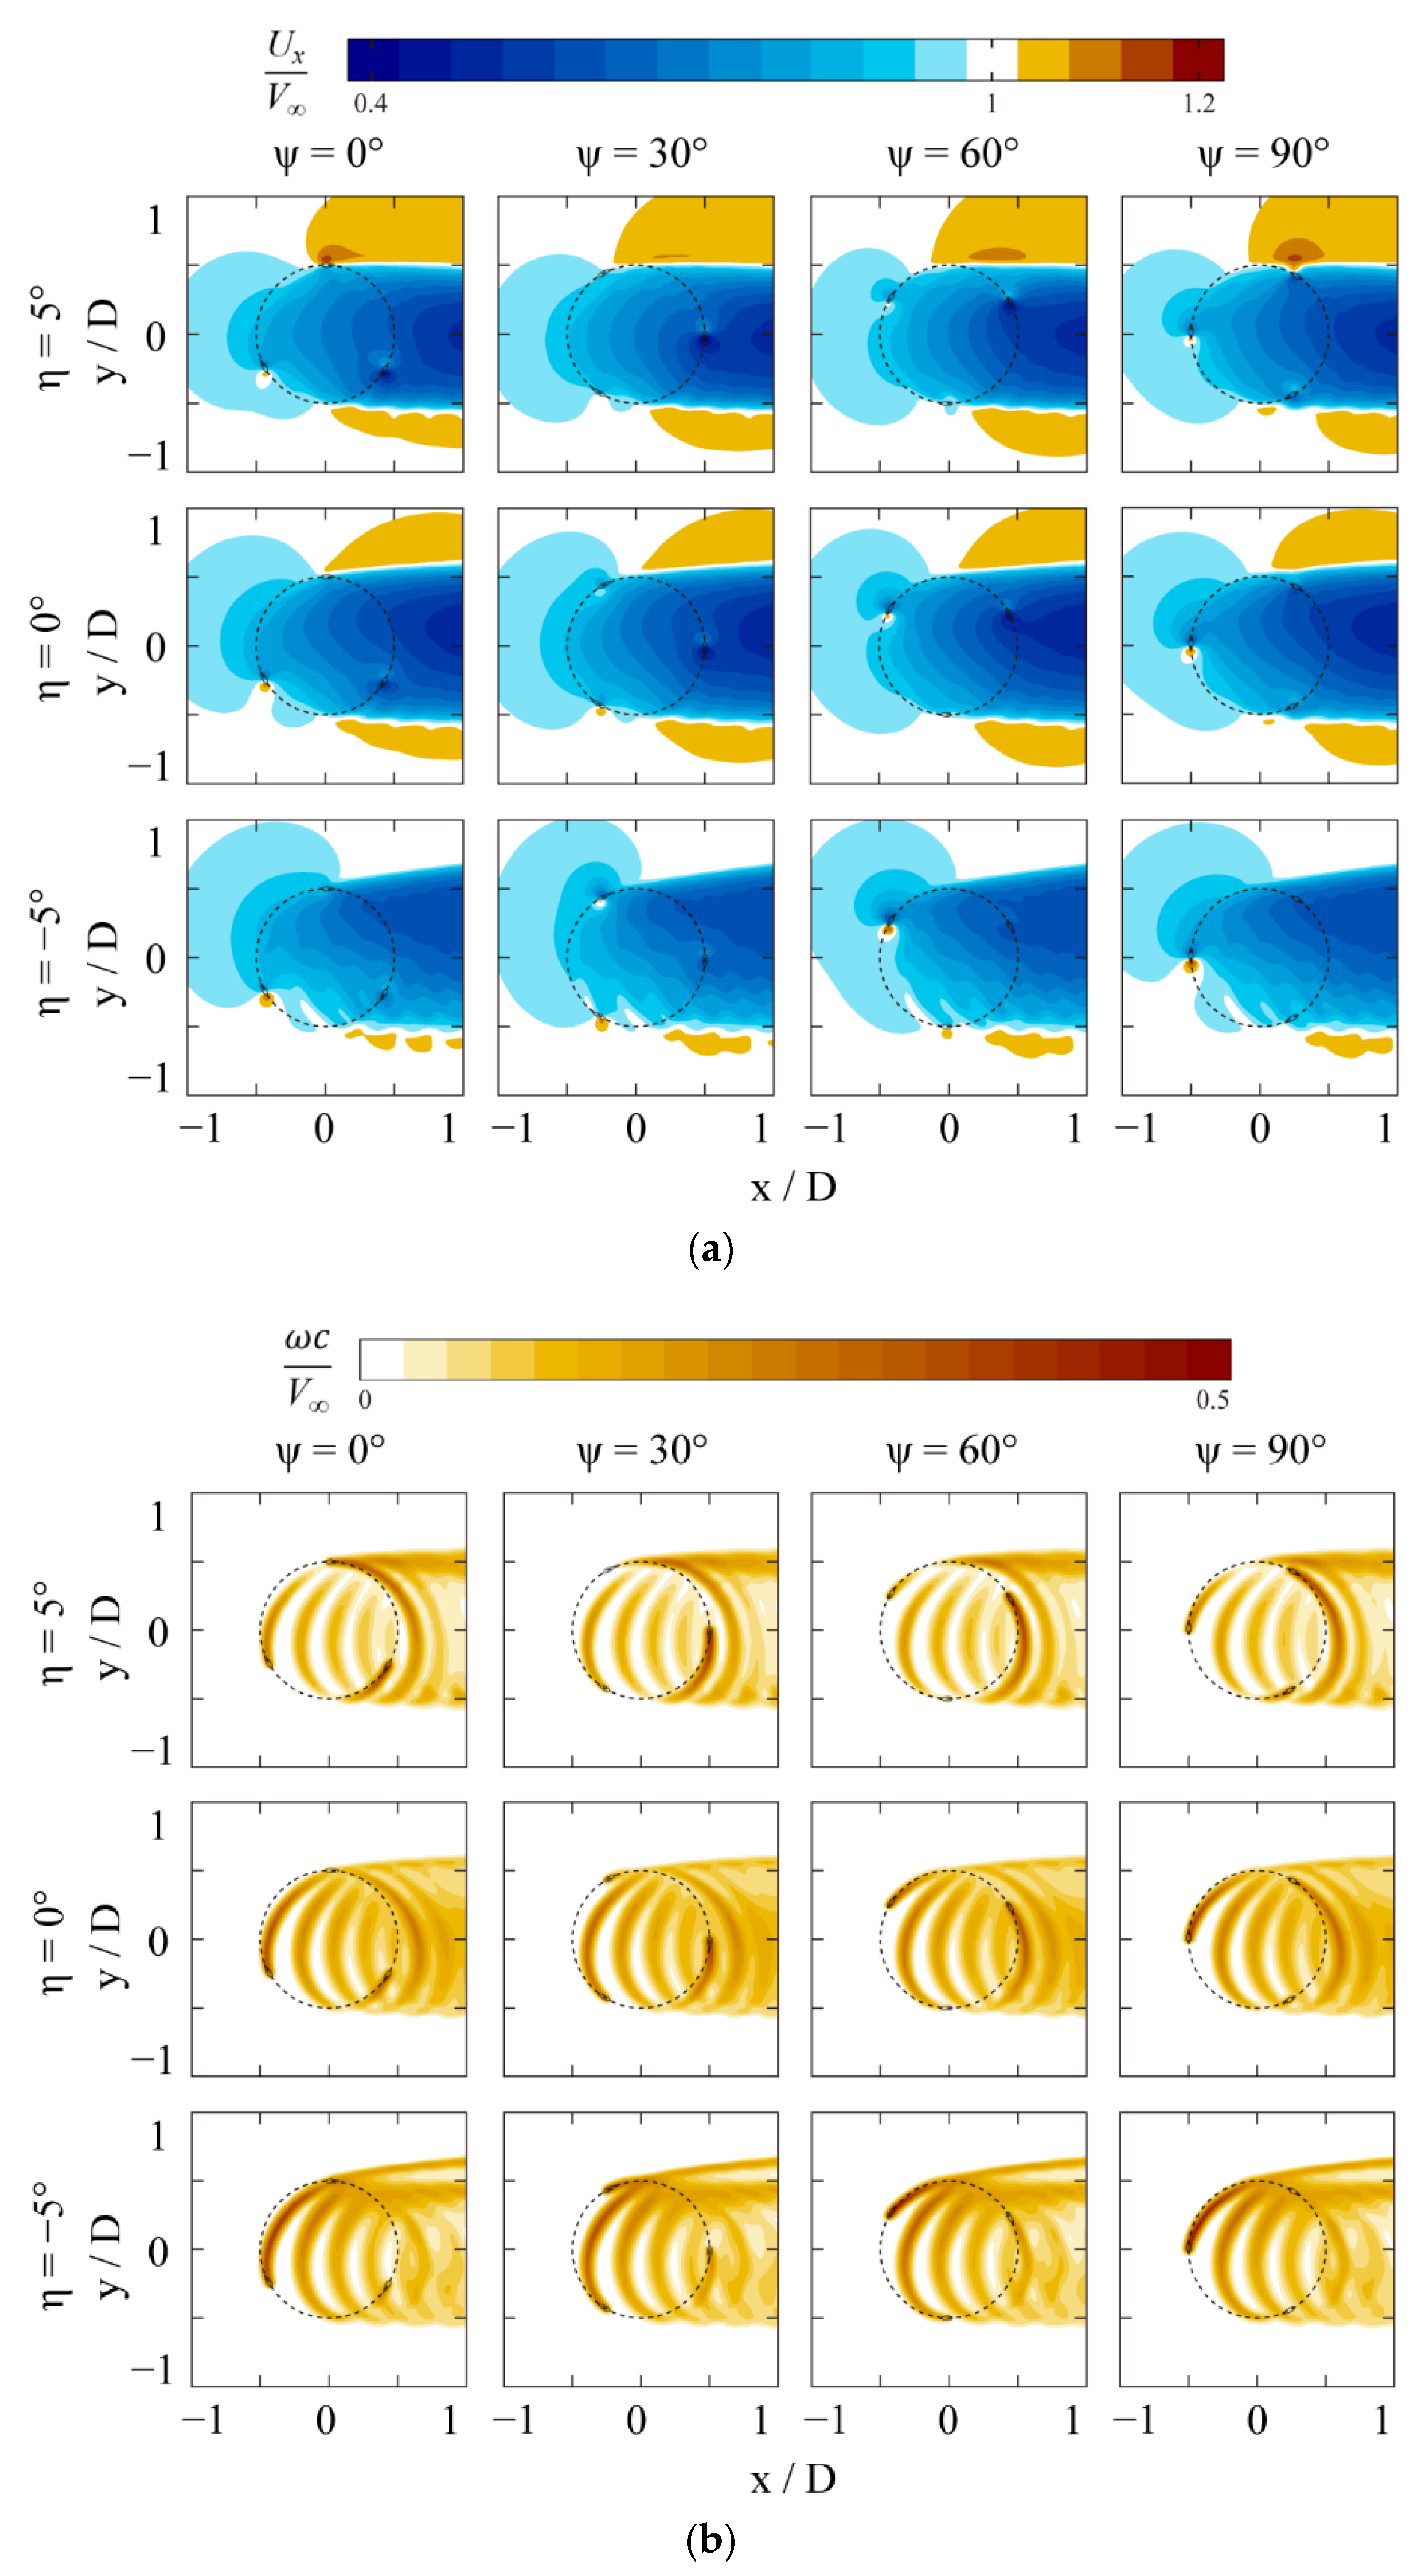
As can be seen from contours in Figure 10, flow around blades is smoothed due to characteristics of the ALM. When blades are folded in the positive direction ( η = 5 ° ), streamwise forces in the fore half are delayed with the peak at ψ = 90 ° , so deficits of streamwise velocities are skewed towards the centerplane at y/D = 0. In the contrary, when blades are folded in the negative direction ( η = 5 ° ), streamwise forces in the fore half are advanced with the peak at ψ = 60 ° , so deficits of streamwise velocities are skewed towards the windward side. In terms of magnitude of vorticities, when blades are folded in the positive direction ( η = 5 ° ), vorticities are weaker in the fore half and stronger in the aft half, and it is opposite with η = 5 ° , resulting in stronger blade–vortex interaction.

4.2. Instantaneous Flow Fields Downstream with Various Fold Angles

Instantaneous flow fields downstream of the wind turbine are analyzed when three blades are at certain positions with azimuthal angles of 30°, 150°, and 270°, respectively, so that they are symmetrical about the central vertical xz plane. The analysis mainly focuses on the downstream wake as far as x/D = 5.
Simulation results with the fold angle of 5.0° are evaluated first. Since blades are symmetrical about the equator, only the upper half of blades and flow fields are evaluated, as shown in Figure 11. Evident three-dimensional flow around the wind turbine is shown by contours. For streamwise velocities, velocity deficits of the wake on the equator are larger than those on the top plane, indicating more wind energy extracted by the wind turbine on the equator. Meanwhile, velocity acceleration on both sides of the wind turbine on the equator is stronger than that on the top plane. This is reasonable in consideration of the stronger blockage effect of the wind turbine on the equator. The center of the deficits is skewed towards the leeward side, the maximum deficits located at y/D = −0.20 on the equator at x/D = 5 (from Figure 12). In addition, the breadth of deficits on the equator is 0.46 D narrower than that on the top plane, comparing from y/D = −0.63 to y/D = 0.25 on the equator with from y/D = −0.65 to y/D = 0.69 on the equator. These can be explained by lateral velocities of the flow field (as is mentioned by Villeneuve et al. [22]). It is found from the contours that lateral velocities of the wake on the equator are stronger than those on the top plane, especially on the windward side of the wind turbine, in accordance with the aerodynamic results. Lateral velocities downstream are in the opposite direction from those around the wind turbine, flowing towards middle on the equator. Therefore, downstream flows on the windward side have stronger convection and momentum transport, along with faster velocity recovery. Since the equator is the plane of symmetry of flow fields, vertical velocities on the equator are zero. However, vertical velocities on the top plane can be observed because of three-dimensional effect. Vertical velocities at the center of the wake are upwards and those on both sides of the wind turbine are downwards, indicating that trailing tip vortices of blades are away from the blades on the leeward side and towards the blades on the windward side. As for turbulence kinetic energy, peaks are at both sides of the wake and dramatically increase downstream (as is mentioned by Posa [14]). They are skewed towards the leeward side, and the distribution on the top plane is wider than that on the equator. Similar to vertical velocities, the magnitude of vorticities on the top plane is greater than that on the equator, again revealing three-dimensional flow.
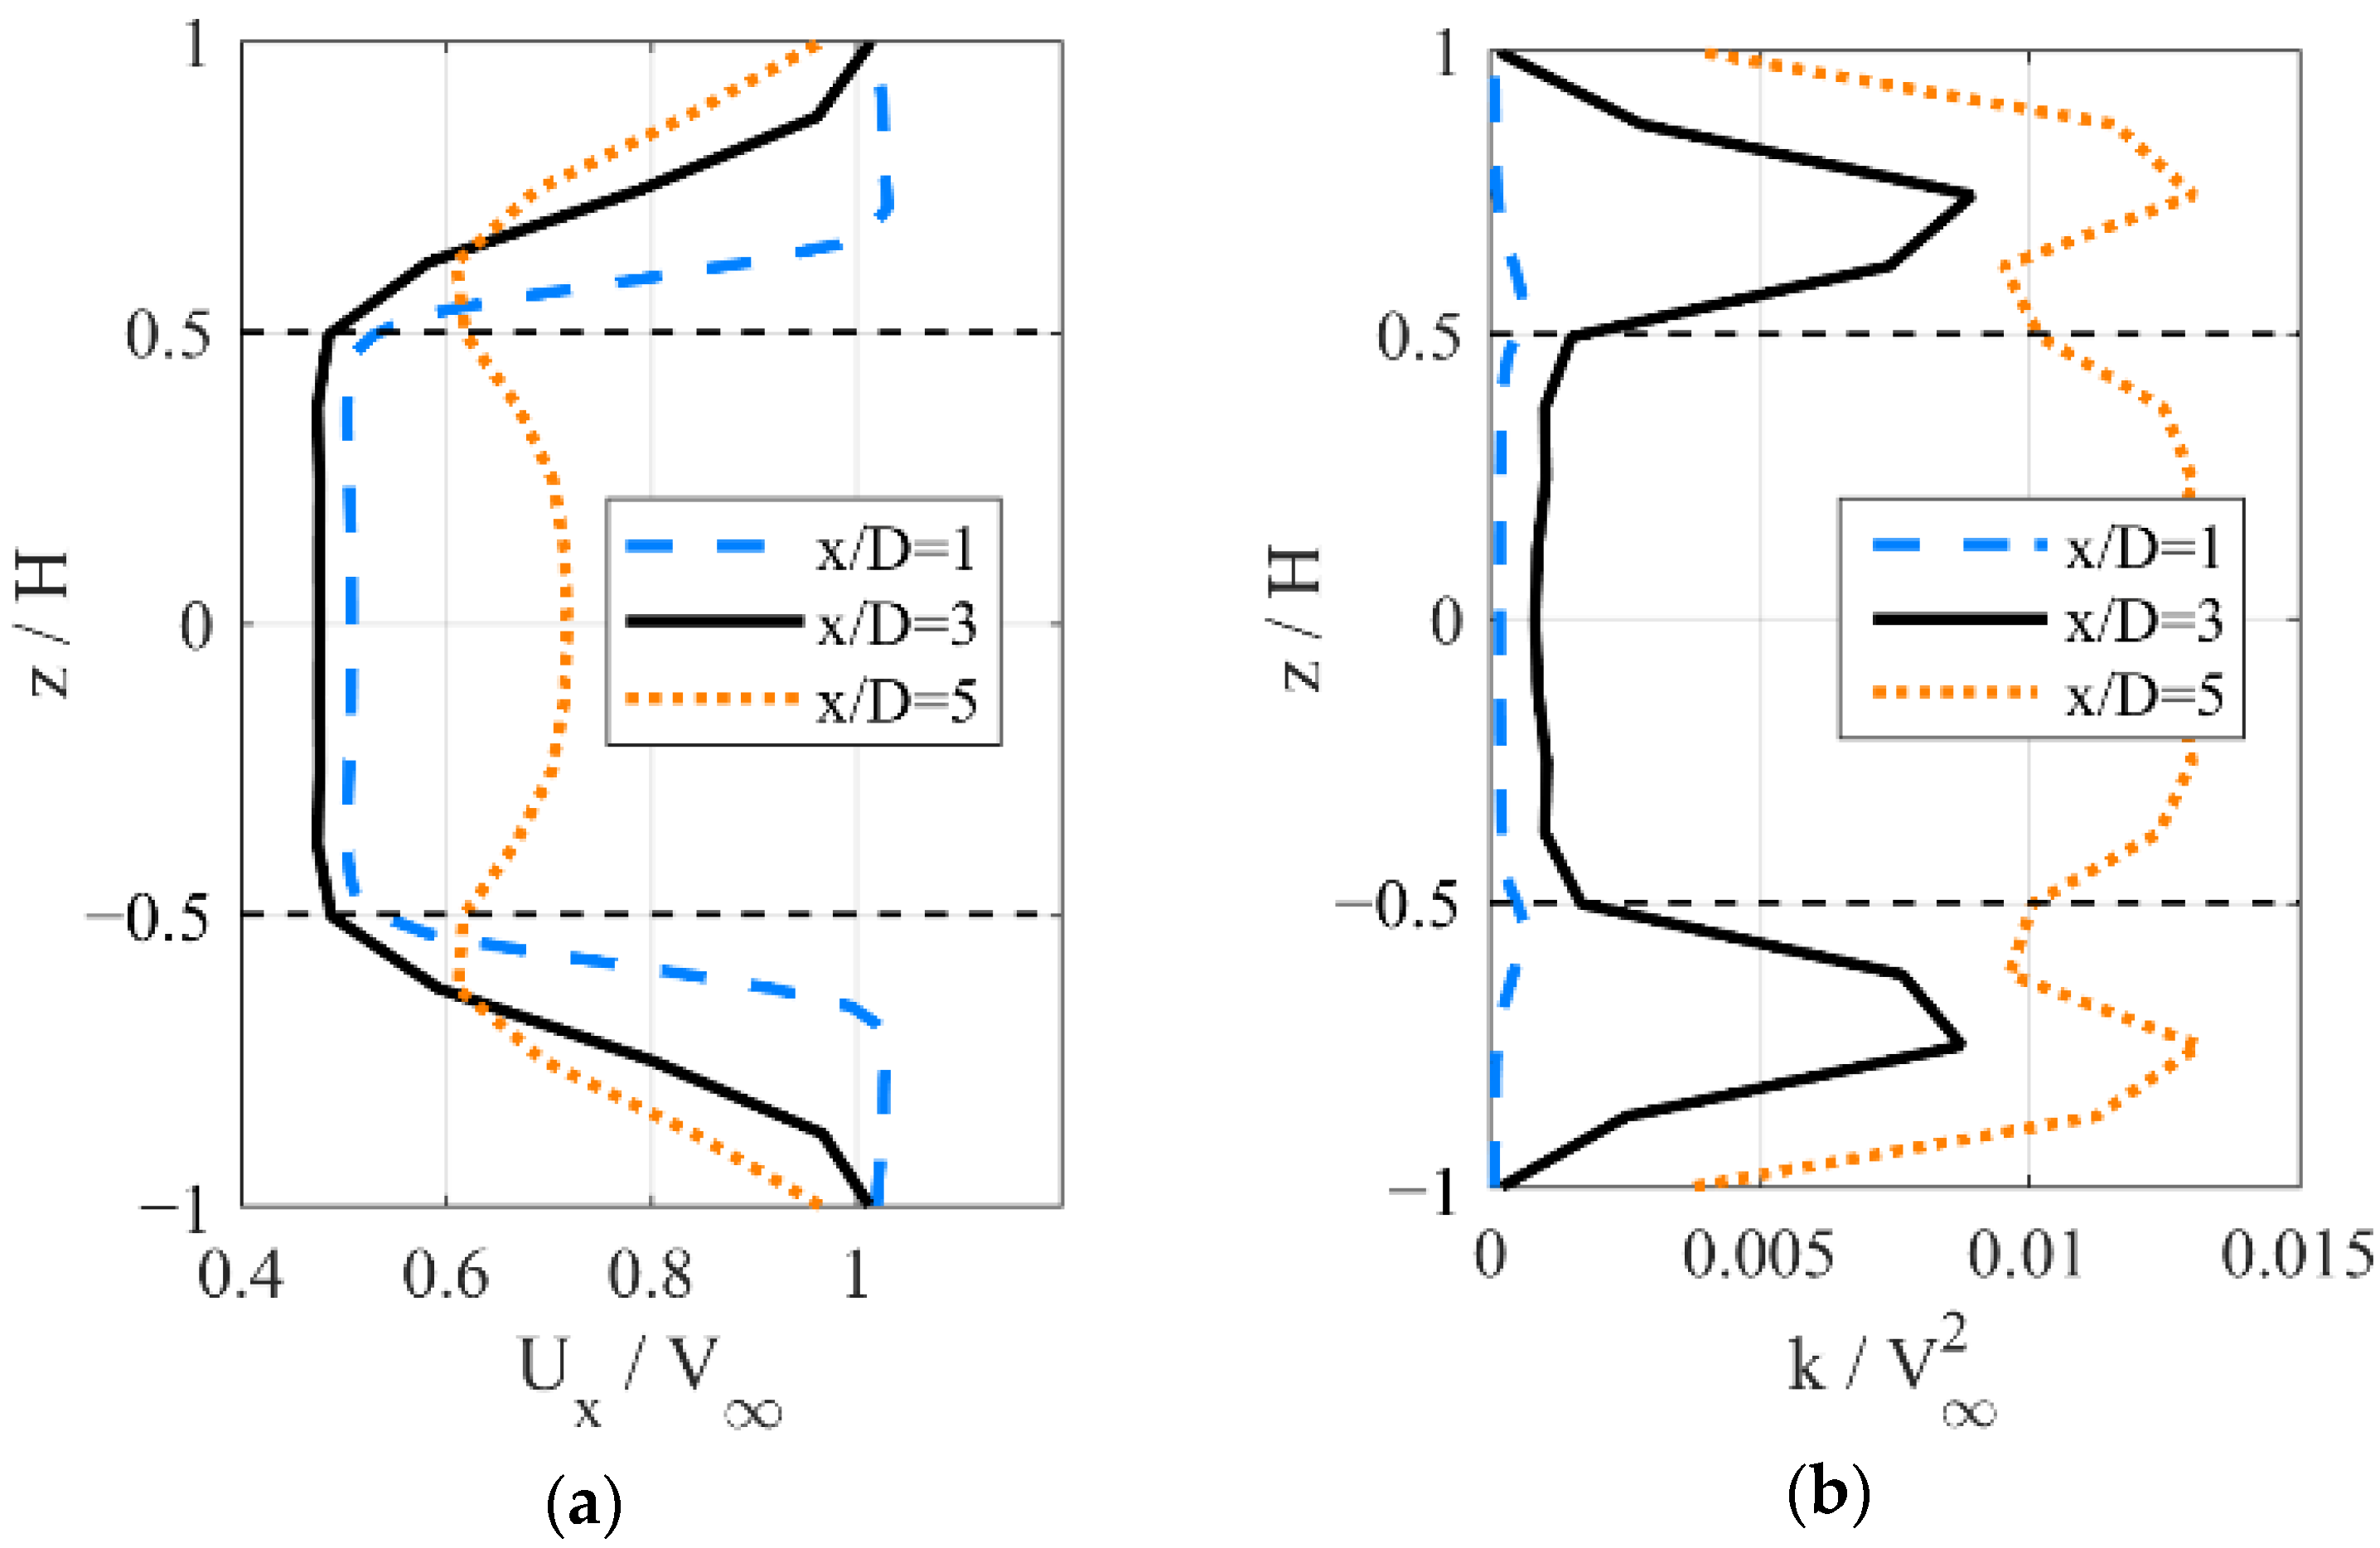
As for flow fields on xz planes (Figure 16, η = 5 ° ), variations along the blade span can be found. For streamwise velocities, deficits are nearly uniform in the shadow of blades in the near wake, and there are large velocity gradients outside of blade tips. In the far wake, velocities recover faster near the equator and maximum deficits appear near blade tips. In addition, velocity deficits develop broader in the vertical direction from 1.33 H at x/D = 1 to more than 2 H at x/D = 5 (Figure 13). According to findings from horizontal planes, lateral velocities are assessed at y/D = 0.5 instead of y/D = 0. Lateral velocities are in the direction of the –y axis in the center of wake while in the opposite direction outside of blade tips, indicating that trailing tip vortices of blades are towards the blades on the upward side and away from the blades on the downward side. Vertical velocities are relatively weak in the direction away from the centerline. For turbulence kinetic energy, two symmetric peaks are found outside of blade tips at z/H = ±0.75, and it grows in the shadow of the blades. Meanwhile, two valleys can be observed near blade tips in the far wake, in the same position as those of streamwise velocities. For the magnitude of vorticities, tip vortices are shown clearly, becoming weak in the far wake.
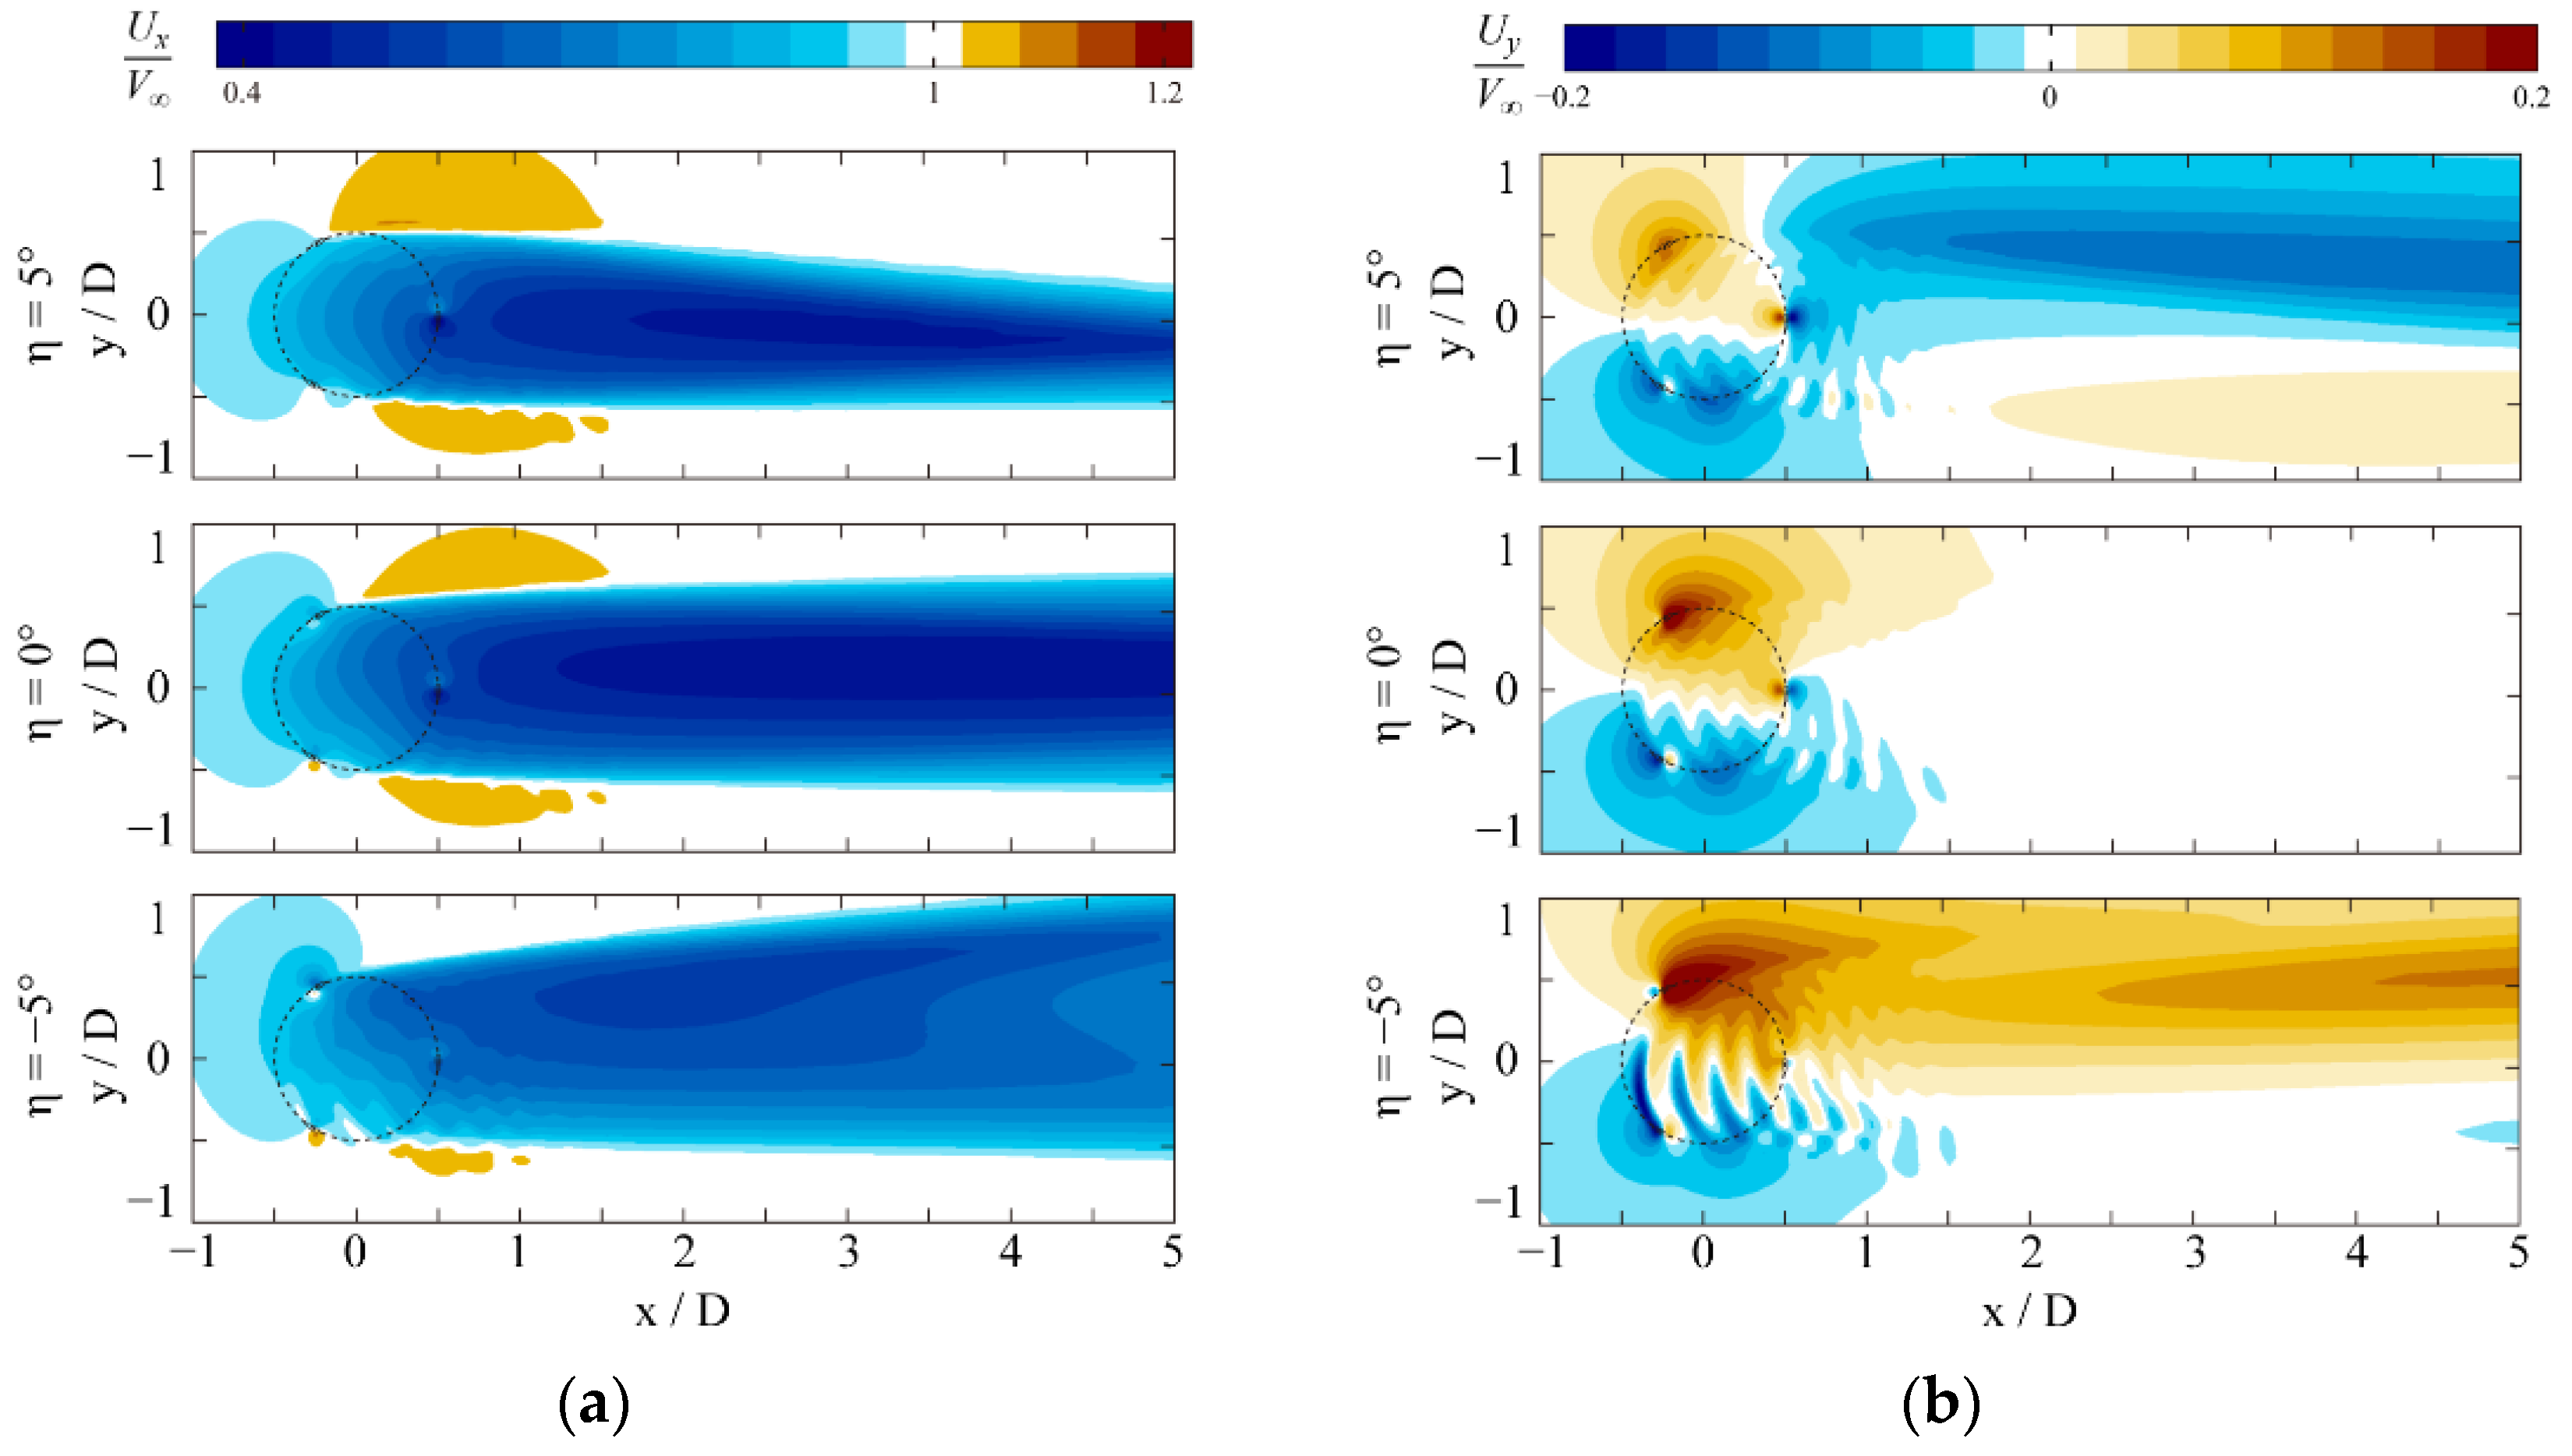
Next, simulations with various fold angles are compared, as shown in Figure 14. As for streamwise velocities, maximum normalized velocity deficits of the wake are 0.55, 0.57, and 0.44 with η = 5 ° , 0°, and −5°, which accords to the average streamwise force coefficients of 8.0, 8.0, and 6.8, respectively. Meanwhile, velocity acceleration on both sides of the wind turbine can be observed with η = 5 ° and 0° while it barely exists with η = 5 ° , corresponding to blockage effect of the wind turbine. From Figure 15, the center of the deficits with η = 0 ° stays at y/D = 0.14 along the wake, but it is skewed towards the leeward side with η = 5 ° , located at y/D = −0.20 at x/D = 5. In addition, it is skewed in the opposite towards the windward side with η = 5 ° , located at y/D = 0.77. The breadth of deficits with η = 5 ° is narrower than that with η = 5 ° , comparing 0.88 D with more than 1.67 D at x/D = 5. These can be explained by lateral forces and lateral velocities. Lateral force increases in the windward half while modestly decreases in the leeward half with the positive fold angle, which means that the positive fold angle strengthens the wake towards the middle, especially in the windward half. The negative fold angle has the opposite effect. It is supported by contours of lateral velocities as well. The effect of fold angles to the distribution of turbulence kinetic energy on the equators is similar to that of streamwise velocity deficits. Furthermore, vertical velocities and the magnitude of vorticities are assessed on the top planes for the sake of clarity. Values of vertical velocities with η = 0 ° are quite tiny in the wake, but vertical velocities with η = 5 ° and −5° are in the opposite direction, indicating that the trailing tip vortices of blades with η = 5 ° and −5° are in the opposite direction, too. As for vorticities, they decrease in the middle of the wake with η = 5 ° compared to that with η = 0 ° , and these generate mainly in the windward side with η = 5 ° .
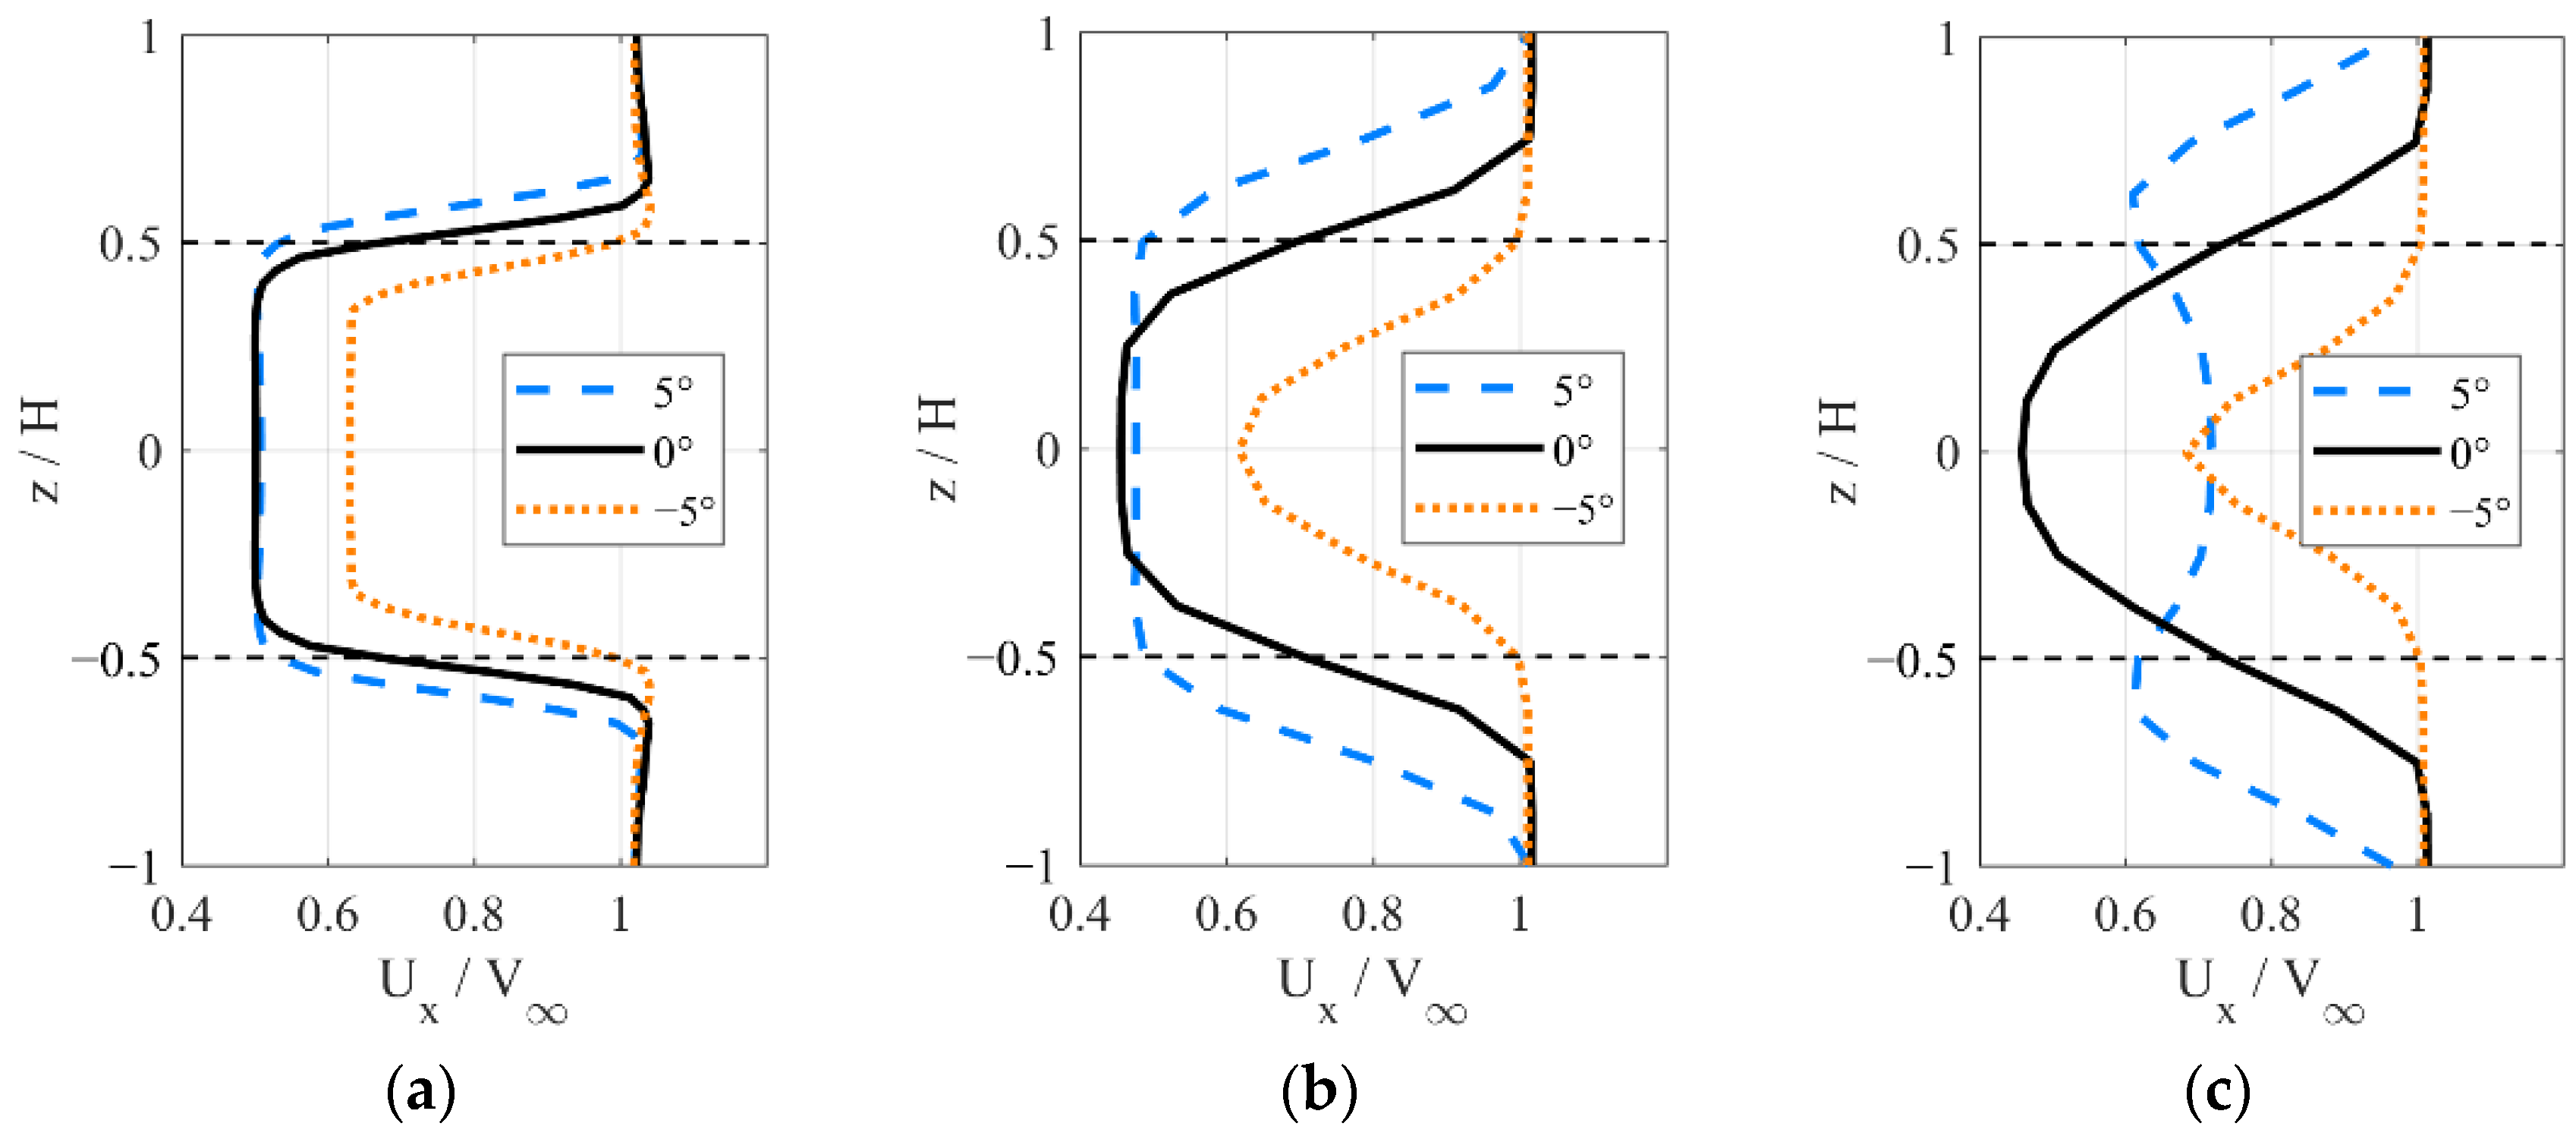
As for flow fields on xz planes, distinct differences can be seen in the contours of Figure 16. For streamwise velocities, as is mentioned before, maximum velocity deficits are close under conditions of η = 5 ° and 0°, greater than those with η = 5 ° . The vertical breadth of deficits with η = 5 ° becomes larger in the wake while that with η = 5 ° slightly decreases (Figure 17), which can be explained by vertical velocities. Flows with η = 5 ° are from equators to both sides in the vertical planes, resulting in the spread of deficits, and flows with η = 5 ° are in the opposite direction, narrowing the range of variables. The phenomena can also be seen for turbulence kinetic energy and vorticities. In addition, under conditions of η = 0 ° and −5°, minimum streamwise velocity recovery in the wake is on the equators, which is quite different with η = 5 ° . Obvious velocity acceleration is seen outside of blade tips in the fore half with η = 5 ° . Lateral velocities with η = 5 ° are in the opposite direction to those with η = 5 ° because of the trailing tip vortices of blades in the opposite direction.
Furthermore, the wake on yz planes is assessed to analyze the potential effect of the wake in a wind farm (shown in Figure 18). Streamwise vorticities are assessed at x/D = 1, right behind the wind turbine. Values of vorticities are small with η = 0 ° and both directions of vortices are present at each tip of the blades. When blades are folded, streamwise vorticities are strengthened and only one direction of vortices emerges at each tip of the blades. The directions of tip vortices are opposite with η = 5 ° and 5°, as discussed above. For streamwise velocities, the distribution of deficits is quite different with various fold angles. Deficits are concentrated in the shadow of the wind turbine with η = 0 ° , slightly stronger in the windward side. When blades are folded in the positive direction, deficits are skewed towards the leeward side and expend in the vertical direction. Meanwhile, velocities in the windward side recover to the freestream velocity. In the contrary, when blades are folded in the negative direction, deficits are skewed towards the windward side, especially outside of the shadow of the wind turbine. Values of lateral and vertical velocities are small with η = 0 ° and grow larger when blades are folded. The directions of velocities are opposite with η = 5 ° and 5°. The distribution of turbulence kinetic energy is similar to that of streamwise velocities.

4.3. Instantaneous Flow Fields Downstream with Various Incline Angles

For a blade with an inclined pitch axis, description of the blade folding movement includes three Euler angles in BCS: pitch angle ( θ ) around negative z axis, flap angle ( β ) around negative x axis, and edge angle ( φ ) around y axis. Three angles are calculated as follows:
θ = arctan sin γ sin η sin 2 γ cos η + cos 2 γ ,
β = arctan cos γ sin η sin 2 γ + cos 2 γ cos η ,
φ = arcsin sin 2 γ sin 2 γ cos η 2 .
To investigate the effect of the incline angle, simulations in five cases are fulfilled where the incline angle is set to 30°, 60°, 90°, 120°, and 150°, with the fold angle of 10.0°, 5.8°, 5.0°, 5.8°, 10.0°, respectively, corresponding to the same equivalent pitch angle of 5.0°. It should be emphasized that the case where the incline angle is 90° is exactly the conventional pitch axis design.
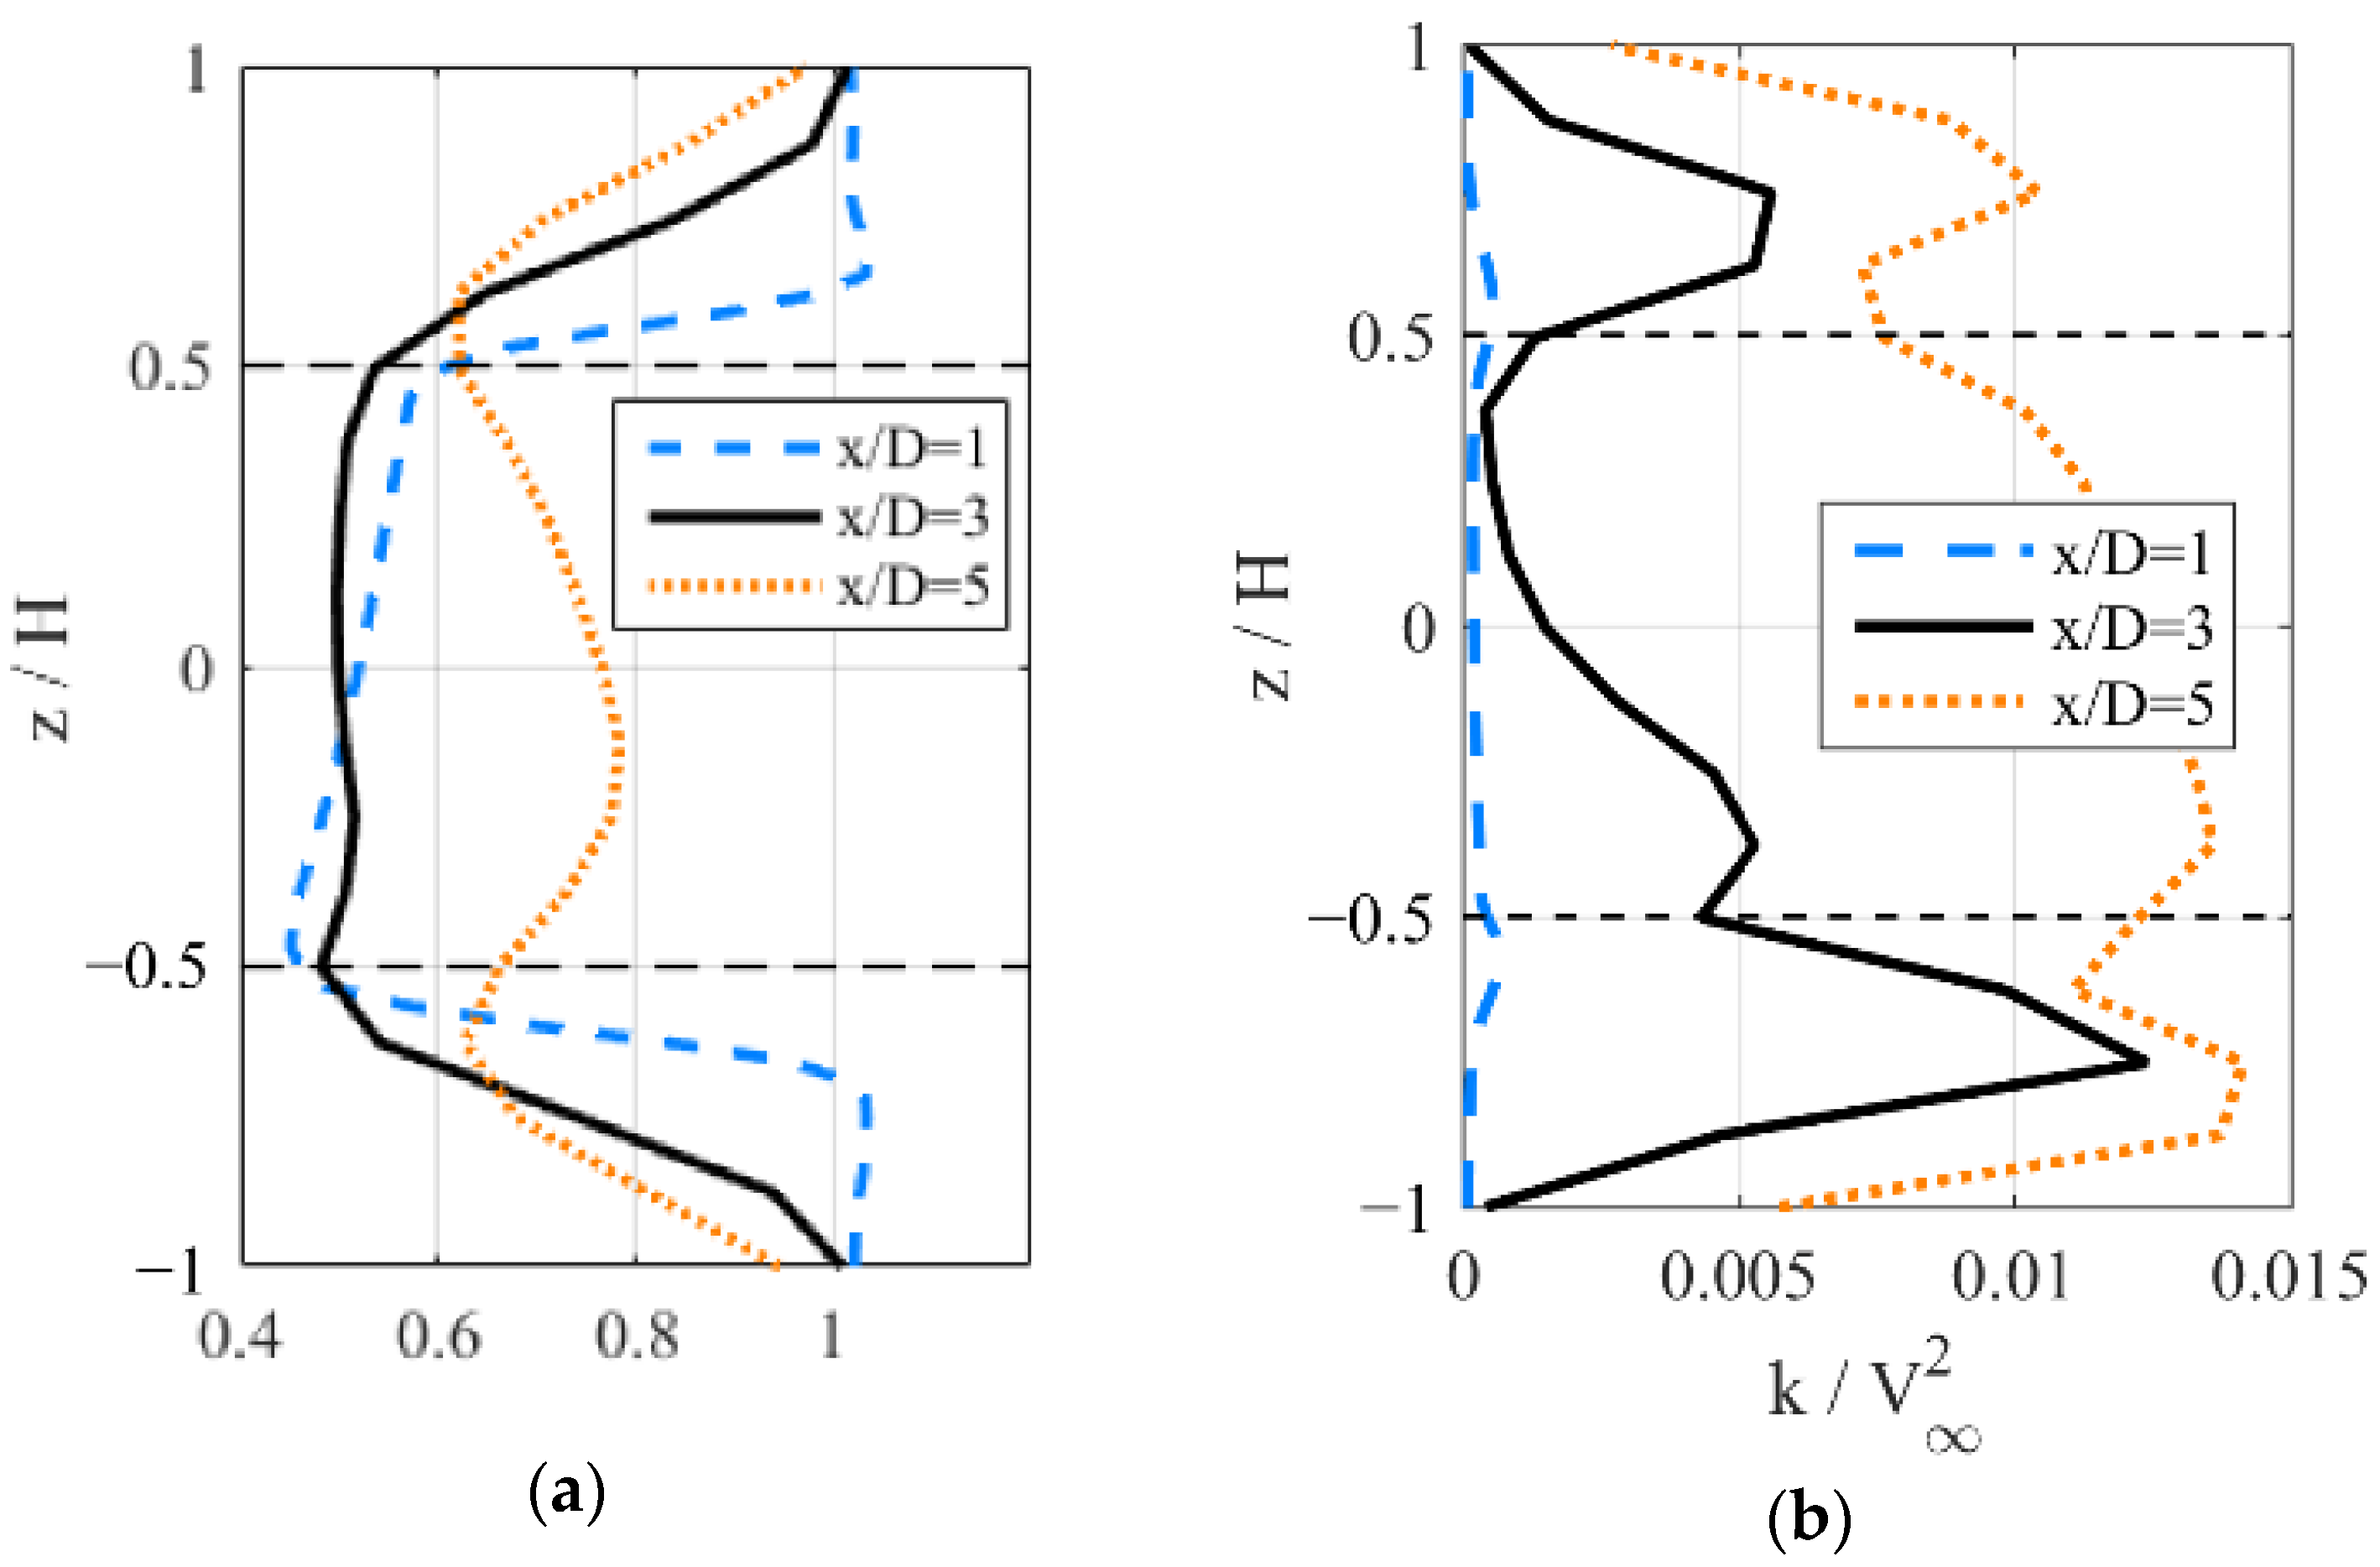
First, flow characteristics of the VAWT with the incline angle of 30° are discussed. In this case, the flap angle is 8.6°, meaning that tops of blades experience a larger circular trajectory than bottoms, whose effect on flow fields is exhibited clearly in the contours, and the edge angle is 0.4°. As shown in Figure 19, flow characteristics on the top and bottom plane show obvious differences. For streamwise velocities, velocity deficits of the near wake on the bottom plane are larger than those on the top plane and even the equator, as the minimum normalized velocities reach 0.46, 0.52, and 0.61 on the plane of z/H = −0.5, 0, 0.5 at x/D = 1 (Figure 20). In addition, the deficits recover fastest on the bottom plane. The breadth of deficits on the bottom plane is 0.24 D narrower than that on the top plane at x/D = 5. In addition, velocity acceleration on both sides of the wind turbine on the bottom plane is stronger than that on the top plane. For lateral velocities, the values on the bottom plane are slightly larger than those on the top plane. Vertical velocities on two planes are in the opposite direction, and more compact flow fields are found on the bottom plane corresponding to smaller trajectory of blade tips. The same is true for vorticities. For turbulence kinetic energy, the values in the far wake on the bottom plane are larger than those on the top plane, and the breadth on the bottom plane is narrower.
In terms of flow fields on the xz planes, asymmetry can be observed because of the flapwise angle (Figure 22 with γ = 30 ° ). For streamwise velocities, deficits in the lower side of blades are larger than those in the upper side in the near wake, but recovery in the lower side is faster in the far wake. At x/D = 1, the velocity of 0.45 V at z/H = −0.5 is 25% lower than that of 0.60 V at z/H = 0.5 (Figure 21). At x/D = 3, the velocities are close to uniform in the shadow of the blades, and at x/D = 5, the maximum recovery of 0.78 V appears at z/H = 0.13, near the middle of the lower side. Turbulence kinetic energy is much stronger in the lower side than that in the upper side. Peaks in the lower side are 55% and 26% higher than those in the upper side at x/D = 3 and 5, respectively. As for lateral velocities and vertical velocities, asymmetry is not quite clear. Tip vortices are trapezoidally distributed, corresponding to the shape of folded blades.
As for the VAWT with the incline angle of 150°, flow characteristics are similar to those of the VAWT with the incline angle of 30° upside down in the vertical direction, indicating that the effect of the edge angle is hardly observed and can be negligible to some extent.
Next, simulation results under conditions of various incline angles are compared. Flow fields on the equators with various incline angles are roughly identical with one another, including vertical velocities with quite tiny differences.
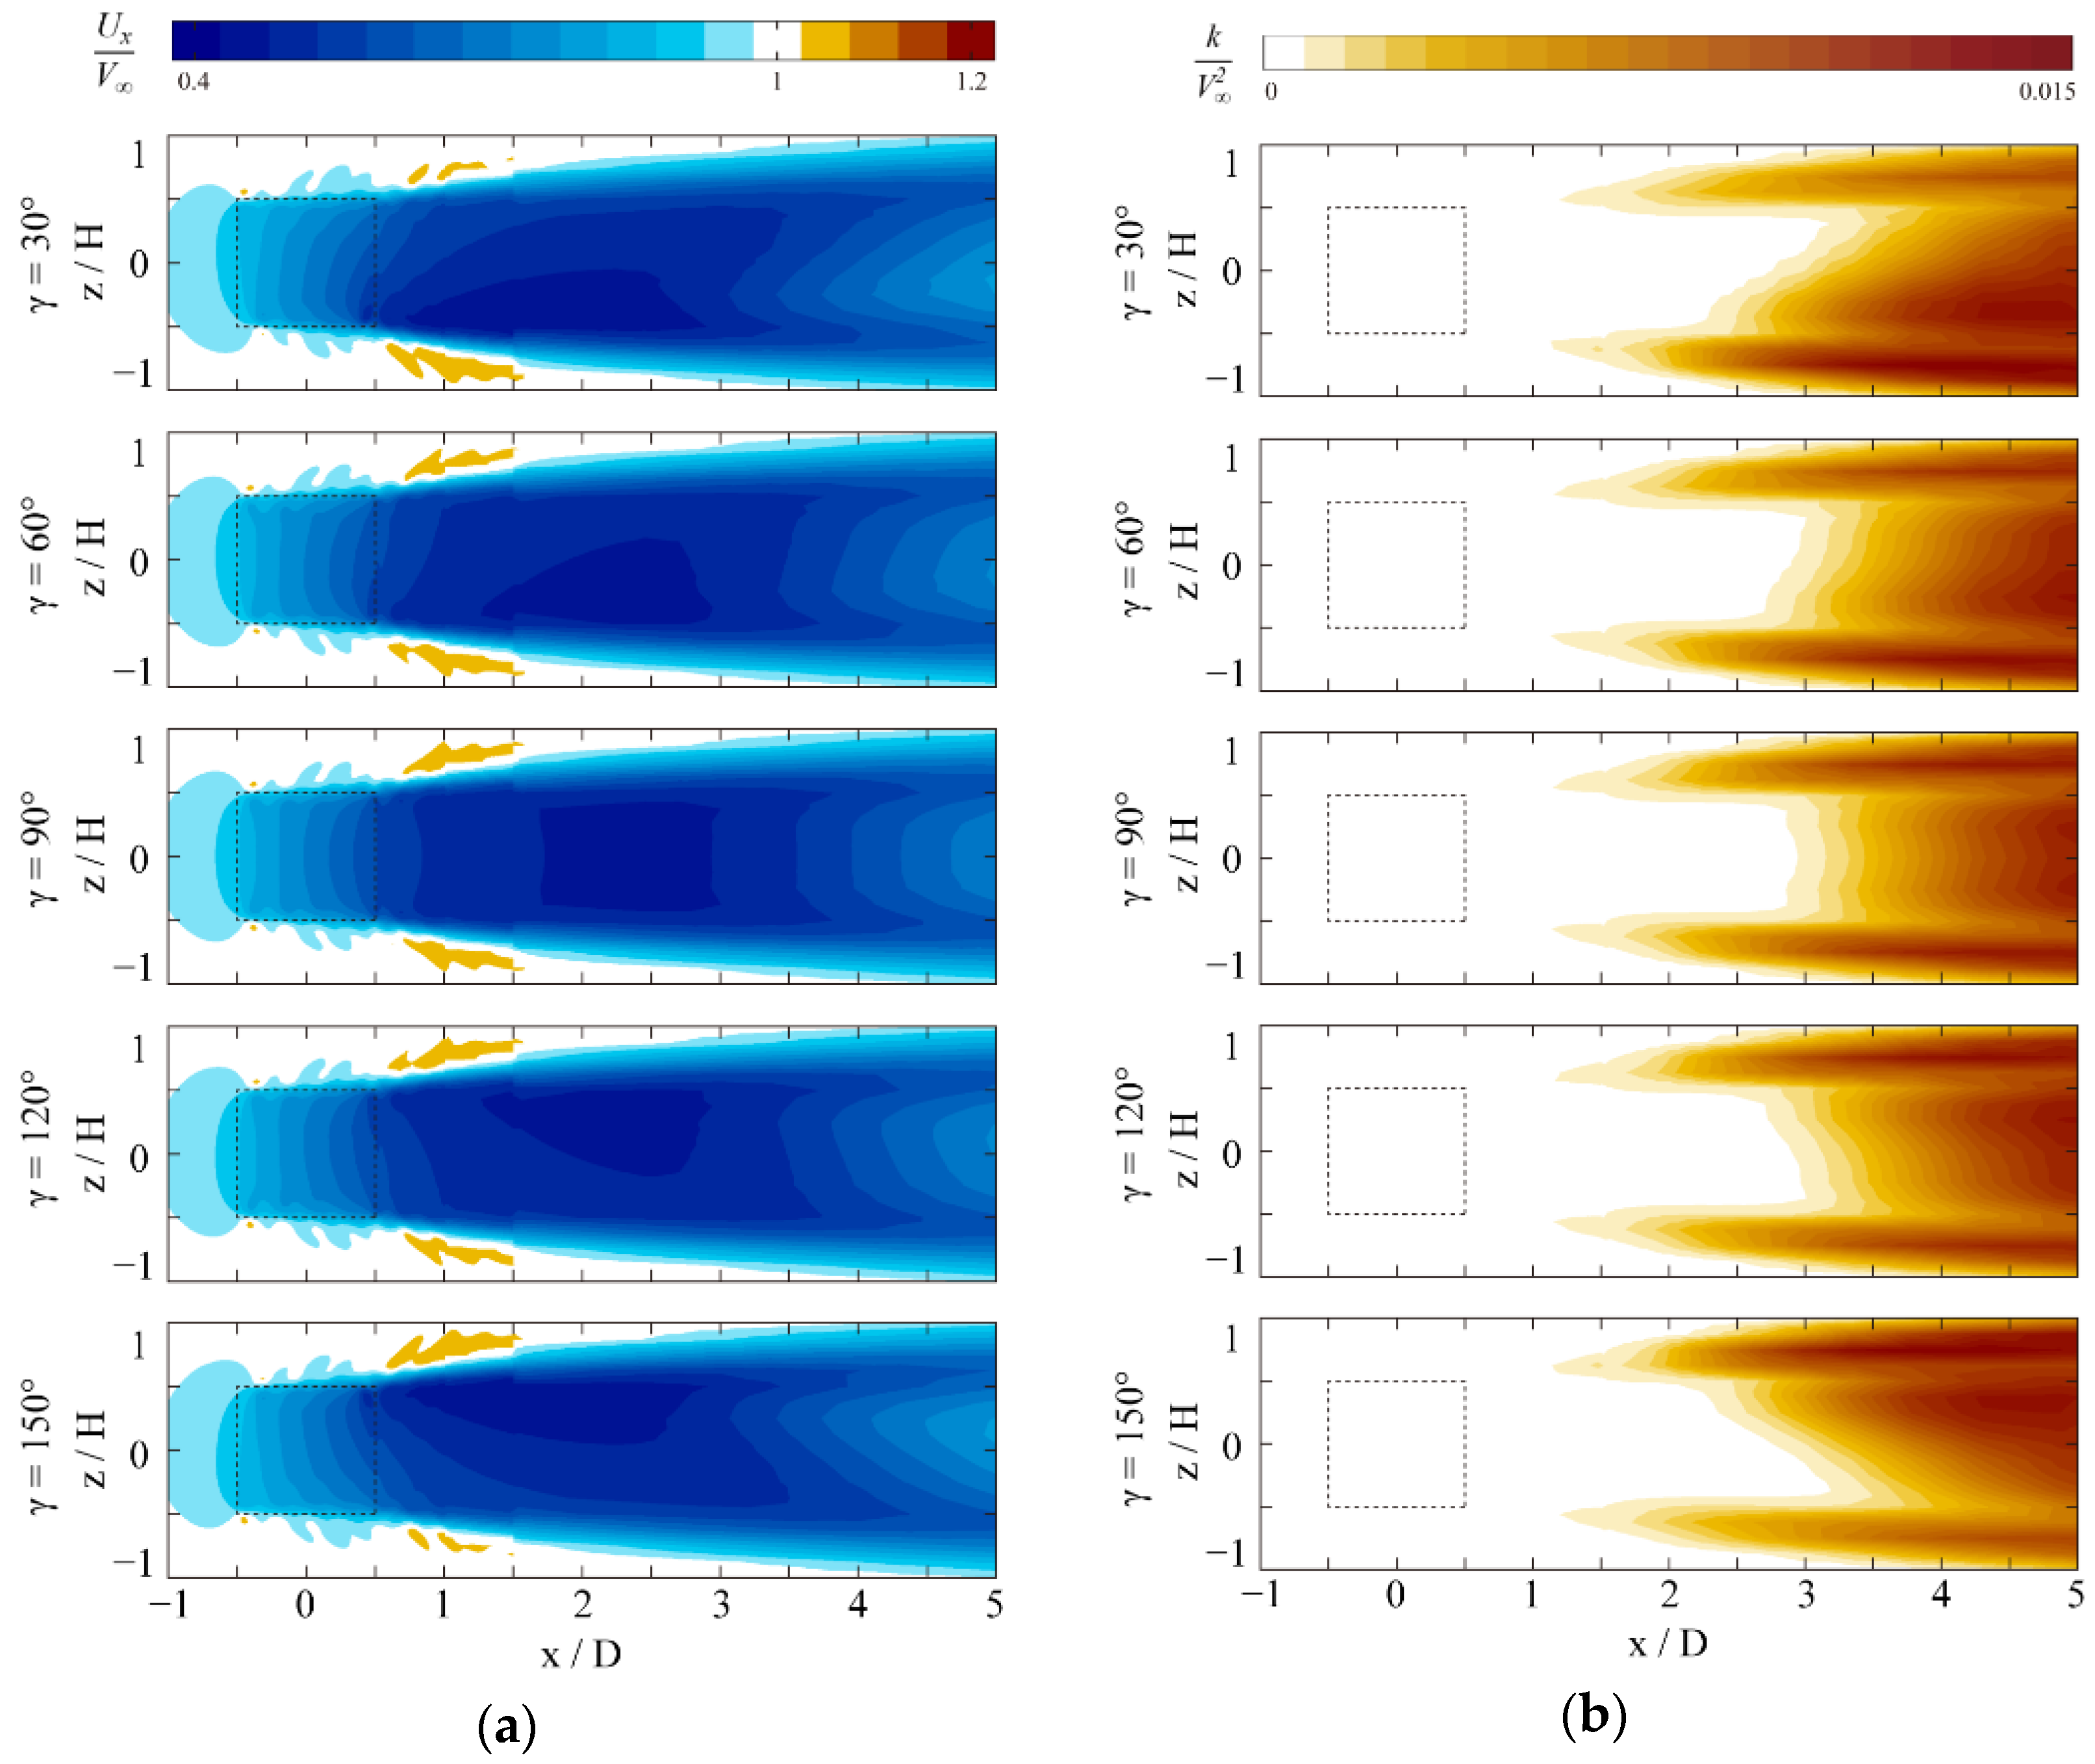
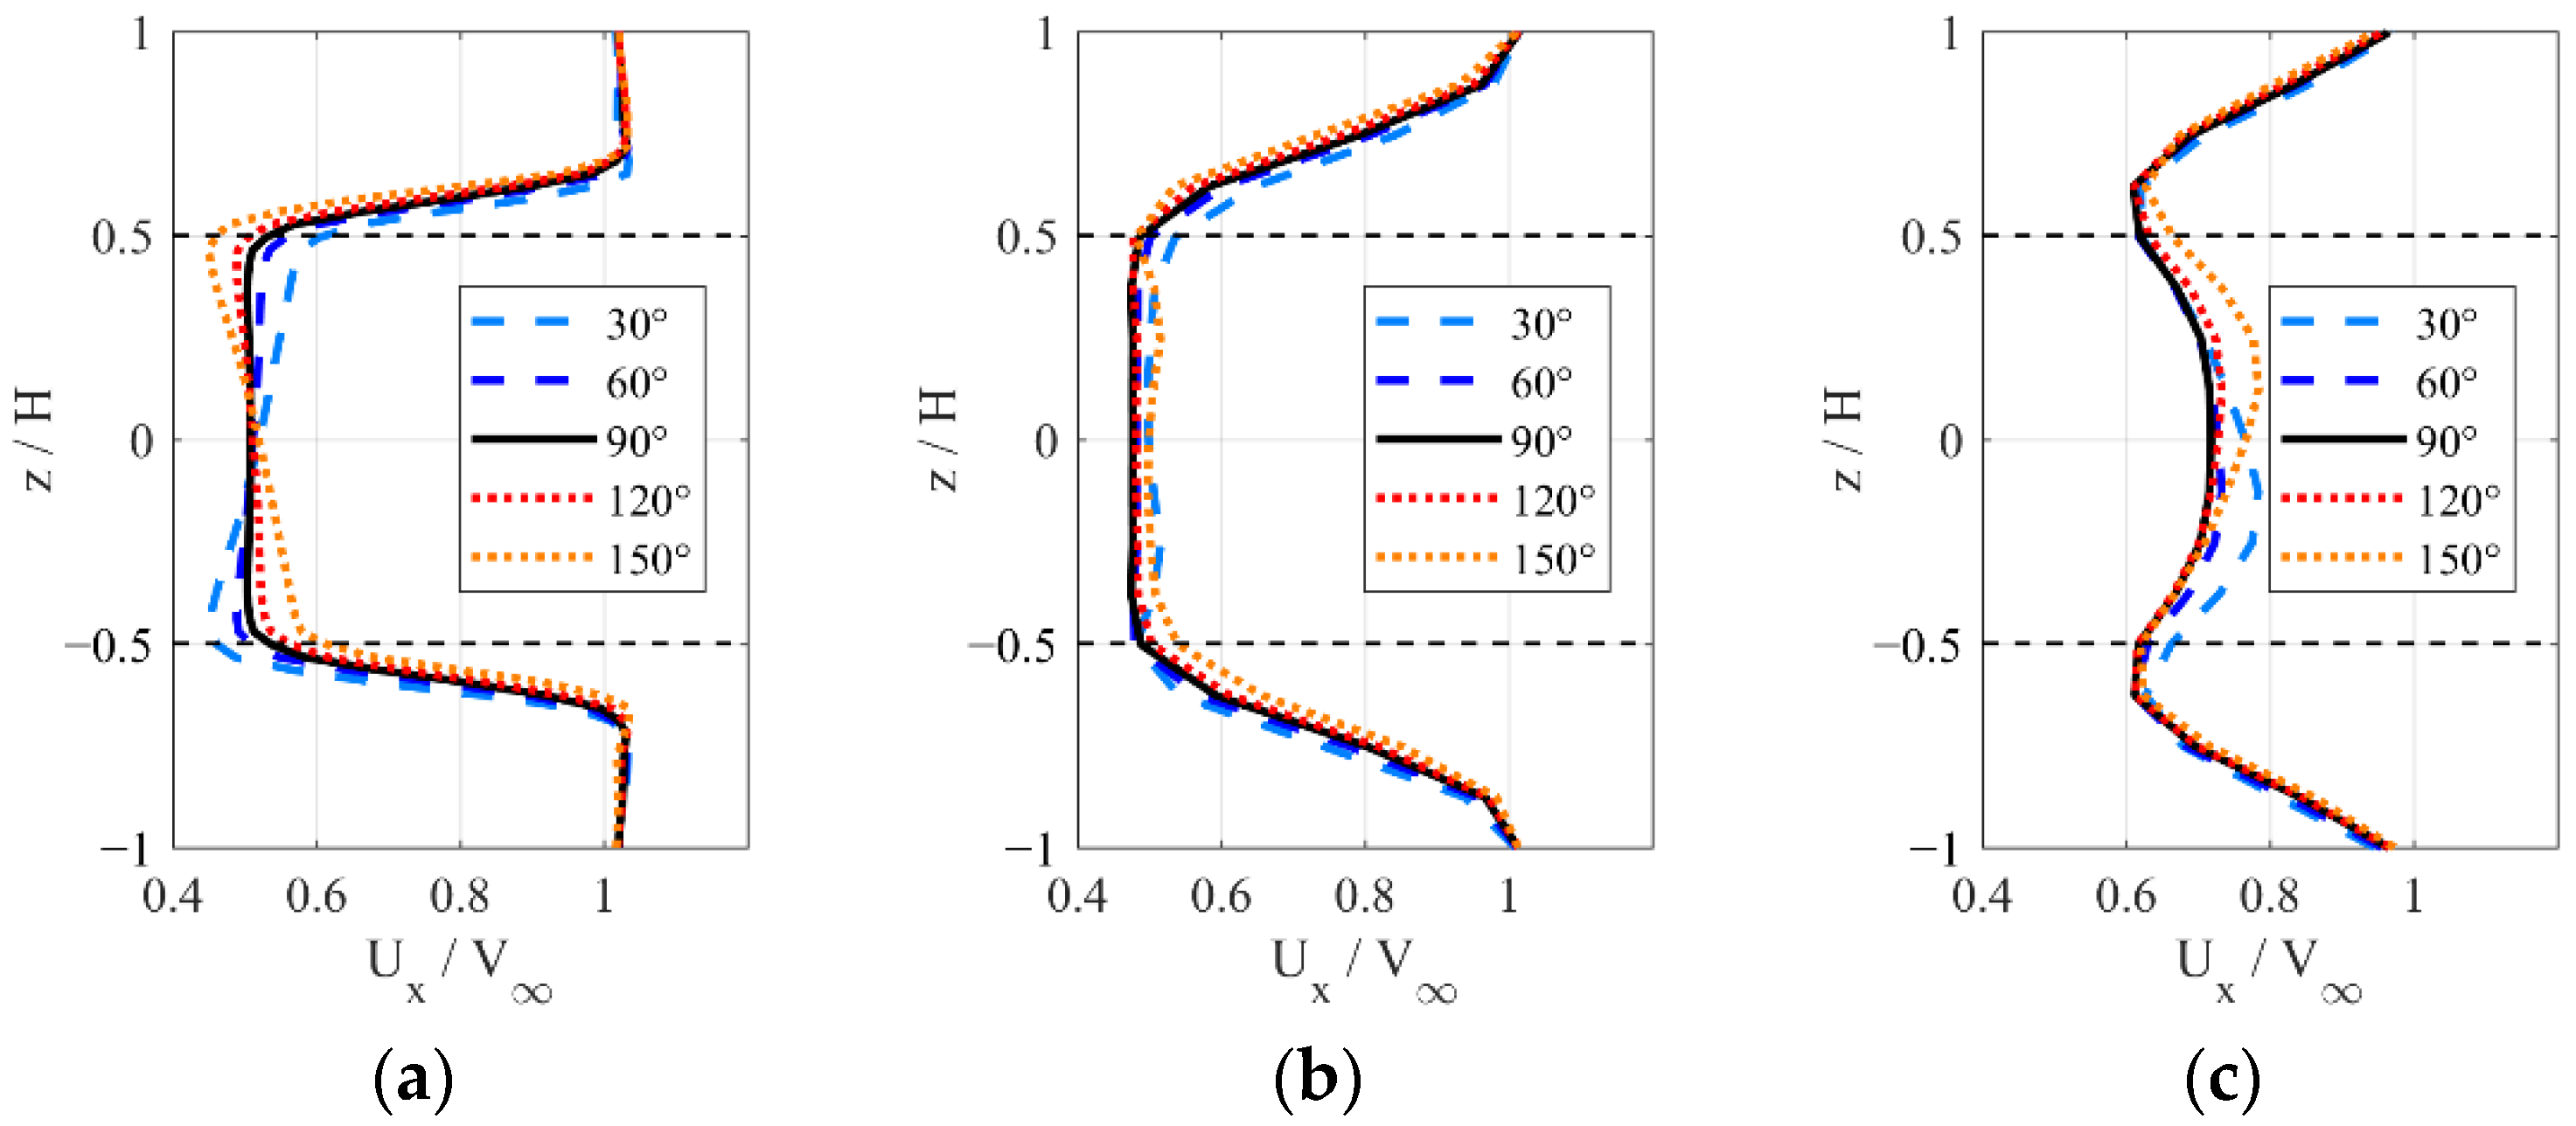
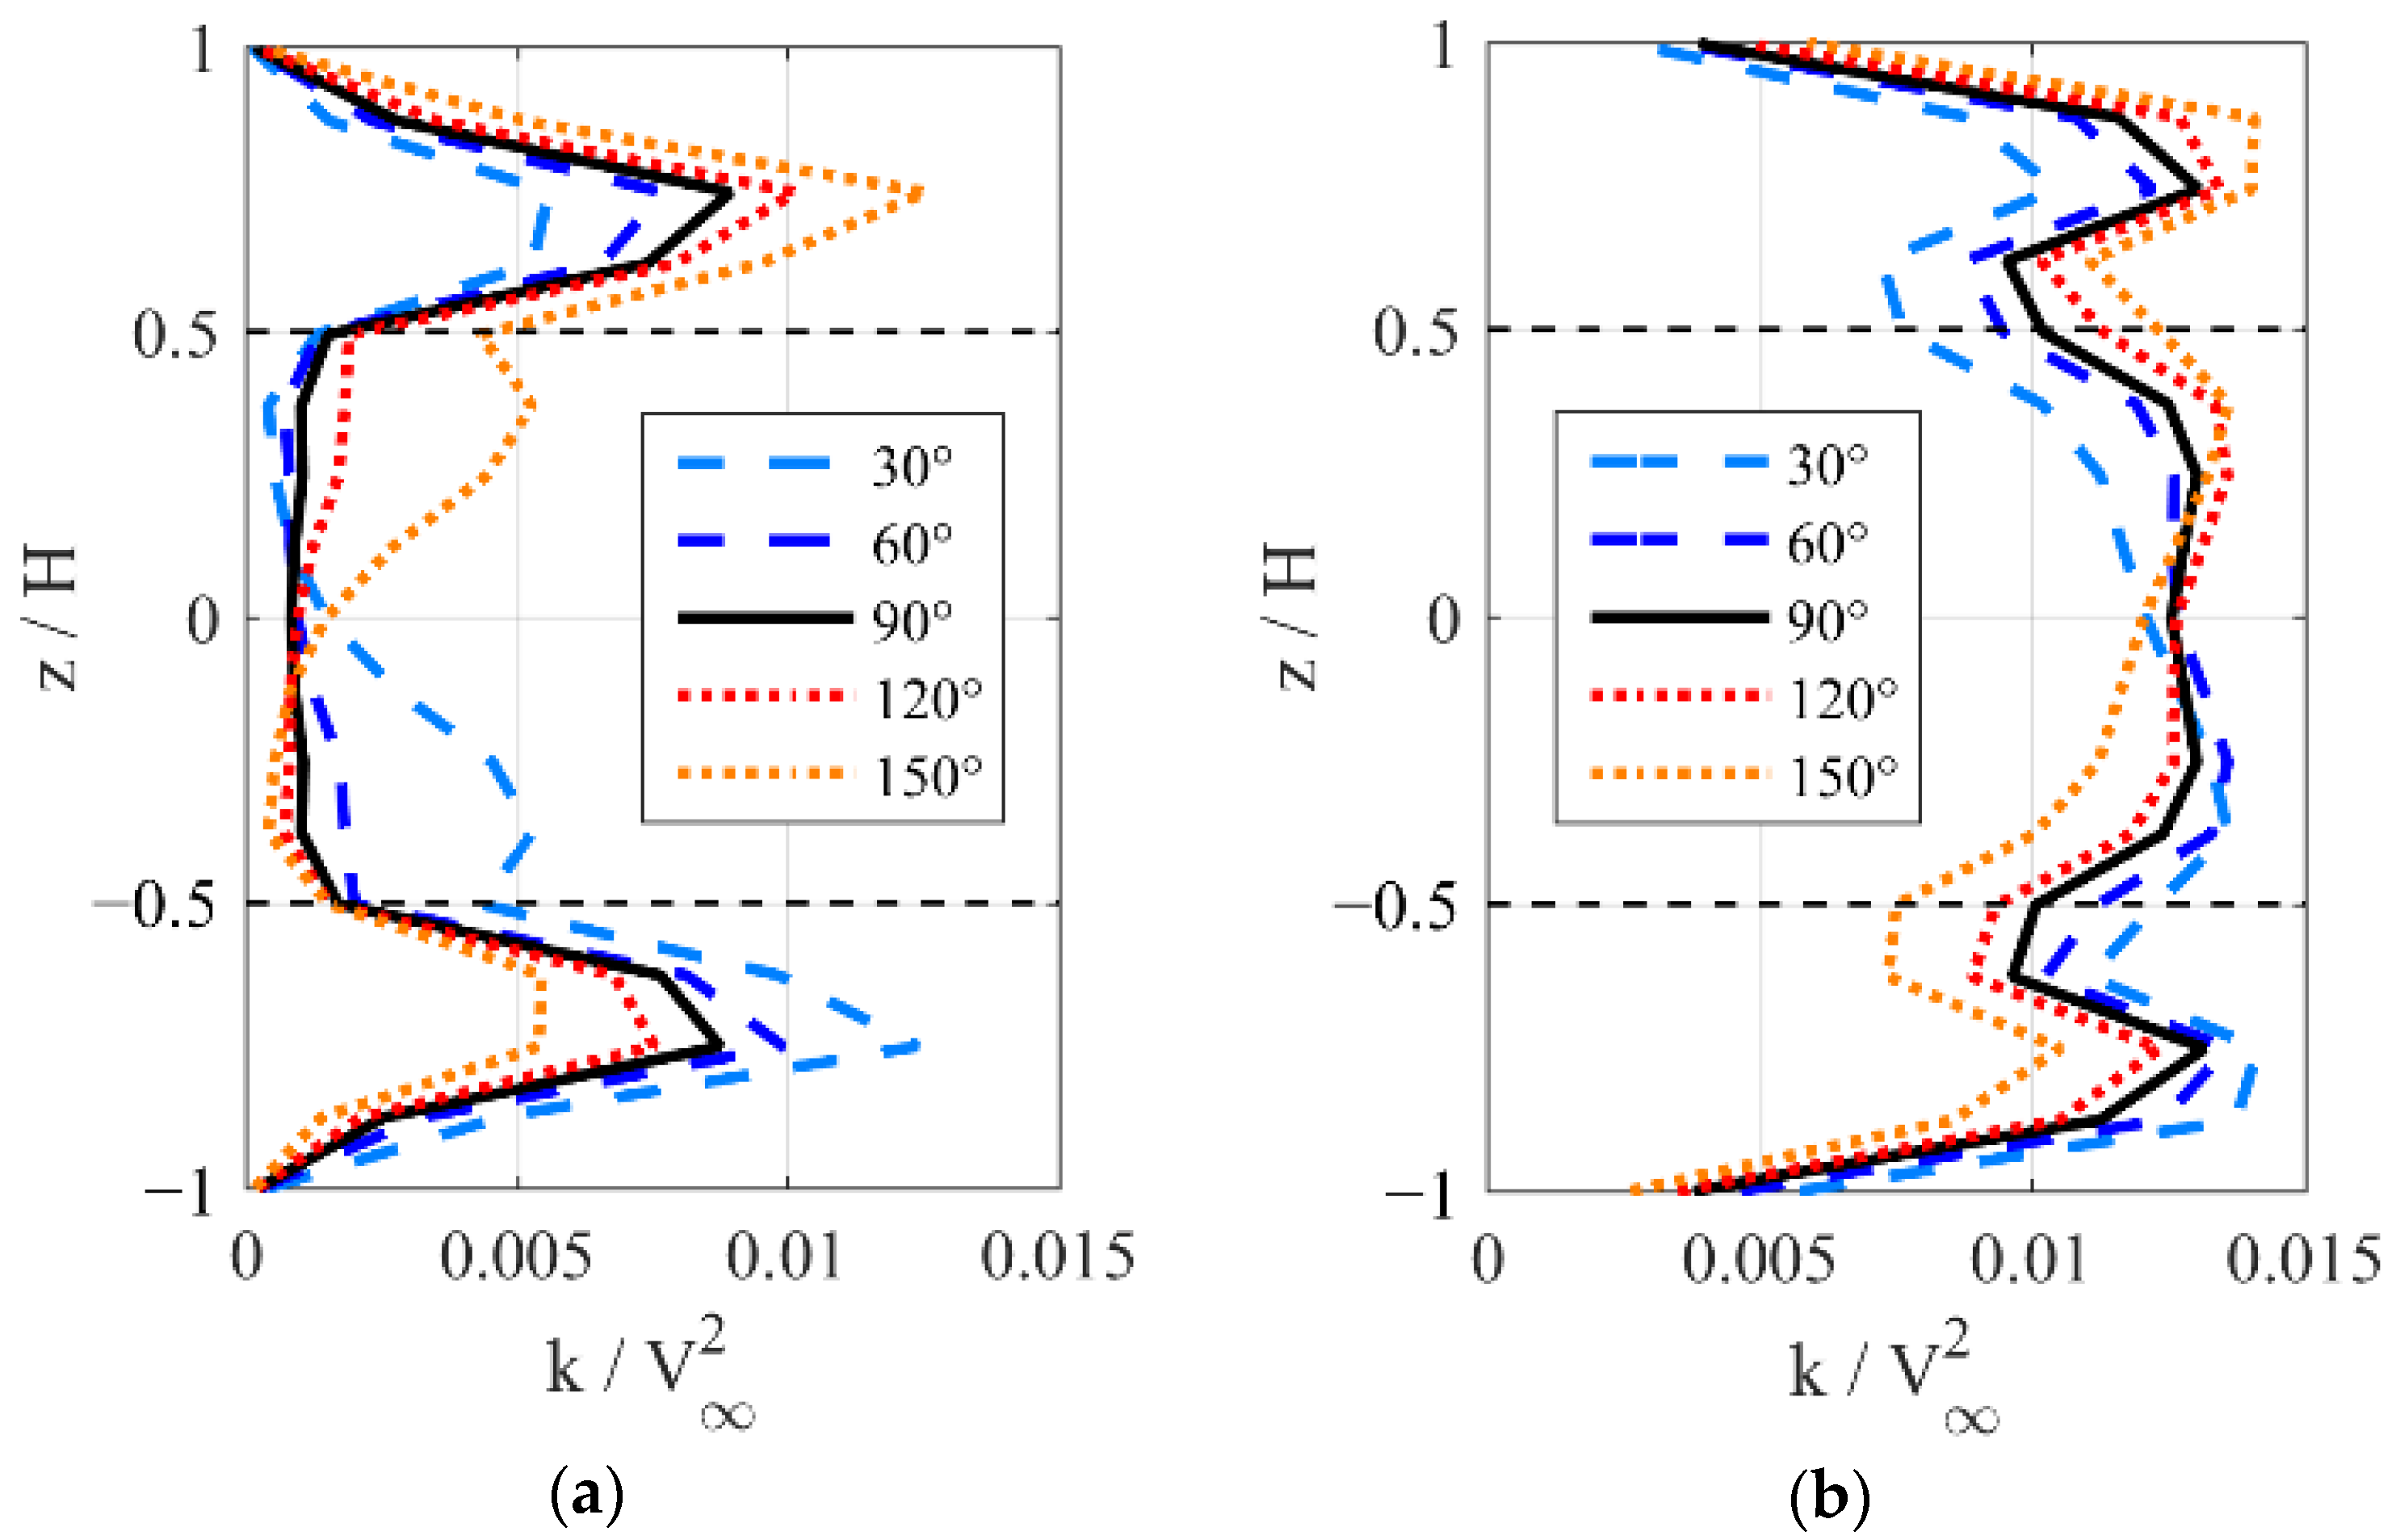
As for flow fields on xz planes in Figure 22, asymmetry is strengthened along with the incline angle away from 90°. For streamwise velocities, when the incline angles are away from 90°, velocity deficits get larger and brought forward in the wake, and the recovery becomes larger, too. At x/D = 1 in the shadow of blades, streamwise velocities are monotonically distributed, as the lower value corresponds to smaller trajectories. The differences of the velocity between z/H = 0.5 and z/H = −0.5 are 0.15 V , 0.06 V , 0, −0.06 V , and −0.15 V with γ = 30 ° , 60°, 90°, 120°, and 150°, respectively (Figure 23). At x/D = 3, deficits become uniform under conditions of various incline angles, and at x/D = 5, the situations are reversed. Smaller trajectories correspond to higher velocity recovery. Maximum recovery reaches 0.78 V and 0.73 V at z/H = −0.13 with γ = 30 ° and 60°, 9% and 2% higher than that with γ = 0 ° . For turbulence kinetic energy, differences between two peaks outside of the blade tips increase when the incline angles are away from 90°. They reach 76% and 28% of values with γ = 90 ° at x/D = 3 and 5 when the incline angle is 30° (Figure 24). At x/D = 3, large turbulence kinetic energy appears in the lower side of the shadow of the blades with γ = 30 ° compared to that with γ = 90 ° . Similar phenomena can be found with γ = 150 ° . For lateral velocities and vertical velocities, asymmetry is not quite clear, and tip vortices are distributed corresponding to the shape of folded blades.
Furthermore, the wake on yz planes at x/D = 5 are assessed. It is clear that the distribution of velocity deficits and turbulence kinetic energy is effected by the shape of folded blades. The maximum velocity deficits of 0.48 V are located at z/H = 0.25 and −0.25 with γ = 30 ° and 150°, respectively. Wind energy in the shadow of the wind turbine is estimated by the integral of the cube of streamwise velocities normalized by the freestream velocity and variations in the vertical direction, as shown in Figure 25. The maximum estimated wind energy with γ = 90 ° reaches 0.59 on the equator while that with γ = 30 ° and 150° reaches 0.64 at z/H = −0.13 and 0.13, 7.5% higher than the former. The total estimated wind energy in the lower half (at z/H < 0) with γ = 30 ° is 8.1% higher than that with γ = 90 ° , the same as that in the upper half (at z/H > 0) with γ = 150 ° . Considering the variations of the power output along the blade span with various incline angles (shown in Figure 26), it has the potential to obtain more power output by appropriate arrangements of wind turbines with various incline angles in a wind farm. In addition, the total estimated wind energy in the shadow of the wind turbine with γ = 30 ° and 150° is 4.6% higher than that with γ = 90 ° . As for turbulence kinetic energy, the total in the upper half with γ = 30 ° is 17.5% lower than that with γ = 90 ° , and it in the lower half with γ = 30 ° is 13.3% higher than that with γ = 90 ° . The opposite phenomena can be seen with γ = 150 ° . In terms of lateral and vertical velocities, the wake with various incline angles is similar, which for brevity is not shown.

5. Conclusions

In the present study, flow characteristics of a VAWT with inclined pitch axes were investigated. Unsteady flow fields around the wind turbine with various azimuthal angles were revealed. In addition, downstream wake as far as five times the rotor diameter was illustrated with various fold angles and incline angles on horizontal and vertical planes. Major findings follow.
Deficits of streamwise velocities are skewed towards the centerplane at y/D = 0 with η = 5 ° . In the contrary, deficits are skewed towards the windward side with η = 5 ° . Moreover, vorticities are stronger in the fore half with η = 5 ° , resulting in stronger blade–vortex interaction.
The evident three-dimensional flow is observed around the wind turbine and downstream. Under conditions of γ = 90 ° and η = 5 ° , the breadth of deficits of streamwise velocities on the top plane (z/H = 0.5) is 0.46 D wider than that on the equator. Vertical velocities and vorticities are stronger on the top plane. The directions of tip vortices are opposite with η = 5 ° and 5°, leading to opposite directions of lateral and vertical velocities. The vertical breadth of deficits with η = 5 ° becomes larger in the wake while that with η = 5 ° slightly decreases.
Under conditions of various incline angles, the effect of the flap angles on flow fields is exhibited clearly in the contours, but that of the edge angles is hardly observed and can be negligible to some extent. With γ = 5 ° where tops of blades experience a larger circular trajectory than bottoms, velocity deficits of the near wake on the bottom plane are larger than those on the top plane and the equator. In addition, the deficits recover fastest on the bottom plane. As for flow fields on xz planes, asymmetry is strengthened along with the incline angle away from 90°. The estimated wind energy in the lower half (at z/H < 0) with γ = 30 ° is 8.1% higher than that with γ = 90 ° , and the total estimated wind energy in the shadow of the wind turbine with γ = 30 ° and 150° is 4.6% higher than that with γ = 90 ° . In this way, appropriate arrangements of wind turbines with various incline angles in a wind farm has the potential to obtain more power output, which needs to be further studied.

Author Contributions

Conceptualization, J.G.; formal analysis, J.G.; writing—original draft preparation, J.G.; writing—review and editing, L.L.; supervision, L.L. All authors have read and agreed to the published version of the manuscript.

Funding

This research was funded by the National Natural Science Foundation of China (No. 51875305).

Conflicts of Interest

The authors declare no conflict of interest.

References

  1. Hezaveh, S.H.; Bou-Zeid, E.; Lohry, M.W.; Martinelli, L. Simulation and wake analysis of a single vertical axis wind turbine. Wind Energy 2017, 20, 713–730. [Google Scholar] [CrossRef]
  2. Tescione, G.; Ragni, D.; He, C.; Simão Ferreira, C.J.; van Bussel, G.J.W. Near wake flow analysis of a vertical axis wind turbine by stereoscopic particle image velocimetry. Renew. Energy 2014, 70, 47–61. [Google Scholar] [CrossRef]
  3. Parker, C.M.; Araya, D.B.; Leftwich, M.C. Effect of chord-to-diameter ratio on vertical-axis wind turbine wake development. Exp. Fluids 2017, 58, 168. [Google Scholar] [CrossRef]
  4. Franchina, N.; Persico, G.; Savini, M. 2D-3D Computations of a Vertical Axis Wind Turbine Flow Field: Modeling Issues and Physical Interpretations. Renew. Energy 2019, 136, 1170–1189. [Google Scholar] [CrossRef]
  5. Brochier, G.; Fraunie, P.; Beguier, C.; Paraschivoiu, I. Water channel experiments of dynamic stall on Darrieus wind turbine blades. J. Propuls. Power 1986, 2, 445–449. [Google Scholar] [CrossRef]
  6. Rolin, V.; Porté-Agel, F. Wind-tunnel study of the wake behind a vertical axis wind turbine in a boundary layer flow using stereoscopic particle image velocimetry. J. Phys. Conf. Ser. 2015, 625, 012012. [Google Scholar] [CrossRef] [Green Version]
  7. Li, Q.A.; Maeda, T.; Kamada, Y.; Murata, J.; Furukawa, K.; Yamamoto, M. The influence of flow field and aerodynamic forces on a straight-bladed vertical axis wind turbine. Energy 2016, 111, 260–271. [Google Scholar] [CrossRef]
  8. Li, Q.A.; Maeda, T.; Kamada, Y.; Murata, J.; Yamamoto, M.; Ogasawara, T.; Shimizu, K.; Kogaki, T. Study on power performance for straight-bladed vertical axis wind turbine by field and wind tunnel test. Renew. Energy 2016, 90, 291–300. [Google Scholar] [CrossRef]
  9. Ryan, K.J.; Coletti, F.; Elkins, C.J.; Dabiri, J.O.; Eaton, J.K. Three-dimensional flow field around and downstream of a subscale model rotating vertical axis wind turbine. Exp. Fluids 2016, 57, 38. [Google Scholar] [CrossRef]
  10. Abkar, M.; Dabiri, J.O. Self-similarity and flow characteristics of vertical-axis wind turbine wakes: An LES study. J. Turbul. 2017, 18, 373–389. [Google Scholar] [CrossRef]
  11. Kadum, H.; Friedman, S.; Camp, E.H.; Cal, R.B. Development and scaling of a vertical axis wind turbine wake. J. Wind Eng. Ind. Aerodyn. 2018, 174, 303–311. [Google Scholar] [CrossRef]
  12. Shamsoddin, S.; Porté-Agel, F. Effect of aspect ratio on vertical-axis wind turbine wakes. J. Fluid Mech. 2020, 889, R1-1-12. [Google Scholar] [CrossRef]
  13. Shamsoddin, S.; Porté-Agel, F. A large-eddy simulation study of vertical axis wind turbine wakes in the atmospheric boundary layer. Energies 2016, 9, 366. [Google Scholar] [CrossRef]
  14. Posa, A. Influence of Tip Speed Ratio on wake features of a Vertical Axis Wind Turbine. J. Wind Eng. Ind. Aerodyn. 2020, 197, 104076. [Google Scholar] [CrossRef]
  15. Yang, Y.; Guo, Z.; Zhang, Y.; Jinyama, H.; Li, Q. Numerical Investigation of the Tip Vortex of a Straight-Bladed Vertical Axis Wind Turbine with Double-Blades. Energies 2017, 10, 1721. [Google Scholar] [CrossRef] [Green Version]
  16. Bachant, P.; Wosnik, M. Performance and near-wake measurements for a vertical axis turbine at moderate Reynolds number. In Proceedings of the ASME 2013 Fluids Engineering Division Summer Meeting, Incline Village, NV, USA, 7–11 July 2013. [Google Scholar]
  17. Bachant, P.; Wosnik, M. Effects of Reynolds Number on the Energy Conversion and Near-Wake Dynamics of a High Solidity Vertical-Axis Cross-Flow Turbine. Energies 2016, 9, 73. [Google Scholar] [CrossRef] [Green Version]
  18. Orlandi, A.; Collu, M.; Zanforlin, S.; Shires, A. 3D URANS analysis of a vertical axis wind turbine in skewed flows. J. Wind Eng. Ind. Aerodyn. 2015, 147, 77–84. [Google Scholar] [CrossRef] [Green Version]
  19. Mendoza, V.; Chaudhari, A.; Goude, A. Performance and wake comparison of horizontal and vertical axis wind turbines under varying surface roughness conditions. Wind Energy 2018, 22, 458–472. [Google Scholar] [CrossRef]
  20. Souaissa, K.; Ghiss, M.; Chrigui, M.; Bentaher, H.; Maalej, A. A comprehensive analysis of aerodynamic flow around H-Darrieus rotor with camber-bladed profile. Wind Eng. 2019, 43, 459–475. [Google Scholar] [CrossRef]
  21. Xu, W.; Li, G.; Wang, F.; Li, Y. High-resolution numerical investigation into the effects of winglet on the aerodynamic performance for a three-dimensional vertical axis wind turbine. Energy Convers. Manag. 2020, 205, 112333. [Google Scholar] [CrossRef]
  22. Villeneuve, T.; Boudreau, M.; Dumas, G. Improving the efficiency and the wake recovery rate of vertical-axis turbines using detached end-plates. Renew. Energy 2020, 150, 31–45. [Google Scholar] [CrossRef]
  23. Su, J.; Chen, Y.; Han, Z.; Zhou, D.; Bao, Y.; Zhao, Y. Investigation of V-shaped blade for the performance improvement of vertical axis wind turbines. Appl. Energy 2020, 260, 114326. [Google Scholar] [CrossRef]
  24. Brownstein, I.D.; Wei, N.J.; Dabiri, J.O. Aerodynamically Interacting Vertical-Axis Wind Turbines Performance Enhancement and Three-Dimensional Flow. Energies 2019, 12, 2724. [Google Scholar] [CrossRef] [Green Version]
  25. Jakubowski, M.; Starosta, R.; Fritzkowski, P. Kinematics of a vertical axis wind turbine with a variable pitch angle. In Proceedings of the AIP Conference Proceedings 1922, Lublin, Poland, 13–16 September 2017; p. 110012. [Google Scholar]
  26. Kiwata, T.; Yamada, T.; Kita, T.; Takata, S.; Komatsu, N.; Kimura, S. Performance of a Vertical Axis Wind Turbine with Variable-Pitch Straight Blades utilizing a Linkage Mechanism. J. Environ. Eng. 2010, 5, 213–225. [Google Scholar] [CrossRef] [Green Version]
  27. Abdalrahman, G.; Melek, W.; Lien, F.-S. Pitch angle control for a small-scale Darrieus vertical axis wind turbine with straight blades (H-Type VAWT). Renew. Energy 2017, 114, 1353–1362. [Google Scholar] [CrossRef] [Green Version]
  28. Guo, J.; Zeng, P.; Lei, L. Performance of a straight-bladed vertical axis wind turbine with inclined pitch axes by wind tunnel experiments. Energy 2019, 174, 553–561. [Google Scholar] [CrossRef]
  29. Guo, J.; Zeng, P.; Lei, L. Structure Analysis of an Innovative Vertical Axis Wind Turbine with Inclined Pitch Axes using Finite Element Method. IOP Conf. Ser. Mater. Sci. Eng. 2020, 825, 012004. [Google Scholar] [CrossRef]
  30. Sørensen, J.N.; Shen, W.Z. Computation of wind turbine wakes using combined Navier-Stokes/actuator-line methodology. In Proceedings of the 1999 European Wind Energy Conference and Exhibition, Nice, France, 1–5 March 1999; pp. 156–159. [Google Scholar]
  31. Mendoza, V.; Goude, A. Improving farm efficiency of interacting vertical-axis wind turbines through wake deflection using pitched struts. Wind Energy 2019, 22, 538–546. [Google Scholar] [CrossRef]
  32. Zhao, R.; Creech, A.C.W.; Borthwick, A.G.L.; Venugopal, V.; Nishino, T. Aerodynamic Analysis of a Two-Bladed Vertical-Axis Wind Turbine Using a Coupled Unsteady RANS and Actuator Line Model. Energies 2020, 13, 776. [Google Scholar] [CrossRef] [Green Version]
  33. Shamsoddin, S.; Porté-Agel, F. Large eddy simulation of vertical axis wind turbine wakes. Energies 2014, 7, 890–912. [Google Scholar] [CrossRef]
  34. Bachant, P.; Goude, A.; Wosnik, M. Actuator line modeling of vertical-axis turbines. arXiv 2018, arXiv:1605.01449. [Google Scholar]
  35. Mendoza, V.; Bachant, P.; Ferreira, C.; Goude, A. Near-wake flow simulation of a vertical axis turbine using an actuator line model. Wind Energy 2019, 22, 171–188. [Google Scholar] [CrossRef] [Green Version]
  36. Mendoza, V.; Goude, A. Validation of Actuator Line and Vortex Models Using Normal Forces Measurements of a Straight-Bladed Vertical Axis Wind Turbine. Energies 2020, 13, 511. [Google Scholar] [CrossRef] [Green Version]
  37. Sheldahl, R.E.; Klimas, P.C. Aerodynamic Characteristics of Seven Symmetrical Airfoil Sections through 180-Degree Angle of Attack for Use in Aerodynamic Analysis of Vertical Axis Wind Turbines; SAND-80-2114; Sandia National Laboratories: Albuquerque, NM, USA, 1981.
  38. Martínez-Tossas, L.A.; Churchfield, M.J.; Meneveau, C. Optimal smoothing length scale for actuator line models of wind turbine blades based on Gaussian body force distribution. Wind Energy 2017, 20, 1083–1096. [Google Scholar] [CrossRef]
  39. Dyachuk, E.; Goude, A.; Bernhoff, H. Dynamic Stall Modeling for the Conditions of Vertical Axis Wind Turbines. AIAA J. 2014, 52, 72–81. [Google Scholar] [CrossRef]
  40. Guo, J.; Meng, H.; Zeng, P.; Lei, L. Several Modifications to Improve Numerical Stability of Leishmen-Beddoes Dynamic Stall Model. In Proceedings of the ASME 2020 Fluids Engineering Division Summer Meeting collocated with the ASME 2020 Heat Transfer Summer Conference and the ASME 2020 18th International Conference on Nanochannels, Microchannels, and Minichannels, Virtual Conference, Online. 13–15 July 2020. [Google Scholar]
  41. Mendoza, V.; Bachant, P.; Wosnik, M.; Goude, A. Validation of an Actuator Line Model Coupled to a Dynamic Stall Model for Pitching Motions Characteristic to Vertical Axis Turbines. J. Phys. Conf. Ser. 2016, 753, 22043. [Google Scholar] [CrossRef] [Green Version]
  42. Dyachuk, E.; Goude, A.; Berhnoff, H. Simulating Pitching Blade With Free Vortex Model Coupled With Dynamic Stall Model for Conditions of Straight Bladed Vertical Axis Turbines. J. Sol. Energy Eng. 2015, 137, 041008. [Google Scholar] [CrossRef] [Green Version]
  43. Bianchini, A.; Balduzzi, F.; Ferrara, G.; Ferrari, L. Virtual incidence effect on rotating airfoils in Darrieus wind turbines. Energy Convers. Manag. 2016, 111, 329–338. [Google Scholar] [CrossRef]
  44. Goude, A. Fluid Mechanics of Vertical Axis Turbines: Simulations and Model Development; Uppsala University: Uppsala, Sweden, 2012. [Google Scholar]
  45. Castelli, M.R.; Englaro, A.; Benini, E. The Darrieus wind turbine: Proposal for a new performance prediction model based on CFD. Energy 2011, 36, 4919–4934. [Google Scholar] [CrossRef]
  46. Rezaeiha, A.; Kalkman, I.; Blocken, B. Effect of pitch angle on power performance and aerodynamics of a vertical axis wind turbine. Appl. Energy 2017, 197, 132–150. [Google Scholar] [CrossRef] [Green Version]
  47. Rogowski, K. CFD Computation of the H-Darrieus Wind Turbine—The Impact of the Rotating Shaft on the Rotor Performance. Energies 2019, 12, 2506. [Google Scholar] [CrossRef] [Green Version]
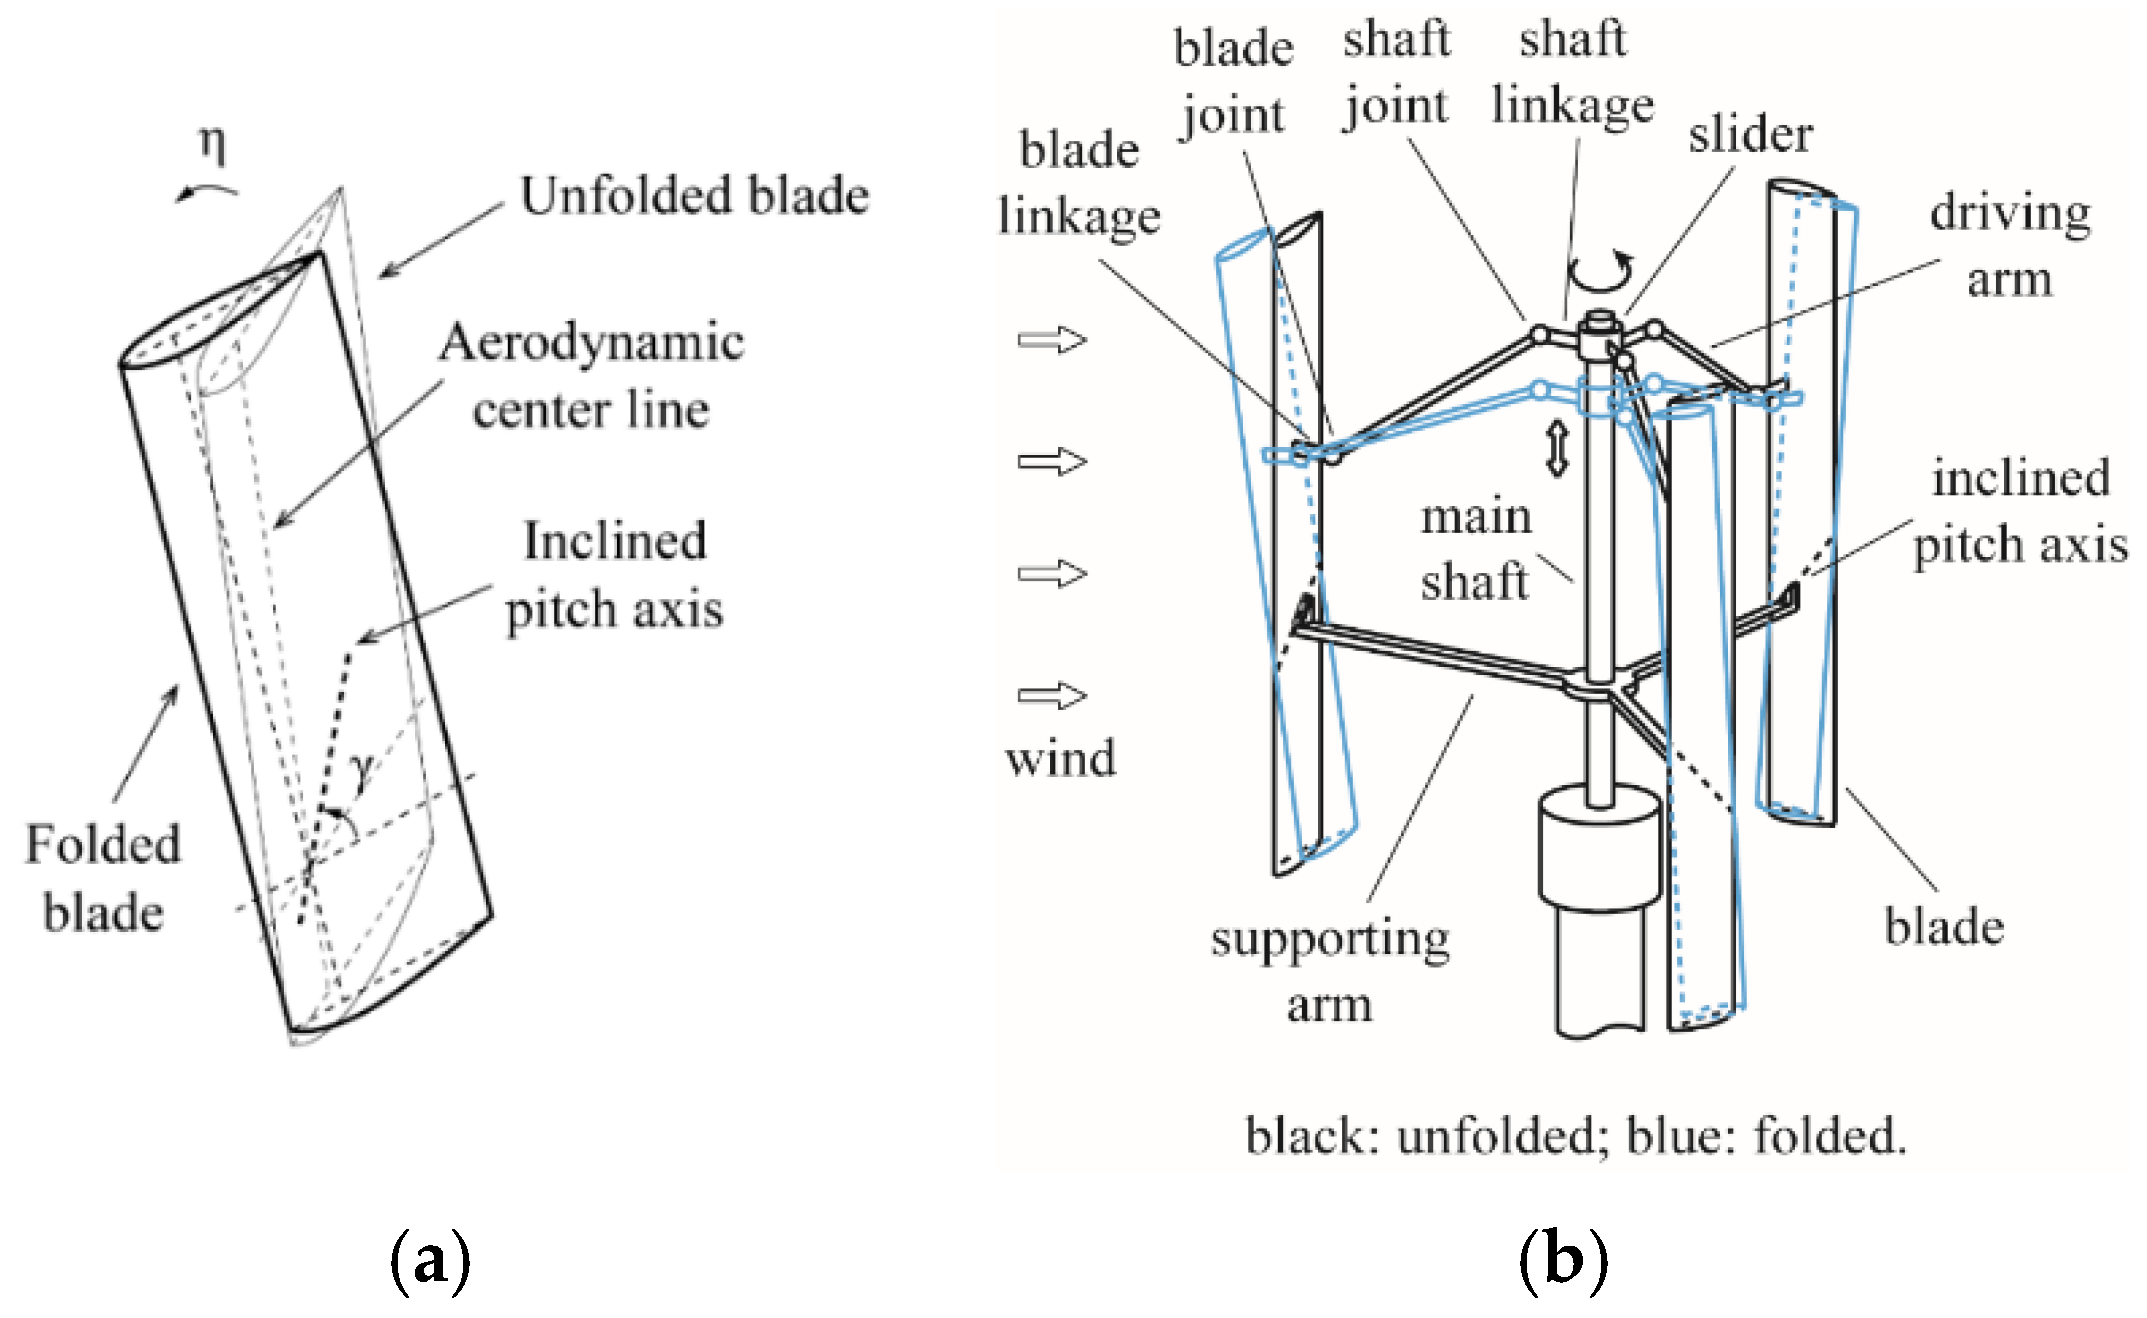
Figure 1. Schematic diagrams of (a) a blade with an inclined pitch axis and (b) a vertical axis wind turbine (VAWT) design with inclined pitch axes [29].
Energies 13 06281 g001
Figure 2. Coordinate systems: (a) ICS and BCS; (b) top view of ICS and BCS; (c) BCS and PCS.
Energies 13 06281 g002
Figure 3. Sign convention of variables.
Energies 13 06281 g003
Figure 4. (a) Computational domain, (b) three mesh zones of the domain, (c) partial mesh on the xy plane.
Energies 13 06281 g004
Figure 5. Normalized streamwise velocities at x/D = 1 with different meshes: (a) lateral profile; (b) vertical profile.
Energies 13 06281 g005
Figure 6. Normalized streamwise velocities at x/D = 1 with different azimuthal increments: (a) lateral profile; (b) vertical profile.
Energies 13 06281 g006
Figure 7. Normalized streamwise velocities at x/D = 1 with different lengths of blade elements: (a) lateral profile; (b) vertical profile.
Energies 13 06281 g007
Figure 8. Comparison of simulated power coefficients against experimental and numerical data.
Energies 13 06281 g008
Figure 9. Comparison of simulated velocities against experimental and numerical data: (a) streamwise; (b) lateral.
Energies 13 06281 g009
Figure 10. Contours of unsteady flow fields with various fold angles: (a) streamwise velocities on the equators; (b) vorticity magnitude on the top plane.
Energies 13 06281 g010
Figure 11. Contours of normalized fluid parameters on horizontal planes with η = 5 ° : (a) streamwise velocities; (b) lateral velocities; (c) vertical velocities; (d) turbulence kinetic energy.
Energies 13 06281 g011aEnergies 13 06281 g011b
Figure 12. Normalized streamwise velocities on horizontal planes with η = 5 ° at (a) x/D = 1; (b) x/D = 3; (c) x/D = 5.
Energies 13 06281 g012
Figure 13. Normalized fluid parameters at y/D = 0 with η = 5 ° : (a) streamwise velocities; (b) turbulence kinetic energy.
Energies 13 06281 g013
Figure 14. Contours of normalized fluid parameters on the equators with various fold angles: (a) streamwise velocities; (b) lateral velocities.
Energies 13 06281 g014
Figure 15. Normalized streamwise velocities on the equators with various fold angles at (a) x/D = 1; (b) x/D = 3; (c) x/D = 5.
Energies 13 06281 g015
Figure 16. Contours of normalized fluid parameters on xz planes at y/D = 0 with various fold angles: (a) streamwise velocities; (b) vertical velocities.
Energies 13 06281 g016
Figure 17. Normalized streamwise velocities at y/D = 0 with various fold angles at (a) x/D = 1; (b) x/D = 3; (c) x/D = 5.
Energies 13 06281 g017
Figure 18. Contours of normalized fluid parameters on yz planes with various fold angles: (a) streamwise vorticities at x/D = 1; (b) streamwise velocities at x/D = 5.
Energies 13 06281 g018
Figure 19. Contours of normalized fluid parameters on horizontal planes with γ = 30 ° : (a) streamwise velocities; (b) lateral velocities; (c) vertical velocities; (d) turbulence kinetic energy.
Energies 13 06281 g019
Figure 20. Normalized streamwise velocities on horizontal planes with γ = 30 ° : at (a) x/D = 1; (b) x/D = 3; (c) x/D = 5.
Energies 13 06281 g020
Figure 21. Normalized fluid parameters at y/D = 0 with γ = 30 ° : (a) streamwise velocities; (b) turbulence kinetic energy.
Energies 13 06281 g021
Figure 22. Contours of normalized fluid parameters on xz planes at y/D = 0 with various incline angles: (a) streamwise velocities; (b) turbulence kinetic energy.
Energies 13 06281 g022
Figure 23. Normalized streamwise velocities at y/D = 0 with various incline angles at (a) x/D = 1; (b) x/D = 3; (c) x/D = 5.
Energies 13 06281 g023
Figure 24. Normalized turbulence kinetic energy at y/D = 0 with various incline angles at (a) x/D = 3; (b) x/D = 5.
Energies 13 06281 g024
Figure 25. Variations in the vertical direction in the shadow of the wind turbine at x/D = 5 with various incline angles: (a) estimated wind energy; (b) turbulence kinetic energy.
Energies 13 06281 g025
Figure 26. Variations of power coefficients along the blade span with various incline angles (normalized by the power coefficient on the equator with γ = 90 ° ).
Energies 13 06281 g026
Table 1. Geometric and operational parameters of wind turbines for validation.
ParametersCase 1Case 2
AirfoilNACA 0021NACA 0018
Blade number32
Diameter/m1.031
Blade span/m1.45641
Chord length/m0.08580.06
Freestream velocity/(m/s)99.3
TSR1.43~3.294.5
Publisher’s Note: MDPI stays neutral with regard to jurisdictional claims in published maps and institutional affiliations.