Article

Demand Response Control of Space Heating in Three Different Building Types in Finland and Germany

1
Department of Mechanical Engineering, School of Engineering, Aalto University, 02150 Espoo, Finland
2
Hemsö Fastighets AB, Korkeavuorenkatu 30, 00130 Helsinki, Finland
3
College of Urban Construction, Nanjing Tech University, Nanjing 211816, China
4
Ramboll Finland Ltd., Itsehallintokuja 3, 02601 Espoo, Finland
5
Department of Environmental Engineering, Faculty of Life Sciences, Hamburg University of Applied Sciences, 20099 Hamburg, Germany
*
Author to whom correspondence should be addressed.
Energies 2020, 13(23), 6296; https://doi.org/10.3390/en13236296
Submission received: 6 October 2020 / Revised: 14 November 2020 / Accepted: 27 November 2020 / Published: 29 November 2020
(This article belongs to the Special Issue Recent Studies in District Heating and Cooling Systems)

Abstract

:
Demand response has been noted as a major element of future smart energy systems. However, there is still a lack of knowledge about the demand response actions in different conditions—including climate, dynamic energy price, and building types. This study examines energy and cost saving potential of the rule-based demand response in district heating network, in three different building types, in Germany and Finland. The studied building types are apartment buildings, cultural centers, and office buildings. The real-time pricing-based demand response is applied to space heating under the climate conditions of Helsinki, Finland and Hamburg, Germany. Moreover, the typical synthetic dynamic price data, which are based on both counties’ district heating production structure, is applied separately for each countries’ cases. Simulations of this study are conducted with validated simulation tool IDA ICE. The results present that the demand response can provide energy and cost savings around 0.5–7.7% and 0.7–8.1% respectively, depending on the building type and country. The results indicate that marginal value of the control signal, climate conditions, and the dynamic price of the district heating have effect on the demand response saving potential. Flatter district heating price profile provides less savings than a more fluctuating profile.

1. Introduction

The building sector accounts for about 40% of final energy consumption and 36% of the total CO2 emissions in EU. Thus, buildings are the largest individual energy consumer in the EU [1]. Despite the policies and actions to improve energy efficiency in buildings, the amount of energy consumed is increasing. Growth of emissions results from population and economic growth, urbanization, increasing wealth, and living standards [2]. The International Energy Agency (IEA) estimates that the building sectors’ energy consumption can rise up to 50% in between 2010 and 2050, if energy efficiency actions are not taken [3].
The most fundamental way to reduce emissions is to decrease the energy demand. Alternatively, introducing more renewable energy sources to the energy mix decreases the use of fossil fuels and reduces emissions. Energy demand of the buildings can be reduced by increasing efficiency. Technological and behavioral energy system changes in the demand side towards energy use and emission reduction are referred as demand side management [4]. Demand side management and optimal control of HVAC systems can reduce energy demand and shift peak loads [5]. Smart technologies offer a practical solution to implement demand side management to increase energy efficiency and mitigate climate change [6].
Demand side management includes multiple different practices which are designed to influence customers’ energy usage [7]. Practically, every energy saving action carried out in the demand side can be referred as demand side managament [8]. Demand response (DR) is one of the demand side management actions which is used to adjust the energy demand to match the supply [4]. Demand response may also be described as a short-term demand side management action [9]. The main objectives of demand response actions are reduction of peak load and controlling the consumption according the generation [7]. Demand response strategies, such as peak shaving and load shifting, are actions of adjustment of power demand. Implementation of demand response do not necessarily decrease the energy demand, but it rather cuts the peaks or shifts the time of energy usage.
In demand response of electrical energy, the time of the energy use is moved towards the less consumption hours. In the case of heating energy demand response, thermal energy can be stored e.g., into the building structures during the low energy prices. At high energy prices, the stored heat is used by reducing the heating power. Buildings can act as an important part of the future energy system. Buildings offer storage potential to the structural thermal mass and the end-users can adjust the energy consumption to implement flexible demand [10]. A study by Kensby at al. [11] indicated that buildings with heavy structures (e.g., concrete) are capable to store heat for short term and tolerate the variations in heat delivery, while maintaining acceptable indoor temperature [11]. Wang [9] states that buildings have a great flexibility considering the heating and cooling due to the thermal mass that they contain. Thus, they provide a large shifting capacity, making them the most effective responsive load and demand response resource.
District heating (DH) is widely used in Northern and Eastern Europe. It offers an efficient heating method especially in densely populated urban areas. District heating considered to play an important role in decarbonizing heating and transition towards sustainable cities. It allows comprising multiple energy sources including combined heat and power (CHP) plants, waste heat, and renewable sources such as geothermal and solar heat [12,13]. District heating consumption was about 32.4 TWh in Finland in 2019. Thus it accounts for 46% market share which makes it the most popular heating method in Finland [14,15]. In Germany, the total installed district heating capacity was about 49.5 GW in 2019 [16]. The market share of district heating was around 14% of the space heating of accommodations and total district heating consumption was 116 TWh in 2018 [17]. One of the challenges of district heating is the variations in the heat load which increases the peak load capacity and use of expensive and more-emitting peak fuels (e.g., heavy fuel oil) [18]. Vandermeulen et al. [19] stated the importance of the flexibility of the district heating. Sources of flexibility in thermal networks are network itself, buildings, and dedicated storage units. Integration concepts of smart district heating technologies and their challenges are shown in [20]. There is need for the advanced control strategy of the district heating to allow more flexibility. One of the factors that can increase flexibility is demand response. Dynamic pricing of the energy offers an incentive for customers to implement demand response. Dynamic pricing of district heating is not applied in the market currently. However, it is a topic of a study as different methods of demand response are examined. Customers should become so called prosumers, which are active operators in the energy system. Demand response can reduce the energy consumption at high energy prices and shift the consumption to the direction of lower energy prices. Moreover, shifting load from the peak hours, less high-emitting production (e.g., heat-only boilers) is needed. However, DR actions should not affect the functionality of the building, which includes thermal comfort and acceptable indoor air quality. One of the key things to consider when applying DR control, is to maintain the required thermal comfort of the end-users and indoor air quality of the building [21,22,23,24]. Demand response has been noted as a potential technology to decrease the expensive peak hour production and generate cost saving for the building owners.
Demand response actions of the electrical power have been studied broadly as more renewable and fluctuating sources have been penetrating to the market [25,26]. Moreover, demand response has been studied in multiple studies concerning direct electrical heating and heat pump applications [27,28,29]. Salo et al. [6] studied the demand response control strategies from district heating operator’s perspective. The study by Vand et al. [21] examined the demand response control of space heating, heating of ventilation and air flow rates in the district heating network in the cold climate. The study examined an educational building and one district heating price profile was implemented. In addition, Mishra et al. performed field tests in an educational building and studied the temperature of the heating water, thermal conditions, and thermal satisfaction of the occupants [30]. That study was also conducted in educational building. According to the literature survey, there have been few studies of the demand response applications in the district heating network in different building types. There is a gap of knowledge how demand response control results in buildings with different technical properties that are heated by district heating. The impact of the technical building properties and the district heating energy prices to the effectiveness of the demand response have not been studied comprehensively.
The novelties of this study are the comparison of the demand response in different building types, countries and climate conditions with different dynamic price data. The main objective of this paper is to study the impact of smart demand response control of space heating on energy demand and cost from building owner point of view. This study focuses only on the saving potential of the demand response from the building owner’s perspective. Thus the incentives (i.e., energy and cost savings) to implement demand response are examined. This paper studies demand response control in two different countries: Finland and Germany. One objective is to investigate the impacts of different climate conditions. Climate conditions differ between Finland and Germany in design temperature and yearly temperature deviation which effects the district heating energy consumption. The other objective is to study the effects of the demand response actions under different district heating price data. Two different dynamic district heating price data are used in this study—one for Finnish and the other for German cases. Dynamic price data are synthetic price profiles of each country. They have been modelled separately based on the typical district heating production structures and climate conditions in Finland and Germany. Moreover, demand response control’s effects on district heating energy demand and cost are studied and compared in three different building types: apartment building, cultural center, and office building. Furthermore, the rebound effect of demand response actions is examined, and the setpoint smoothing’s effects on the district heating energy consumption and cost are studied.

2. Materials and Methods

2.1. Structure of the Simulation

Figure 1 presents the basis structure of the simulation of this study. It consists of two main parts including demand response control algorithm and IDA ICE simulation tool. The control algorithm receives a control signal (CS), 24-h average outdoor temperature, limiting outdoor temperature, and acceptable indoor air temperature range. The control algorithm calculates hourly set points of indoor temperature. The control algorithm is described more detailed in Section 2.7. Detailed building model is constructed on IDA ICE, and the setpoints are fed into the model. It also receives weather data and simulates hourly heating energy consumption. Hourly district heating consumption and price data are fed to Microsoft Excel which calculates the district heating energy costs.

2.2. Acceptable Indoor Temperature Ranges

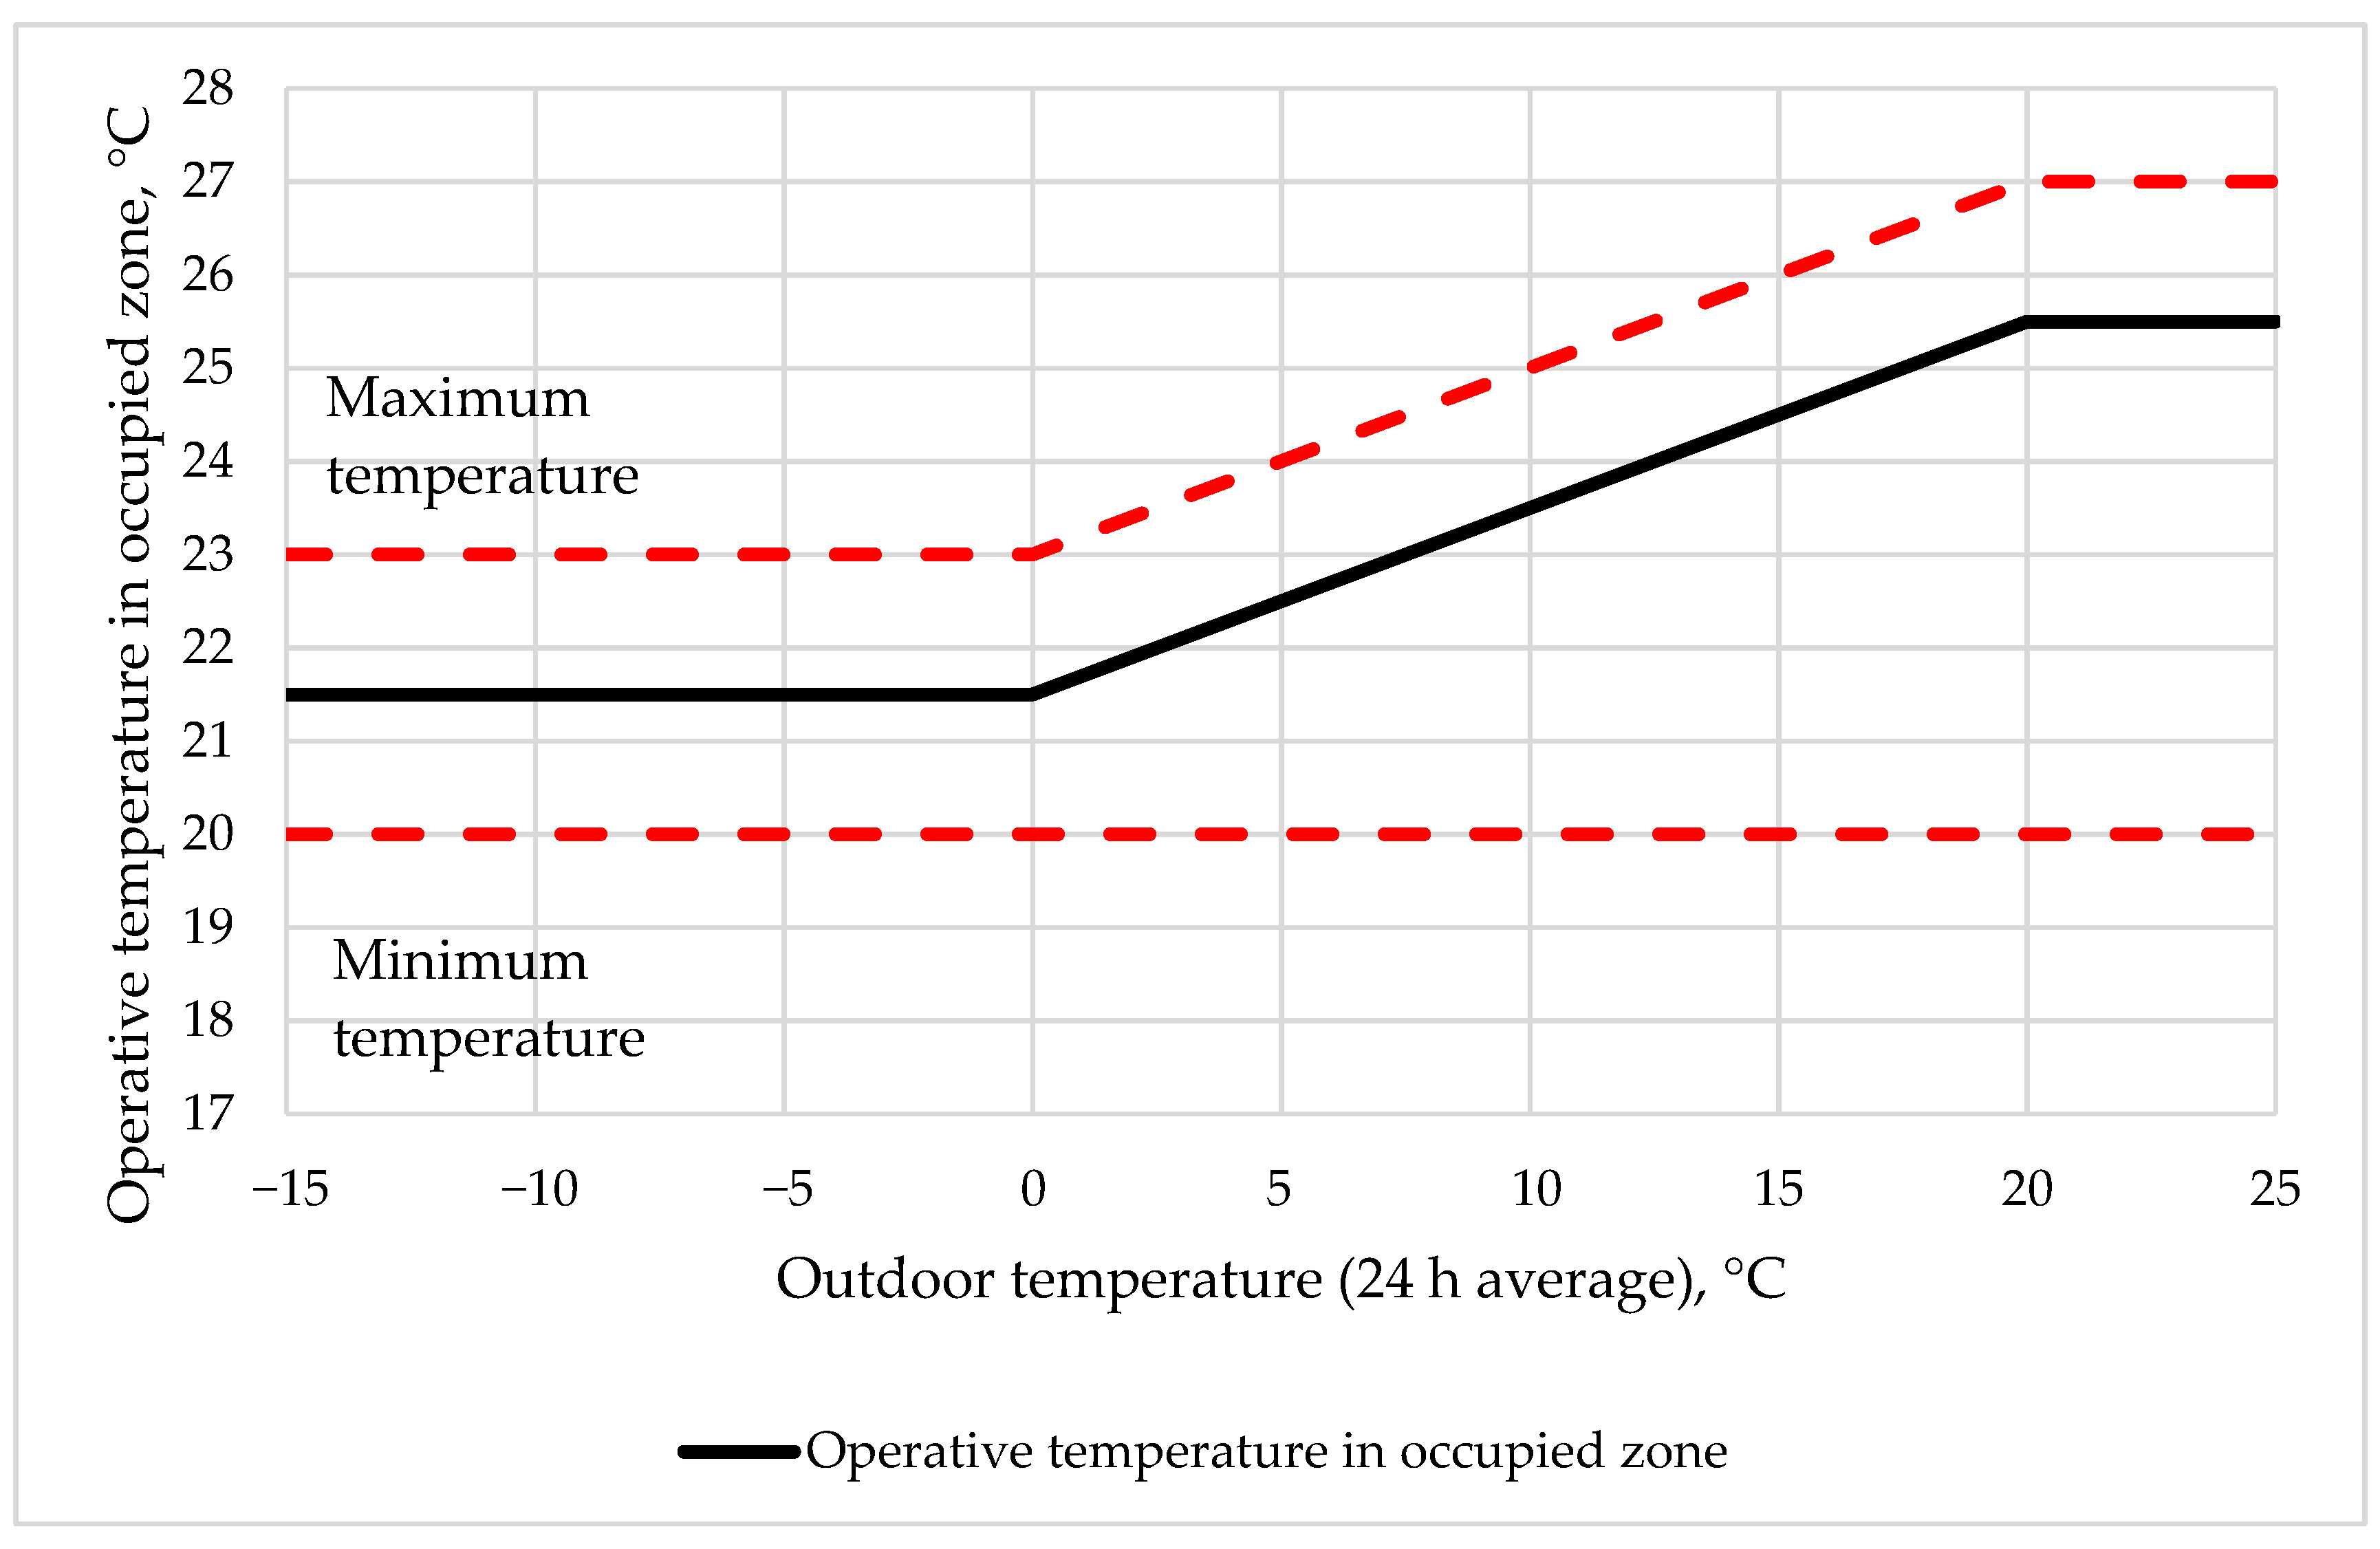
This study used the indoor temperatures defined in the classification of indoor environment by Finnish Society of Indoor Air Quality [31]. Out of three categories, the middle class S2 was chosen for this study. Class S2 is defined as good indoor climate. Definition states that thermal environment is good and there occurs no draught. Moreover, the overheating in the summertime is possible. Figure 2 shows the acceptable temperature ranges in function of 24-h moving average outdoor temperature.
Outdoor temperature is defined as 24-h moving average because it represents better of the occupants’ clothing and its adaptation to the temperature changes. Class S2 states that operative temperature should stay within range of 20–23 °C when the average outdoor temperature is below 0 °C. Moreover, the minimum acceptable indoor temperature was defined based on the thermal environmental category II of the standard EN 15251 [32]. Category II is defined as the normal level of expectation and it is used for new buildings and renovations. Based on these the acceptable range of space heating setpoints of 20–23 °C was chosen and it was used for both countries so the results of the saving potential of the DR control would be comparable.

2.3. Weather Data

This paper studied different building types in two different countries, Finland and Germany, thus separate weather data for both countries are used. Finland is divided in four (I–IV) climate zones from South to North according to the design outdoor temperature. In this paper, the climate zone I was used, where the design outdoor temperature is −26 °C. Moreover, hourly weather data is used for dynamic building energy simulations. This study used hourly weather data of Helsinki-Vantaa test reference year TRY2012 for Finnish simulation cases. The data consists of temperature, relative humidity, solar radiation and wind velocity which are based on weather observations of 30-years’ time period (1980–2009) [33,34]. The annual average outdoor temperature in Helsinki-Vantaa TRY2012 is 5.6 °C and the lowest annual temperature is −20.6 °C. The number of heating degree days at indoor air temperature of 17 °C is 3952 Kd [35].
Reference weather data of Germany is provided by German Meteorological Service (DWD). Germany is divided into grid of squares, each size of a 1 km2. Every square has its individual hourly reference weather data. The data includes for example the outdoor temperature, direct and diffuse solar radiation, and the wind direction. This paper studied case buildings which are located in Hamburg, where the design outdoor temperature is −12 °C. Test reference year of Hamburg, TRY2015, consist of the similar weather parameters as the test reference year of Helsinki-Vantaa. The data of Hamburg test reference year has been collected between years 1995–2012 [36,37]. The annual average outdoor temperature in Hamburg TRY2015 is 9.7 °C and the lowest annual temperature is −9.4 °C. The number of heating degree days at indoor air temperature of 17 °C is 2498 Kd which was calculated based on [38].

2.4. Dynamic Price Data

Two different dynamic price data sets were utilized in this study. Synthetic Finnish price data was used in Finnish case building simulations. Synthetic German district heating price data based on an actual generation portfolio was used in German simulation cases. The price fluctuation results from the variation of the district heating production cost, including CHP earnings. Prices for different cases are presented in Table 1.
Synthetic Finnish price data set has been defined in Aalto University. District heating consumer price is presented in Figure 3. It represents price trend of typical Finnish district heating producer and is based on the production system that consist of biomass fired combined heat and power plant and oil-fired heat-only boiler. Fuels used in the combined heat and power plant are wood and peat. Average cost of the biomass is 19.3 €/MWh and cost of the oil is 54.1 €/MWh. Moreover, synthetic price data is based on the TRY2012 weather data. It includes both energy and transfer costs, and the value-added tax (VAT) of 24%. Revenues from CHP plant electricity sales to Nord Pool market are taken into account in heat production cost. The electricity prices are based on the Nord Pool market prices from 2012. The price data is described more detailed in [6].
Synthetic German district heating price data was calculated based on economic optimization for the heat generators based on the state of art district heating production system which consists of biomethane combined heat and power plants and natural gas boilers. Fuel price data was assumed to be 23.44 €/MWh for natural gas [39] and 64.00 €/MWh for biogas [40]. The earnings from selling electricity from combined heat and power production are based on European Energy Exchange day ahead price data from 2018. Additionally, earnings of 214.50 €/MWh based on the German act on the priority of renewable energies (EEG) [41] were considered for the biogas combined heat and power unit. It was assumed to be under operation for eight years. As a result of the economic optimization, hourly specific heat generation costs ( C g e n , t ) were calculated. To transfer these into a hourly consumption price ( P c o n , t ) the following calculations were implemented. The hourly generation costs ( C g e n , t ) were divided by the mean generation cost ( C g e n , m e a n ) to obtain the hourly relative cost variation ( C g e n _ r a t i o , t ) according to Equation (1):
C g e n _ r a t i o , t =   C g e n , t C g e n , m e a n
where C g e n _ r a t i o , t is the hourly relative cost variation, C g e n , t is the hourly heat generation cost [€/MWh], and C g e n , m e a n is the mean heat generation cost [€/MWh]. These were normalized and shifted by price shift constant to neglect negative prices, according to Equation (2):
F p r i c e _ s h i f t , t = C g e n _ r a t i o , t max ( a b s ( C g e n _ r a t i o , t ) ) + P s h i f t
where F p r i c e _ s h i f t , t is the hourly normalized price shift and P s h i f t is the price shift constant. Based on this, the price variation factor was calculated according Equation (3):
F v a r = F p r i c e _ s h i f t , t F p r i c e _ s h i f t , m e a n  
where Fvar is the price variation factor and F p r i c e _ s h i f t , m e a n is the mean normalized price shift. In combination with the expected mean consumer price ( P c o n , m e a n ) of 64.08 €/MWh from the local district heating provider [42], the actual hourly consumer heat price was calculated as shown in Equation (4):
P c o n , t = P c o n , m e a n · F v a r
where P c o n , t is the hourly consumer heat price [€/MWh] and P c o n , m e a n is the mean heat consumer price [€/MWh]. Index t indicates hourly values.
Figure 4 presents the consumer heat price over the reference year. These indicate that the lowest prices and highest fluctuations mainly occur in the summer months where the impact of the CHP unit to the price is relatively large.

2.5. Building Simulation Software

IDA Indoor Climate and Energy (IDA ICE) version 4.8 simulation software was implemented in the simulation part of this study [43]. IDA ICE 4.8 is a detailed and dynamic multi-zone simulation tool which can execute variable time step simulations of energy consumption, indoor air quality and thermal comfort in buildings. It enables a platform to model buildings with different structural characteristics, HVAC systems and user profiles. Moreover, IDA ICE supports detailed modelling of different components and self-built macros for the control of the technical systems.
IDA ICE has been validated against the EN 15265-2007 and the EN 13791 standards [44,45]. Moreover, it has been validated in multiple studies [45,46,47,48] what provides strong reasoning for using the IDA ICE in this study.

2.6. Case Building Description

This paper studied three different building types in Finland and Germany. Building types studied were apartment buildings, cultural centers and office buildings. All the study buildings cases in Finland are assumed to be built in the 1990s and the building properties were set according to the Finnish building code of 1985 [49].
The cultural center and office building in Germany were assumed to be built in the 1980s, and the apartment building in 1930s. The cultural center’s building structures were defined based on the design documents. Building structures of the office building were assumed to be same as those of the cultural center.
Building models were constructed to IDA ICE. Each building type has individual geometry, and the same geometry of each type was used in both countries. General building model information is presented in Table 2. Building geometries are based on real buildings, but some simplification were made. Floors were assumed to be identical, and only top floor was modelled and duplicated. Studied buildings have brick and concrete structures which have high heat storage capacity. Thus, they are well suited for the case buildings for DR control study of heating.
The simulated HVAC systems of each case were defined according to the country, the building type, and the construction year of each the building. Each of the case buildings is connected to the district heating network and the efficiency of the district heating substation was assumed to be 0.97 [50]. Fan efficiencies and pressure losses of the ventilation system were defined based on the standard EN 13779 (2007) [51]. In German cases the fan efficiencies were set “low” and pressure losses “high” as the systems are at original stage. In the Finnish cases, the fan efficiencies were set “high” and pressure losses “low” as the systems are renovated. Other building properties, such as structural, HVAC-system, and usage, varied based on the location and building type.

2.6.1. Apartment Building

The apartment building is based on an apartment building located in Hamburg. The apartment was originally built in the 1930s, and it is assumed to be in same condition concerning heating. Key building properties are presented in Table 3.
Building structures and U-values of the German apartment building were defined by European building database, TABULA WebTool [52]. Air tightness of the building was estimated based on the construction year and guidelines presented in [50]. Air tightness was assumed to be poor as the apartment is old. Air tightness of the Finnish case building was also estimated based on the construction year and the same guidelines [50] and was set to correspond a good air tightness of typical apartment building.
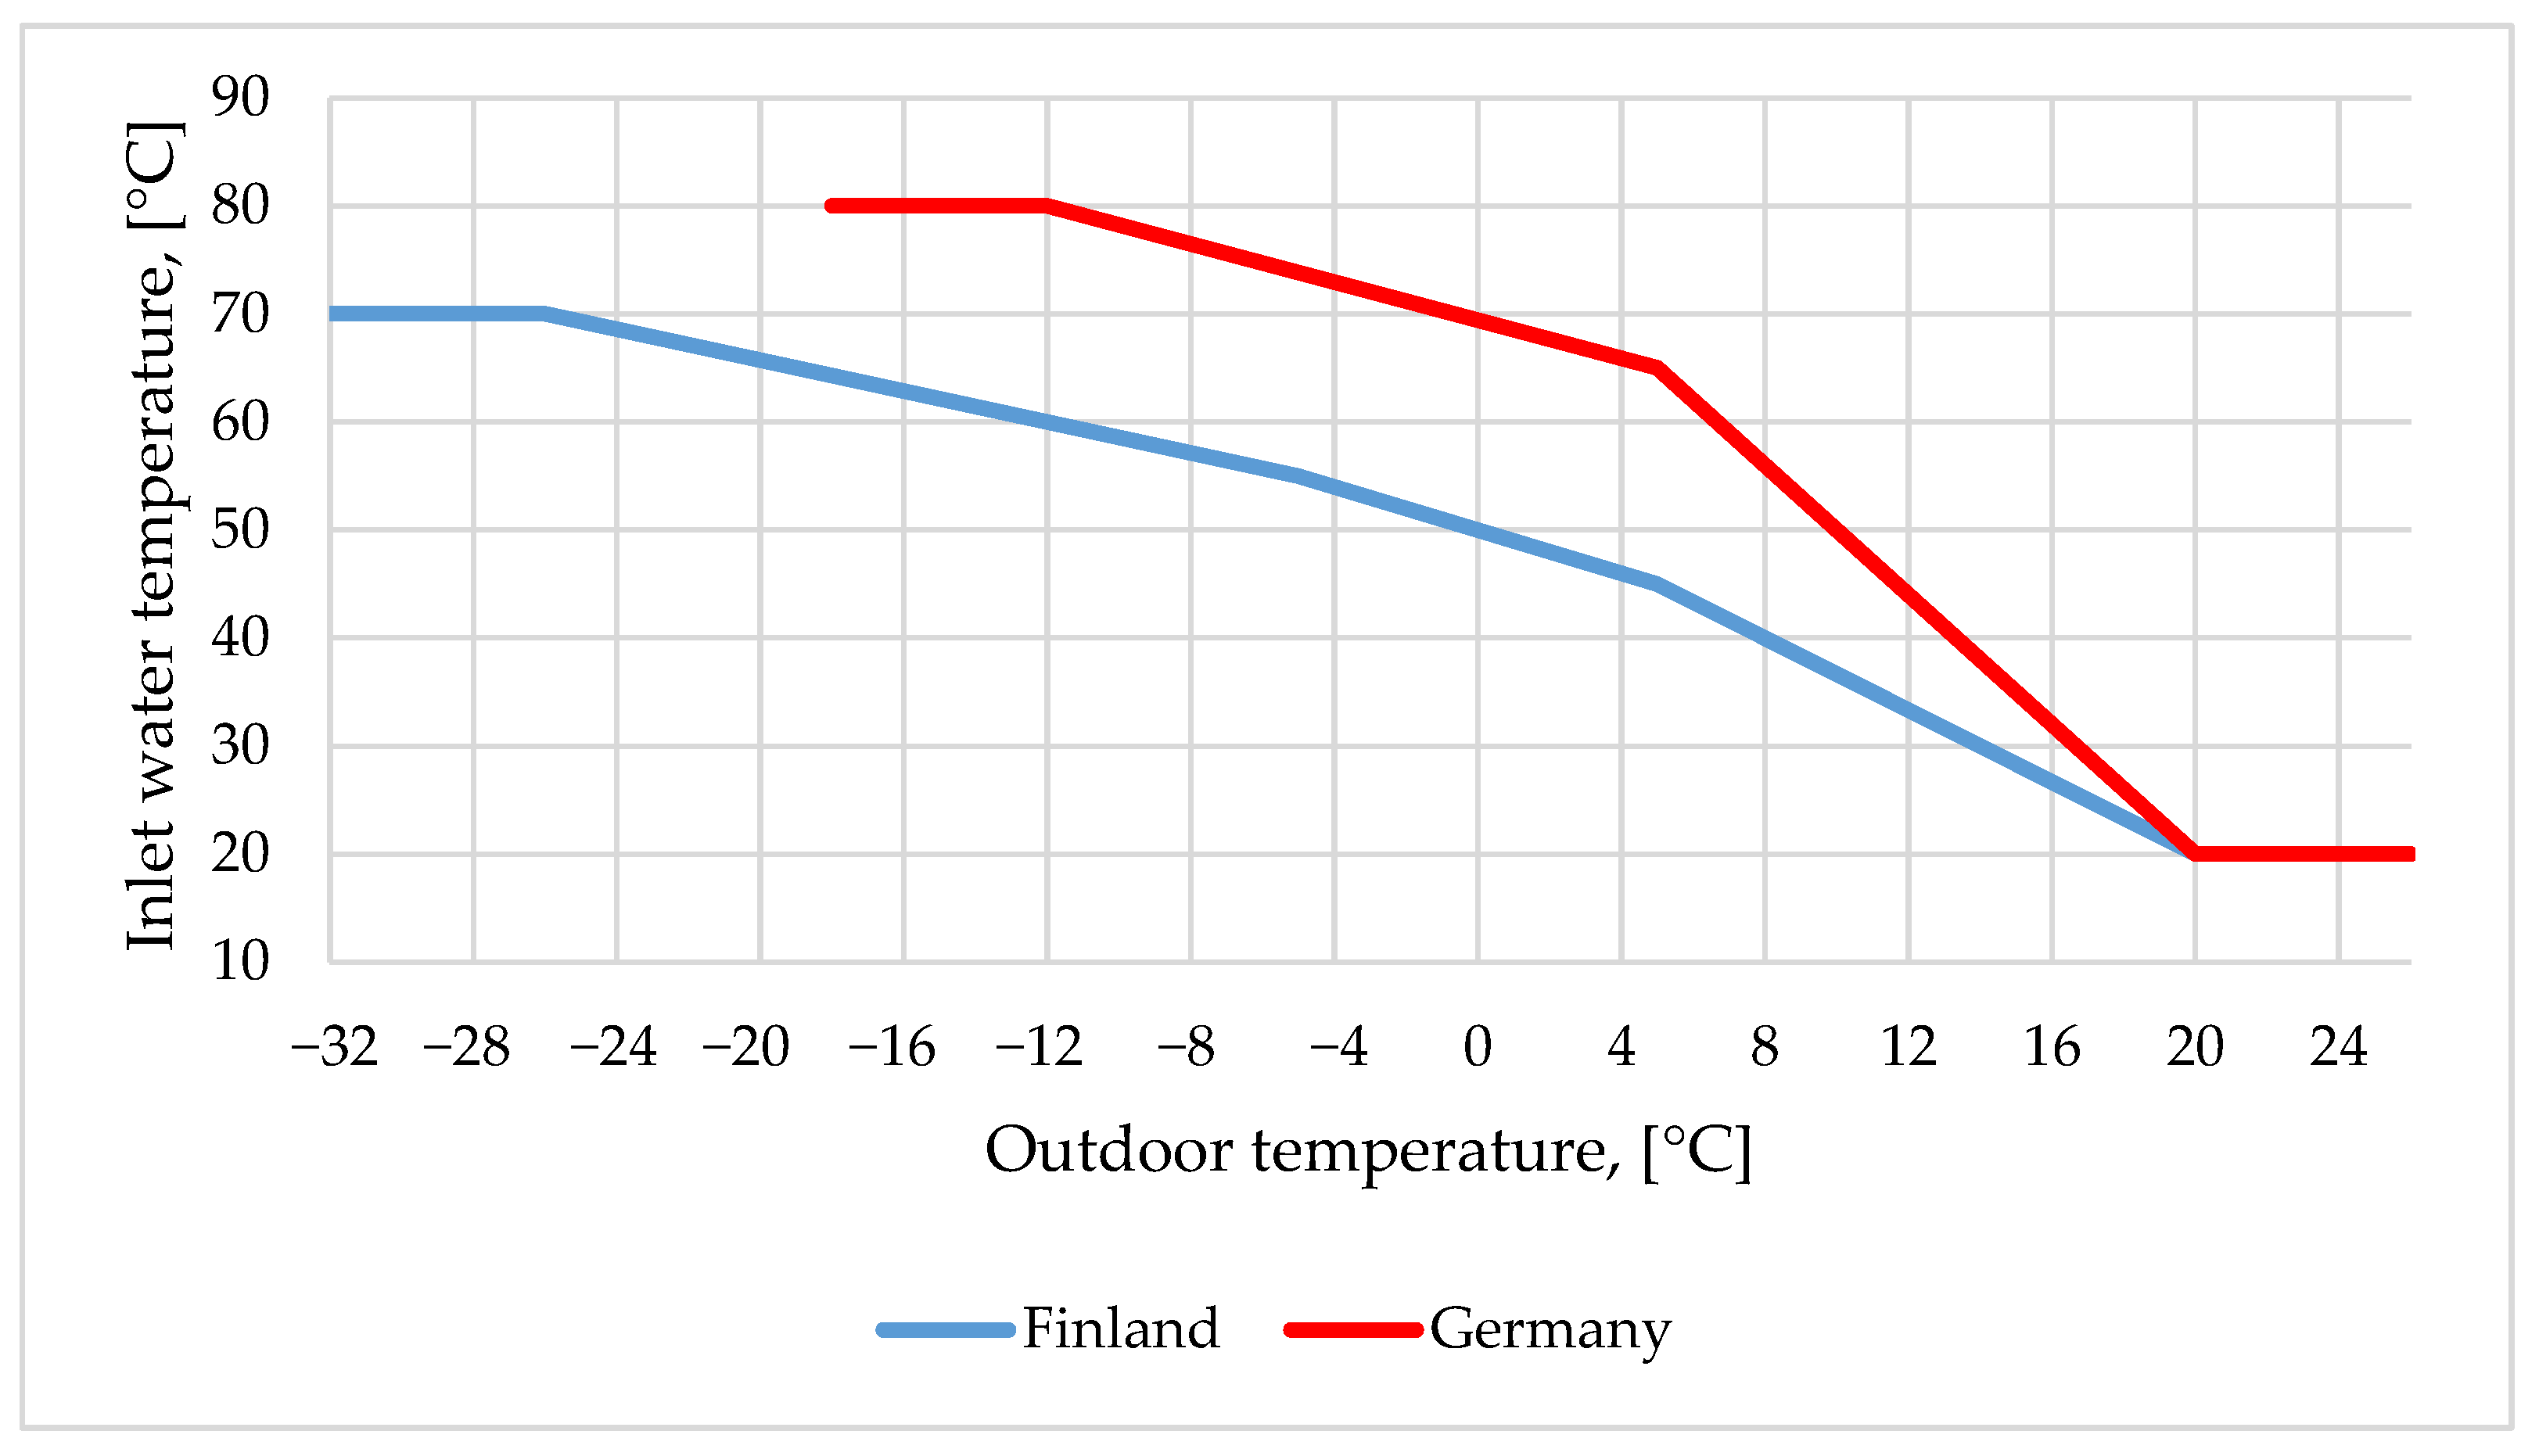
Control curves of the heating system are presented in Figure 5. Heating energy demand of domestic hot water for German apartments was chosen to be 17 kWh/m2, a according to the report [53]. In Finnish apartment building case it was assumed to be 35 kWh/m2, a according to the Finnish building code [54].
The Finnish apartment building has mechanical exhaust ventilation which covers all zones. The extract airflow rates were defined based on the FINVAC guidelines [55]. Fans are always operating. The German apartment building is completely naturally ventilated. Average air change rate was assumed to be 0.24 1/h, which is based on the study results in [56]. This is based on the airflow rates of: 0.18 L/s,m2 in apartments, 0.68 L/s,m2 in stairways, and 0.09 L/s,m2 in the attic.
Annual internal gains in apartment building were 11 kWh/m2 for equipment and 16 kWh/m2 for lighting based on heat gains of 4 W/m2 (equipment) and 9 W/m2 (lighting) defined by [54] and their usage profiles.

2.6.2. Cultural Center

The cultural center is based on the building called Bürgerhaus, located in Hamburg. Bürgerhaus was built in early 1980s and it has been renovated recently. Building has four floors including basement. For German case, the IDA ICE -model was constructed based on the design documents. In Finnish case the design data was adjusted so it matched the design guidelines in Finland in 1990’s. Occupancy patterns were estimated based on the opening hours and maximum occupancy capacity of the spaces. Table 4 presents the key building model properties.
The building structure of the German cultural center was based on the design documents. That of the Finnish cultural center was adjusted so they matched the design guidelines of the 1990s. Air tightness was assumed to be moderate based on the complex geometry and construction year. In Finnish case, the air leakage rate at 50 Pa pressure difference (n50) was set lower than corresponding value in German case due to the latter year of construction using Finnish guidelines [49,50].
Heating distribution network consists of water radiators and floor heating, which was used in basement and entrance hall. Simulation time was reduced by modelling only one or two radiators per zone depending on the geometry of the zone. Other properties than design outdoor temperatures and the control curves were same for both countries concerning heating system. Control curves are presented in Figure 6. Moreover, the Finnish case building has space cooling in addition to heating. The indoor air temperature design value is 25 °C and supply air is cooled to 16 °C in the summer time. Domestic hot water heating energy demand was chosen to be 4 kWh/m2, a for both countries according to [54].
The Finnish case building has a variable air volume (VAV) ventilation system which is controlled based on the CO2-concentration. All the other spaces but toilets have mechanical supply and exhaust with heat recovery, whereas toilets have mechanical exhaust ventilation. Design airflow rates are defined according to FINVAC [57].
The German case building’s ventilation system consists of mechanical supply and exhaust, mechanical exhaust, and natural ventilation. Mechanical supply and exhaust is used in the kitchen, restaurants basement, and hall and entrance. Toilet spaces are equipped with mechanical exhaust, and all the other spaces with natural ventilation. AHUs are not equipped with heat recovery system and they are operated manually according to the opening hours. Air flow rates were determined based on the REHVA health-based ventilation guideline for Europe [58]. Supply air temperature was set to 18 °C in both countries.
Usage of the building and internal gains are same for both countries. The maximum number of occupants was obtained from the Bürgerhaus. The opening hours are from 10 a.m. to 9 p.m. (Monday to Thursday) and from 10 a.m. to 2 p.m. (Friday). Friday evenings and weekends can be reserved for private events.
Annual internal gains in cultural center were 15 kWh/m2 for equipment and 29 kWh/m2 for lighting based on heat gains of 1 W/m2 (equipment) and 19 W/m2 (lighting) defined by [54] and their usage profiles.

2.6.3. Office Building

Office building is based on an educational office building built in Espoo, Finland in 1966. It has been renovated a few times. The building has four floors consisting of office spaces, conference rooms, and hallways. The IDA ICE model was originally constructed by Martin [59]. The top floor was modelled, and stories below were copied assuming that every floor is equivalent. The key building properties are shown in Table 5.
The U-values of the German office building are the same as in the cultural center. Air tightness of the building is defined according to Thermal Insolation Ordinance from 1977 which states that air leakage rate (n50) is 4.5 L/h for office building [60]. In the Finnish case, the air leakage rate was set to 1.6 L/h based on the study by Vinha et al. [61].
The heating system is similar to that of the studied cultural center. Control curves of the office buildings are shown in Figure 7. Domestic hot water heating energy demand was assumed to be 6 kWh/m2, a for both countries, based on [54].
The office building in Finland has variable air volume (VAV) mechanical supply and exhaust ventilation for all the spaces but hallway, which has CAV mechanical supply and exhaust ventilation. VAV system is controlled based on the CO2-concentration. AHUs are equipped with heat recovery systems. Design airflow rates were set according to FINVAC [57].
The office building in Germany has constant air volume (CAV) mechanical supply and exhaust ventilation. AHUs are not equipped with heat recovery system. Design air flow rates are defined from REHVA’s guidelines [58]. Supply air temperature was set to 18 °C for both countries.
Annual internal gains in office building were 4 kWh/m2 for equipment and 18 kWh/m2 for lighting based on [59].

2.7. Rule-Based Demand Response Control

2.7.1. Control Signal

In this paper, the rule-based demand response control was based on the future hourly energy price. It was assumed that the moving future 24-h price trend of district heat is known. The principle was that the control signal (CS) gets a value according to the price trend, which can be increasing, decreasing, or flat. The control signal received a value of +1, −1, or 0 respectively.
The control signal was calculated in Excel based on the Behrang-Sirén method which is a moving average method. Behrang-Sirén method has been used in multiple previous studies concerning demand response [21,27,59]. It is based on hourly energy price (HEP), average of future hourly energy prices from hour p to q ( H E P a v r + q , + p ), and marginal value. Pseudo code of control signal is presented in Equation (5):
I F { H E P < H E P a v r + 1 , + 24 m a r g i n a l   v a l u e O R H E P a v r + 6 , + 12 > H E P a v r + 6 , + 24 + m a r g i n a l   v a l u e } T H E N   C S = + 1 E L S E   I F   H E P > H E P a v r + 1 , + 24   T H E N   C S = 1 E L S E   C S = 0 E N D   I F
where HEP is the hourly energy price, H E P a v r + p , + q is the average of hourly energy prices from start hour +p to end hour +q, and CS is the control signal. Alimohammadisagvand et al. [27] used average of hourly energy prices from hour +6 to +30 ( H E P a v r + 6 , + 30 ) in the second condition for the CS = +1 but in this paper it was changed to average from hour +6 to +24 ( H E P a v r + 1 , + 24 ) as the 24-h price trend is known.
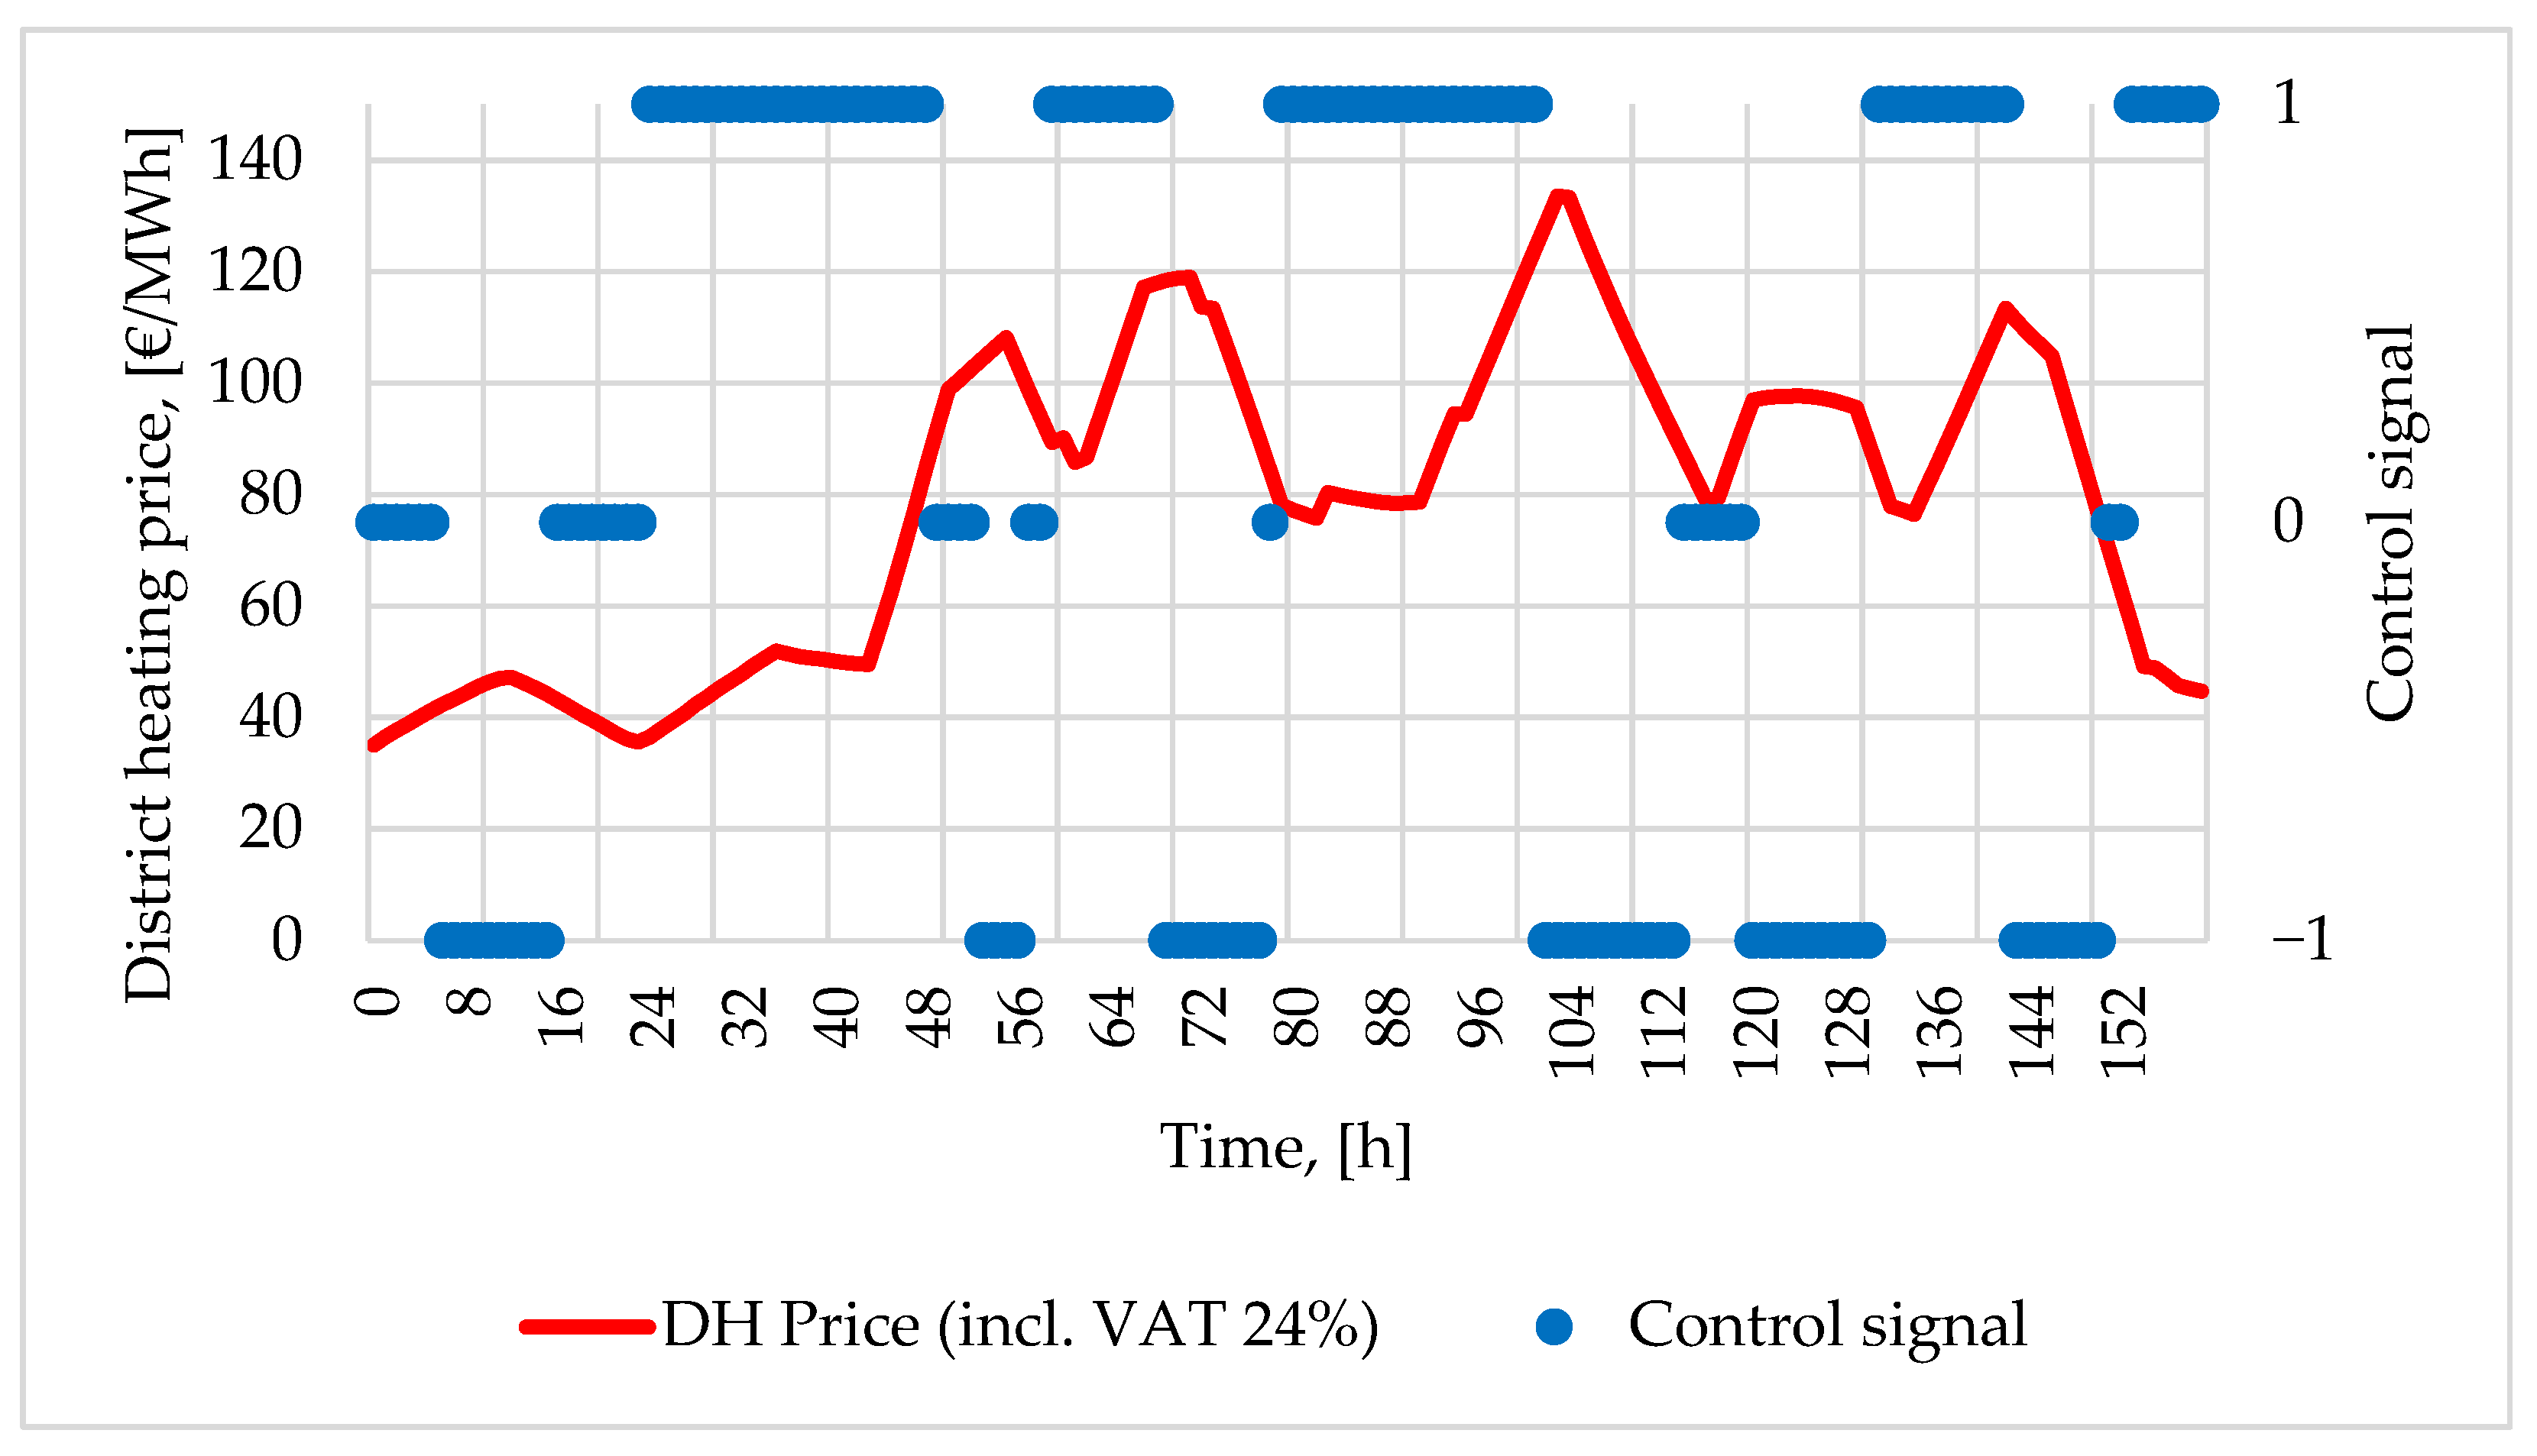
Figure 8 illustrates the relation of the district heating price and control signal. The graph is plotted using Finnish district heating price and marginal value of 15 €/MWh. When the current hourly energy price (HEP) is lower than difference of the average future 24-h price ( HEP a v r + 1 , + 24 ) and marginal value, price trend is increasing, and control signal (CS) is +1. Moreover, when average of hourly energy prices between hours +6 and +12 ( HEP a v r + 6 , + 12 ) is higher than sum of average hourly energy prices between hours +6 to +24 ( HEP a v r + 6 , + 24 ) and marginal value, price trend is increasing, and control signal (CS) is +1. In the other hand, when the current hourly energy price (HEP) is higher than moving 24-h average price ( HEP a v r + 1 , + 24 ), price trend is decreasing, and control signal (CS) is −1. Otherwise, hourly energy price (HEP) is levelling out, and control signal (CS) is 0.
According to the Behrang-Sirén method, marginal value has a significant effect on the outcome of the control signal. Choosing a low marginal value makes the algorithm more sensitive to the changes of the hourly energy price. Thus, hourly energy price is more likely to be less than moving future average 24-h price, and the control signal gets positive values more often. In the other hand, choosing a higher marginal value, control algorithm becomes less sensitive to the changes of the hourly energy price. A high marginal value decreases the number of positive control signal values. This results in less potential heat loading hours and more savings in the heating energy. The marginal values used in this paper were chosen based on the simulation carried out by Martin [59]. Two different marginal values, 15 €/MWh and 75 €/MWh, were used for comparison.

2.7.2. Control Algorithm

In this study, the control algorithm calculated the hourly indoor temperature set points which were fed into IDA ICE in an external source file. IDA ICE simulated the hourly heat consumption. Different simulation cases were then compared to the reference cases without DR control, and impact of the rule-based demand response on energy consumption was analyzed.
Two different space heating demand response control algorithms, without (DR) and with (DR+NT) night-time set-back, were utilized in this study. Figure 9 presents the flow charts of control algorithms. The control algorithms were adapted from Martin’s [59] study.
TSH,min and TSH,max represent the minimum and maximum acceptable setpoints of space heating used in the study. They are 20 and 23 °C respectively (see Section 2.2) and normal temperature setpoint is Tsh,norm = 21 °C. Algorithm contains a limiting outdoor temperature parameter Tlim which prevents the algorithm to choose maximum set point for the room temperature even if the price trend is increasing. Martin [59] studied the effect of different limiting outdoor temperatures but results show that the effect was neglectable. In this paper limiting outdoor temperature was set to 0 °C.
The DR control algorithm defines the future price trend of the district heating from the control signal. If the price trend is increasing and control signal is positive, and Tavr,24 out < Tlim,out, the space heating systems starts to load heat into the structures by setting TSH,set to TSH,max. If the trend is decreasing and control signal is negative, the space heating set point TSH,set is set to TSH,min. Moreover, if the price trend is flat and control signal is 0, the space heating operates normally and sets TSH,set to TSH,norm.
The DR + NT control algorithm is similar to the DR algorithm (see Figure 9a) but it has additional step for night-time set-back. Night-time setback will drop the indoor temperature during the night-time (10 p.m.–6 a.m.) by setting TSH,set to TSH,night. The night-time indoor temperature set point was chosen to be 18 °C. Night-time set-back was set to end at 6 a.m. to ensure that acceptable indoor temperature is reached before occupied hours. Night-time set-back is not an actual DR action but an efficient way to gain additional savings and reduce unnecessary space heating.

2.7.3. Rebound Prevention by Setpoint Smoothing

This paper also studied the rebound effect of demand response control. Rebound effect might occur when the setpoint returns to normal after the demand response period. As the system aims to heat up the spaces back to normal temperature, it can lead to additional peak in the power demand, and the benefit of the demand response is overruled [8,62]. To prevent rebound effect, setpoint smoothing was applied after setpoint calculation. Only upwards smoothing was applied as it was found more profitable. Two different techniques—skip mean and hanning—were implemented. Skip mean technique is presented in Equation (6). The final smoothed setpoint used for the simulation was combination of these two which is presented in the second condition of Equation (7). Each case was simulated with and without the smoothing for comparison:
T S H ,   n S k i p   m e a n = 0.5 · T S H , s e t , n 1 + 0.5 · T S H , n ,   i f   T S H , s e t , n > T S H , s e t , n 1
T S H , n S m o o t h i n g = { 0.5   ·   T S H , n 1 S k i p   m e a n +   0.5   ·   T S H , n S k i p   m e a n , i f   n = 2   a n d   T S H , s e t , n   >   T S H , s e t , n 1 0.25   ·   T S H , n 2 S k i p   m e a n +   0.25 ·   T S H , n 1 S k i p   m e a n 0.5   ·   T S H , n S k i p   m e a n , i f   n > 2   a n d   T S H , s e t , n   >   T S H , s e t , n 1
Figure 10 presents the effect of the upwards setpoint smoothing in practice. Skip mean technique weights current and previous hours’ set points by 0.5, and the setpoint of current hour is sum of these. The Hanning technique weighs two previous hours’ set points by 0.25 and current hour by 0.5. The sum of these is the smoothed set point of the current hour. The combination of these two techniques calculates set points by the Hanning technique using set points calculated by the skip mean technique.

3. Results

In this section, the results of the rule-based DR control case studies are presented. The results of the paper show the district heating consumption and cost of the different simulation cases. Moreover, the cost saving potential and the durations of operative temperatures of different simulation cases are presented. Furthermore, operative indoor air temperatures and their acceptable durations of the simulation cases are analyzed. Simulation cases were compared to the reference cases.

3.1. Simulation Cases

The Finnish simulation cases are shown in Table 6. Each building type was simulated with two different control signal’s marginal value. Setpoint smoothing was applied to a few of the cases. Apartments were simulated with DR algorithm only. The cultural center and office building were simulated with both DR and DR+NT algorithms.
In addition, two different reference cases without demand response control and with constant indoor air temperature setpoint of either 21 °C or 20 °C were simulated for each building type in both countries. The lower temperature was chosen based on the minimum acceptable indoor temperature (see Section 2.2). The higher reference temperature is the usual design value of indoor temperature in the heating season.
The German simulation cases are shown in Table 7. In addition to the two reference cases, one DR controlled case per building type was chosen to the study. It was chosen to match the most profitable Finnish DR case for comparison.

3.2. Energy Consumtpion and Cost

Table 8, Table 9, Table 10, Table 11, Table 12 and Table 13 present the specific energy demand and cost of space heating, as well as the total specific district heating energy demand and cost of the apartment building, cultural center, and office simulations. The costs include only the energy cost, and the fixed costs, such as district heating power and connections fees are excluded from the results as they are assumed to be same for each case. Furthermore, the total district heating energy demand and cost reduction potential of the reference case 2 (20 °C) and demand response cases are presented in respect of the reference case 1 with temperature setpoint 21 °C.
Total district heating energy demand includes the space heating, domestic hot water, and air handling unit heating. Space heating was separated from the total demand as it is affected by the demand response control. The others are not shown separately as the demand response actions do not affect them.
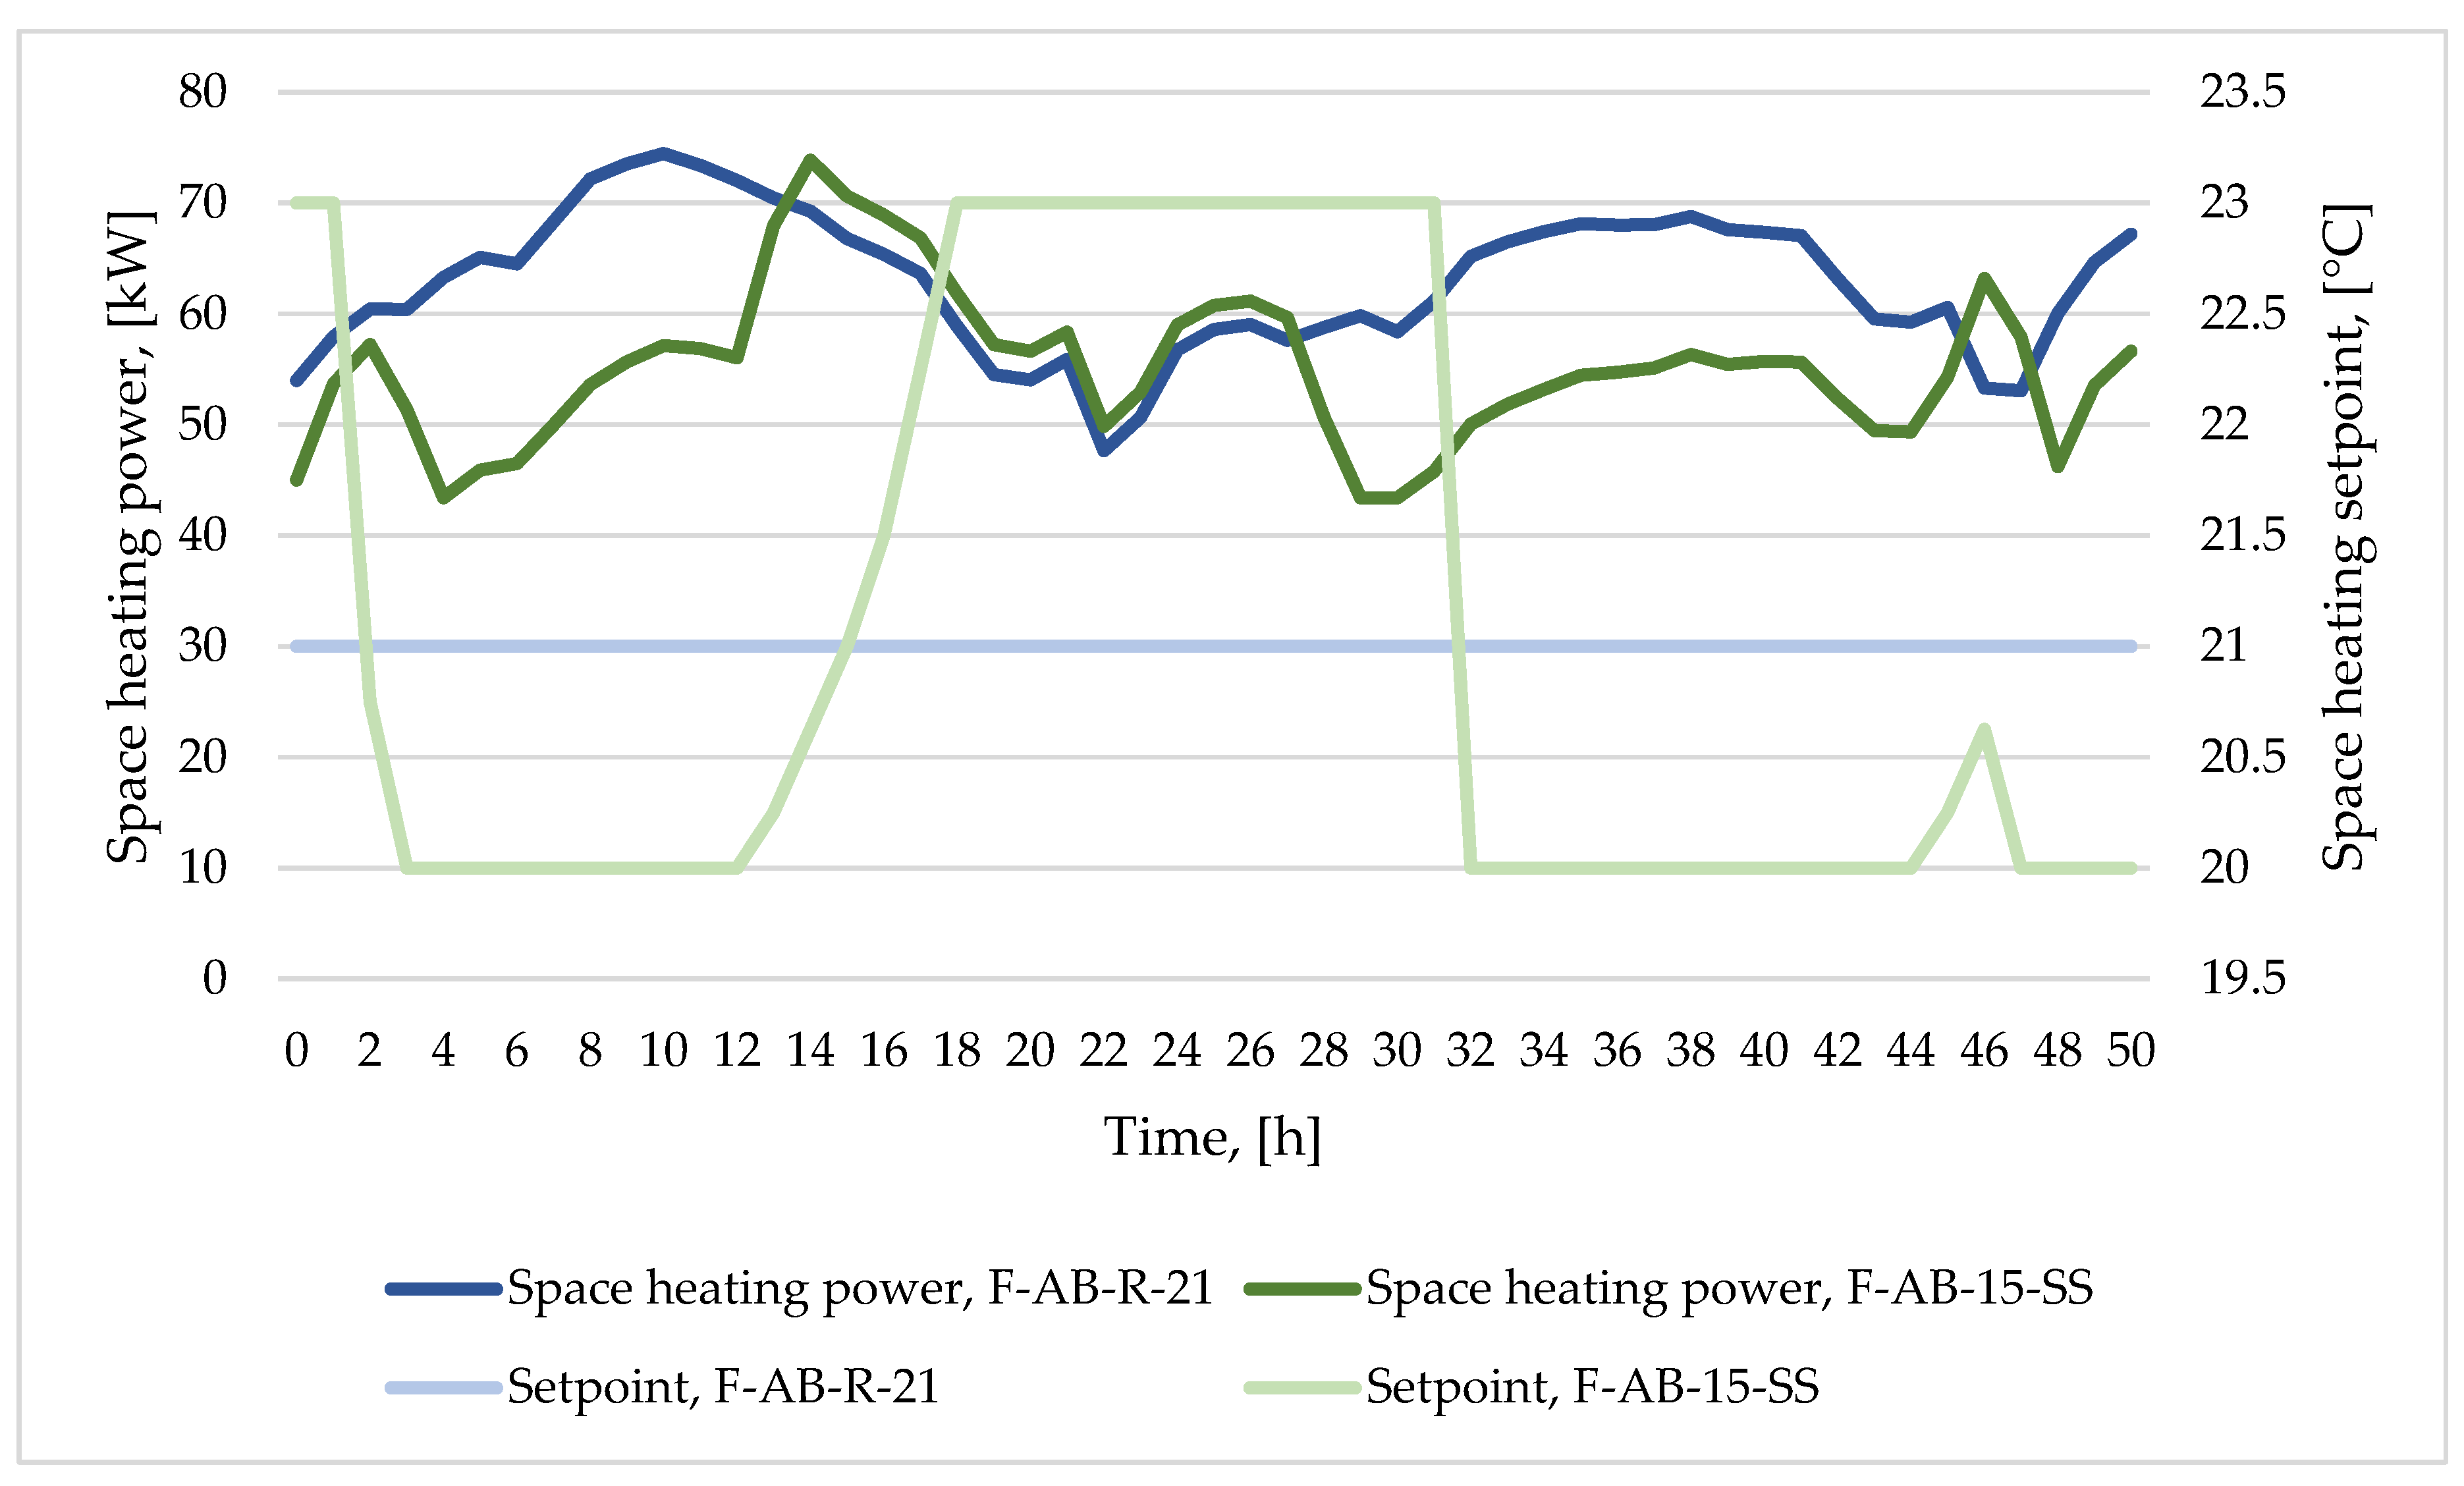
Table 8 presents the Finnish apartment building simulation cases. The highest district heating energy and cost savings were 4.8% and 4.4%, respectively. They were obtained in the reference case 2 (F-AB-R-20) without demand response control of the space heating setpoint. This results from the 1 °C lower setpoint than in the reference case 1 (F-AB-R-21). The highest district heating energy and cost savings obtained among demand response-controlled cases were 1.7% and 3.2%, respectively. These were achieved in the case with higher marginal value and setpoint smoothing (F-AB-75-SS). Thus, in the reference case 2 (F-AB-R-20) the energy and cost savings are 3.1% and 1.2% more than in the best scenario with demand response control. Figure 11 presents the relationship between setpoint and space heating power in two example cases. It shows how the power is lower in the demand response case when the setpoint is set to minimum and higher when the setpoint is set to maximum. However, the difference in power between demand response and reference case is higher during the minimum setpoint than maximum. Moreover, Figure 11 illustrates the rebound effect from hours 12 to 18, when the setpoint is shifted from minimum to maximum. There is a small additional peak created after the setpoint change, but the power demand does not increase significantly though and it levels out in a few hours.
However, with the constant lower space heating setpoint, the occupants must accept constantly lower indoor temperatures. This might result in the higher percentage of dissatisfied people among building occupants. Whereas with demand response control the indoor air temperatures are not constantly lower and thermal comfort is higher. Indoor air temperatures of the simulation cases are analyzed further in the Section 3.3. Moreover, the constantly lower setpoint of the space heating does not provide beneficial energy and power flexibility to the district heating network. This means that the buildings connected to the district heating network do not serve as an energy storage system as in demand response-controlled cases which is one of the key functions of demand response.
The marginal value of the control signal affected the saving potential of demand response control. Lower marginal value results in 1.2% and 2.4% less savings in district heating energy and cost respectively than the higher marginal value. Setpoint smoothing did not have a significant effect on the saving potential of demand response control. It did not provide further savings to the demand response case with the lower marginal value. With the higher marginal value the cost saving is only 0.1% more when setpoint smoothing was used.
Table 9 presents the German apartment simulation cases. The highest district heating energy and cost saving potential was obtained in reference case 2 (G-AB-R-20) with constant setpoint of space heating. The saving potentials were 7.7% and 7.6%, respectively. The district heating energy and cost saving potentials were 2.8% and 3.2%, respectively, in the case with higher marginal value and setpoint smoothing (G-AB-75-SS). Thus, the constantly lower setpoint provided 4.9% and 4.4% more saving potential respectively than the case with demand response control.
The reference cases’ space heating energy demand were higher than in those of Finnish apartment building due to the higher U-values of the structures and air leakage rate n50. Moreover, the saving potentials in German apartment reference case 2 (G-AB-R-20) were higher than in Finnish apartment reference case 2 (F-AB-R-20). Thus the 1 °C drop in the setpoint provides higher percentage of savings in Germany than in Finland. This is due to the higher outdoor temperatures in Germany.
Furthermore, the demand response control’s saving potential of the district heating energy is higher in the German case with higher marginal value and setpoint smoothing (G-AB-75-SS) than in Finnish case with higher marginal value and setpoint smoothing (F-AB-75-SS). Thus, district heating energy saving potential of demand response control was higher in Germany than in Finland among apartment building cases. However, the cost saving potential is not higher than in German case despite the higher energy saving. This is due to the lower cost of district heating energy in Germany.
Results of the Finnish cultural center simulations are shown in Table 10. The reference case 2, F-CC-R-20, provided the highest saving potential in district heating energy and cost among the simulation cases. They were 7.5% and 6.1%, respectively. The highest saving potentials among demand response-controlled cases were obtained in the case with higher marginal value setpoint smoothing and night-time setback (F-CC-75-SS-NT). The saving potentials were 4.5% and 4.6%, respectively. Hence, in cultural center lower constant setpoint provided 3% and 1.5% more savings in district heating energy and cost respectively than the best demand responsec-ontrolled case.
The demand response case with higher marginal value (F-CC-75) provided 1.5% and 2.4% more savings in district heating energy and cost respectively than that of lower marginal value (F-CC-15). Thus, marginal value affected the saving potential in the cultural center simulations as well. Setpoint smoothing did not provide significant additional savings either in cases with lower or higher marginal value. With lower marginal value, the saving increments were 0.1% and 0.2% in district heating energy and cost respectively. With higher marginal value, the increments were 0.1% and 0.1% respectively. When night-time setback was implemented in cases F-CC-15-SS-NT and F-CC-75-SS-NT, the district heating energy saving increased by 2.8% and 2.4% with lower and higher marginal value respectively, when compared to cases without night-time setback (F-CC-15-SS and F-CC-75-SS). The cost savings increased by 2.1% and 1.4% respectively.
Table 11 presents the results of the German cultural center simulations. The reference case 2 (G-CC-R-20) with constant setpoint of 20 °C provides 8.8% and 8.6% saving potential in district heating energy and cost, respectively, in comparison to the reference case 1 with constant setpoint of °C (G-CC-R-21). In the best demand response-controlled case, with higher marginal value setpoint smoothing and night-time setback (G-CC-75-SS-NT), the saving potentials were 7.7% and 8.1%, respectively. Thus, the permanently lower setpoint of space heating enables 1.1% and 0.4% more saving potential, respectively, than the best case with demand response control.
Among all German cases, the highest saving potential of demand response control of space heating was achieved in cultural center. The savings of the district heating energy and the cost in the case with higher marginal value, setpoint smoothing, and night-time setback (G-CC-75-SS-NT) were 3.2% and 3.5% more than in that of Finnish cultural center cases (F-CC-75-SS-NT).
Table 12 shows the results of the Finnish office building cases. The reference case 2 with constant 20 °C setpoint (F-OB-R-20) provided 6.1% and 5.5% saving potential in district heating energy and cost, respectively, in comparison to the reference case 1 (F-OB-R-21). The best demand response- controlled case, with higher marginal value, setpoint smoothing, and night-time setback (F-OB-75-SS-NT), enabled 6.8% and 7.8% of savings, respectively. Thus, among Finnish office building cases the demand response control with night-time setback provided 0.7% and 2.3% more saving potential in district heating energy and cost, respectively, than the reference case 2 with constant 20 °C setpoint of space heating (F-OB-R-20).
Demand response control of the space heating offers the highest saving potential in the office building among the Finnish simulation cases. The marginal value had an impact on the saving potential in the office simulations as well. Neglecting the other actions than demand response control, higher marginal value (F-OB-75) provided 2.3% and 5.2% more savings in district heating energy and cost, respectively, than the lower (F-OB-15).
Setpoint smoothing did not have significant effect on the saving potential among the office building cases either. With lower marginal value, in the case with lower marginal value and setpoint smoothing (F-OB-15-SS), the saving potential was increased by 0.3% in the district heating energy and cost compared to the case without setpoint smoothing (F-OB-15). In the case with higher marginal value and setpoint smoothing (F-OB-75-SS) the increment was only 0.1% in the district heating energy and cost compared to the case without setpoint smoothing (F-OB-75).
Night-time setback increased the saving potential of district heating energy and cost moderately with both lower and higher marginal values. The saving potential of district heating energy and cost increased 4.2% and 2.3%, respectively, with lower marginal value. With higher marginal value the increments were 3.7% and 1%, respectively.
The German office building simulation cases are shown in Table 13. Reference case 2 with constant setpoint of 20 °C (G-OB-R-20) enabled 7.2% more savings in the district heating energy and cost than the reference case 1 with constant setpoint of 21 °C (G-OB-R-21). The most savings achieved among demand response-controlled cases were 6.8% and 7.8%, respectively, which were obtained in the case with higher marginal value, setpoint smoothing, and night-time setback (G-OB-75-SS-NT). Hence, the demand response control with higher marginal value, setpoint smoothing, and night-time setback provided 0.6% more savings district heating energy cost than the constantly lowered setpoint (G-OB-R-20). However, the district heating energy saving potential was 0.4% less in the case G-OB-75-SS-NT than in G-OB-R-20. In the case G-OB-75-SS-NT, the saving potential in district heating energy and cost are the same as in corresponding case of Finnish simulations.
Results of the reference cases indicate that the total heating demand is higher in each building type in Germany than in Finland. Space heating demand is higher in the apartment building and the cultural center in Germany than in Finland. However, in the office building it is slightly higher in Finland. Moreover, the fraction of the space heating demand to the total district heating consumption is lower in cultural center and office building in Germany than in Finland. This results from the higher AHU heating demand in Germany as there is no heat recovery in the AHUs. In the other hand Finnish apartment building has lower fraction of space heating demand to the total district heating consumption as the energy demand for domestic hot water is higher.
The 1 °C drop from 21 to 20 °C in the indoor temperature decreases the heating demand and energy cost significantly in all the reference cases. Among the reference case 2’s, total district heating energy and cost savings were the highest in German cultural center with 8.8% and 8.6%, respectively. The lowest savings were obtained in Finnish apartment building with 4.8% and 4.4%, respectively. Among Finnish cases, only in office building demand response control provided better saving potential in district heating energy and cost than the constantly lower setpoint. In the German office building, demand-response control provided better cost saving potential than the reference case 2, but less district heating energy saving potential. These were the only cases were saving potential was higher in one of the demand-response controlled cases than in reference case 2.
However, as noted, the lowering of the setpoint of space heating permanently does not provided the desired flexibility to the district heating network, which is why it is important to determine the saving potential of the demand response control. Saving potential acts as a motivator for the building owners and district heating energy consumers to become active operators to the energy market.
Among the demand response simulation cases, the case with higher control signal marginal value, setpoint smoothing, and night-time setback provides the highest energy and cost saving potential in all building types in Finland. The higher marginal value of the control signal resulted in higher cost saving in all the buildings. Cost saving potential was around 1.5–2.4% higher when higher marginal value was used and other algorithm actions such as setpoint smoothing and night-time setback were neglected compared to the cases with lower marginal value.
Thus, the marginal value of the control signal calculation method effected on the district heating energy and cost saving potential. Simulation cases with higher marginal value (75 €/MWh) resulted in better cost saving potential in each case in Finland. The results show that the using the lower marginal value makes the algorithm too sensitive to the district heating price changes to the DR of space heating to be notably profitable. When the DR algorithm is used with lower marginal value and other actions (setpoint smoothing, night-time setback) are neglected, the district heating energy and cost saving potentials are 0.7% and 1.5% respectively in the best scenario, in the Finnish office building case (F-OB-15). In the apartment building and cultural center the savings were only 0.5% and 0.7%, respectively, when the lower marginal value was used.
However, the price profile has impact on the effect of the marginal value. The price profile used in the German simulation cases is flatter than that of used in Finnish cases. A flatter price profile mitigates the effect of the marginal value in cost saving potential. In the German simulation cases, the cost saving potential was same regardless which marginal value was used.
Moreover, the setpoint smoothing did not provide notable further savings compared to the demand response cases without setpoint smoothing. In the best scenario, it added 0.3% more savings in district heating energy and cost in F-OB-15-SS compared to F-OB-15. Results indicate that night-time setback was a moderate district heating energy and cost saving action. It provided 4.2% of district heating energy saving and 2.3% of cost saving potential increment at highest, when implemented with the lower marginal value and setpoint smoothing. With higher marginal value the saving increments were 3.7% and 1%, respectively.
Among the Finnish cases, the demand response actions provided the best saving potential in office building. Higher marginal value of control signal provided 6.7% cost savings in the Finnish office building when other actions were neglected. In the best scenario, case F-OB-75-SS-NT, the cost saving was 7.8%. Among the German cases, the best saving potential was obtained in the cultural center. Cost and energy saving potentials were 7.7% and 8.1%, respectively.

3.3. Indoor Air Temperature

Maintaining the required indoor conditions and thermal comfort of the occupants has been noted as a key matter when applying demand response control of HVAC systems. In this section, the indoor air temperatures of the case simulations are presented. The results show the duration of operative indoor temperatures and the amount of degree hours [°Ch] the indoor air temperature was below the minimum acceptable temperature of the study. Moreover, the total number of hours that indoor air temperature dropped below the acceptable level are also presented. Only the indoor air temperatures of occupied hours are examined.
The zones of which indoor air temperatures are discussed were chosen based on the reference case 1 simulations of each building type in Finland. The apartment building’s zone which is examined was the coldest apartment in the building. The coldest office room was chosen from the office building. The hall was chosen from the cultural center which was also the coldest zone of the building. The same zones were selected for each case in both countries for comparison.
In each case building in each country, the indoor air temperature stays acceptable the entire year during the occupied hours in the reference case 1. These and other cases’ indoor air temperature durations, and degree hours and total hours that temperature is below acceptable level are presented in Figure 12, Figure 13 and Figure 14 and Table 14, Table 15, Table 16, Table 17, Table 18 and Table 19 below.
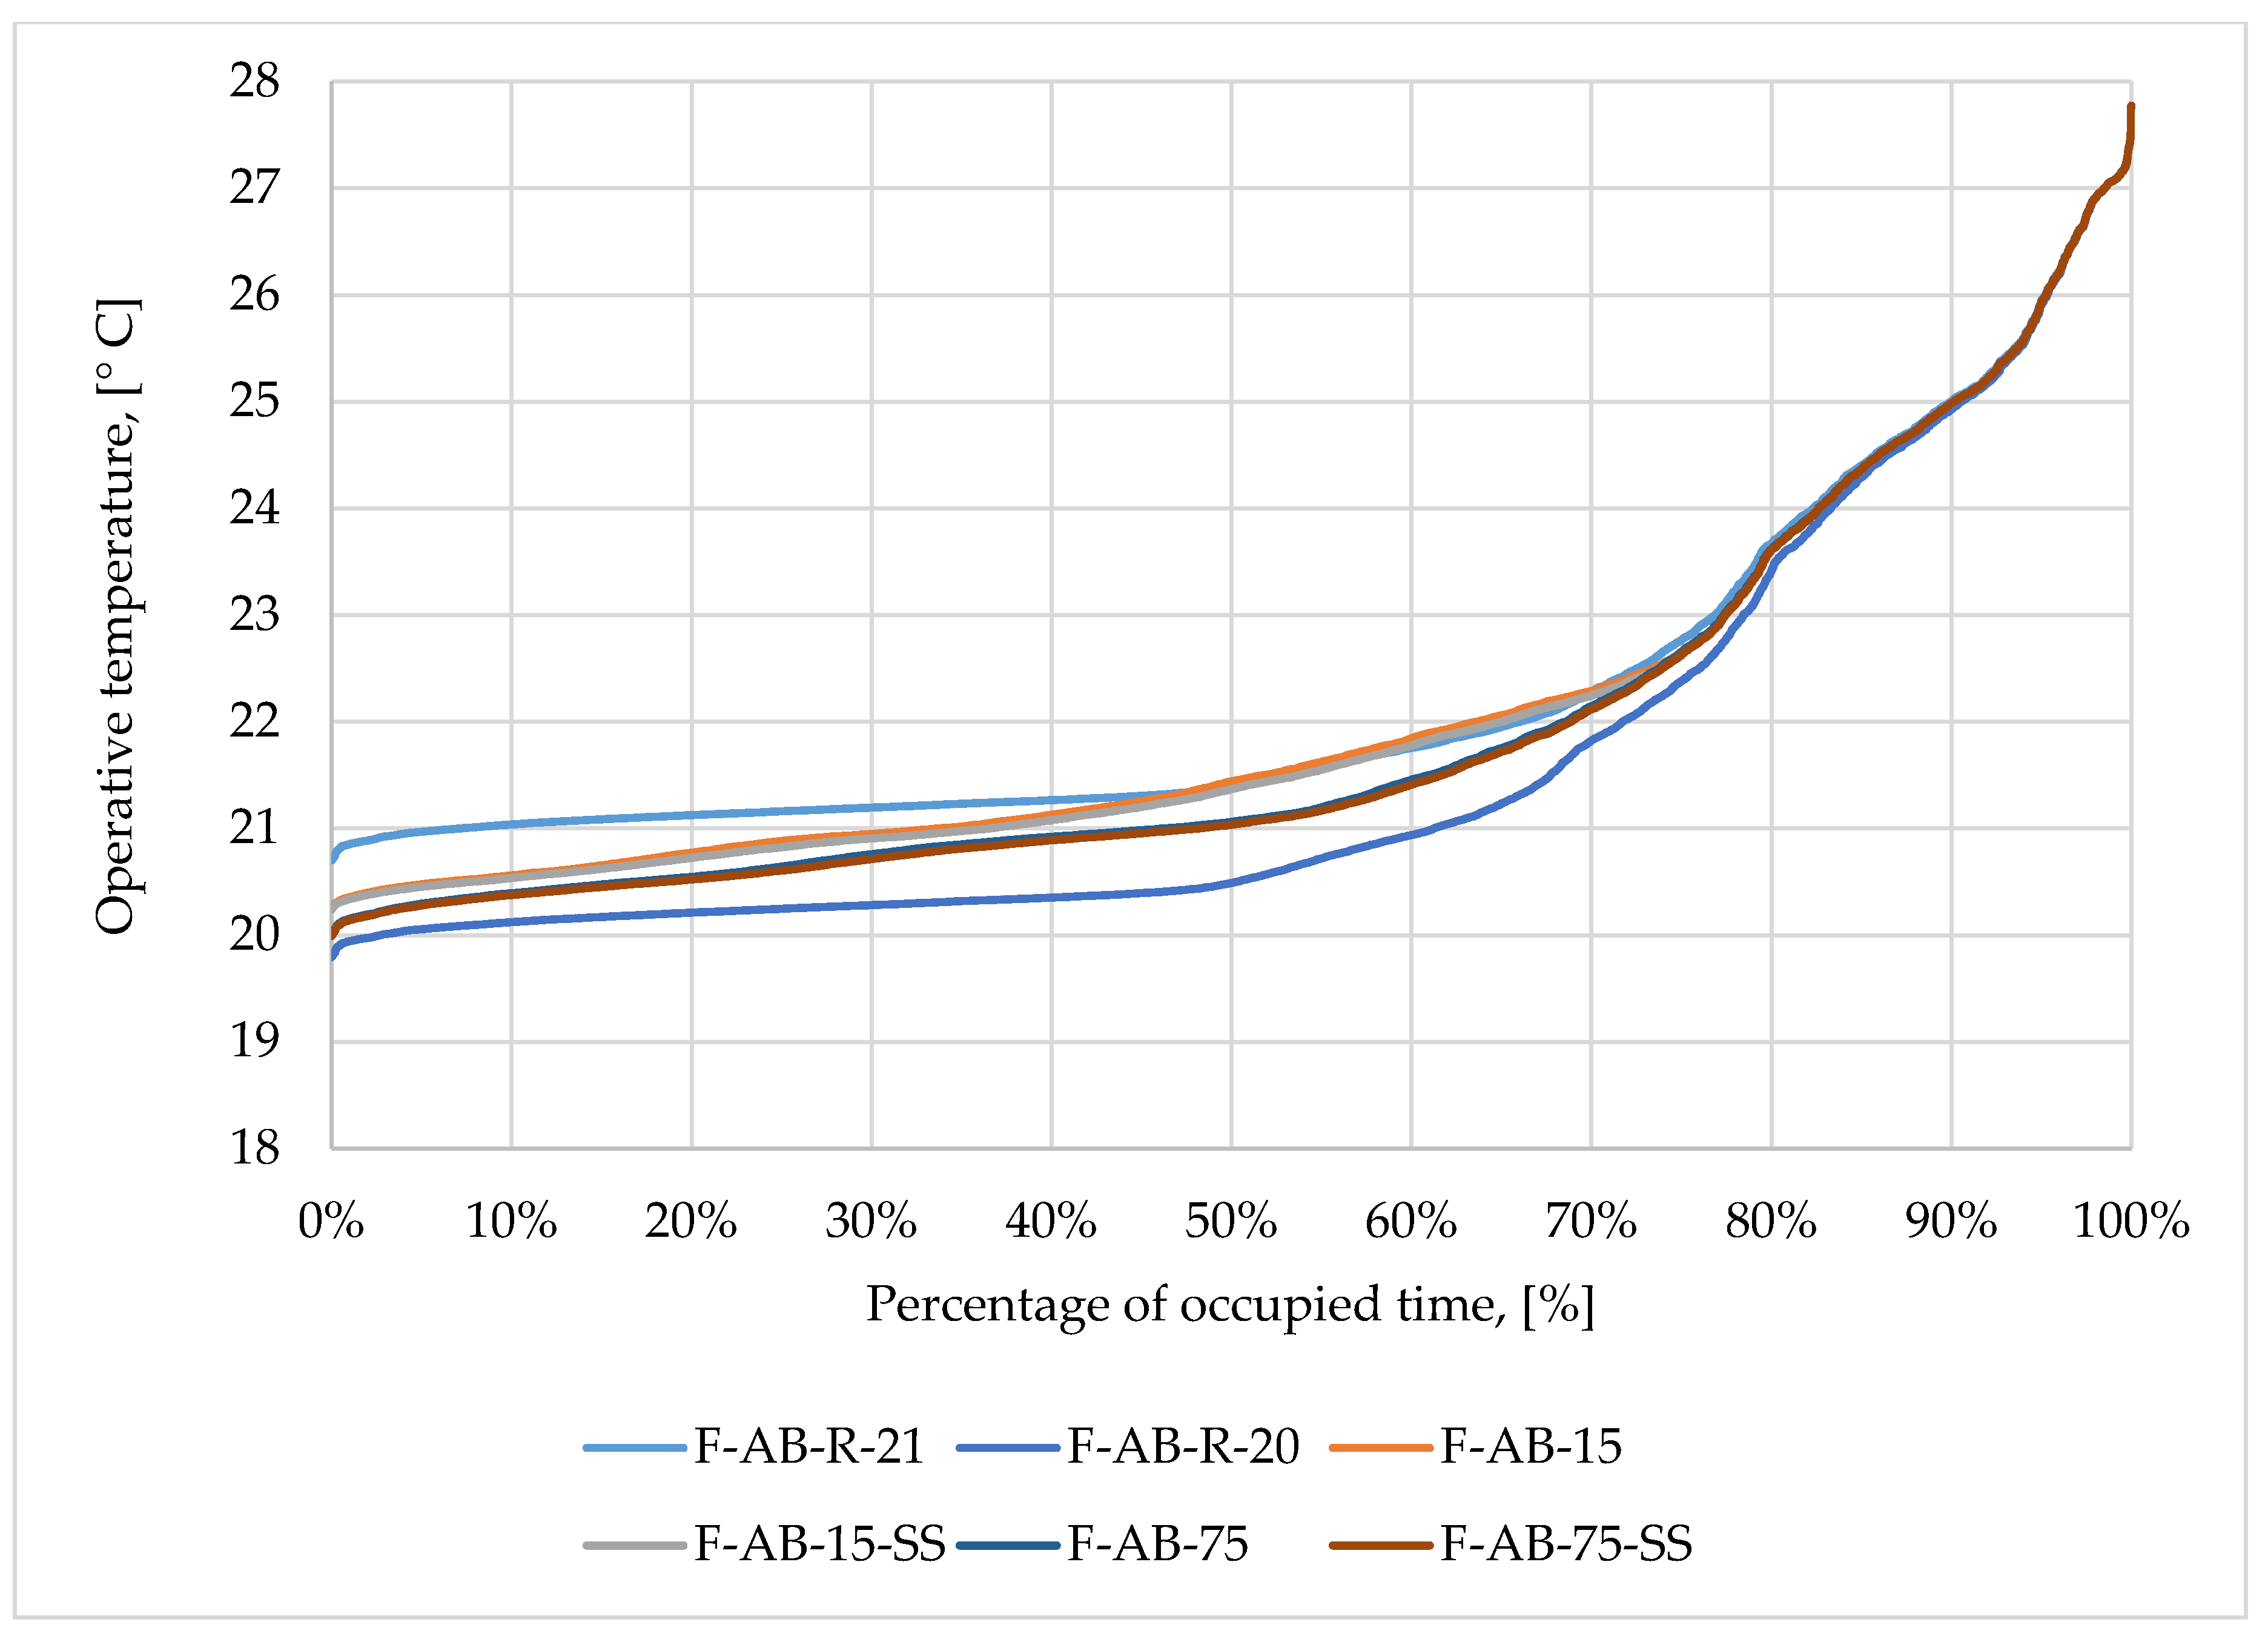
Figure 12 presents the duration of operative indoor temperatures of the apartment building simulations in Finland. The operative temperature is the lowest in the case F-AB-R-20 with constantly lower setpoint of space heating through the year. Operative temperature drops below 20 °C for 2.7% of the time. Operative temperature is the highest most of the time in the case F-AB-R-21 with constant setpoint of 21 °C of space heating. Among demand response-controlled cases, the temperature does not drop below 20 °C except in the case with higher marginal value and setpoint smoothing (F-AB-75-SS) where it occurs only for 0.03% of the time. Demand response-controlled cases with lower marginal value (F-AB-15 and F-AB-15-SS) have slightly higher indoor temperatures than that of demand response cases with higher marginal value for about 73% of the time. After that the temperatures even out. Curves indicate that the setpoint smoothing does not have significant effect on the operative temperatures.
Table 14 presents the degree hours and total number of hours that the operative indoor temperature is below the minimum acceptable level. The reference case 2 with constant setpoint of 20 °C (F-AB-R-20) has the highest amount of degree hours that temperature is below the minimum acceptable level among Finnish apartment cases. The temperature falls below 20 °C for 13 °Ch and for total of 237 h. In the case with higher marginal value and setpoint smoothing (F-AB-75-SS), there are 3 h during the year that temperature is below 20 °C, but the temperature difference to 20 °C is negligible so it does not count in degree hours. In other demand response-controlled cases, the temperature stays above the minimum acceptable level.
Even though the constantly lowered indoor temperature provided the highest savings, it also has the most effect to the thermal conditions. Unlike reference case 2, the indoor temperature stays at acceptable level almost entire year in demand response-controlled cases, and they also provide district heating energy and cost savings which makes demand response control important topic of study.
Table 15 presents the temperature results of the German apartment simulations. In reference case 2, the operative temperature is below acceptable level for 67 °Ch and for 801 h, which accounts for 9.1% of the year. In the demand response-controlled case with higher marginal value and setpoint smoothing (G-AB-75-SS), the temperature drops below 20 °C for 4 °Ch and 76 h, which accounts for less than 1% of the year. The difference between constant temperature and demand response- controlled case is significant in the German apartment cases, especially in the duration that operative indoor air temperature is below acceptable level. Temperature stays always higher in the demand- controlled case than in the case with constant set point of 20 °C.
Figure 13 presents the duration of operative indoor temperature of cultural center simulations in Finland. The operative temperature is the lowest for about 95.5% of the occupied hours of the year in the reference case 2 (F-CC-R-20). In that case the temperature is below the acceptable level for 3.5% of the occupied hours of the year. Moreover, in the case with higher marginal value, setpoint smoothing, and night-time setback (F-CC-75-SS-NT), the temperature is below 20 °C for about 3.7% of the occupied hours. In the corresponding case without night-time setback (F-CC-75-SS), the indoor temperature is below 20 °C 0.9% of the occupied hours. Thus, the night-time setback has more effect on the temperature dropping below acceptable level than the demand response control. In demand response-controlled cases without night-time setback, the temperature stays above the temperature of the reference case 2 (F-CC-R-20) entire year.
In the case simulations with night-time setback, the temperature is below 20 °C only in the early occupied hours in the heating season. This results from the lowered setpoint in the night-time as, during the coldest periods, the indoor air temperature does not have enough time to increase above 20 °C before the usage starts. However, the temperature increases to the acceptable level during the first hours of usage.
Table 16 presents the degree hours and total number of hours that temperature is below 20 °C in the Finnish cultural center simulations. In the reference case 2, the temperature falls below acceptable level for 91 h and this results in 9 °Ch. In the case with higher marginal value, setpoint smoothing, and night-time setback (F-CC-75-SS-NT) the temperature is below 20 °C for 94 h and 14 °Ch. The corresponding case without night-time setback (F-CC-75-SS) results in 2 °Ch and total of 22 h below acceptable level over the year which is less than in reference case 2.
Table 17 presents the operative temperature results of German cultural center simulations. Reference case 2 (G-CC-R-20) results in 12 °Ch and 106 h below acceptable temperature during the occupied hours. In the other hand, the case with higher marginal value, setpoint smoothing, and night-time setback (G-CC-75-SS-NT) results 9 °Ch and 70 h, which again is less than with the constant setpoint of space heating. In the case G-CC-75-SS-NT the operative temperature is less than in the reference case 2 for 1.1% of the occupied time. These hours also occurred in the early mornings during the heating season. Moreover, in cultural center cases, the best demand response-controlled case saving-wise results less unacceptable temperatures in Germany than in Finland.
Figure 14 shows the duration of operative indoor temperatures of the Finnish office building simulations. In the reference case 2, operative temperature is below 20 °C for about 6.4% of the occupied hours.
Table 18 indicates that this results in total of 129 h and 13 °Ch below 20 °C. The temperature is below 20 °C 15.9% of the occupied time in the case with higher marginal value, setpoint smoothing, and night-time setback (F-OB-75-SS-NT). This results in 114 °Ch and total of 320 h. The corresponding case without night-time setback (F-OB-75-SS) results in 1 °Ch and total of 16 h below 20 °C. Thus, in the case F-OB-75-SS-NT, the temperature is caused to drop below the acceptable level by the night-time setback rather than the demand response control.
The night-time setback has the highest impact on the indoor air temperatures in the office building. In the office building simulations, the temperature does not increase to the acceptable level after the night-time as fast as in the cultural center simulations. Figure 10 and Table 18 illustrate that the difference between simulations with DR and DR + NT algorithms have significant difference in the degree hours that indoor air temperature is below 20 °C. Moreover, there is one day that the temperature does not increase above 20 °C at all during the occupation. This occurs during the coldest time of the year.
Curves indicate that setpoint smoothing’s effect on indoor air temperatures is negligible as in other building types. With lower marginal value there is no difference in the degree hours nor total hours whether the setpoint smoothing is applied or not. With higher marginal value the setpoint smoothing results the temperature to drop below 20 °C only for two hours more than without setpoint smoothing.
Table 19 presents the operative indoor temperature results of the German office building simulations. In the reference case 2 (G-OB-R-20), the temperature is below 20 °C for 16 °Ch and total of 146 h during the occupied hours of the year. In the case with higher marginal value, setpoint smoothing, and night-time setback (G-OB-75-SS-NT), the corresponding results are 71 °Ch and 214 h. In the case G-OB-75-SS-NT, the temperature is higher than in reference case 2 for 70% of the occupied time. Again, the hours that temperature is lower in the case G-OB-75-SS-NT occur during the early morning usage hours during the heating season. Indoor air temperature does not lower as much as in the Finnish office building cases due to the night-time setback and stays acceptable larger share of the occupied time.

4. Discussion

More flexible district heating energy networks are required to maximize the potential of renewable integration to the energy system. Moreover, the peak power demand should be decreased and make the demand curve flatter, so the high emitting peak power fuels can be dropped from the system. Building owners tend to need an incentive to take actions towards more sustainable built environment. Results indicate that by providing modest savings the demand response control of space heating could be an action to consider. The study resulted saving potentials of similar range as previous research about demand response control with different heat sources [5,21,29]. Study indicates that savings can be achieved in different building types and climate conditions. Moreover, savings were achieved under different dynamic price profiles although level of price fluctuation effected the savings. Even though the recent studies state that there are still no findings of the district heating production side benefits (e.g., peak shaving) and value creation to the production company, the notion that building owners may benefit from the demand response control is strengthened [6,63].
One °C drop in the setpoint and night-time set back were the most profitable actions in all reference buildings. Even though they are not actual demand response actions they are very effective way to decrease district heating energy consumption and cost. However, this lowered setpoint has a few drawbacks. First, it does not provide flexibility to the district heating energy network. As the variable renewable energy sources are integrated to the energy system, the resilience of the system becomes more important. The end users should be tempted to become active actors in the energy system and market. In the future, end users should act as prosumers, who actively interact with the system by providing flexibility, and further, feeding energy back to the network. Demand response control enables the flexible demand and has potential to increase the resilience of the system. Dynamic pricing of district heating energy can operate as an incentive to the customers and they can generate savings by enabling flexible demand. Dynamic pricing is not currently implemented in district heating networks. However, results indicate that it could act as an important mechanism to encourage customers to take actions in their heat demand. It is necessary that the district heating companies provide the right incentives to the market as flexibility can have mutual benefits.
Second, with constantly lowered setpoint the indoor air temperature stays lower through the year than with the demand response controlled setpoint excluding the cases simulated with DR + NT algorithm. Investigating the demand response control’s effect on the indoor air temperature is inevitable when studying its saving potential. The thermal comfort of the occupants cannot be risked when district heating energy and cost savings are tried to achieve. Poor thermal conditions effects occupants’ health and can lead to remarkable issues. Moreover, thermal comfort has proven impact on the performance and productivity which is can lead to costs to individuals or companies using the building. Savings from the energy may be lost due to the occupants’ sick leaves and decreased performance and productivity.
Furthermore, night-time setback enables savings in the night-time and reduces the unnecessary space heating outside the usage hours. However, as the results indicate, it is important to increase the setpoint early before the usage of the building starts to ensure the acceptable indoor air temperature in the spaces by beginning of the usage. Moreover, it is important to synchronize the reheating in the morning within the district heating system to avoid creating more peak load to the morning hours [64,65]. This means that the reheating should not occur simultaneously but consecutively. Moreover, the smart control and flexibility of the reheating could be implemented to the system as well, so the morning peaks would be avoided. Setpoint smoothing is also an alternative to round and reduce the power peaks of reheating.
Rebound effect was noted as a potential downside of demand response control. However, the results of this study indicate that the effect is not significant. In this study, the changes in the setpoint of space heating are relatively low thus notable rebound does not occur. The greater the changes in the controlled parameter, the higher the risk for the significant rebound effect is.
This study examined demand response actions with two different dynamic price data which differed in means of fluctuation. Results indicate that the level of fluctuation has a major role in the DR control’s district heating energy saving potential and economic profitability. Moreover, the marginal value of control signal has a key role in the saving potential that demand response control enables. Marginal value effects the saving potential differently under different price profiles thus their impact must be examined simultaneously. Under fluctuating price profile, higher marginal value results in higher savings than lower as it makes the control algorithm less sensitive to the price changes. This leads to less heat loading hours thus more savings in energy and cost for the building owner. When the price profile is flatter, the marginal value has less effect on the outcome. District heating energy and cost saving potential is highly dependent on the applied price profile and the control signal marginal value used in each case. Their cooperative actions offer an interesting topic for further examination.
The results of this study are applicable to the studied building types of the related era under similar climate conditions and price profile of district heating energy. However, different scenarios could be examined using the same methodology. The control signal’s calculation method, control algorithms and simulation method could be used in any type of building and under different climate conditions and price data. Moreover, the extent of the simulation cases makes the results widely applicable in the actual demand response cases in current building stock as the simulation cases represent a real building. These building types represent a large quantity of the current building stock in the existing district heating networks.

5. Conclusions

In this paper, the district heating energy and cost saving potential of rule-based demand response control of space heating was studied. Studied buildings were apartment buildings, cultural centers and office buildings. The buildings were studied under Finnish and German weather conditions, and with according dynamic district heating price profile.
Results show that demand response actions can enable modest district heating energy and cost savings. Among Finnish simulation cases the highest saving potential was obtained in the office building. District heating energy and cost saving potential were 6.8% and 7.8%, respectively. The cultural center provided the best saving potential among the German cases. The corresponding savings were 7.7% and 8.1%, respectively. The lower marginal value makes the demand response control algorithm too sensitive against district heating price changes with Finnish price data and does not enable notable savings. In the German simulation cases, the saving potential was the same regardless the marginal value. This resulted from the flatter price profile.
Even though the constantly lowered space heating setpoint in reference cases 2 usually provides more district heating energy and cost saving potential than demand response-controlled cases it does not provide desired flexibility to the district heating network. When the setpoint is constantly lowered, buildings do not act as a thermal energy storage system. Demand response control of space heating increases the energy and power flexibility of district heating network, provides modest savings to the building owner, but also maintains the indoor air temperature at the acceptable level more than a constantly lowered setpoint.
Indoor air temperature was sustained at an acceptable level almost the entire occupied time regardless of the DR control of the space heating. The indoor air temperature did not drop below the minimum acceptable temperature significantly, or at all, due to the demand-response actions. The night-time setback caused the indoor air temperature to drop below the acceptable level during the night-time, but the temperature increased to an acceptable level during the first hours of occupation or even before the building was occupied. Only in Finnish office building simulations there was one day that the temperature did not increase to the required level during the coldest time of the simulation year.
Upwards smoothing of the setpoint did not provide significant additional savings to the demand response control. This indicates that the rebound effect is not remarkable in the DR actions used in the study. Results indicate that the night-time setback provides significant savings even though it is not an actual demand response action. This might however cause the indoor air temperature to be below acceptable level in the first hours of the usage in the heating season in some cases.
This study focused on the effects of the demand response control in building owners’ point of view. The district heating energy and cost saving potential was investigated. However, the study will be continued by analyzing the effects of the demand response actions from the district heating network’s and producers’ perspective.

Author Contributions

The authors have contributed to this research in the following way: conceptualization, J.S., V.K., J.J., R.K.; methodology, V.K., J.J., R.K., P.J.; software, V.K., Y.J., J.J.; validation, J.S., Y.J., J.J., R.K.; formal analysis, J.S.; investigation, J.S.; resources, J.J., R.K., P.J.; data curation, J.J., R.K.; writing—original draft preparation, J.S.; writing—review and editing, J.J., R.K.; visualization, J.S.; supervision, R.K.; project administration, R.K.; funding acquisition, R.K., J.J. All authors have read and agreed to the published version of the manuscript.

Funding

This study is part of the Smart Proheat—Smart Prosumer Heating Technologies and FINEST Twins projects. Smart Proheat project is funded by Business Finland and private companies Caverion Ltd., Fourdeg Ltd., Halton Ltd., and Aalto University as well as the Federal Ministry for Economic Affairs and Energy of Germany in the project; EnEff:Wärme SmartProHeaT: Smart Prosumer Heating Technologies, Subproject: Integration of smart prosumers into smart thermal grids (Project number: 03ET1598). FINEST Twins project is funded by European Union (Horizon 2020 programme, Grant No. 856602) and the Estonian government.

Acknowledgments

Authors would like to thank the steering group of Smart Proheat project: Olli Nummelin and Nelli Melolinna from Caverion Ltd., Markku Makkonen from Fourdeg Ltd. and Panu Mustakallio from Halton Ltd. and the colleagues from University of Applied Sciences Hamburg: Jan Trosdorff, Moritz Verbeck and Hans Schäfers for support and fruitful discussions.

Conflicts of Interest

The authors declare no conflict of interest.

References

  1. European Comission. Energy Performance of Buildings Directive. Available online: https://ec.europa.eu/energy/topics/energy-efficiency/energy-efficient-buildings/energy-performance-buildings-directive_en#energy-performance-of-buildings-standards (accessed on 12 April 2020).
  2. Perez-Lombard, L.; Ortiz, J.; Pout, C. A Review on Buildings Energy Consumption Information. Energy Build. 2008, 40, 394. [Google Scholar] [CrossRef]
  3. IEA. Transition to Sustainable Buildings: Strategies and Opportunities to 2050. Available online: https://doi.org/10.1787/9789264202955-en (accessed on 12 April 2020).
  4. Tronchin, L.; Manfren, M.; Nastasi, B. Energy efficiency, demand side management and energy storage technologies—A critical analysis of possible paths of integration in the built environment. Renew. Sustain. Energy Rev. 2018, 95, 341–353. [Google Scholar] [CrossRef]
  5. Alimohammadisagvand, B.; Alam, S.; Ali, M.; Degefa, M.; Jokisalo, J.; Sirén, K. Influence of energy demand response actions on thermal comfort and energy cost in electrically heated residential houses. Indoor Built Environ. 2017, 26, 298–316. [Google Scholar] [CrossRef]
  6. Salo, S.; Hast, A.; Jokisalo, J.; Kosonen, R.; Syri, S.; Hirvonen, J.; Martin, K. The Impact of Optimal Demand Response Control and Thermal Energy Storage on a District Heating System. Energies 2019, 12, 1678. [Google Scholar] [CrossRef] [Green Version]
  7. Gelazanskas, L.; Gamage, K. Demand side management in smart grid: A review and proposals for future direction. Sustain. Cities Soc. 2014, 11, 22–30. [Google Scholar] [CrossRef]
  8. Palensky, P.; Dietrich, D. Demand Side Management: Demand Response, Intelligent Energy Systems, and Smart Loads. IEEE Trans. Ind. Inform. 2011, 7, 381–388. [Google Scholar] [CrossRef] [Green Version]
  9. Wang, S.; Xue, X.; Yan, C. Building power demand response methods toward smart grid. HVAC R Res. 2014, 20, 665–687. [Google Scholar] [CrossRef]
  10. Le Dréau, J. Heiselberg, Energy flexibility of residential buildings using short term heat storage in the thermal mass. Energy 2016, 111, 991–1002. [Google Scholar] [CrossRef]
  11. Kensby, J.; Trüschel, A.; Dalenbäck, J. Potential of residential buildings as thermal energy storage in district heating systems—Results from a pilot test. Appl. Energy 2015, 137, 773–781. [Google Scholar] [CrossRef]
  12. Lund, H.; Werner, S.; Wiltshire, R.; Svendsen, S.; Thorsen, J.; Hvelplund, F.; Mathiesen, B. 4th Generation District Heating (4GDH) Integrating smart thermal grids into future sustainable energy systems. Energy 2014, 68, 1–11. [Google Scholar] [CrossRef]
  13. Paiho, S.; Saastamoinen, H. How to develop district heating in Finland? Energy Policy 2018, 122, 668–676. [Google Scholar] [CrossRef]
  14. Finnish Energy. Energiavuosi 2019, Kaukolämpö (Energy Year 2019, District Heating). Finnish Energy. Helsinki. Finland. 2019. Available online: https://energia.fi/files/4402/Energiavuosi2019_Kaukolampo_MEDIAKUVAT_20200120.pdf (accessed on 15 April 2020). (In Finnish).
  15. Hillamo, H. Kaukolämpöverkot Suomessa (District Heating Networks in Finland). Finnish Energy. 2019. Available online: https://energia.fi/files/3982/Hillamo_Kaukolampoverkot_Suomessa_KL-paivat_2019_.pdf (accessed on 15 April 2020). (In Finnish).
  16. Moczko, D. District Heating in Germany. Available online: https://www.euroheat.org/knowledge-hub/district-energy-germany (accessed on 4 August 2020).
  17. BDEW. Energy Market Germany Bundesverband der Energie- und Wasserwirtschaft e. V. Available online: https://www.bdew.de/media/documents/Pub_20190603_Energy-Market-Germany-2019.pdf (accessed on 4 August 2020).
  18. Gadd, H.; Werner, S. Daily heat load variations in Swedish district heating systems. Appl. Energy 2013, 106, 47–55. [Google Scholar] [CrossRef] [Green Version]
  19. Vandermeulen, A.; van Der Heijde, B.; Helsen, L. Controlling district heating and cooling networks to unlock flexibility: A review. Energy 2018, 151, 103–115. [Google Scholar] [CrossRef]
  20. Lorenzen, P.; Janßen, P.; Winkel, M.; Klose, D.; Kernstock, P.; Schrage, J.; Schubert, F. Design of a Smart Thermal Grid in the Wilhelmsburg district of Hamburg: Challenges and approaches. Energy Procedia 2018, 149, 499–508. [Google Scholar] [CrossRef]
  21. Vand, B.; Martin, K.; Jokisalo, J.; Kosonen, R.; Hast, A. Demand response potential of district heating and ventilation in an educational office building. Sci. Technol. Built Environ. 2020, 26, 304–319. [Google Scholar] [CrossRef]
  22. Yoon, J.H.; Baldick, R.; Novoselac, A. Demand response control of residential HVAC loads based on dynamic electricity prices and economic analysis. Sci. Technol. Built Environ. 2016, 22, 705–719. [Google Scholar] [CrossRef]
  23. Wang, S. Making buildings smarter, grid-friendly, and responsive to smart grids. Sci. Technol. Built Environ. 2016, 22, 629–632. [Google Scholar] [CrossRef] [Green Version]
  24. Aduda, K.; Labeodan, T.; Zeiler, W.; Boxem, G. Demand side flexibility coordination in office buildings: A framework and case study application. Sustain. Cities Soc. 2017, 29, 139–158. [Google Scholar] [CrossRef] [Green Version]
  25. Feuerriegel, S.; Neumann, D. Integration scenarios of Demand Response into electricity markets: Load shifting, financial savings and policy implications. Energy Policy 2016, 96, 231. [Google Scholar] [CrossRef] [Green Version]
  26. Müller, T.; Möst, D. Demand Response Potential: Available when Needed? Energy Policy 2018, 115, 181–198. [Google Scholar] [CrossRef]
  27. Alimohammadisagvand, B.; Jokisalo, J.; Siren, K. Comparison of four rule-based demand response control algorithms in an electrically and heat pump-heated residential building. Appl. Energy 2018, 209, 167–179. [Google Scholar] [CrossRef] [Green Version]
  28. Vahid, A. A novel cost-optimizing demand response control for a heat pump heated residential building. Build. Simul. 2018, 11, 533–547. [Google Scholar] [CrossRef]
  29. Alimohammadisagvanda, B.; Jokisaloa, J.; Kilpelaeinena, S.; Alib, M.; Sirena, K. Cost-optimal thermal energy storage system for a residential building with heat pump heating and demand response control. Appl. Energy 2016, 174, 275–287. [Google Scholar] [CrossRef]
  30. Mishra, A.; Jokisalo, J.; Kosonen, R.; Kinnunen, T.; Ekkerhaugen, M.; Ihasalo, H.; Martin, K. Demand response events in district heating: Results from field tests in a university building. Sustain. Cities Soc. 2019, 47, 101481. [Google Scholar] [CrossRef]
  31. Sisäilmayhdistys ry (Finnish Society of Indoor Air Quality). Sisäilmastoluokitus 2018 (Classification of Indoor Environment 2018). 2018. Available online: https://www.rakennustietokauppa.fi/sivu/tuote/rt-07-11299-sisailmastoluokitus-2018-sisaympariston-tavoitearvot-suunnitteluohjeet-ja-tuotevaatimukset/2742604 (accessed on 20 February 2020). (In Finnish).
  32. EN 15251. Indoor Environmental input Parameters for Design and Assessment of Energy Performance of Buildings Addressing Indoor Air Quality, Thermal Environment, Lighting and Acoustics; The European Committee for Standardization (CEN): Brussels, Belgium, 2007. [Google Scholar]
  33. Jylhä, K.; Kalamees, T.; Tietäväinen, H.; Ruosteenoja, K.; Jokisalo, J.; Hyvönen, R.; Ilomets, S.; Saku, S.; Hutila, A. Rakennusten Energialaskennan Testivuosi 2012 ja Arviot Ilmastonmuutoksen Vaikutuksista (Test Reference Year 2012 for Building Energy Demand and Impacts of Climate Change). Finnish Meteorological Institute. Available online: https://helda.helsinki.fi/bitstream/handle/10138/33069/2011nro6.pdf?sequence=1&isAllowed=y (accessed on 20 February 2020). (In Finnish).
  34. Kalamees, T.; Jylhae, K.; Tietaevaeinen, H.; Jokisalo, J.; Ilomets, S.; Hyvonen, R.; Saku, S. Development of weighting factors for climate variables for selecting the energy reference year according to the EN ISO 15927-4 standard. Energy Build. 2012, 47, 53–60. [Google Scholar] [CrossRef]
  35. Ministry of the Environment. D3 Finnish Code of Building Regulation. Rakennusten Energiatehokkuus (Energy Efficiency of Buildings). Regulations and Guidelines; Ministry of the Environment: Helsinki, Finland, 2012. (In Finnish)
  36. Deutscher Wetterdienst (DWD). Handbuch, Ortsgenaue Testreferenzjahre von Deutschland für Mittlere, Extreme und Zukünftige Witterungsverhältnisse (Handbook, Locally Accurate Test Reference Years from Germany for Medium, Extreme and Future Weather Conditions). 2017. Available online: https://www.bbsr.bund.de/BBSR/DE/forschung/programme/zb/Auftragsforschung/5EnergieKlimaBauen/2013/testreferenzjahre/try-handbuch.pdf?__blob=publicationFile&v=3 (accessed on 14 September 2020). (In German).
  37. Deutscher Wetterdienst (DWD). Projektbericht, Ortsgenaue Testreferenzjahre von Deutschland für Mittlere, Extreme und Zukünftige Witterungsverhältnisse (Project Report, Locally Accurate Test Reference Years from Germany for Medium, Extreme and Future Weather Conditions). 2017. Available online: https://www.bbsr.bund.de/BBSR/DE/forschung/programme/zb/Auftragsforschung/5EnergieKlimaBauen/2013/testreferenzjahre/try-projektbericht.pdf?__blob=publicationFile&v=3 (accessed on 14 September 2020). (In German).
  38. Finnish Meteorological Institute. Heating Degree Days. [Website]. Available online: https://en.ilmatieteenlaitos.fi/heating-degree-days (accessed on 20 September 2020).
  39. Sandrock, M.; Maaß, C.; Weisleder, S.; Kaufmann, C.; Fuß, G.; Sørensen, A.; Jensen, L.L.; Radmann, K. Erneuerbare Energien im Fernwärmenetz Hamburg—Teil 1: Handlungsoptionen für einen kurzfristigen Ersatz des Kraftwerks Wedel. HIC Hamburg Institut Consulting GmbH. (Renewable Energies for District Heating in Hamburg—Part 1: Options for Action for a Short-Term Replacement of the Wedel Combined Heat and Power Plant). 2016. Available online: https://www.hamburg-institut.com/images/pdf/studien/161207%20%20Bericht%20BUE.pdf (accessed on 10 November 2020). (In German).
  40. Bundesnetzagentur für Elektrizität, Gas, Telekommunikation, Post und Eisenbahnen (Publisher). Biogas-Monitoringbericht 2014—Bericht der Bundesnetzagentur Über Die Auswirkungen der Sonderregelungen für die Einspeisung von Biogas in das Erdgasnetz. (Biogas Monitoring Report 2014—Report of the German Bundesnetzagentur on the Effects of the Special Regulations for the Feed-in of Biogas into the Natural Gas Grid). Bonn. 2014. Available online: https://www.bundesnetzagentur.de/SharedDocs/Downloads/DE/Sachgebiete/Energie/Unternehmen_Institutionen/ErneuerbareEnergien/Biogas/Biogas_Monitoring/Biogas_Monitoringbericht_2014.pdf?__blob=publicationFile&v=1 (accessed on 10 November 2020). (In German).
  41. BDEW Bundesverband der Energie- und Wasserwirtschaft e.V. (Publisher). Umsetzungshilfe zum EEG 2012—Empfehlungen für Netzbetreiber zur Umsetzung des Gesetzes für den Vorrang Erneuerbarer Energien (Erneuerbare-Energien-Gesetz—EEG) und der Damit Verbundenen Verordnungen. (Implementation Assistance for the EEG 2012—Recommendations for Grid Operators for the Implementation of the Act on the Priority of Renewable Energies (Renewable Energy Sources Act—EEG) and the Associated Ordinances.) Berlin. 2013. Available online: https://www.bdew.de/media/documents/Awh_20130516_BDEW-Umsetzungshilfe-EEG-2012.pdf (accessed on 10 November 2020). (In German).
  42. Vattenfall Wärme Hamburg GmbH (Publisher). Preisblatt 2. Quartal 2019. (Price sheet 2nd Quarter 2019). 2019. Available online: https://waerme.hamburg/media/71/download/Preisblatt_Hamburg_Q2-2019.pdf?v=2 (accessed on 2 March 2020).
  43. Sahlin, P. Modelling and Simulation Methods for Modular Continuous Systems in Buildings. Ph.D. Thesis, Royal Institute of Technology (KTH), Stockholm, Sweden. Available online: https://www.equa.se/dncenter/thesis.pdf (accessed on 2 March 2020).
  44. Kropf, S.; Zweifel, G. Validation of the Building Simulation Program IDA-ICE According to CEN Hochschule Für Technik+Architektur Luzern. Available online: http://www.equaonline.com/iceuser/validation/ICE_vs_prEN%2013791.pdf (accessed on 2 March 2020).
  45. EQUA. Validation of IDA Indoor Climate and Energy 4.0 with respect to CEN Standards EN 15255-2007 and EN 15265-EQUA Simulation AB. Available online: http://www.equaonline.com/iceuser/validation/CEN_VALIDATION_EN_15255_AND_15265.pdf (accessed on 2 March 2020).
  46. Achermann, M.; Zweifel, G. RADTEST—Radiant Heating and Cooling Test Cases. A Report of Task IEA. Available online: http://www.equaonline.com/iceuser/validation/old_stuff/RADTEST_final.pdf (accessed on 2 March 2020).
  47. Moinard, S.; Guyon, G. Empirical Validation of EDF ETNA and GENEC Test-Cell Models. A Report of Task IEA. Available online: http://www.equaonline.com/iceuser/validation/old_stuff/ETNA.pdf (accessed on 2 March 2020).
  48. Bring, A.; Sahlin, P.; Vuolle, M. Models for Building Indoor Climate and Energy Simulation. A Report of IEA Task IEA. Available online: https://www.equa.se/dncenter/T22Brep.pdf (accessed on 2 March 2020).
  49. Ministry of the Environment. D3 Finnish Code of Building Regulation. Rakennusten Energiatehokkuus (Energy Efficiency of Buildings). Regulations and Guidelines; Ministry of the Environment: Helsinki, Finland, 1985. (In Finnish)
  50. Ministry of Environment. Finnish Code of Building Code Energiatehokkuus (Energy Efficiency). Ministry of Environment. Helsinki. Finland. 2017. Available online: https://www.edilex.fi/data/rakentamismaaraykset/Ohje_Rakennuksen_energiankulutuksen_ja_lammitystehontarpeen_laskenta_20-12-2017.pdf (accessed on 4 May 2020). (In Finnish)
  51. EN Ventilation for non-residential buildings. Performance Requirements for Ventilation and Room-Conditioning Systems; The European Committee for Standardization (CEN): Brussels, Belgium, 2007. [Google Scholar]
  52. TABULA WebTool. Available online: http://webtool.building-typology.eu/#bm (accessed on 5 February 2020).
  53. Loga, T.; Imkeller-Benjes, U. Energiepaß Heizung/Warmwasser (Energy Demand Heating/Hot Water). 1997. Available online: https://www.delta-q.de/export/sites/default/de/downloads/hessischer_energiepass.pdf (accessed on 5 February 2020). (In German).
  54. Ministry of Environment. 1010/2017 Ympäristöministeriön Asetus Uuden Rakennuksen Energiatehokkuudesta (Decree 1010/2017 Ministry of Environment’s Decree on New Building’s Energy Efficiency); Ministry of Environment: Helsinki, Finland, 2017. (In Finnis)
  55. FINVAC (The Finnish Association of HVAC Societies). Opas Asuinrakennusten Ilmanvaihdon Mitoitukseen (The Guidelines of Ventilation Dimensioning in Apartment Building). FINVAC. 2017. Available online: https://finvac.org/wp-content/uploads/2020/06/Opas_asuinrakennusten_ilmanvaihdon_mitoitukseen_2017.pdf (accessed on 20 March 2020). (In Finnis).
  56. Mikola, A.; Kalamees, T.; Kõiv, T. Performance of ventilation in Estonian apartment buildings. Energy Procedia 2017, 132, 963–968. [Google Scholar] [CrossRef]
  57. FINVAC (The Finnish Association of HVAC Societies). Opas Ilmanvaihdon Mitoitukseen Muissa Kuin Asuinrakennuksissa (The guidelines of Ventilation Dimensioning in other Buildings than Apartment Building). FINVAC. 2017. Available online: https://finvac.org/wp-content/uploads/2020/06/Opas_ilmanvaihdon_mitoitukseen_muissa_kuin_asuinrakennuksissa_2017.pdf (accessed on 20 March 2020). (In Finnis).
  58. Seppänen, O.; Brelih, N.; Goeders, G.; Litiu, A. Health based Ventilation Guidelines for Europe. Work Package Existing Buildings, Building Codes, Ventilation Standards and Ventilation in Europe. The Final Report. REHVA. Available online: https://webgate.ec.europa.eu/chafea_pdb/assets/files/pdb/20091208/20091208_d05_oth5_en_ps.pdf (accessed on 2 August 2020).
  59. Martin, K. Demand Response of Heating and Ventilation within Educational Office Buildings. Master’s Thesis, Aalto University, Espoo, Finland. Available online: https://aaltodoc.aalto.fi/handle/123456789/29149 (accessed on 2 April 2020).
  60. Thermal Insolation Ordinance. Available online: https://www.bbsr-energieeinsparung.de/EnEVPortal/DE/Archiv/WaermeschutzV/WaermeschutzV1977/Download/WaermeschutzV77.pdf?__blob=publicationFile&v=1 (accessed on 3 April 2020).
  61. Vinha, J.; Korpi, M.; Kalamees, T.; Jokisalo, J.; Eskola, L.; Palonen, J.; Kurnitski, J.; Aho, H.; Salminen, M.; Salminen, K.; et al. Asuinrakennusten ilmanpitävyys, Sisäilmasto ja Energiatalous (Residential Buildings Airtightness, indoor Climate and Energy Economy). Research Report Tampere University of Technology. Tampere. Finland. Available online: https://tutcris.tut.fi/portal/fi/publications/asuinrakennusten-ilmanpitavyys-sisailmasto-ja-energiatalous(6c30917a-bbbf-4c38-a623-9ed88978384f).html (accessed on 4 May 2020).
  62. Shan, K.; Wang, S.; Yan, C.; Xiao, F. Building demand response and control methods for smart grids: A review. Sci. Technol. Built Environ. 2016, 22, 692. [Google Scholar] [CrossRef]
  63. Kontu, K.; Vimpari, J.; Penttinen, P.; Junnila, S. City Scale Demand Side Management in Three Different-Sized District Heating Systems. Energies 2018, 11, 3370. [Google Scholar] [CrossRef] [Green Version]
  64. Salo, S.; Jokisalo, J.; Syri, S.; Kosonen, R. Individual temperature control on demand response in a district heated office building in Finland. Energy 2019, 180, 946. [Google Scholar] [CrossRef]
  65. Noussan, M.; Jarre, M.; Poggio, A. Real operation data analysis on district heating load patterns. Energy 2017, 129, 70–78. [Google Scholar] [CrossRef] [Green Version]
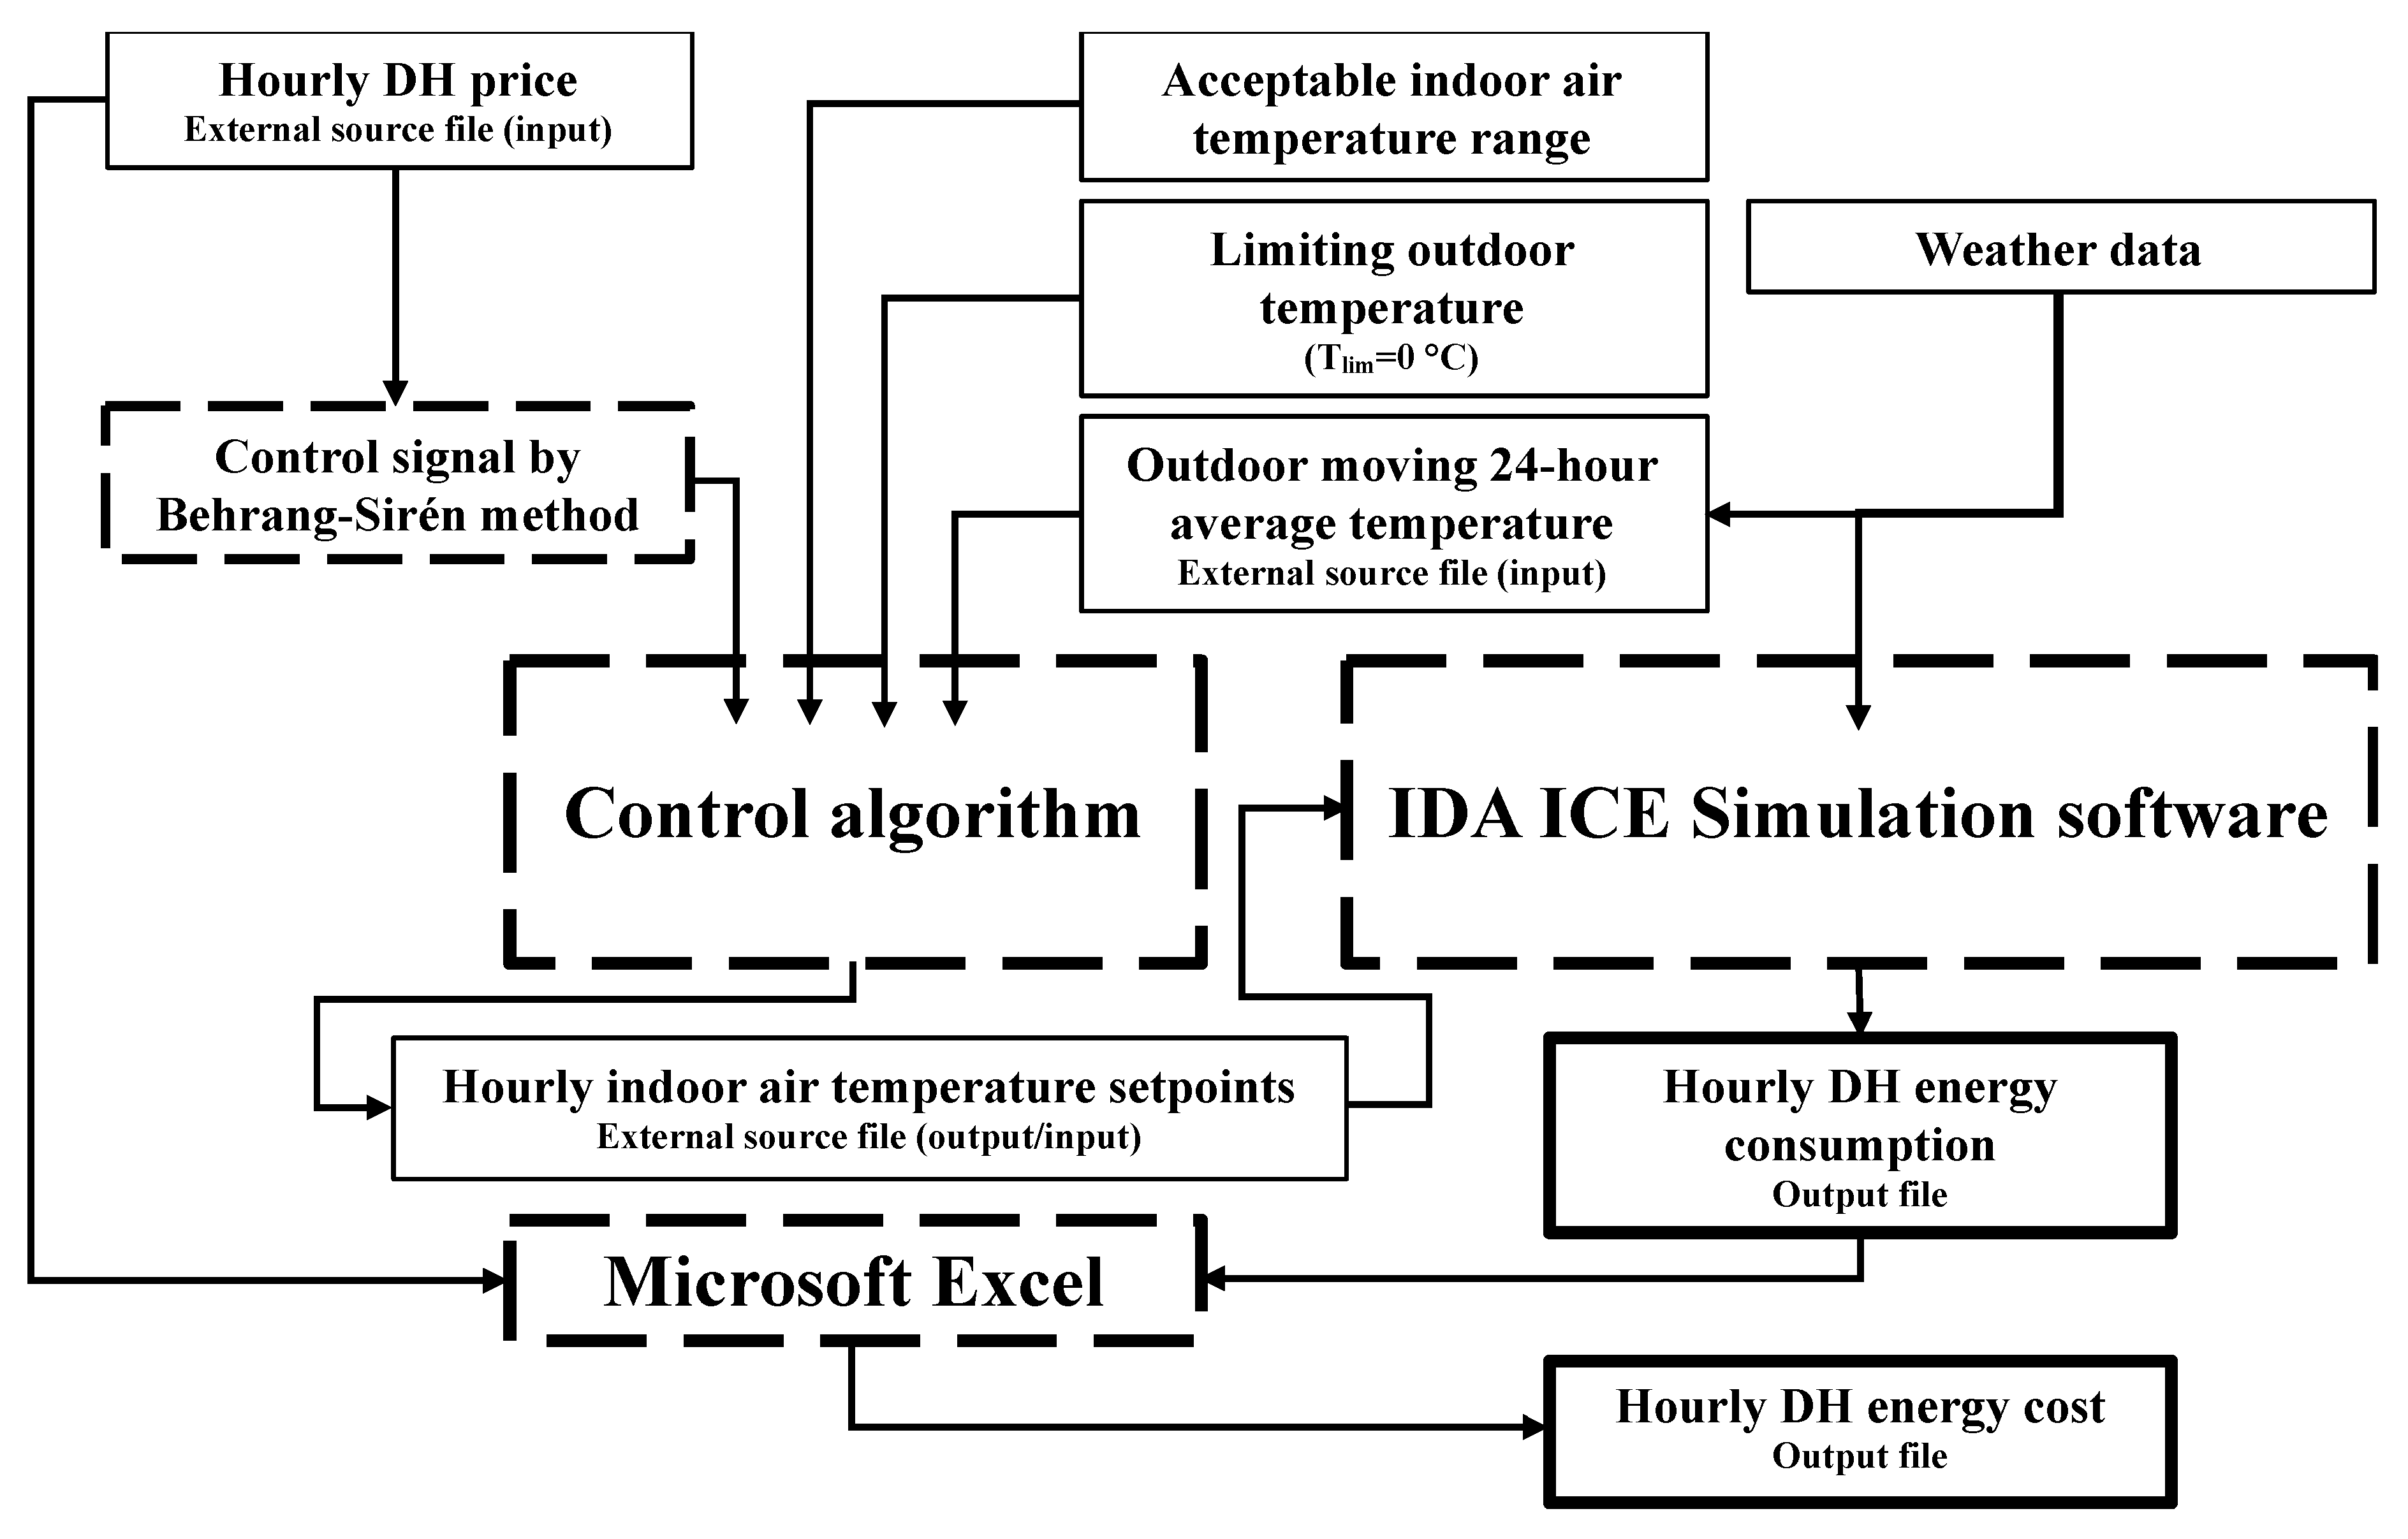
Figure 1. Flow chart of the whole simulation process.
Energies 13 06296 g001
Figure 2. Desired value of indoor air temperature based on the indoor classification class S2 [31].
Energies 13 06296 g002
Figure 3. Synthetic Finnish district heating price in function of time.
Energies 13 06296 g003
Figure 4. Synthetic German district heating price in function of time.
Energies 13 06296 g004
Figure 5. Control curves of radiator network inlet water temperature in function of outdoor temperature in apartment buildings.
Energies 13 06296 g005
Figure 6. Control curves of radiator network inlet water temperature in function of outdoor temperature in cultural centers.
Energies 13 06296 g006
Figure 7. Control curves of radiator network inlet water temperature in function of outdoor temperature in office buildings.
Energies 13 06296 g007
Figure 8. Example of the Finnish district heating price profile and control signal.
Energies 13 06296 g008
Figure 9. Control algorithms used in this study. (a) represents the DR control algorithm without night-time set-back and (b) represents the DR+NT control algorithm with night-time set-back.
Energies 13 06296 g009
Figure 10. Effect of the upwards setpoint smoothing.
Energies 13 06296 g010
Figure 11. Space heating power and setpoints of the reference case with constant temperature of 21 °C and demand response case with marginal value of 15 €/MWh and setpoint smoothing.
Energies 13 06296 g011
Figure 12. Duration of operative indoor temperature during the occupied hours (8760 h) in the Finnish apartment building simulations.
Energies 13 06296 g012
Figure 13. Duration of operative indoor temperature during the occupied hours (2549 h) in the Finnish cultural center simulations.
Energies 13 06296 g013
Figure 14. Duration of operative temperature during the occupied hours (2007 h) in the Finnish office building simulations.
Energies 13 06296 g014
Table 1. District heat price data used in this study (€/MWh).
Simulation CasesHourly DH Price DataAverageMaximumMinimumStandard
Deviation
FinnishSynthetic Finnish price data50.62145.409.1415.37
GermanActual German price data64.0890.5819.738.65
Table 2. General building information of the building types studied.
General Building InformationApartment BuildingCultural
Center
Office
Building
Heated net floor area, (m2)488539372383
Building volume (ext. dimension), (m3)12,00016,3148556
Envelope area, (m2)478069213855
Window to envelope ratio, (%)7.68.89.5
Table 3. Building properties of apartment building.
Property FinlandGermany
Construction year 1990’sEarly 1930’s
U-values, (W/m2K)
External wall0.281.70
Roof0.221.40
Ground slab0.361.0
Windows1.03.0
Air leakage rate n50, (L/h) 1.07.0
Heating system Water radiators
Supply/return temperatures of heating system, (°C)70/4080/60
Space heating design power at design temperature, (kW)169225
Specific design power in design temperature, (W/m2)3546
Ventilation system
Mechanical exhaust, (L/s,m2)0.39-
Natural ventilation average air exchange rate, (1/h)-0.24
(apartments avg. 0.18 L/s,m2)
Cooling NoNo
Table 4. Building properties of the cultural center.
Property FinlandGermany
Construction year 1990’sEarly 1980’s
U-values, (W/m2K)
External wall0.280.20
Roof0.220.19
Ground slab0.360.28
Windows1.03.0
Air leakage rate n50, (L/h) 2.03.0
Heating system
System type Water radiators, Floor heating (basement, entrance hall)
Supply/return temperatures of heating system, (°C)70/4070/40
Space heating design power in design temperature, (kW)229175
Specific design power in design temperature, (W/m2)5844
Ventilation system
System type
Mechanical supply and exhaust ventilation (CAV)
(8 a.m.–10 p.m.)
Air change rate, (L/s,m2)0.35–4.5-
ZoneBasement, toilets and technical spaces-
Mechanical supply and exhaust ventilation
(VAV with CO2 control) with heat recovery (η = 65%)
(8 a.m.–10 p.m.)
Air change rate, (L/s,m2)0.35–5.4-
ZoneOther spaces-
Mechanical supply and exhaust ventilation (CAV) without heat recovery
(8 a.m.–10 p.m.)
(7 a.m.–10 p.m., basement)
Air change rate, (L/s,m2)-1.7–2.36
Zone-Kitchen, restaurant, basement and hall
Mechanical exhaust ventilation (CAV)
(always on)
Air change rate, (L/s,m2)-2.5–4.5
Zone-Toilets
Natural ventilation
(always on)
Air change rate, (L/s,m2)-0.2–0.43
Zone-Other spaces
Cooling YesNo
Table 5. Building properties of the office building.
Property FinlandGermany
Construction year 1990’sEarly 1980’s
U-values, (W/m2K)
External wall0.280.20
Roof0.220.19
Ground slab0.360.28
Windows1.03.0
Air leakage rate n50, (1/h) 1.64.5
Heating system
System type Water radiators
Supply/return temperatures of heating system, (°C)70/4070/40
Space heating design power in design temperature, (kW)129101
Specific design power in design temperature, (W/m2)5442
Ventilation system
System type
Mechanical supply and exhaust ventilation (VAV with CO2 control) heat recovery (η = 65%)
(Workdays 6 a.m.–6 p.m.)
Air change rate, (L/s,m2)0.35–3.0-
ZoneMeeting rooms-
Mechanical supply and exhaust ventilation (CAV)
(Workdays 6 a.m.–6 p.m.)
Air change rate, (L/s,m2)0.35–1.5-
ZoneOffice rooms and hallways-
Mechanical supply and exhaust ventilation (CAV) without heat recovery
(Workdays 6 a.m.–6 p.m.)
Air change rate, (L/s,m2)-2.1
Zone-Whole building
Cooling YesNo
Table 6. Finnish simulation cases of the study.
Country and Building TypeCaseControl AlgorithmControl Signal’s Marginal Value (€/MWh)Indoor Air Temperature (°C)Setpoint SmoothingNight-Time Setback
Finland,
Apartment
F-AB-R-21 Reference case 1--21-No
F-AB-R-20 Reference case 2--20-No
F-AB-15DR+/−1520–23-No
F-AB-15-SSDR+/−1520–23YesNo
F-AB-75DR+/−7520–23-No
F-AB-75-SSDR+/−7520–23YesNo
Finland,
Cultural Center
F-CC-R-21 Reference case 1--21-No
F-CC-R-20 Reference case 2--20-No
F-CC-15DR+/−1520–23-No
F-CC-15-SSDR+/−1520–23YesNo
F-CC-75DR+/−7520–23-No
F-CC-75-SSDR+/−7520–23YesNo
F-CC-15-SS-NTDR+NT+/−1520–23YesYes
F-CC-75-SS-NTDR+NT+/−7520–23YesYes
Finland,
Office
F-OB-R-21 Reference case 1--21-No
F-OB-R-20 Reference case 2--20-No
F-OB-15DR+/−1520–23-No
F-OB-15-SSDR+/−1520–23YesNo
F-OB-75DR+/−7520–23-No
F-OB-75-SSDR+/−7520–23YesNo
F-OB-15-SS-NTDR+NT+/−1520–23YesYes
F-OB-75-SS-NTDR+NT+/−7520–23YesYes
Table 7. German simulation cases of the study.
Country and Building TypeCaseControl AlgorithmControl Signal’s Marginal Value (€/MWh)Indoor air Temperature (°C)Setpoint SmoothingNight-Time Setback
Germany, ApartmentG-AB-R-21 Reference case 1--21-No
G-AB-R-20 Reference case 2--20-No
G-AB-75-SSDR+/−7520–23YesNo
Germany, Cultural CenterG-CC-R-21 Reference case 1--21-No
G-CC-R-20 Reference case 2--20-No
G-CC-75-SS-NTDR + NT+/−7520–23YesYes
Germany, OfficeG-OB-R-21 Reference case 1--21-No
G-OB-R-20 Reference case 2--20-No
G-OB-75-SS-NTDR + NT+/−7520–23YesYes
Table 8. Results of the Finnish apartment building simulation cases.
CaseSpace HeatingTotal DH EnergySaving Potential
Specific Demand
(kWh/m2, a)
Specific Costs
(€/m2,a)
Specific Demand
(kWh/m2,
a)
Specific Costs
(€/m2,a)
DH Energy
(Δ%)
Cost
(Δ%)
F-AB-R-21 Reference case 154.43.690.55.40.0%0.0%
F-AB-R-20 Reference case 250.13.386.15.24.8%4.4%
F-AB-1554.03.590.05.40.5%0.7%
F-AB-15-SS53.93.590.05.40.5%0.7%
F-AB-7552.93.489.05.21.7%3.1%
F-AB-75-SS52.93.488.95.21.7%3.2%
Table 9. Results of the German apartment building simulation cases.
CaseSpace HeatingTotal DH EnergySaving Potential
Specific Demand
(kWh/m2, a)
Specific Costs
(€/m2,a)
Specific Demand
(kWh/m2, a)
Specific Costs
(€/m2,a)
DH Energy
(Δ%)
Cost
(Δ%)
G-AB-R-21 Reference case 175.75.496.86.70.0%0.0%
G-AB-R-20 Reference case 268.34.989.36.27.7%7.6%
G-AB-75-SS73.05.294.16.52.8%3.2%
Table 10. Results of the Finnish cultural center simulation cases.
CaseSpace HeatingTotal DH EnergySaving Potential
Specific Demand (kWh/m2, a)Specific Costs (€/m2,a)Specific Demand (kWh/m2, a)Specific Costs (€/m2,a)DH Energy
(Δ%)
Cost
(Δ%)
F-CC-R-21 Reference case 169.04.595.86.30.0%0.0%
F-CC-R-20 Reference case 260.54.188.75.97.5%6.1%
F-CC-1568.54.595.46.30.5%0.7%
F-CC-15-SS68.34.595.26.30.6%0.9%
F-CC-7566.64.393.96.12.0%3.1%
F-CC-75-SS66.54.393.86.12.1%3.2%
F-CC-15-SS-NT65.34.392.56.13.4%3.0%
F-CC-75-SS-NT64.04.291.56.04.5%4.6%
Table 11. Results of the German cultural center simulation cases.
CaseSpace HeatingTotal DH EnergySaving Potential
Specific Demand (kWh/m2, a)Specific Costs (€/m2,a)Specific Demand (kWh/m2, a)Specific Costs (€/m2,a)DH Energy
(Δ%)
Cost
(Δ%)
G-CC-R-21 Reference case 178.95.6122.08.60.0%0.0%
G-CC-R-20 Reference case 268.14.9111.27.88.8%8.6%
G-CC-75-SS-NT69.54.9112.77.97.7%8.1%
Table 12. Results of the Finnish office simulation cases.
CaseSpace HeatingTotal DH EnergySaving Potential
Specific Demand (kWh/m2, a)Specific Costs (€/m2,a)Specific Demand (kWh/m2, a)Specific Costs (€/m2,a)DH Energy
(Δ%)
Cost
(Δ%)
F-OB-R-21 Reference case 159.13.874.44.70.0%0.0%
F-OB-R-20 Reference case 254.03.569.94.56.1%5.5%
F-OB-1558.63.773.94.70.7%1.5%
F-OB-15-SS58.43.773.74.71.0%1.8%
F-OB-7556.73.572.24.43.0%6.7%
F-OB-75-SS56.63.572.14.43.1%6.8%
F-OB-15-SS-NT54.93.670.64.55.2%4.1%
F-OB-75-SS-NT53.53.469.34.46.8%7.8%
Table 13. Results of the German office simulation cases.
CaseSpace HeatingTotal DH EnergySaving Potential
Specific Demand (kWh/m2, a)Specific Costs (€/m2,a)Specific Demand (kWh/m2, a)Specific Costs (€/m2,a)DH Energy
(Δ%)
Cost
(Δ%)
G-OB-R-21 Reference case 158.84.2118.38.20.0%0.0%
G-OB-R-20 Reference case 250.33.6109.87.67.2%7.2%
G-OB-75-SS-NT50.93.6110.37.66.8%7.8%
Table 14. Degree hours and total hours operative indoor temperature is below the minimum acceptable indoor air temperature in Finnish apartment building.
CaseDegree Hours, (°Ch)Total Number of Hours, (h)
F-AB-R-21 Reference case 100
F-AB-R-20 Reference case 213237
F-AB-1500
F-AB-15-SS00
F-AB-7500
F-AB-75-SS03
Table 15. Degree hours and total hours operative indoor temperature is below the minimum acceptable indoor air temperature in the German apartment building.
CaseDegree Hours, (°Ch)Total Number of Hours, (h)
G-AB-R-21 Reference case 100
G-AB-R-20 Reference case 267801
G-AB-75-SS476
Table 16. Degree hours and total hours operative indoor temperature is below the minimum acceptable indoor air temperature in Finnish cultural center.
CaseDegree Hours, (°Ch)Total Number of Hours, (h)
F-CC-R-21 Reference case 100
F-CC-R-20 Reference case 2991
F-CC-1502
F-CC-15-SS03
F-CC-75120
F-CC-75-SS222
F-CC-15-SS-NT760
F-CC-75-SS-NT1394
Table 17. Degree hours and total hours operative indoor temperature is below the minimum acceptable indoor air temperature in the German cultural center.
CaseDegree Hours, (°Ch)Total Number of Hours, (h)
G-CC-R-21 Reference case 100
G-CC-R-20 Reference case 212106
G-CC-75-SS-NT970
Table 18. Degree hours and total hours operative indoor temperature is below the minimum acceptable indoor air temperature in the Finnish office building.
CaseDegree Hours, (°Ch)Total Number of Hours, (h)
F-OB-R-2100
F-OB-R-2013129
F-OB-1500
F-OB-15-SS00
F-OB-75114
F-OB-75-SS116
F-OB-15-SS-NT61193
F-OB-75-SS-NT114320
Table 19. Degree hours and total hours operative indoor temperature is below the minimum acceptable indoor air temperature in German office building.
CaseDegree Hours, (°Ch)Total Number of Hours, (h)
G-OB-R-21 Reference case 100
G-OB-R-20 Reference case 216146
G-OB-75-SS-NT71214
Publisher’s Note: MDPI stays neutral with regard to jurisdictional claims in published maps and institutional affiliations.