Selection of the Multiple-Criiater Decision-Making Method for Evaluation of Sustainable Energy Development: A Case Study of Poland


Abstract
:1. Introduction
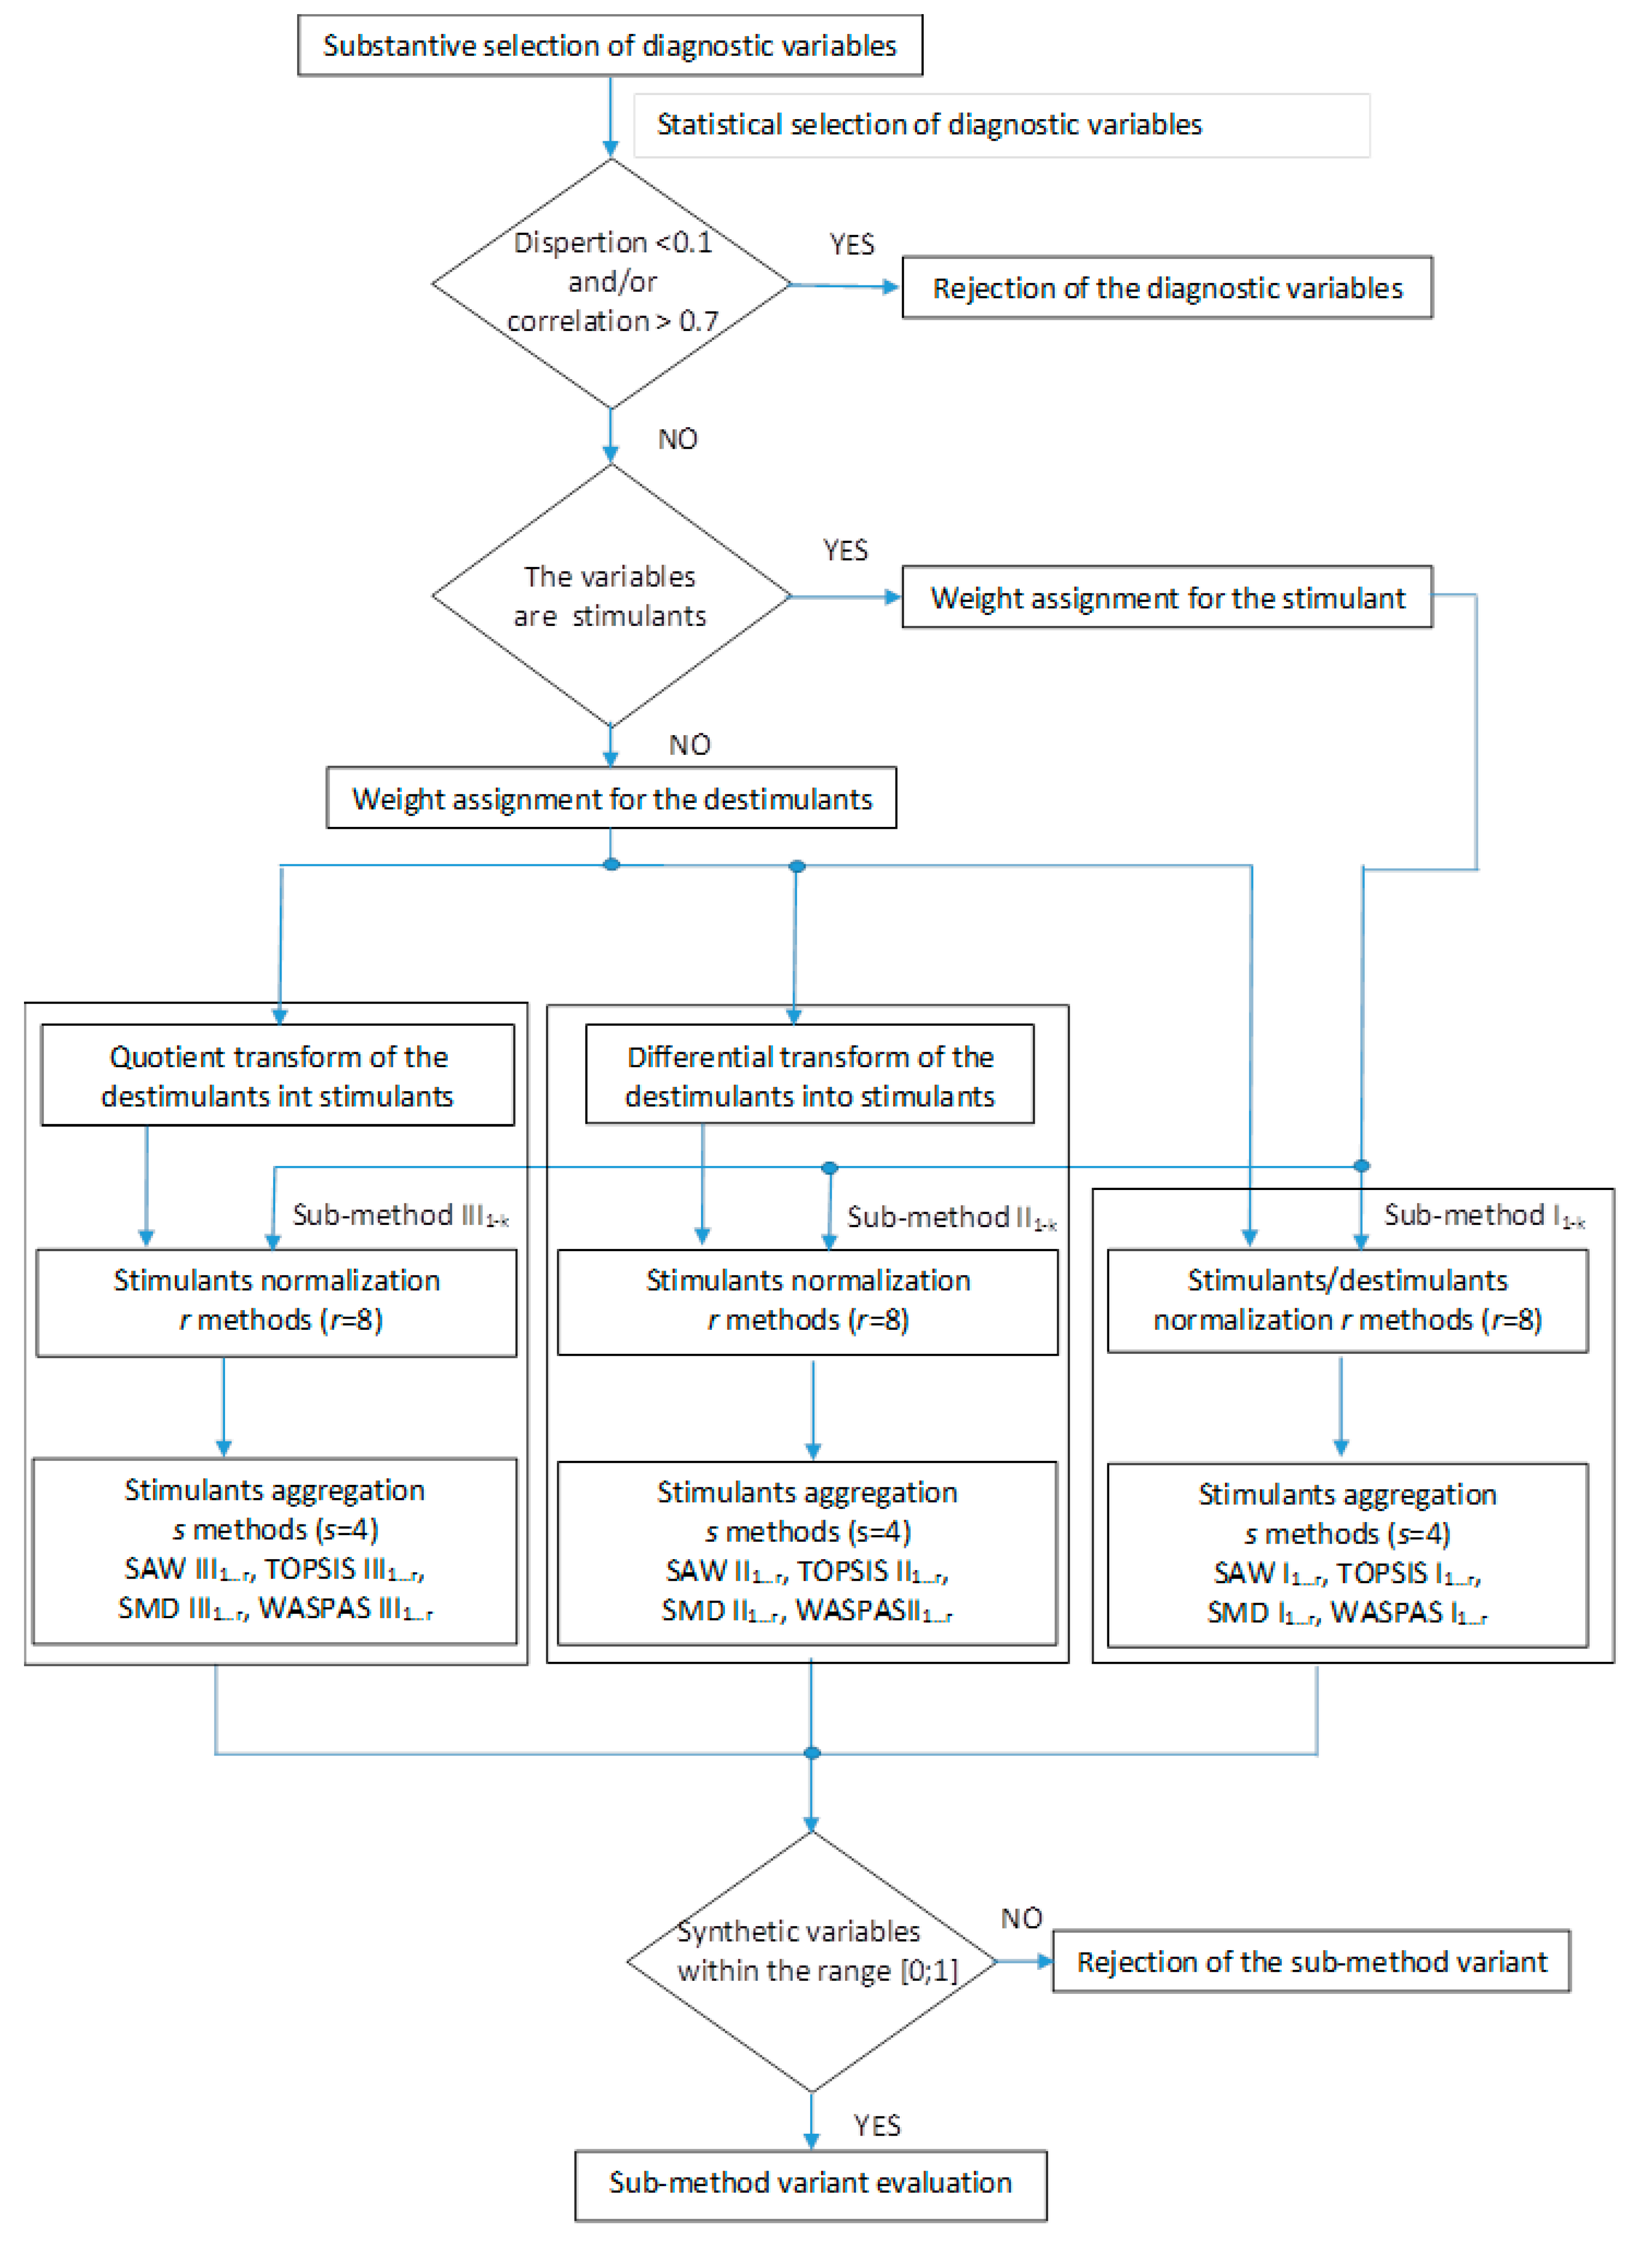
2. Research Method
- Identyfication of criteria:
- –
- substantive selection,
- –
- formal and statistical selection,
- –
- determining property.
- Preprocessing of data:
- –
- determination the weights of criteria,
- –
- conditional conversion of destimulants into stimulants,
- –
- normalization of criteria.
- Aggregation of criteria.
- Evaluation of normalization and aggregation methods based on:
- –
- similarities of synthetic variables to diagnostic variables,
- –
- ranking quality by ANOVA,
- –
- clustering quality using empirical distributors.
- Analysis of the sensitivity of decision solutions.
2.1. Identification of Criteria
- dispersion, rejecting the variables for which the standard coefficient of variation was below 0.1,
- correlation, taking into account only features that are weakly correlated with one another (Pearson’s correlation coefficient of less than 0.7).
2.2. Preprocessing of Data
- during normalization (using minimizing normalization),
- before normalization, by stimulating the destimulants by means of a differential transform:
- before normalization, by stimulating the destimulants by means of a quotient transform:
2.3. Aggregation of Criteria
- Simple Additive Weighting (SAW),
- Technique for Order of Preference by Similarity to Ideal Solution (TOPSIS),
- The synthetic measure of development (SMD),
- Weighted Aggregated Sum Product Assessment (WASPAS).
- –
- determination of pattern coordinates: =
- –
- determining the coordinates of the anti-pattern: =
- –
- determining the distance of objects from the pattern:
- –
- determining the distance of objects from the anti-pattern:
- –
- determining the value of an aggregate variable:
- –
- determination of pattern coordinates:
- –
- determining the distance of objects from the pattern:
- –
- determining the value of a synthetic variable:where:
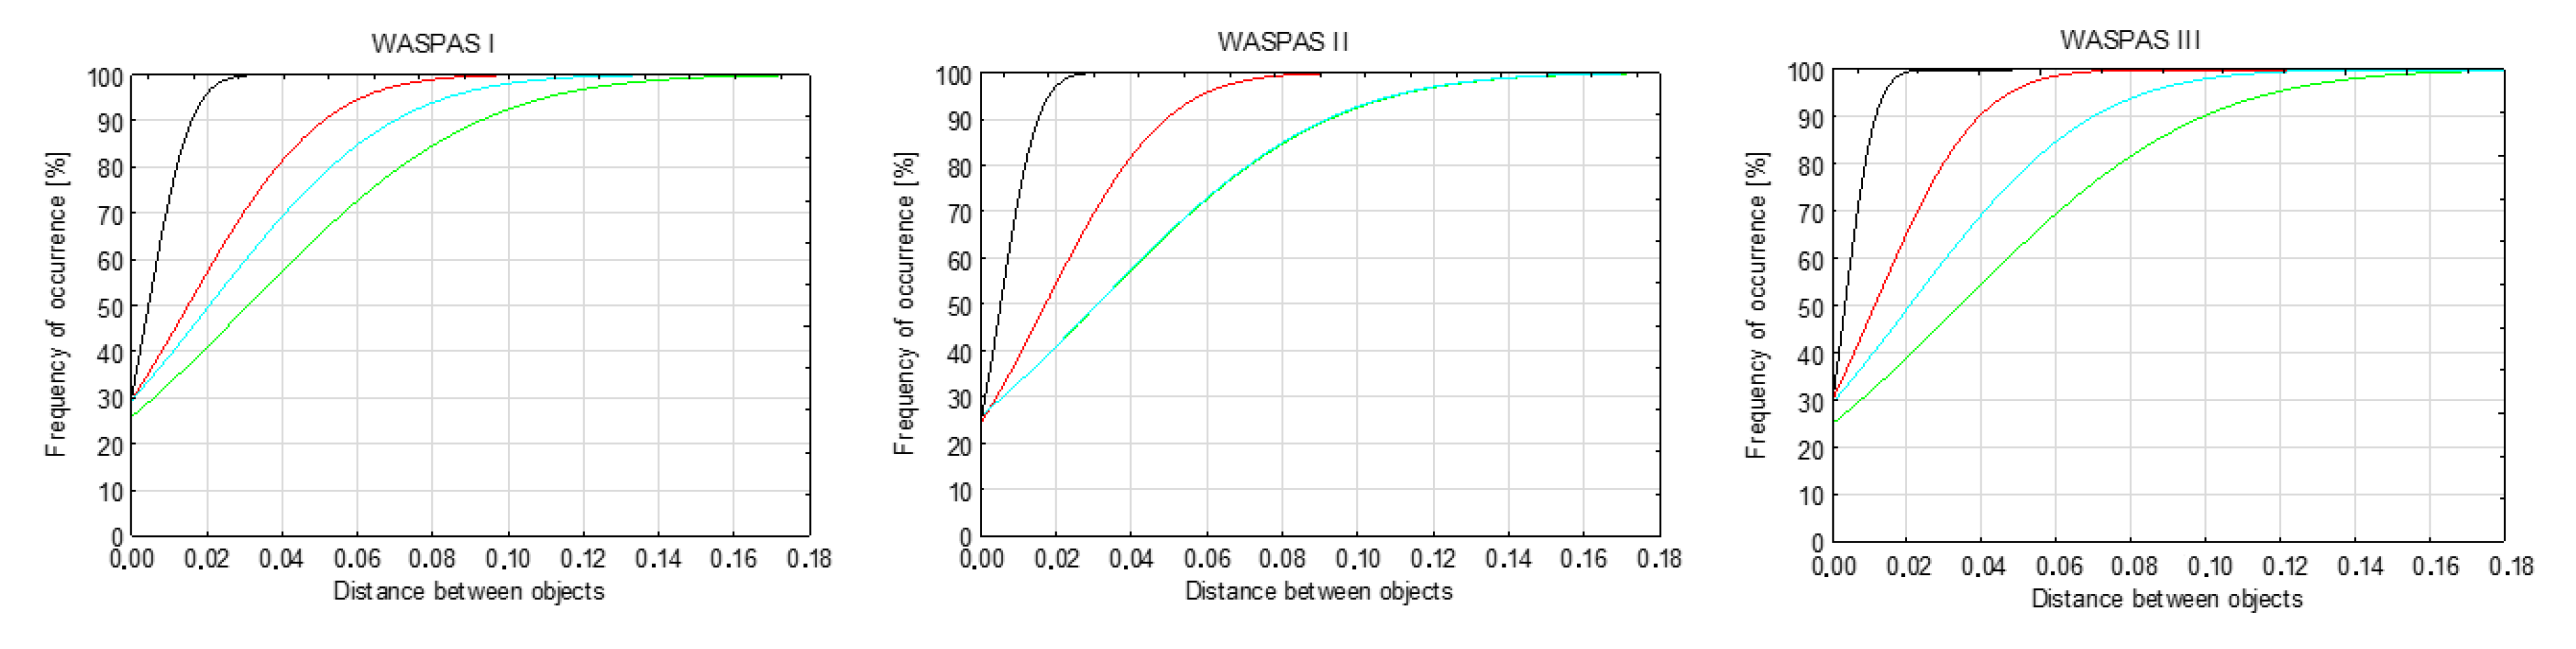
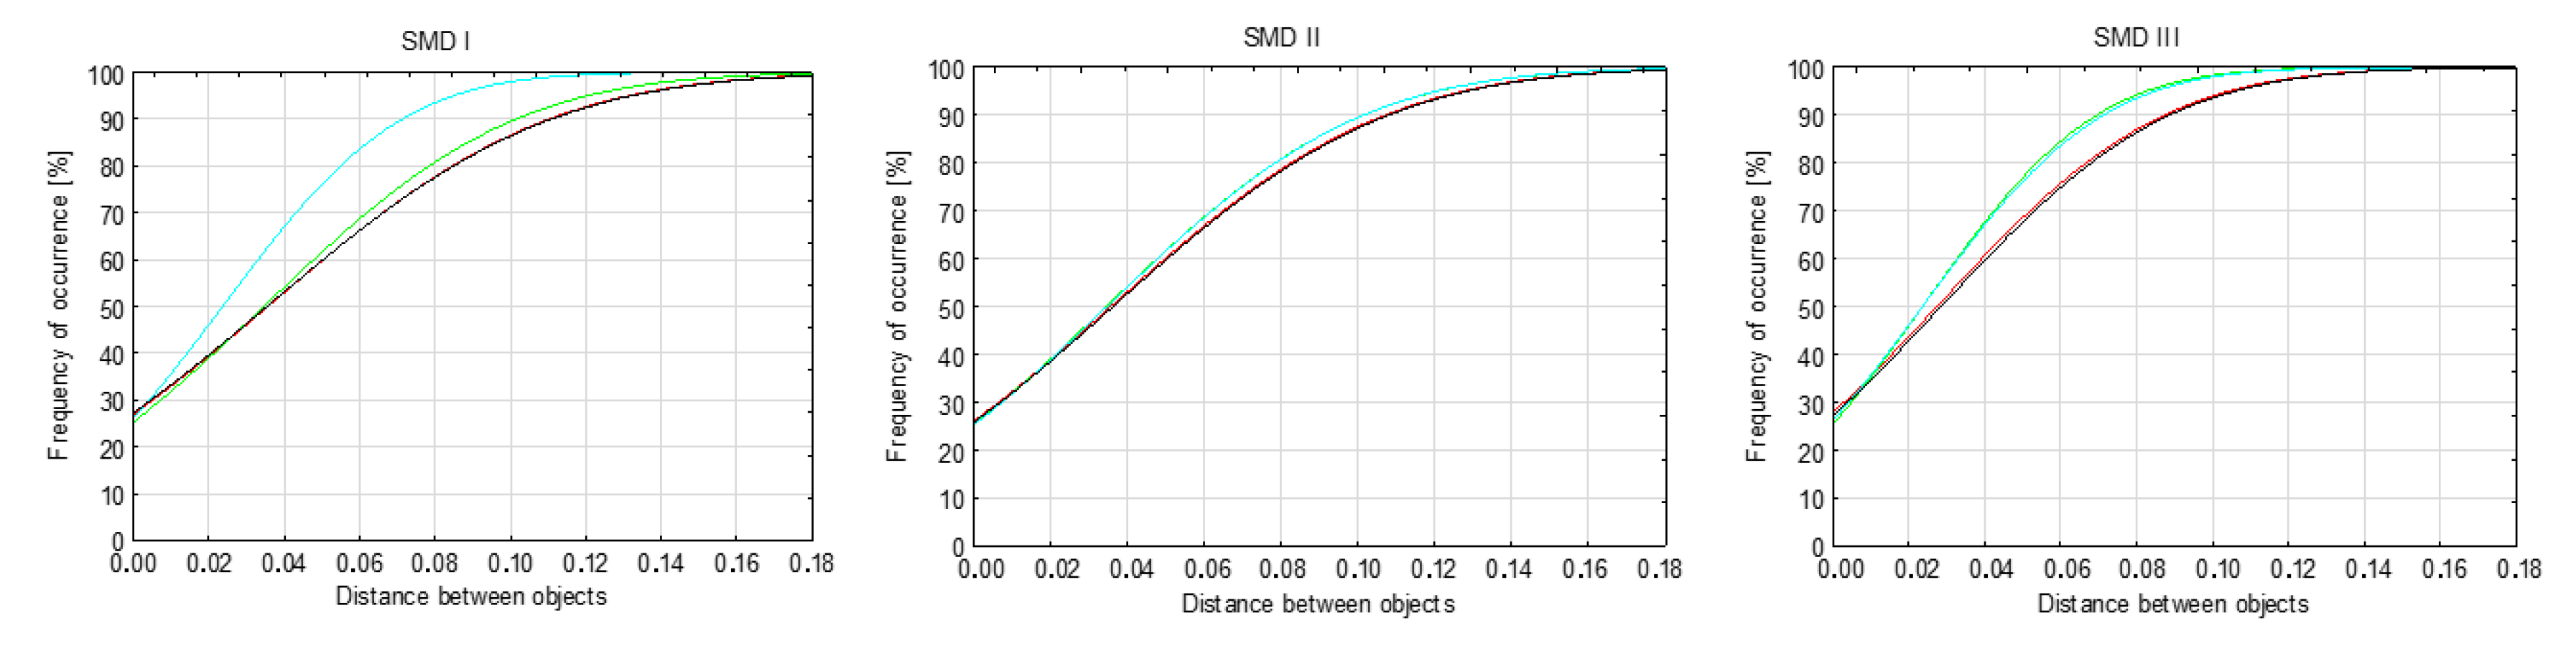
2.4. Evaluation of Normalization and Aggregation METHODS
- —correlation coefficient between the j-th diagnostic variable and the synthetic variable,
- n—number of variables.
- —rank correlation coefficient between j-th diagnostic variable and the synthetic variable,
- —the rank of the i-th object with respect to the j-th diagnostic variable,
- —the rank of the i-th object with respect to the i-th synthetic variable.
- —mean and standard deviation of the synthetic variable,
- , —mean and standard deviation of ,
- where are implementations of the synthetic variable in non-decreasing order, k = 1, 2, …, m.
- M—aggregate measure of the quality of mapping diagnostic variables with synthetic variables of the linear ordering sub-method,
- Ml—partial measure of the quality of mapping diagnostic variables with the synthetic variable of the linear ordering sub-method (l = 1, 2, …, g),
- g—number of partial measures.
- —position of the i-th object in the ranking with the number p,
- —position of the i-th object in the ranking with the number q,
2.5. Sensitivity Analysis
3. Research Results
3.1. Selection of Diagnostic Variables
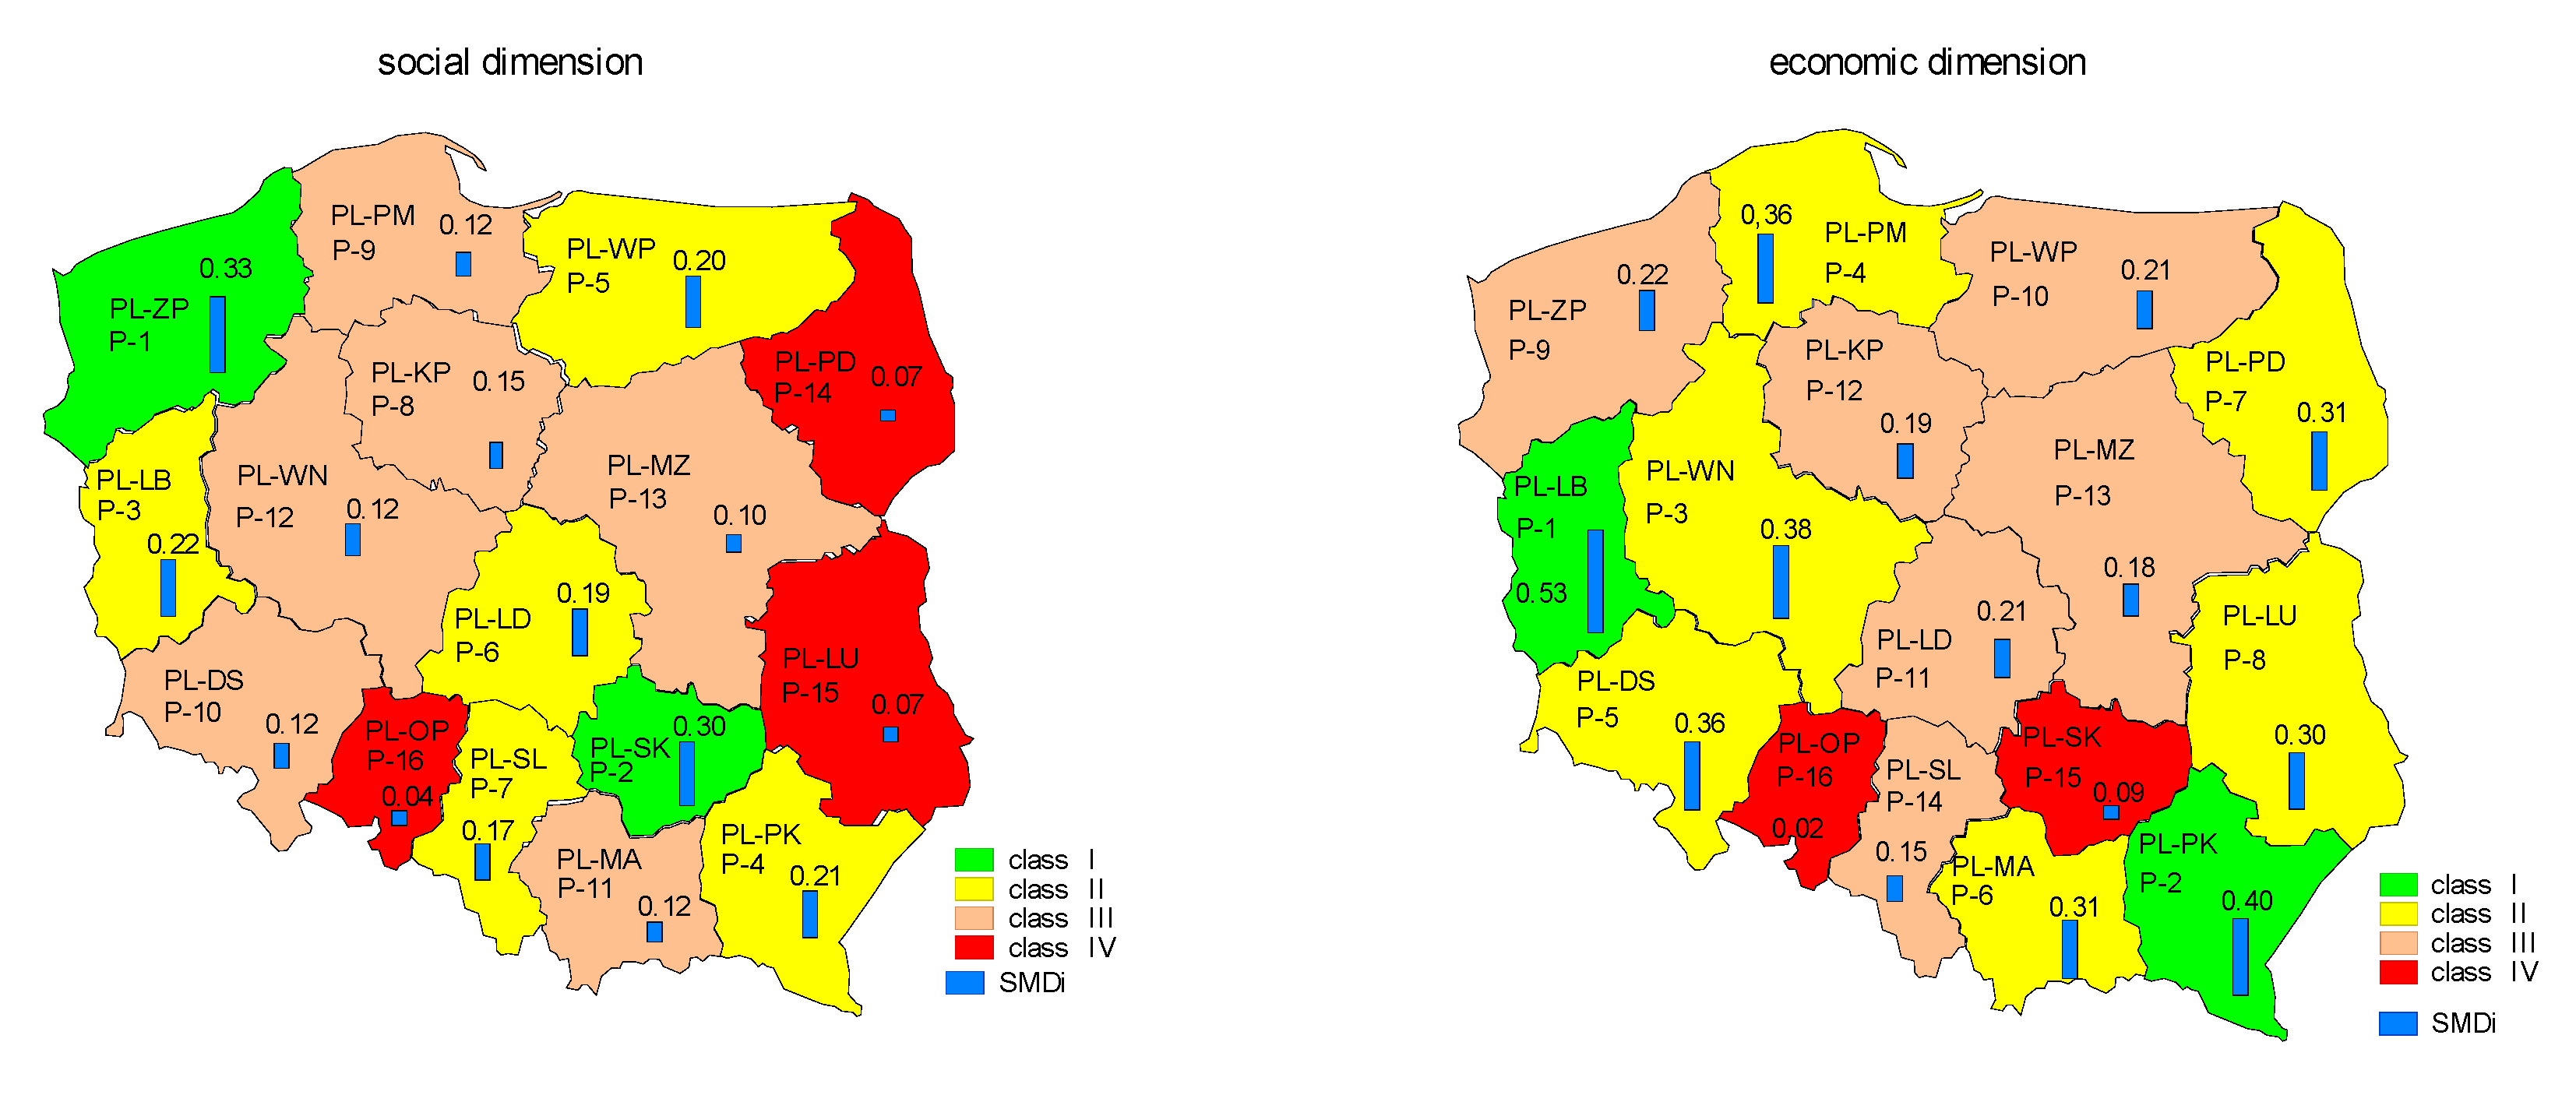
3.1.1. Social Dimension
3.1.2. Economic Dimension
3.1.3. Environmental Dimension
3.2. Selection of Linear Ordering Method
3.3. Sensitivity Analysis
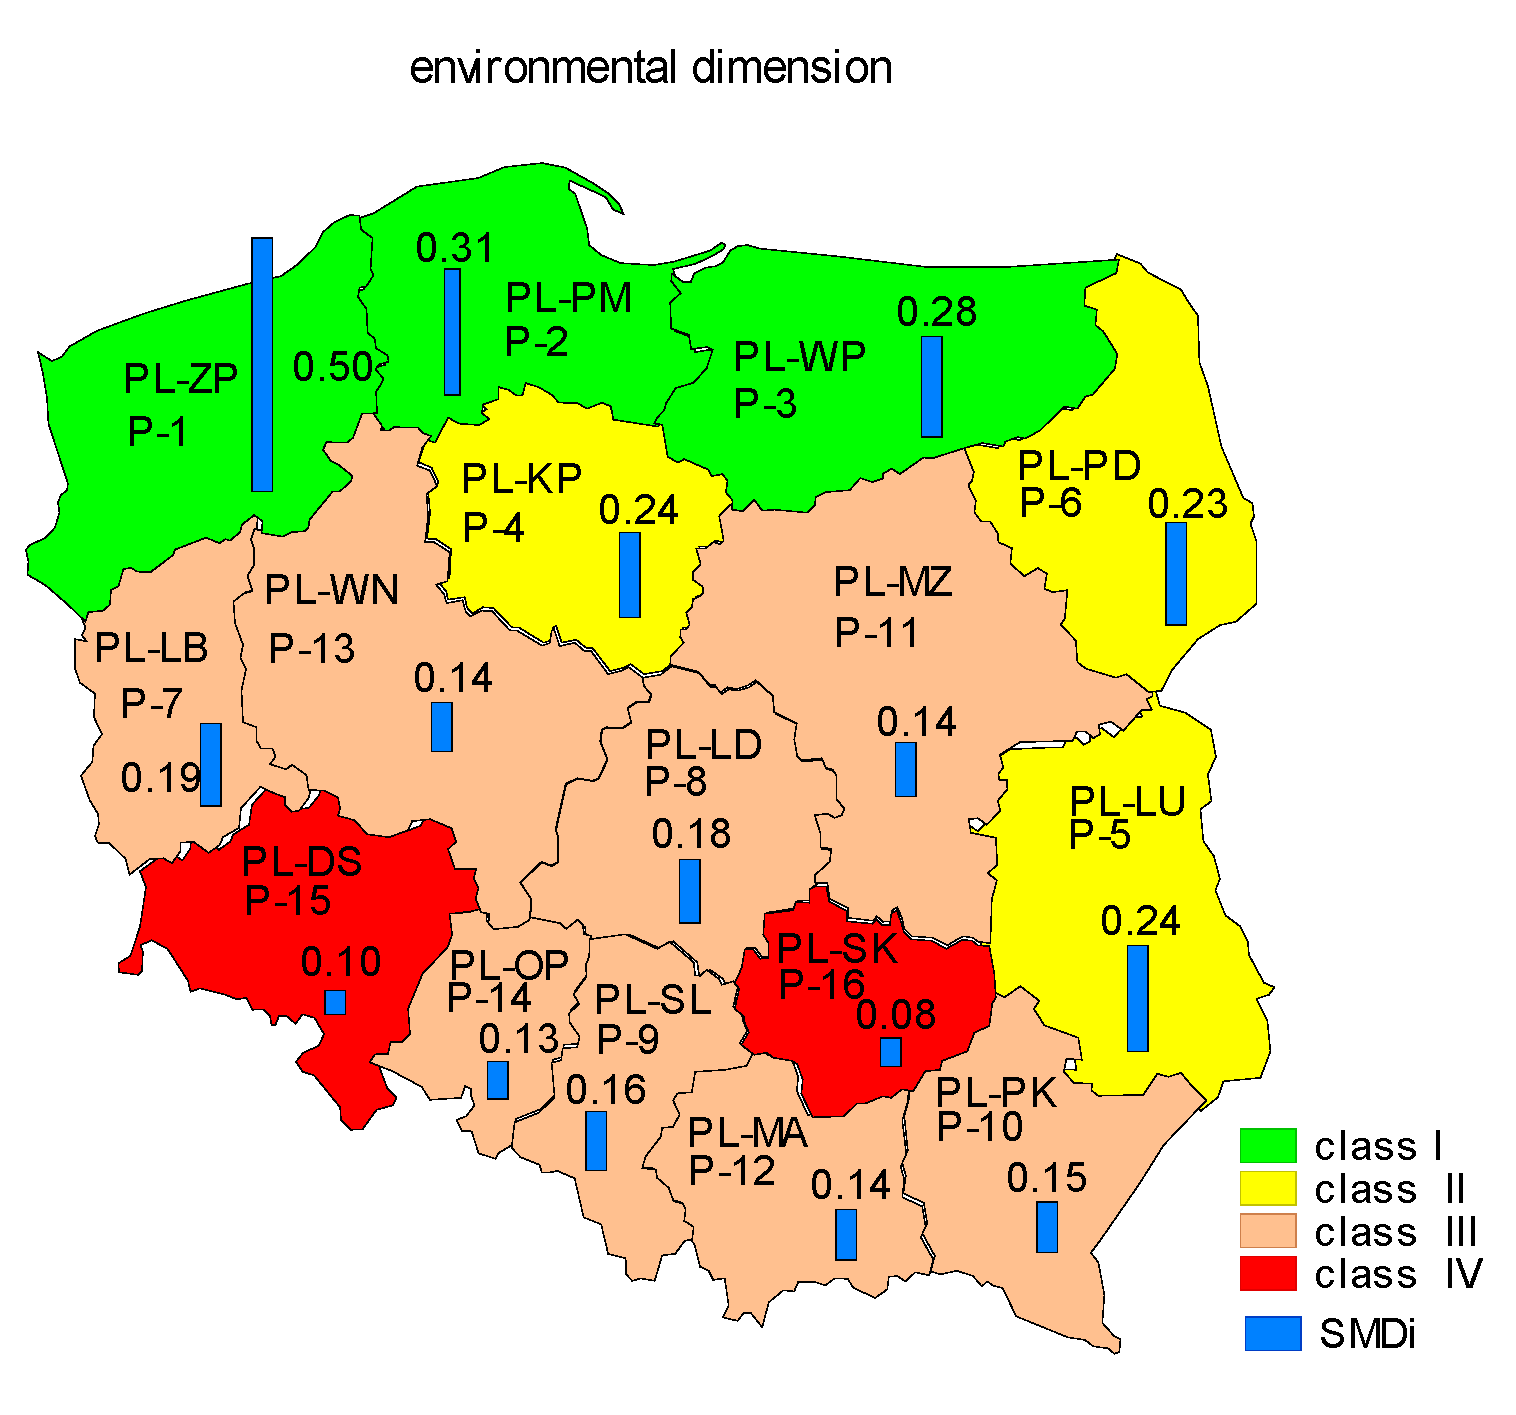
3.4. Analysis of Sustainable Energy Development of Polish Regions
4. Conclusions
Author Contributions
Funding
Conflicts of Interest
References
- 2030 Climate & Energy Framework. Available online: https://ec.europa.eu/clima/policies/strategies/2030_en (accessed on 20 October 2020).
- International Atomic Energy Association. Energy Indicators for Sustainable Development; Guidel Methodol: Vienna, Austria, 2005. [Google Scholar]
- Sustainable Development Goals-Overview. Available online: https://ec.europa.eu/eurostat/web/sdi/overview (accessed on 20 May 2020).
- International Energy Agency; World Energy Balances: Paris, France, 2011.
- Renewables 2020 Global Status Report—REN21. Available online: https://www.google.com/url?sa=t&rct=j&q=&esrc=s&source=web&cd=&ved=2ahUKEwiipM7ykcrsAhWClYsKHRTzCGAQFjAFegQIBBAC&url=https%3A%2F%2Fwww.ren21.net%2Fwp-content%2Fuploads%2F2019%2F05%2Fgsr_2020_full_report_en.pdf&usg=AOvVaw3KeCM-CpcTK3QnR0z9WClm (accessed on 20 October 2020).
- Global Energy Transformation a Roadmap to 2050. Available online: https://www.google.com/url?sa=t&rct=j&q=&esrc=s&source=web&cd=&ved=2ahUKEwioxeTLksrsAhUmxosKHXrhBFgQFjADegQIAxAC&url=https%3A%2F%2Fwww.teraz-srodowisko.pl%2Fmedia%2Fpdf%2Faktualnosci%2F6741-IRENA-global-energy-transformation-2019.pdf&usg=AOvVaw0XIiC1ZcGEq8dpEjourLEw (accessed on 20 October 2020).
- Razmjoo, A.A.; Sumper, A.; Davarpanah, A. Development of sustainable Energy indexes by the utilization of new indicators: A comparative study. Energy Rep. 2019, 5, 375–383. [Google Scholar] [CrossRef]
- Graczyk, A. Wskaźniki zrównoważonego rozwoju energetyki. Optimum. Studia Ekon. 2017, 4, 53–68. [Google Scholar] [CrossRef] [Green Version]
- Commission Regulation (EU) No 431/2014 of 24 April 2014 Amending Regulation (EC) No 1099/2008 of the European Parliament and of the Council on Energy Statistics as Regards the Implementation of Annual Statistics on Energy Consumption in Households, OJ L 131/1. Available online: https://eur-lex.europa.eu/legal-content/en/ALL/?uri=CELEX%3A32014R0431 (accessed on 30 May 2020).
- Iddrisu, I.; Bhattacharyya, S.C. Sustainable Energy Development Index: A multi-dimensional indicator for measuring sustainable energy development. Renew. Sustain. Energy Rev. 2015, 50, 513–530. [Google Scholar] [CrossRef] [Green Version]
- Patlitzianas, K.D.; Doukas, H.; Kagiannas, A.G.; Psarras, J. Sustainable energy policy indicators: Review and recommendations. Renew. Energy 2008, 33, 966–973. [Google Scholar] [CrossRef]
- Gunnarsdottir, I.; Davidsdottir, B.; Worrelll, E.; Sigurgeirsdottir, S. Review of indicators for sustainable energy development. Renew. Sustain. Energy Rev. 2020, 133, 110294. [Google Scholar] [CrossRef]
- Cosmi, C.; Dvarionienė, J.; Marques, I.; Di Leo, S.; Gecevičius, G.; Gurauskienė, I.; Mendes, G.; Selada, C. A Holistic approach to sustainable energy development at regional level: The RENERGY self-assessment methodology. Renew. Sustain. Energy Rev. 2015, 49, 693–707. [Google Scholar] [CrossRef]
- Fouché, E.; Brent, A. Explore, design and act for sustainability: A participatory planning approach for local energy sustainability. Sustainability 2020, 12, 862. [Google Scholar] [CrossRef] [Green Version]
- Ghenai, C.; Albawab, M.; Bettayeb, M. Sustainability indicators for renewable energy systems using multi-criteria decision-making model and extended SWARA/ARAS hybrid method. Renew. Energy 2020, 146, 580–597. [Google Scholar] [CrossRef]
- Trojanowska, M.; Nęcka, K. Multi-dimensional comparative analysis of renewable energy sources development. In Renewable Energy Sources: Engineering, Technology, Innovation ICORES; Springer: Berlin/Heidelberg, Germany, 2018; pp. 1025–1034. [Google Scholar]
- Narula, K.; Reddy, S. A SES (sustainable energy security) index for developing countries. Energy 2016, 94, 326–343. [Google Scholar] [CrossRef]
- Mirjat, N.H.; Uqaili, M.A.; Harijan, K.; Mustafa, M.W.; Rahman, M.; Khan, W.A. Multi-criteria analysis of electricity generation scenarios for sustainable energy planningin Pakistan. Energies 2018, 11, 757. [Google Scholar] [CrossRef] [Green Version]
- Siksnelyte, I.; Zavadskas, E.K.; Streimikiene, D.; Sharma, D. An overview of multi-criteria decision-making methods in dealing with sustainable energy development issues. Energies 2018, 11, 2754. [Google Scholar] [CrossRef] [Green Version]
- Jiang-Jiang, W.; You-Yin, J.; Chun-Fa, Z.; Jun-Hong, Z. Review on multi-criteria decision analysis aid in sustainable Energy decision-making. Renew. Sustain. Energy Rev. 2009, 13, 2263–2278. [Google Scholar]
- Siksnelyte-Butkiene, I.; Zavadskas, E.K.; Streimikiene, D. Multi-Criteria Decision-Making (MCDM) for the Assessment of Renewable Energy Technologies in a Household: A Review. Energies 2020, 13, 1164. [Google Scholar] [CrossRef] [Green Version]
- Jahan, A.; Edwards, K.L. A state-of-the-art survey on the influence of normalization techniques in ranking: Improving the materials selection process in engineering design. Mater. Des. 2015, 65, 335–342. [Google Scholar] [CrossRef]
- Chakraborty, S.; Yeh, C.H. A simulation based comparative study of normalization procedures in multiattribute decision making. In Proceedings of the 6th WSEAS International Conference on Artificial Intelligence, Knowledge Engineering and Data Bases, Corfu Island, Greece, 16–19 February 2007. [Google Scholar]
- Vafaei, N.; Ribeiro, R.A.; Camarinha-Matos, L.M. Selection of Normalization Technique for Weighted Average Multi-criteria Decision Making. In Technological Innovation for Resilient Systems. DoCEIS 2018. IFIP Advances in Information and Communication Technology; Camarinha-Matos, L., Adu-Kankam, K., Julashokri, M., Eds.; Springer: Cham, Switzerland, 2018; Volume 521, pp. 43–52. [Google Scholar] [CrossRef]
- Celen, A. Comparative Analysis of Normalization Procedures in TOPSIS Method: With an Application to Turkish Deposit Banking Market. Informatica 2014, 25, 185–208. [Google Scholar] [CrossRef] [Green Version]
- Vafaei, N.; Ribeiro, R.A.; Camarinha-Matos, L.M. Data normalisation techniques in decision making: Case study with TOPSIS method. Int. J. Inf. Decis. Sci. 2018, 10, 19–38. [Google Scholar] [CrossRef]
- Vafaei, N.; Ribeiro, R.A.; Camarinha-Matos, L.M. Selecting Normalization Techniques for the Analytical Hierarchy Process. In Technological Innovation for Life Improvement. DoCEIS 2020. IFIP Advances in Information and Communication Technology; Springer: Cham, Switzerland, 2020; Volume 577. [Google Scholar] [CrossRef]
- Chatterjee, P.; Chakraborty, S. Investigating the Effect of Normalization Norms in Flexible Manufacturing Sytem Selection Using Multi-Criteria Decision-Making Methods. J. Eng. Sci. Technol. Rev. 2014, 7, 141–150. [Google Scholar] [CrossRef]
- Zaidan, B.B.; Zaidan, A.A. Comparative study on the evaluation and benchmarking information hiding approaches based multi-measurement analysis using TOPSIS method with different normalisation, separation and context techniques. Measurement 2018, 117, 277–294. [Google Scholar] [CrossRef]
- Pavličić, D.M. Normalization affects the results of MADM methods. Yugosl. J. Oper. Res. 2011, 11, 251–265. [Google Scholar]
- Więckowski, J.; Sałabun, W. How the normalization of the decision matrix influences the results in the VIKOR method? Procedia Comput. Sci. 2020, 176, 2222–2231. [Google Scholar] [CrossRef]
- Jain, S.; Shukla, S.; Wadhvani, R. Dynamic selection of normalization techniques using data complexity measures. Expert Syst. Appl. 2018, 106, 252–262. [Google Scholar] [CrossRef]
- Opricovic, S.; Tzeng, G.-H. Compromise solution by MCDM methods: A comparative analysis of VIKOR and TOPSIS. Eur. J. Oper. Res. 2004, 156, 445–455. [Google Scholar] [CrossRef]
- Papathanasiou, J.; Ploskas, N.; Bournaris, T.; Manos, B. A Decision Support System for Multiple Criteria Alternative Ranking Using TOPSIS and VIKOR: A Case Study on Social Sustainability in Agriculture; Liu, S., Delibašić, B., Oderanti, F., Eds.; ICDSST, LNBIP, Springer: Cham, Switzerland, 2016; Volume 250, pp. 3–15. [Google Scholar] [CrossRef]
- Bąk, A. Comparative analysis of selected linear ordering methods based on empirical and simulation data. Res. Pap. Wrocław Univ. Econ. 2018, 508, 20–28. [Google Scholar] [CrossRef]
- Grabiński, T.; Wydymus, S.; Zeliaś, A. Metody Taksonomii Numerycznej w Modelowaniu Zjawisk Społeczno-Gospodarczych; PWN: Warszawa, Poland, 1989. [Google Scholar]
- Roszko-Wójtowicz, E.; Grzelak, M.M. The Use of Selected Methods of Linear Ordering to Assess the Innovation Performance of the European Union Member States, ISSN paper version 1642-2597 ISSN electronic version 2081-8319. Econ. Environ. Stud. 2019, 19, 9–30. [Google Scholar] [CrossRef]
- Ceballos, B.; Lamata, M.T.; Pelta, D.A. A comparative analysis of multi-criteria decision-making methods. Prog. Artif. Intell. 2016, 5, 315–322. [Google Scholar] [CrossRef]
- Wang, J.-J.; Zhang, C.-F.; Jing, Y.-Y.; Zheng, G.-Z. Using the fuzzy multi-criteria model to select the optimal cool storage system for air conditioning. Energy Build. 2008, 40, 2059–2066. [Google Scholar] [CrossRef]
- Wang, J.-J.; Jing, Y.-Y.; Zhang, C.-F.; Zhang, X.-T.; Shi, G.-H. Integrated evaluation of distributed triple-generation systems using improved grey incidence approach. Energy 2008, 33, 1427–1437. [Google Scholar] [CrossRef]
- Madlener, R.; Kowalski, K.; Stagl, S. New ways for the integrated appraisal of national energy scenarios: The case of renewable energy use in Austria. Energy Policy 2007, 35, 6060–6074. [Google Scholar] [CrossRef]
- Begic, F.; Afgan, N.H. Sustainability assessment tool for the decision making in selection of energy system—Bosnian case. Energy 2007, 32, 1979–1985. [Google Scholar] [CrossRef]
- Afgan, N.H.; Carvalho, M.G. Multi-criteria assessment of new and renewable energy power plants. Energy 2002, 27, 739–755. [Google Scholar] [CrossRef]
- Pilavachi, P.A.; Stephanidis, S.D.; Pappas, V.A.; Afgan, N.H. Multi-criteria evaluation of hydrogen and natural gas fuelled power plant technologies. Appl. Therm. Eng. 2009, 29, 2228–2234. [Google Scholar] [CrossRef] [Green Version]
- Gershon, M. Model Choice in Multi-Objective Decision-Making in Natural Resource Systems. Ph.D. Thesis, University of Arizona, Tucson, AZ, USA, 1981. [Google Scholar]
- Tecle, A. Choice of Multi-Criteria Decision-Making Techniques for Watershed Management. Ph.D. Thesis, University of Arizona, Tucson, AZ, USA, 1988. [Google Scholar]
- Trzaskalik, T. Wielokryterialne wspomaganie decyzji. Przegląd metod i zastosowań. Zesz. Nauk. Organ. i Zarządzanie Politech. Śląska 2014, 2014, 239–263. [Google Scholar]
- Maghsoodi, A.I.; Kavian, A.; Khalilzadeh, M.; Brauers, W.K.M. CLUS-MCDA: A novel framework based on cluster analysis and multiple criteria decision theory in a supplier selection problem. Comput. Ind. Eng. 2018, 118, 409–422. [Google Scholar] [CrossRef]
- Singh, R.K.; Murty, H.R.; Gupta, S.K.; Dikshit, A.K. An overview of sustainability assessment methodologies. Ecol. Indic. 2009, 9, 189–212. [Google Scholar] [CrossRef]
- Troldborg, M.; Heslop, S.; Hough, R.L. Assessing the sustainability of renewable energy technologies using multi-criteria analysis: Suitability of approach for national-scale assessments and associated uncertainties. Renew. Sustain. Energy Rev. 2014, 39, 1173–1184. [Google Scholar] [CrossRef]
- Bolcárová, P.; Kološta, S. Assessment of sustainable development in the EU 27 using aggregated SD index. Ecol. Indic. 2015, 48, 699–705. [Google Scholar] [CrossRef]
- Lazar, N.; Chithra, K. A comprehensive literature review on development of Building Sustainability Assessment Systems. J. Build. Eng. 2020, 32, 101450. [Google Scholar] [CrossRef]
- Atabaki, M.S.; Aryanpur, V. Multi-objective optimization for sustainable development of the power sector: An economic, environmental, and social analysis of Iran. Energy 2018, 161, 493–507. [Google Scholar] [CrossRef]
- Li, T.; Li, A.; Guo, X. The sustainable development-oriented development and utilization of renewable energy industry—A comprehensive analysis of MCDM methods. Energy 2020, 212, 118694. [Google Scholar] [CrossRef]
- Siksnelyte, I.; Zavadskas, E.K.; Bausys, R.; Streimikiene, D. Implementation of EU energy policy priorities in the Baltic Sea Region countries: Sustainability assessment based on neutrosophic MULTIMOORA method. Energy Policy 2019, 125, 90–102. [Google Scholar] [CrossRef] [Green Version]
- Olson, D.L. Comparison of three multicriteria methods to predict know outcomes. Eur. J. Oper. Res. 2001, 130, 576–587. [Google Scholar] [CrossRef]
- Kukuła, K.; Luty, L. Jeszcze o procedurze wyboru metody porządkowania liniowego. Przegląd Stat. 2017, 64, 163–176. [Google Scholar] [CrossRef]
- Dębkowska, K.; Jarocka, M. The impact of the methods of the data normalization on the result of linear ordering. Acta Univ. Lodz. Folia Oeconomica 2013, 286, 181–188. [Google Scholar]
- Drabarczyk, K. Zrównoważony rozwój województw—Analiza porównawcza. Zesz. Nauk. Politech. Częstochowskiej Zarządzanie 2017, 25, 23–34. [Google Scholar] [CrossRef]
- Müller-Frączek, I. Propozycja miary syntetycznej. Przegląd Stat. 2017, LXIV, 421–436. [Google Scholar]
- Kukuła, K.; Luty, L. Propozycja procedury wspomagającej wybór metody porządkowania liniowego. Przegląd Stat. 2015, 62, 219–231. [Google Scholar]
- Altintas, K.; Vayvay, O.; Apak, S.; Cobanoglu, E. An extended GRA method integrated with fuzzy AHP to construct a multidimensional index for ranking overall energy sustainability. Sustainability 2020, 12, 1602. [Google Scholar] [CrossRef] [Green Version]
- Yi, P.; Lu Wang, L.; Zhang, D.; Li, W. Sustainability Assessment of Provincial-Level Regions in China Using Composite Sustainable Indicator. Sustainability 2019, 11, 5289. [Google Scholar] [CrossRef] [Green Version]
- Li, S.; Li, R. Energy sustainability evaluation model based on the matter-element extension method: A case study of shandong province, China. Sustainability 2017, 9, 2128. [Google Scholar] [CrossRef] [Green Version]
- Zhouab, X.; Zhanga, R.; Yanga, K.; Yanga, C.; Huangc, T. Using hybrid normalization technique and state transition algorithm to VIKOR method for influence maximization problem. Neurocomputing 2020, 410, 41–50. [Google Scholar] [CrossRef]
- Central Statistical Office. Local Data Bank. Available online: http://stat.gov.pl/bdl/app/strona.html?p_name=indeks (accessed on 20 June 2020).
- Van Delft, A.; Nijkamp, P. Multi-Criteria Analysis and Regional Decision-Making; M. Nijhoff: Leiden, The Netherlands, 1977. [Google Scholar]
- Weitendorf, D. Beitrag zur optimierung der räumlichen Struktur eines Gebäude; Dissertation A an der Architektur und Bauwesen Fakultät der Bauhaus-Universität: Weimar, Germany, 1976. [Google Scholar]
- Peldschus, F. Zur Anwendung der Theorie der Spiele für Aufgaben der Bautechnologie; Dissertation B: Leipzig, Germany, 1986. [Google Scholar]
- Jüttler, H. Untersuchungen zur Fragen der Operationsforschung und ihrer Anwendungsmöglichkeiten auf Ökonomische Problemstellungen unter Besonderer Berücksichtigung der Spieltheorie; Dissertation A an der Wirtschaftswissenschaftlichen Fakultät der Humboldt-Universität: Berlin, Germany, 1966. [Google Scholar]
- Körth, H. Untersuchungen zur Nichtlinearen Optimierung Ökonomischer Erscheinungen und Prozesse unter Besonderer Berücksichtigung der Quotientenoptimierung sowie der Lösung Ökonomischer Mathematischer Modelle bei Existenz Mehrerer Zielfuntionen; Habilitationsschrift Humboldt—Universität Sektion Wirtschaftswissenschaften: Berlin, Germany, 1969. [Google Scholar]
- Stopp, F. Variantenvergleich Durch Matrixspiele; Wissenschaftliche Zeitschrift der Hochschule für Bauwesen: Leipzig, Germany, 1975. [Google Scholar]
- Voogd, H. Multicriteria Evaluation for Urban and Regional Planning; Pion Ltd.: London, UK, 1983. [Google Scholar]
- Zavadskas, E.K.; Turskis, Z. A new logarithmic normalization method in games theory. Informatica 2008, 19, 303–314. [Google Scholar] [CrossRef]
- Churchman, C.W.; Ackoff, R.L. An approximate measure o value. J. Oper. Res. Soc. Am. 1954, 2, 172–187. [Google Scholar] [CrossRef]
- Hwang, C.L.; Yoon, K. Multiple Attribute Decision Making: Methods and Applications; Springer: New York, NY, USA, 1981. [Google Scholar]
- Yoon, K.; Hwang, C.L. Multiple Attribute Decision Making: An Introduction; Sage Publications: Thousand Oaks, CA, USA, 1995. [Google Scholar]
- Hellwig, Z. Zastosowanie metody taksonomicznej do typologicznego podziału krajów ze względu na poziom ich rozwoju oraz zasoby i strukturę wykwalifikowanych kadr. Przegląd Stat. 1968, 4, 307–327. [Google Scholar]
- Zavadskas, E.K.; Turskis, Z.; Antucheviciene, J.; Zakarevicius, A. Optimization of weighted aggregated sum product assessment. Elektron. Elektrotechnika Electron. Electr. Eng. 2012, 122, 3–6. [Google Scholar] [CrossRef]
- Kemmler, A.; Spreng, D. Energy indicators for tracking sustainability in developing countries. Energy Policy 2007, 35, 2466–2480. [Google Scholar] [CrossRef]
- Vera, I.A.; Langlois, L.M.; Rogner, H.H.; Jalal, A.I.; Toth, F.L. Indicators for sustainable energy development: An initiative by the International Atomic Energy Agency. Nat. Resour. Forum 2005, 29, 274–283. [Google Scholar] [CrossRef]
- Liu, G. Development of a general sustainability indicator for renewable energy systems: A review. Renew. Sustain. Energy Rev. 2014, 31, 611–621. [Google Scholar] [CrossRef]
- Shaaban, M.; Scheffran, J. Selection of sustainable development indicators for the assessment of electricity production in Egypt. Sustain. Energy Technol. Assess. 2017, 22, 65–73. [Google Scholar] [CrossRef]
- Polityka Energetyczna Polski do 2040 Roku (PEP2040); Ministerstwo Energii: Warszawa, Poland, 2019. Available online: https://www.gov.pl/web/aktywa-panstwowe/zaktualizowany-projekt-polityki-energetycznej-polski-do-2040-r (accessed on 20 May 2020).


| Designation of the Method | Normalization Method | Formula | |
|---|---|---|---|
| Normalization of Stimulants | Normalization of Destimulants | ||
| 1 | Van Delftand Nijkamp [67] | ||
| 2 | Weitendorf [68] | ||
| 3 | Peldschus [69] | ||
| 4 | Jüttler [70] | ||
| 5 | Körth [71] | ||
| 6 | Stopp [72] | ||
| 7 | Voodg [73] | ||
| 8 | Logarithmic [74] | ||
| Criterion | Indicator | Unit | Designation |
|---|---|---|---|
| Consumption pattern | Electricity consumption per capita | kWh/cap | X1 |
| Energy affordability | HC-LI ratio | % | X2 |
| Energy security | The ratio of electricity production to electricity consumption | % | X3 |
| Health | Total emission of air pollutants from particularly polluting plants per capita | t/cap | X4 |
| Criterion | Indicator | Unit | Designation |
|---|---|---|---|
| Energy efficiency-production and use patterns | Energy consumption per capita | kWh/cap | X5 |
| Total electricity consumption per 1 million PLN of GDP | GWh/1 million PLN of GDP | X6 | |
| Gas consumption per capita | m3/cap | X7 | |
| Total hard coal consumption per capita | t/cap | X8 | |
| Energy efficiency-energy saving | Energy-saving expenditure per capita | PLN/cap | X9 |
| Criterion | Indicator | Unit | Designation |
|---|---|---|---|
| Expenditure on environmental protection | Total expenditure on pollution prevention per capita | PLN/cap | X10 |
| Total expenditure on pollution reduction per capita | PLN/cap | X11 | |
| Renewable energy | Share of energy from hydropower plants and renewable fuels in total electricity production | % | X12 |
| Installed capacity in RESs per capita | W/cap | X13 |
| Indicator | Voivodeships–Regions * | |||||||||||||||
|---|---|---|---|---|---|---|---|---|---|---|---|---|---|---|---|---|
| PL-DS | PL-KP | PL-LU | PL-LB | PL-LD | PL=MA | PL-MZ | PL-OP | PL-PK | PL-PD | PL-PM | PL-SL | PL-SK | PL-WP | PL-WN | PL-ZP | |
| X1 | 806.0 | 755.4 | 691.6 | 773.9 | 826.5 | 833.3 | 932.9 | 835.4 | 596.5 | 796.1 | 780.2 | 807.6 | 640.1 | 722.9 | 815.9 | 730.0 |
| X2 | 9.4 | 9.7 | 14.8 | 9.8 | 8.8 | 8.5 | 7.3 | 13.0 | 13.3 | 13.2 | 10.2 | 6.1 | 8.9 | 10.9 | 10.5 | 7.0 |
| X3 | 70.4 | 79.5 | 32.6 | 83.1 | 286.0 | 43.2 | 108.5 | 180.1 | 43.1 | 32.5 | 48.5 | 91.3 | 203.1 | 29.3 | 77.5 | 130.8 |
| X4 | 4.1 | 4.8 | 2.4 | 2.2 | 17.8 | 3.1 | 5.9 | 15.1 | 1.3 | 1.7 | 2.9 | 8.0 | 12.3 | 1.2 | 3.3 | 4.2 |
| X5 | 11,869.3 | 18,613.7 | 17,874.8 | 13,851.0 | 10,679.3 | 15,741.4 | 27,025.1 | 66,097.6 | 9808.9 | 7893.2 | 15,066.8 | 33,274.8 | 28,035.3 | 8507.0 | 9680.1 | 21,312.6 |
| X6 | 0.08 | 0.10 | 0.08 | 0.09 | 0.11 | 0.08 | 0.06 | 0.13 | 0.07 | 0.07 | 0.07 | 0.11 | 0.11 | 0.08 | 0.07 | 0.08 |
| X7 | 130.7 | 71.0 | 77.3 | 136.8 | 64.9 | 134.4 | 156.1 | 71.2 | 119.4 | 46.4 | 99.2 | 106.5 | 65.4 | 67.0 | 131.2 | 140.7 |
| X8 | 1.1 | 1.2 | 1.0 | 0.3 | 1.0 | 1.5 | 2.6 | 9.9 | 0.5 | 0.7 | 0.9 | 4.2 | 4.2 | 0.7 | 0.7 | 1.8 |
| X9 | 19.3 | 36.1 | 41.2 | 38.9 | 32.9 | 23.1 | 5.3 | 38.7 | 7.9 | 26.7 | 24.9 | 60.6 | 59.4 | 4.2 | 8.0 | 12.2 |
| X10 | 17.2 | 13.8 | 159.7 | 1.7 | 24.5 | 52.4 | 36.3 | 12.5 | 20.4 | 36.9 | 49.3 | 56.0 | 17.4 | 36.5 | 13.0 | 20.2 |
| X11 | 29.6 | 13.3 | 11.5 | 39.2 | 49.1 | 26.1 | 51.4 | 45.2 | 6.7 | 4.6 | 23.0 | 60.3 | 2.8 | 2.0 | 11.2 | 180.8 |
| X12 | 5.9 | 31.7 | 20.4 | 19.6 | 3.3 | 6.1 | 3.6 | 4.2 | 19.8 | 43.7 | 44.6 | 1.4 | 0.6 | 78.1 | 16.3 | 41.8 |
| X13 | 97.5 | 499.7 | 91.9 | 315.1 | 273.6 | 68.2 | 86.1 | 181.6 | 211.9 | 245.6 | 317.6 | 46.6 | 222.0 | 297.6 | 230.6 | 948.1 |
| Indicator | Minimum | Maximum | Average | Coefficient of Variation | Character |
|---|---|---|---|---|---|
| X1 | 596.50 | 93,290 | 771.52 | 0.10 | Destimulant |
| X2 | 6.14 | 14.80 | 10.08 | 0.24 | Destimulant |
| X3 | 29.30 | 286.00 | 96.22 | 0.72 | Stimulant |
| X4 | 1.17 | 17.77 | 5.63 | 0.87 | Destimulant |
| X5 | 7893.20 | 66,097.61 | 19,708.18 | 0.73 | Destimulant |
| X6 | 0.06 | 0.13 | 0.09 | 0.23 | Destimulant |
| X7 | 46.44 | 156.13 | 101.14 | 0.34 | Stimulant |
| X8 | 0.32 | 9.85 | 2.02 | 1.19 | Destimulant |
| X9 | 4.23 | 60.65 | 27.46 | 0.65 | Stimulant |
| X10 | 1.74 | 159.72 | 35.48 | 1.04 | Stimulant |
| X11 | 2.00 | 180.82 | 34.80 | 1.25 | Stimulant |
| X12 | 0.61 | 78.13 | 21.31 | 0.86 | Stimulant |
| X13 | 46.57 | 948.15 | 258.35 | 0.82 | Stimulant |
| Sub-Metod\Normalization | Van Delft and Nijkamp | Weitendorf | Stopp | Voddg |
|---|---|---|---|---|
| SAW I | 2.43 | 1.98 | 2.18 | 2.41 |
| SAW II | 2.36 | 1.98 | 2.06 | 2.40 |
| SAW III | 2.22 | 1.93 | 2.18 | 2.40 |
| TOPSIS I | 2.63 | 2.22 | 2.04 | 2.58 |
| TOPSIS II | 2.30 | 2.07 | 2.10 | 2.44 |
| TOPSIS III | 2.22 | 1.98 | 1.94 | 2.16 |
| SMD I | 2.36 | 2.19 | 2.23 | 2.30 |
| SMD II | 2.38 | 2.19 | 2.19 | 2.37 |
| SMD III | 2.33 | 2.10 | 2.23 | 2.29 |
| WASPAS I | 2.45 | 2.10 | 2.37 | 2.53 |
| WASPAS II | 2.02 | 2.10 | 2.09 | 2.04 |
| WASPAS III | 2.43 | 2.06 | 2.37 | 2.42 |
| Linear Ordering Sub-Method * | Ranking Quality Measure up ** | |
|---|---|---|
| Value Range | Mean Value | |
| SAW I1, SAW I2, SAW I6, SAW I7, SAW II1, SAW II2, SAW II6, SAW II7, SMD III1, SMD III2, SMD III6, SMD III7, WASPAS I1, WASPAS I2, WASPAS I6, WASPAS I7, WASPAS II1, WASPAS II2, WASPAS II6, WASPAS II7, WASPAS III1, WASPAS III2, WASPAS III6, WASPAS III7 | 0.78–0.88 | 0.84 |
| SAW III1, SAW III2, SAW III6, SAW III7, TOPSIS I1, TOPSIS I2, TOPSIS I6, TOPSIS I7, TOPSIS II1, TOPSIS II2, TOPSIS II6, TOPSIS II7, TOPSIS III1, TOPSIS III2, TOPSIS III6, TOPSIS III7, SMD I1, SMD I2, SMD I6, SMD I7, SMD II1, SMD II2, SMD II6, SMD II7 | 0.64–0.84 | 0.77 |
Publisher’s Note: MDPI stays neutral with regard to jurisdictional claims in published maps and institutional affiliations. |
© 2020 by the authors. Licensee MDPI, Basel, Switzerland. This article is an open access article distributed under the terms and conditions of the Creative Commons Attribution (CC BY) license (http://creativecommons.org/licenses/by/4.0/).
Share and Cite
Trojanowska, M.; Nęcka, K. Selection of the Multiple-Criiater Decision-Making Method for Evaluation of Sustainable Energy Development: A Case Study of Poland. Energies 2020, 13, 6321. https://doi.org/10.3390/en13236321
Trojanowska M, Nęcka K. Selection of the Multiple-Criiater Decision-Making Method for Evaluation of Sustainable Energy Development: A Case Study of Poland. Energies. 2020; 13(23):6321. https://doi.org/10.3390/en13236321
Chicago/Turabian StyleTrojanowska, Małgorzata, and Krzysztof Nęcka. 2020. "Selection of the Multiple-Criiater Decision-Making Method for Evaluation of Sustainable Energy Development: A Case Study of Poland" Energies 13, no. 23: 6321. https://doi.org/10.3390/en13236321