Abstract
The increase in ambient particulate matter (PM) is affecting not only our daily life but also various industries. To cope with the issue of PM, which has been detrimental to the population of megacities, an advanced demand response (DR) program is established by Korea Power Exchange (KPX) to supplement existing policies in Korea. Ironically, however, DR programs have been launched hurriedly, creating problems for several stakeholders such as local governments, market operators, and DR customers. As an alternative, a method for predicting and categorizing the PM through deep learning and fuzzy inference is suggested in this study. The simulation results based on Seoul data show that the proposed model can overcome the problems related to current DR programs and policy loopholes and can provide improvements for some stakeholders. However, the proposed model also has some limitations, which require an in-depth policy consideration or an incentive system for power generation companies.
1. Introduction
A high content of ambient particulate matter (PM), classified as a Group 1 carcinogen by the World Health Organization, has caused several problems in countries such as China, India, and Korea [1,2,3,4,5]. PM not only harms the human body, but also affects our daily life and the industrial sector. Studies have reported premature mortality and short lifetime, with 1.2 to 2 million deaths per year in China due to ambient PM [6,7,8,9]. Therefore, national efforts are required to alleviate the PM problem and significant resources are being invested for air purification. Another representative example is Korea, which is geographically very close to China. The Organization for Economic Co-operation and Development (OECD) designated Korea as one of the countries with the poorest air quality [10]. Ultrafine dust warnings have nearly doubled compared with the previous readings of 2017. Accordingly, the Ministry of Environment in Korea has made significant efforts to manage fine dust, such as enacting a special law on fine dust reduction and management [11].
Efforts to deal with high PM content are being actively made not only in terms of revamping the national policy but also from academic aspects [12,13,14,15,16,17,18,19,20]. In Reference [12], studies on predicting particulate matter with diameters that are generally 10 microns or less (PM10) using the artificial neural network (ANN) technique were conducted. Some studies predicted and monitored the status of PM by combining artificial intelligence (AI) techniques, such as the multi-layer perceptron (MLP) technique, with an autoregressive integrated moving average (ARIMA), which is a statistical model [13,14]. The long short-term memory (LSTM) approach, which is an AI tool that enhances its accuracy by taking into account the impact of time, has been considered in some studies to estimate the degree of PM or air pollution more accurately [15,16,17]. Others have used LSTM with neural networks (NNs) to improve the error rate of PM prediction [18,19]. A dynamic ensemble technique, in which various techniques are combined to improve the prediction performance, was suggested in Reference [20].
Fuzzy inference is mainly used to define the vagueness that does not follow a probability distribution [21]. For example, it is used to predict the load or calculate the curtailment degree [21,22,23] or predict the electricity price [24]. It is also used in conjunction with NNs to predict the electricity demand more accurately [25,26]. Unlike the electricity price or demand, the ambient PM has a distinct characteristic: PM is classified into bad, normal, and good categories depending on the degree of PM concentration. For example, if the PM10 concentration is 80 ppm, it is classified as normal, but if it is 81 ppm, it is classified as bad based on the Korean standard. Intuitively, if 81 ppm is harmful to the human body, a PM10 concentration of 80 ppm will have similar harmful effects. PM concentrations of both 31 and 80 ppm belong to the normal group and both are not harmful according to the standard, even though 80 ppm is very much closer to a concentration of 81 ppm, and this criterion has perplexed decision-makers. Thus, Kim proposed a new criterion for PM classification by predicting weather information in Korea through fuzzy inference [27].
The ambient PM has also affected the power industry. As some generators emit PM during power generation, the power industry is not free from fine dust. To cope with fine dust, the Korean Government has implemented a policy to limit the output of coal-fired power generators on days when the fine dust concentration is expected to be at a bad level. As the Korean electricity market is operated by a cost-based pool, to compensate for the amount of reduction in the output of coal-fired power plants, which run on a base-load generator, a peak generator is used, resulting in a high wholesale system marginal price (SMP). In response to the high SMP, the Korea Power Exchange (KPX), which is an independent system operator in Korea, has modified the conventional DR program to a particulate matter demand response (PMDR) program.
However, the PMDR program has been improvised as a supplementary policy measure to counter fine dust, and some problems have been encountered among interested parties such as local governments, market operators, and DR customers. First, local governments could be lobbied by power generation companies, and the role of the demand response market operator (DRMO), who is in charge of KPX in Korea, is limited. Finally, the degree of market participation by DR customers is unpredictable. As an alternative, we propose a methodology for predicting the ambient PM through deep learning and fuzzy inference to expand the PMDR program. The main contributions of this study are as follows:
- A novel model for PM prediction based on an ANN and regulations on the output limits of coal-fired power generation using fuzzy inference.
- Feasible solutions to the currently implemented DR program (PMDR) based on the proposed model.
- Proposes a direction for policy reference for improving the DR market.
2. Particulate Matter Demand Response in Korea
2.1. Reorganization of the Demand Response Program in Korea
DR programs are generally divided into incentive-based and price-based. Incentive-based programs can be further divided into classical and market-based [28]. The DR market has been in operation since 2014 in Korea, and the market operation results are summarized in Section 2 of our previous study [29]. The DR market has been operating under two representative programs: economic DR and reliability DR. However, the DR market was reorganized in 2019 due to various demands on the DR market in conjunction with various environmental and policy issues. The revised Korean DR market is briefly described in Figure 1.
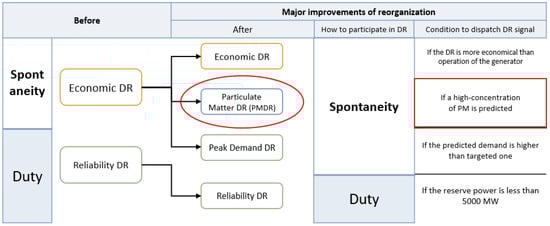
Figure 1.
Reorganization of the demand response (DR) program in Korea.
2.2. Workflow of PMDR
The PMDR marked with a red box in Figure 1 is the DR program mainly dealt with in this study. Three stakeholders typically operate the current PMDR program: local government, a market operator (MO), customers (in fact, a DR aggregator, an intermediary that connects customers and MO, should also be considered; however, for convenience, only three stakeholders are considered in this study). The role of each stakeholder in implementing the PMDR is as follows. First, the Korean Ministry of Environment (KME) predicts the fine dust concentration level, and if the PM level exceeds the upper limit standard, the “high-concentration fine dust emergency reduction measure (HERM)” will be issued. Each local government monitors the Ministry of Environment’s forecast in real time through the Air Korea website [30], and when the HERM is issued, the output of the coal-fired power generator is limited to 80% of the original generation. Next, KPX, the MO in Korea, will open a PMDR to secure resources to substitute for the reduced output. The amount of resources secured through the market is same as the amount of deduction based on the administrative command of the local government. Therefore, if KPX opens a PMDR market, customers will participate in the PMDR by bidding in the day-ahead market. Figure 2 presents the flow of each stakeholder for PMDR participation.
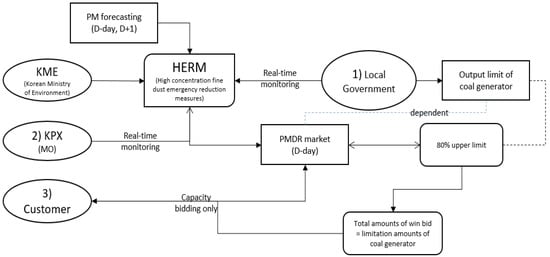
Figure 2.
Flowchart for particulate matter demand response (PMDR) operation.
2.3. Limitations of Current PMDR Program
As mentioned in the introduction, the PMDR seems to have been established to counter policy moves in an exceptional situation due to PM rather than a program executed to meet the requirements of the market. Therefore, some problems have surfaced given its hurried execution to overcome the high SMP, hence we address the critical issues from the perspective of the stakeholders mentioned in Section 2.2. (1) The possibility of lobbying the local governments by power generation companies: Coal-fired power companies have an incentive to lobby the local governments with the privilege to limit output reduction, as reduced output can affect their profits. (2) Limitation of the role of DRMO: Existing DR market operators actively open the markets and have clear criteria for the opened markets. However, in the market structures, shown in Figure 2, the PMDR operated by KPX is affected by local governments’ decision-making, thus limiting their role to intermediaries rather than playing the role of MO. (3) Bounded market participation of DR customers: As DR customers cannot predict the opening of DR markets and may not have the capacity to participate in the DR markets, they simply act as passive customers who only participate by receiving signals from day-ahead markets without being able to establish a market participation strategy due to the opening of the DR market to address the economic losses from the extant policy to handle the PM. Therefore, in this study, we propose a measure that can quantify the degree of PMDR market opening based on the predicted value of the fine dust through deep learning and fuzzy inference.
3. Proposed Model for PM Prediction Based on Deep Learning and Fuzzy Inference
Figure 3 shows the overall schematic of the proposed model. First, the PM concentrations are predicted using the weather data through a deep learning-based ANN. In the next step, the concentration of the fine dust, which is the output of the prediction, is inputted to the fuzzy inference engine. The fuzzy inference engine is based on the most commonly used Mamdani inference method. Finally, the limit level of coal-fired power generation is derived as the ultimate output through defuzzification.
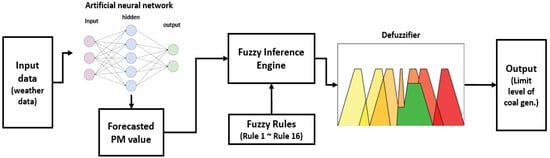
Figure 3.
Overall schematic of the proposed model.
3.1. PM Prediction through ANN
3.1.1. Training Data Selection
The weather data, which serve as input training data to predict the PM, are available on the Air Korea website [30] and contains temperature, wind speed, wind direction, ozone (), carbon monoxide (), and sulfur dioxide (). The data for the year 2019 from Seoul and the MLP technique is used for training. As mentioned in the introduction, more complex deep learning techniques may provide a better prediction performance; however, the ultimate purpose of this study is not a high-performance PM prediction, but a classification standard based on the fine dust concentration. Thus, if the prediction is made within an acceptable error through the MLP technique, a more complex technique would be unnecessary for this study.
3.1.2. Preprocessing
Figure 4 presents the observational data of the six parameters from the weather data in a year referred to in Section 3.1.1.
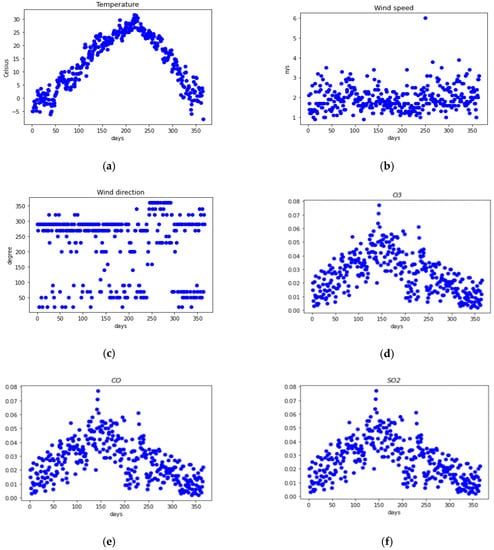
Figure 4.
Raw weather data with (a) temperature, (b) wind speed, (c) wind direction, (d) ozone, (e) carbon monoxide, and (f) sulfur dioxide in Seoul (2019).
The y-axis values are different for each parameter, and there are some outliers for each data in Figure 4. Therefore, preprocessing processes, such as normalization and outlier elimination, are required. Figure 5 shows the preprocessed data.
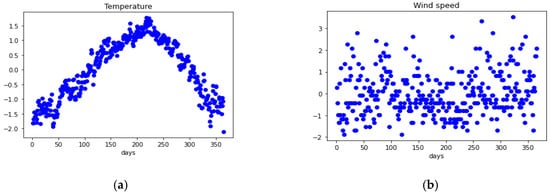
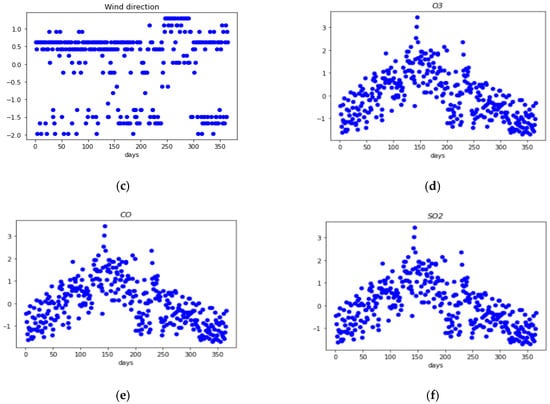
Figure 5.
Preprocessed weather data with (a) temperature, (b) wind speed, (c) wind direction, (d) ozone, (e) carbon monoxide, and (f) sulfur dioxide in Seoul (2019).
As shown in Figure 4, the y-values of each of the six data represent the value according to each data type. However, different units of data are obstacles to learning, thus, we let all the data have a mean of zero and a standard deviation of one through the standardization process. The result can be observed in Figure 5. In addition, some outlier data were removed to have a relatively even value.
3.1.3. Hyper-Parameter Tuning
We require a process for tuning the hyper-parameters, such as the number of hidden layers, learning rates, and number of neurons, to increase the prediction accuracy. The NN structure was obtained by tuning these parameters by comparing the errors while varying these hyper-parameters and the structure is presented in Table 1.

Table 1.
Structure of the neural network (NN) after hyper-parameter tuning.
According to Table 1, there will be two hidden layers used for training, 102 and 96 neurons at the hidden layer, and one neuron at the last output layer that receives the predicted result.
3.2. Fuzzy Inference Engine
In this study, a fuzzy inference engine is constructed using the Mamdani inference method, one of the most commonly used techniques [31]. According to Reference [31], Mamdani inference can be broadly classified into five steps: fuzzifying the input variables, applying the fuzzy operators, applying implication methods, applying aggregation methods, and defuzzification. However, for a more convenient approach, this study constructs a fuzzy inference engine in three stages: fuzzification, rule evaluation, and defuzzification.
3.2.1. Fuzzification
In fuzzification, a membership function to classify the fine dust must be defined. Therefore, it is necessary to examine the concentration of the fine dust classified by the Korean Environment Ministry (KME) and accordingly define the membership functions. The criteria for classification based on the fine dust concentration as published by the KME are listed in Table 2.
Table 2.
Particulate matter (PM) classification criteria established by the Korea Ministry of Environment (KME).
Based on the existing classification, the concentration of PM10 is bad and considered harmful to the human body, whereas the concentration of PM10 is considered normal despite the very small difference from ) and thus belongs to the same class as . However, there is a significant difference in the degree of harm to the human body. Therefore, instead of such an ambiguous classification, a membership function is defined, as shown in Figure 6, to classify the PM in proportion to the concentration reflecting the criteria in Table 2.
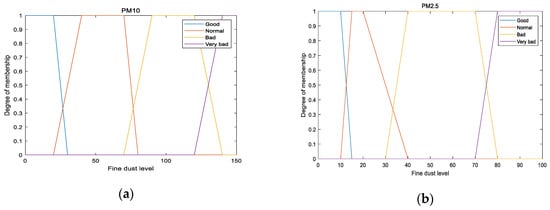
Figure 6.
Input membership function for (a) PM10 and (b) PM2.5.
If of PM10 is classified as normal based on the existing classification method (Table 2), it has a normal value of 0.4 and a bad value of 0.3 as per the classification based on the proposed membership function. Likewise, of PM2.5 has a normal value of 0.4 and a bad value of 0.4, unlike the conventional classification, i.e., bad.
3.2.2. Rule Evaluation
The rules must be evaluated to match the input and output membership functions. Thus, a total of 16 rules are built in our proposed fuzzy inference engine.
- Rule 1: If PM10 = VB or PM2.5 = VB, then the coal generator limit level is high
- Rule 2: If PM10 = VB or PM2.5 = B, then the coal generator limit level is high
- Rule 3: If PM10 = VB or PM2.5 = N, then the coal generator limit level is medium
- Rule 4: If PM10 = VB or PM2.5 = G, then the coal generator limit level is medium
- Rule 5: If PM10 = B or PM2.5 = VB, then the coal generator limit level is high
- Rule 6: If PM10 = B or PM2.5 = B, then the coal generator limit level is medium
- Rule 7: If PM10 = B or PM2.5 = N, then the coal generator limit level is low
- Rule 8: If PM10 = B or PM2.5 = G, then the coal generator limit level is low
- Rule 9: If PM10 = N or PM2.5 = VB, then the coal generator limit level is high
- Rule 10: If PM10 = N or PM2.5 = B, then the coal generator limit level is low
- Rule 11: If PM10 = N or PM2.5 = N, then the coal generator limit level is zero
- Rule 12: If PM10 = N or PM2.5 = G, then the coal generator limit level is zero
- Rule 13: If PM10 = G or PM2.5 = VB, then the coal generator limit level is high
- Rule 14: If PM10 = G or PM2.5 = B, then the coal generator limit level is low
- Rule 15: If PM10 = G or PM2.5 = N, then the coal generator limit level is zero
- Rule 16: If PM10 = G or PM2.5 = G, then the coal generator limit level is zero
For example, in Section 3.2.1, of PM10 and of PM2.5 are evaluated by rules 6, 7, 10, and 11. The accumulated evaluation result shows a medium (Rule 6) of 0.4, a low (Rules 7, 10) of 0.8, and a zero value of 0.4 (Rule 11).
3.2.3. Defuzzification
The ultimate goal of the MO is to define the upper limit level of a coal-fired power generator proportional to the PM level. Therefore, the output membership function should be as much as the attenuation level of the coal-fired power generation. Accordingly, the proposed output membership function is as shown in Figure 7.
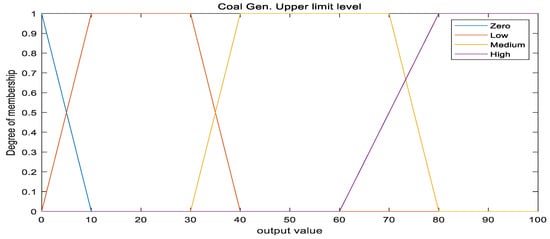
Figure 7.
Output membership function.
Depending on the concentration of PM10 and PM2.5, the degree of the power generation limit is determined by the rule proposed in Section 3.2.2, and the value is calculated using the well-known centroid technique (also called the center of area) [31]. The algebraic expression of the center of area is:
where is the output value, and is the membership function of the aggregated fuzzy set with respect to [31].
For example, of PM10 and of PM2.5 have an output of 34 by the calculation process in (1).
Likewise, if the predicted concentrations of PM10 and PM2.5 are added as input to the fuzzy inference engine, we need to determine the quantitative value of the percentage of the upper limit output through the defuzzification process.
4. Simulation Results and Discussion
4.1. PM Prediction with Validation Data
A simulation is conducted to check whether the model proposed in Section 3 is suitable for the new DR program. As the training was conducted through the data in Section 3.1 in 2019, the validation will be carried out based on the data from Seoul in January and February 2020 (although data after March were also accessible, we only used data from January and February, because the Covid-19 pandemic that affected the industry as a whole spread rapidly in Korea).
The prediction error rate is approximately 11%, which is not superior compared to previous studies. However, as mentioned earlier, the results shown in Figure 8 meet our objective, which is the classification of the predicted fine dust rather than focusing on very high performance. Figure 9 shows a comparison of the predicted fine dust and the actual fine dust value.
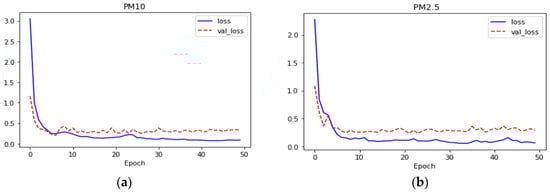
Figure 8.
Performance of prediction results for (a) PM10 and (b) PM2.5.
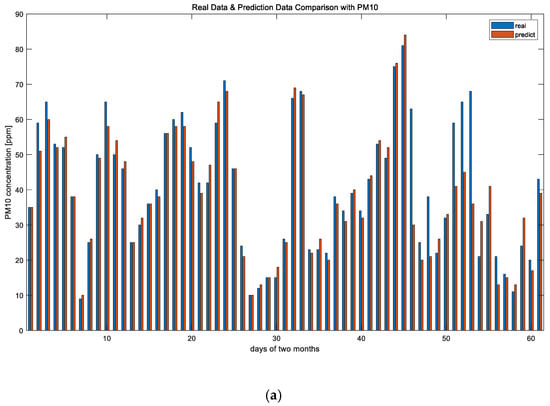
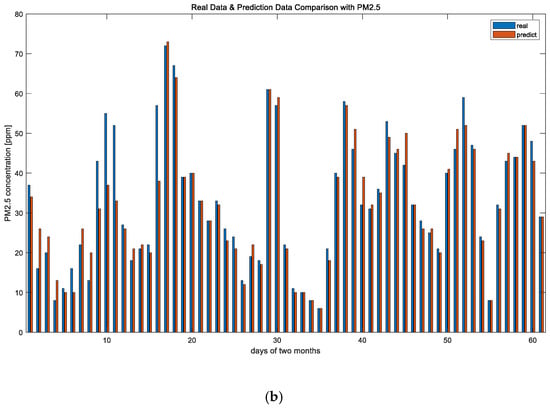
Figure 9.
Data comparison with real data and predicted data for (a) PM10 and (b) PM2.5.
The output value of the PM concentration, shown in Figure 9, obtained through the prediction is inputted to the fuzzy inference engine, as suggested in Section 3.2.
4.2. Fuzzy Inference Engine
The Seoul Metropolitan Government-issued PM-related administrative announced the HERM four times, i.e., on 3 January, 11 January, 19 January, and 15 February, and these results are shown in Figure 10a. In contrast, Figure 10b shows the final output value obtained through the Mamdani inference method suggested in Section 3.
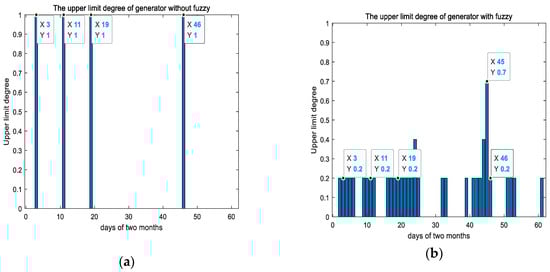
Figure 10.
Limitation level comparison with (a) fuzzy inference and (b) without fuzzy.
Under the existing system, the PMDRs should be invoked for four HERMs in Seoul. However, the result (Figure 9) shows that there were days when the fine dust concentration was higher than the days when the HERM was conducted. As already mentioned, this leads to difficulties in operating the DR program because of institutional and policy loopholes. In contrast, the comparison of Figure 9 and Figure 10b confirms that the proposed model can establish quantitative standards that can define the degree of the upper limit of the output coal generation in proportion to the PM level. For example, on the day the four HERMs were issued, although a 20% coal-fired power output limit was in place compared to the previous one, it can be seen that on February 14 (x = 45 in Figure 10), the highest limit of 70% was in place.
4.3. Proposed New DR Program Process
While PMDRs operated by the existing method (flow in Figure 2 by the result of Figure 10) showed definite limitations, the simulation results (comparison of Figure 9 and Figure 10b) show that the proposed model can be supported on sufficient grounds to guarantee the vindication for opening a PMDR market based on the PM pollution level. Consequently, Figure 11 shows the process of participating in the new PMDR suggested in this study through the deep learning proposed in Section 3.1 and the fuzzy inference proposed in Section 3.2.
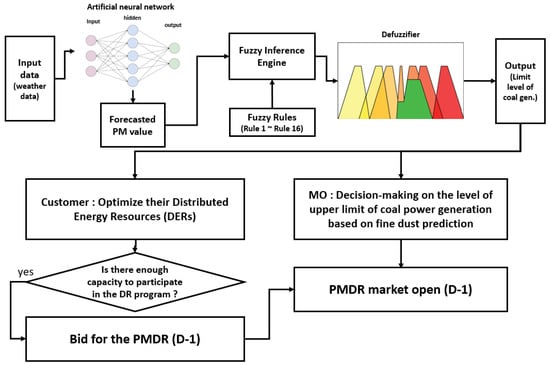
Figure 11.
Proposed DR program process.
It is also expected that customers will also be able to establish an optimal strategy for bidding in the day-ahead market through the same mechanism if the PMDR program is implemented through these clear criteria (Figure 11). The existing scheme (Figure 2) has made it very difficult for DR customers to predict their participation in the DR program. In addition, if the PMDR can be operated independently by the KPX and the market operator (MO), through the suggested model, the possibility of lobbying by power generation companies, mentioned in Section 2.3, is expected to disappear.
However, the proposed model would have an upper output of 730% over a total of 28 days (Figure 10b), whereas the previous method would have an upper output of approximately 400% over a total of four days (Figure 10a). These results are conducive to recognizing the environment like previous studies conducted due to a lot of interest in air pollution and environmental issues [32,33,34,35]; however, it can be fatal to the coal-fired power generation operators due to an output limit of approximately 1.8 times greater than the existing program. As a result, new challenges may arise for which appropriate solutions are required to avoid conflicting interests among stakeholders.
5. Conclusions
A novel PM prediction model based on deep learning and fuzzy inference engine was proposed to alleviate the problems of the current extended DR program in Korea. The proposed framework consists of a deep learning phase that uses an MLP technique based on meteorological data to predict PM10 and PM2.5 in Seoul, and a fuzzy inference engine phase, based on a Mamdani inference method constructed with fuzzification, rule evaluation, and defuzzification, to which the predicted PM values are inputted. In the process of fuzzification, a membership function based on the classification criteria proposed by the KME to classify PM in Korea was created, which is expected to increase the objectivity of fuzzification. The simulation results based on actual data from the Seoul Metropolitan Government demonstrated the efficiency of the proposed model to address the problems in the current DR program. Finally, we have presented an overall schematic (Figure 11) for the new DR program based on the simulation results, and the newly proposed DR program is expected to solve the problems of each of the stakeholders mentioned in Section 2.3.
However, as already mentioned, there is a conflict of interest for power generation companies when applying the proposed model between the environmental and economic market operation related to the benefit of coal generators. Therefore, it is necessary to consider policy supplementation to preserve the interests of coal-fired power generation companies or develop incentive systems through the intervention of the Korea Electric Power Corporation (KEPCO) or the market operator KPX.
Furthermore, problems with the limitations of fuzzy inference can also arise. For example, in Section 3.2.3, the statement to the question about whether is indeed justified to have a bad value of 0.4 should be answered as the limitation of the fuzzy inference, i.e., the difficulty of objectification. In other words, this is just one of the alternative methods, and there is a possibility of deriving a more reasonable membership function for optimized PMDR operation through the proposed model. Thus, an optimized DR program from the viewpoint of MO and the DR customer is expected to serve more relevant implications for the DR market operation.
Author Contributions
Conceptualization, J.R.; Data analysis, simulation, and methodology framework development, J.R.; Writing, review, and editing, J.R. and J.K. Project management and supervision, J.K. All authors have read and agreed to the published version of the manuscript.
Funding
This work was supported by the Korea Institute of Energy Technology Evaluation and Planning (KETEP) and the Ministry of Trade, Industry & Energy (MOTIE) of the Republic of Korea (No. 20191210301930 and No. 20204010600340).
Conflicts of Interest
The authors have no conflict of interest to declare.
References
- World Health Oraganization. Outdoor Air Pollution a Leading Environmental Cause of Cancer Deaths; International Agency for Research on Cancer: Lyon, France, 2013. [Google Scholar]
- Chan, C.K.; Yao, X. Air pollution in mega cities in China. Atmos. Environ. 2008, 42, 1–42. [Google Scholar] [CrossRef]
- Zanobetti, A.; Schwartz, J.; Samoli, E.; Gryparis, A.; Touloumi, G.; Peacock, J.; Anderson, R.H.; Le Tertre, A.; Bobros, J.; Celko, M.; et al. The temporal pattern of respiratory and heart disease mortality in response to air pollution. Environ. Health Perspect. 2003, 111, 1188–1193. [Google Scholar] [CrossRef]
- Balakrishnan, K.; Dey, S.; Gupta, T.; Dhaliwal, R.S.; Brauer, M.; Cohen, A.J.; Stanaway, J.D.; Beig, G.; Joshi, T.K.; Aggarwal, A.N.; et al. The impact of air pollution on deaths, disease burden, and life expectancy across the states of India: The Global Burden of Disease Study 2017. Lancet Planet. Health 2019, 3, e26–e39. [Google Scholar] [CrossRef]
- Singh, P.; Dey, S.; Chowdhury, S.; Bali, K. Early Life Exposure to Outdoor Air Pollution: Effect on Child Health in India; Brookings India Working Paper Series; Brookings India: New Delhi, India, 2019. [Google Scholar]
- Liao, X.; Tu, H.; Maddock, J.E.; Fan, S.; Lan, G.; Wu, Y.; Yuan, Z.K.; Lu, Y. Residents’ perception of air quality, pollution sources, and air pollution control in Nanchang, China. Atmos. Pollut. 2015, 6, 835–841. [Google Scholar] [CrossRef]
- Liu, X.; Zhu, H.; Hu, Y.; Feng, S.; Chu, Y.; Wu, Y.; Wang, C.; Zhang, Y.; Yuan, Z.; Lu, Y. Public’s health risk awareness on urban air pollution in Chinese megacities: The cases of Shanghai, Wuhan and Nanchang. Int. J. Environ. 2016, 13, 845. [Google Scholar] [CrossRef]
- Manisalidis, I.; Stavropoulou, E.; Stavropoulos, A.; Bezirtzoglou, E. Environmental and health impacts of air pollution: A review. Front. Public Health 2020, 8, 1–13. [Google Scholar] [CrossRef]
- Eom, J.; Hyun, M.; Lee, J.; Lee, H. Increase in household energy consumption due to ambient air pollution. Nat. Energy 2020. [Google Scholar] [CrossRef]
- Institute for Health Metrics and Evaluation. State of Global Air/2017: A Special Report on Global Exposure to Air Pollution and Its Disease Burden; Institute for Health Metrics and Evaluation: Seattle, WA, USA, 2017. [Google Scholar]
- Ministry of Environment in Korea. Available online: http://eng.me.go.kr/eng/web/index.do?menuId=464&firstItemIndex=Topics (accessed on 3 November 2020).
- Oprea, M.; Popescu, M.; Dragomir, E.G.; Mihalache, S.F. Models of particulate matter concentration forecasting based on artificial neural networks. In Proceedings of the 2017 9th IEEE International Conference on Intelligent Data Acquisition and Advanced Computing Systems: Technology and Applications (IDAACS), Bucharest, Romania, 21–23 September 2017; pp. 782–787. [Google Scholar] [CrossRef]
- Xu, Y.; Lan, S. Additive Calibration Model for the Monitoring Data of PM2.5 and PM10 Based on ARIMA and Multiple Linear Regression. In Proceedings of the 2019 International Conference on Economic Management and Model Engineering (ICEMME), Malacca, Malaysia, 6–8 December 2019. [Google Scholar]
- Kalate Ahani, I.; Salari, M.; Shadma, A. Statistical models for multi-step-ahead forecasting of fine particulate matter in urban areas. Atmos. Pollut. Res. 2019, 10, 689–700. [Google Scholar] [CrossRef]
- Park, J.-H.; Yoo, S.-J.; Kim, K.-J.; Gu, Y.-H.; Lee, K.-H.; Son, U.-H. PM10 density forecast model using long short term memory. In Proceedings of the 2017 Ninth International Conference on Ubiquitous and Future Networks (ICUFN), Milan, Italy, 4–7 July 2017; pp. 576–581. [Google Scholar]
- Kang, S.; Kim, N.; Lee, B. Fine Dust Forecast Based on Recurrent Neural Networks. In Proceedings of the 2019 21st International Conference on Advanced Communication Technology (ICACT), PyeongChang, Korea, 17–20 February 2019. [Google Scholar]
- Dua, R.D.; Madaan, D.M.; Mukherjee, P.M.; Lall, B.L. Real Time Attention Based Bidirectional Long Short-Term Memory Networks for Air Pollution Forecasting. In Proceedings of the 2019 IEEE Fifth International Conference on Big Data Computing Service and Applications (BigDataService), Newark, CA, USA, 4–9 April 2019. [Google Scholar]
- Tsai, Y.-T.; Zeng, Y.-R.; Chang, Y.-S. Air Pollution Forecasting Using RNN with LSTM. In Proceedings of the 2018 IEEE 16th Intl Conf on Dependable, Autonomic and Secure Computing, 16th Intl Conf on Pervasive Intelligence and Computing, 4th Intl Conf on Big Data Intelligence and Computing and Cyber Science and Technology Congress (DASC/PiCom/DataCom/CyberSciTech), Athens, Greece, 12–15 August 2018. [Google Scholar]
- Li, T.; Hua, M.; Wu, X. A Hybrid CNN-LSTM Model for Forecasting Particulate Matter (PM2.5). IEEE Access 2020, 8, 26933–26940. [Google Scholar] [CrossRef]
- Bueno, A.; Coelho, G.P.; Bertini, J.R. Dynamic ensemble mechanisms to improve particulate matter forecasting. Appl. Soft Comput. 2020, 91, 106123. [Google Scholar] [CrossRef]
- Li, W.; Zhou, J.; Xie, K.; Xiong, X. Power System Risk Assessment Using a Hybrid Method of Fuzzy Set and Monte Carlo Simulation. IEEE Trans. Power Syst. 2008, 23, 336–343. [Google Scholar]
- Omran, N.G.; Filizadeh, S. Location-Based Forecasting of Vehicular Charging Load on the Distribution System. IEEE Trans. Smart Grid. 2014, 5, 632–641. [Google Scholar] [CrossRef]
- Qela, B.; Mouftah, H.T. Peak Load Curtailment in a Smart Grid via Fuzzy System Approach. IEEE Trans. Smart Grid. 2014, 5, 761–768. [Google Scholar] [CrossRef]
- Gu, C.; Yang, W.; Song, Y.; Li, F. Distribution Network Pricing for Uncertain Load Growth Using Fuzzy Set Theory. IEEE Trans. Smart Grid 2016, 7, 1932–1940. [Google Scholar] [CrossRef]
- Sulandari, W.; Subanar; Lee, M.H.; Rodrigues, P.C. Indonesian electricity load forecasting using singular spectrum analysis, fuzzy systems and neural networks. Energy 2020, 190, 116408. [Google Scholar] [CrossRef]
- Chen, P.-C.; Kezunovic, M. Fuzzy Logic Approach to Predictive Risk Analysis in Distribution Outage Management. IEEE Trans. Smart Grid 2016, 7, 2827–2836. [Google Scholar] [CrossRef]
- Kim, P.W. Operating an environmentally sustainable city using fine dust level big data measured at individual elementary schools. Sustain. Cities Soc. 2018, 37, 1–6. [Google Scholar] [CrossRef]
- Albadi, M.H.; El-Saadany, E.F. A summary of demand response in electricity markets. Electr. Power Syst. Res. 2008, 78, 1989–1996. [Google Scholar] [CrossRef]
- Ryu, J.; Kim, J. Non-Cooperative Indirect Energy Trading with Energy Storage Systems for Mitigation of Demand Response Participation Uncertainty. Energies 2020, 13, 883. [Google Scholar] [CrossRef]
- Airkorea. Available online: https://www.airkorea.or.kr/eng (accessed on 3 November 2020).
- Wang, C. A Study of Membership Functions on Mamdani-Type Fuzzy Inference System for Industrial Decision-Making. Master‘s Thesis, Lehigh University, Bethlehem, PA, USA, 2015. [Google Scholar]
- Bungău, C.C.; Prada, I.F.; Prada, M.; Bungău, C. Design and Operation of Constructions: A Healthy Living Environment-Parametric Studies and New Solutions. Sustainability 2019, 11, 6824. [Google Scholar] [CrossRef]
- Gerber Machado, P.; Rodrigues Teixeira, A.C.; Mendes de Almeida Collaço, F.; Hawkes, A.; Mouette, D. Assessment of Greenhouse Gases and Pollutant Emissions in the Road Freight Transport Sector: A Case Study for São Paulo State, Brazil. Energies 2020, 13, 5433. [Google Scholar] [CrossRef]
- Liu, Z.; Chen, X.; Cai, J.; Baležentis, T.; Li, Y. The Impact of “Coal to Gas” Policy on Air Quality: Evidence from Beijing, China. Energies 2020, 13, 3876. [Google Scholar] [CrossRef]
- Roh, M.; Jeon, S.; Kim, S.; Yu, S.; Heshmati, A.; Kim, S. Modeling Air Pollutant Emissions in the Provincial Level Road Transportation Sector in Korea: A Case Study of the Zero-Emission Vehicle Subsidy. Energies 2020, 13, 3999. [Google Scholar] [CrossRef]


Publisher’s Note: MDPI stays neutral with regard to jurisdictional claims in published maps and institutional affiliations. |
© 2020 by the authors. Licensee MDPI, Basel, Switzerland. This article is an open access article distributed under the terms and conditions of the Creative Commons Attribution (CC BY) license (http://creativecommons.org/licenses/by/4.0/).