Article

Numerical and Experimental Investigations on Combustion Characteristics of Premixed Lean Methane–Air in a Staggered Arrangement Burner with Discrete Cylinders

1
Key Laboratory of Ocean Energy Utilization and Energy Conservation of Ministry of Education, Dalian University of Technology, Dalian 116024, China
2
School of Transportation and Vehicle Engineering, Shandong University of Technology, Zibo 255000, China
3
School of Safety Science and Engineering, Liaoning Technical University, Huludao 125105, China
*
Author to whom correspondence should be addressed.
Energies 2020, 13(23), 6397; https://doi.org/10.3390/en13236397
Submission received: 13 October 2020 / Revised: 24 November 2020 / Accepted: 30 November 2020 / Published: 3 December 2020

Abstract

:
Premixed combustion of lean methane–air in an artificial porous media burner with staggered alumina cylinders was experimentally and numerically performed. Numerical simulations were conducted at gas mixture velocities of 0.43–0.86 m/s and equivalence ratios of 0.162 and 0.243, respectively. Through comparison with experimental results, temperature distribution, peak temperature and flame propagation velocity are analyzed and discussed in detail. The numerical calculated temperature profile over the axis of the combustor coincided well with test data in the post-flame zone, however a certain deviation was found in the preheated zone. A two-dimensional flame shape was observed and the flame thickness was the size of cylinder diameter. The peak temperature increased with the gas mixture inlet velocity at the certain equivalence ratio, and its peak value was about 1.8–2.16 times higher than the adiabatic combustion temperature under the desired equivalence ratio, which indicates that super-adiabatic combustion was the case for all the numerical simulations. The flame propagating velocity had a positive correlation with the gas mixture inlet velocity.

Graphical Abstract

1. Introduction

Porous media combustion (PMC) technology has extensively attracted more and more attention as a result of many excellent characteristics such as a higher combustion wave velocity, wider range of power variation, extended flammability limit and lower emission levels of pollutants [1,2,3,4,5,6,7,8,9,10,11,12,13]. The heat transfer mechanism of porous media combustion is to recirculate the thermal energy from the burnt gaseous mixture to the incoming reactants as combustion occurs, which can lead to super-adiabatic combustion. Therefore, many promising applications of PMC have been raised, for example, hydrogen production [14,15], household water heating systems [16], and micro-scale systems [17,18,19,20]. The reviews of development and progress of porous media combustion had been made by many researchers [21,22,23,24,25,26].
Many types of porous media structures have been encountered in the applications mentioned above, including pellets, lamellas, and foam materials. Among them, randomly packed pebble bed is the major type for its low cost and easy utilization, which are widely employed in experimental studies. Zhdanok et al. [1] reported an experimental investigation on the premixed methane–air combustion in a randomly packed bed with alumina pellets of a diameter of 5.6 mm. They found that the flame could stably propagate downstream along the axis direction of the porous burner under various gas flow velocities and air/fuel ratios and the order of magnitude of flame propagation velocity could reach 0.1 mm/s. In addition, under the condition of gas flow velocity of 0.43 m/s, the lean flammability limit was achieved to an equivalence ration of 0.15. Similarly, Hoffmann et al. [12] experimentally investigated the reciprocating flow combustion system of a natural gas–air mixture in a porous burner with ceramic foams of different pore sizes. Results showed that the flammability limit of an equivalence ratio of 0.026 was received. Zheng et al. [27] presented an experimental method to measure the gas and solid phase temperatures simultaneously in the randomly packed bed with alumina pellets of a diameter of 6.2 mm. Results showed that the flame propagated upstream and downstream, and were observed with various gas flow velocity and equivalence ratio. A flame propagation velocity of 0.129 mm/s was obtained at the gas flow inlet velocity of 0.3 m/s and equivalence ratio of 0.2.
Numerical prediction as well as the experimental method is widely applied by many scholars to study the combustion performances in the porous burner. The volume averaged model closed by semi-empirical parameters is used for most of the simulations due to the simplification of the porous medium structure to increase actual computational efficiency. Foutko et al. [2] theoretically used a two-temperature model to investigate super-adiabatic combustion in a packed bed. The flame propagation pattern was derived, and the flame propagation velocity was 1.7 mm/s. Bubnovich et al. [3] obtained an analytical solution for the combustion wave of premixed methane–air in an inert porous media, in which the predictions of the flame temperature, flame propagation velocity, and mass fraction of methane profile were presented in the form of simple algebraic formulas. Shi et al. [5] theoretically and numerically studied the combustion wave characteristics of the filtration combustion in a randomly packed burner. They presented a closed form analytical solution for the flame propagation velocity and the peak flame temperature. Henneke and Ellzey [28] performed a one-dimensional simulation with a complete kinetics mechanism of methane–air according to the experimental works of Zhdanok et al. [1]. Better predictions of combustion wave velocities were found in their research.
The combustion process in the randomly packed beds has been widely researched. However, the structured packed bed has also gained more and more attention due to its excellent merits of lower pressure loss and observability. Yang et al. [29,30] experimentally and numerically studied the heat transfer features in the structured arrangement of particles. They found that the structured packed bed can enhance the overall heat transfer efficiency compared with randomly packed beds, especially in the lower porosity situation. Min and Shin [31] performed experimental research and theoretical analysis on the combustion mechanisms of flame stable propagation in a structured porous media packed bed made of honeycomb ceramics. The stable flame was observed upstream of the burner. Saharaoiu and Kaviany [32] used a direct two-dimensional numerical model to explore the methane–air mixture combustion in the structured arrangements of square cylinders in the porous burners. It was found that the combustion propagation velocity of discrete cylinders by staggered arrangement was larger. Jouybari, Maerefat, and Nimvari [33] investigated the temperature profiles and flame propagation for the cases of turbulent reacting and non-reacting flow with volume-averaged and pore scale models in the staggered square cylinders. Their results showed that both the two methods have a good prediction on the temperature and velocity profiles.
As shown in the above study, the studies on the combustion within the structured packed bed have been mostly focused on the overall performance of the burner. However, studies on the combustion process are relatively rare and some burning details in the burner are not very clear, such as interstitial flame thickness and peak flame temperature. Especially for the latter, it is a meaningful parameter to evaluate the generation of thermal NOx. Therefore, the experimental and numerical studies on the combustion characteristics of a staggered cylinders burner were conducted, and more attention was focused on the flame propagation velocity, peak temperature, and interstitial flame thickness.

2. Experiment

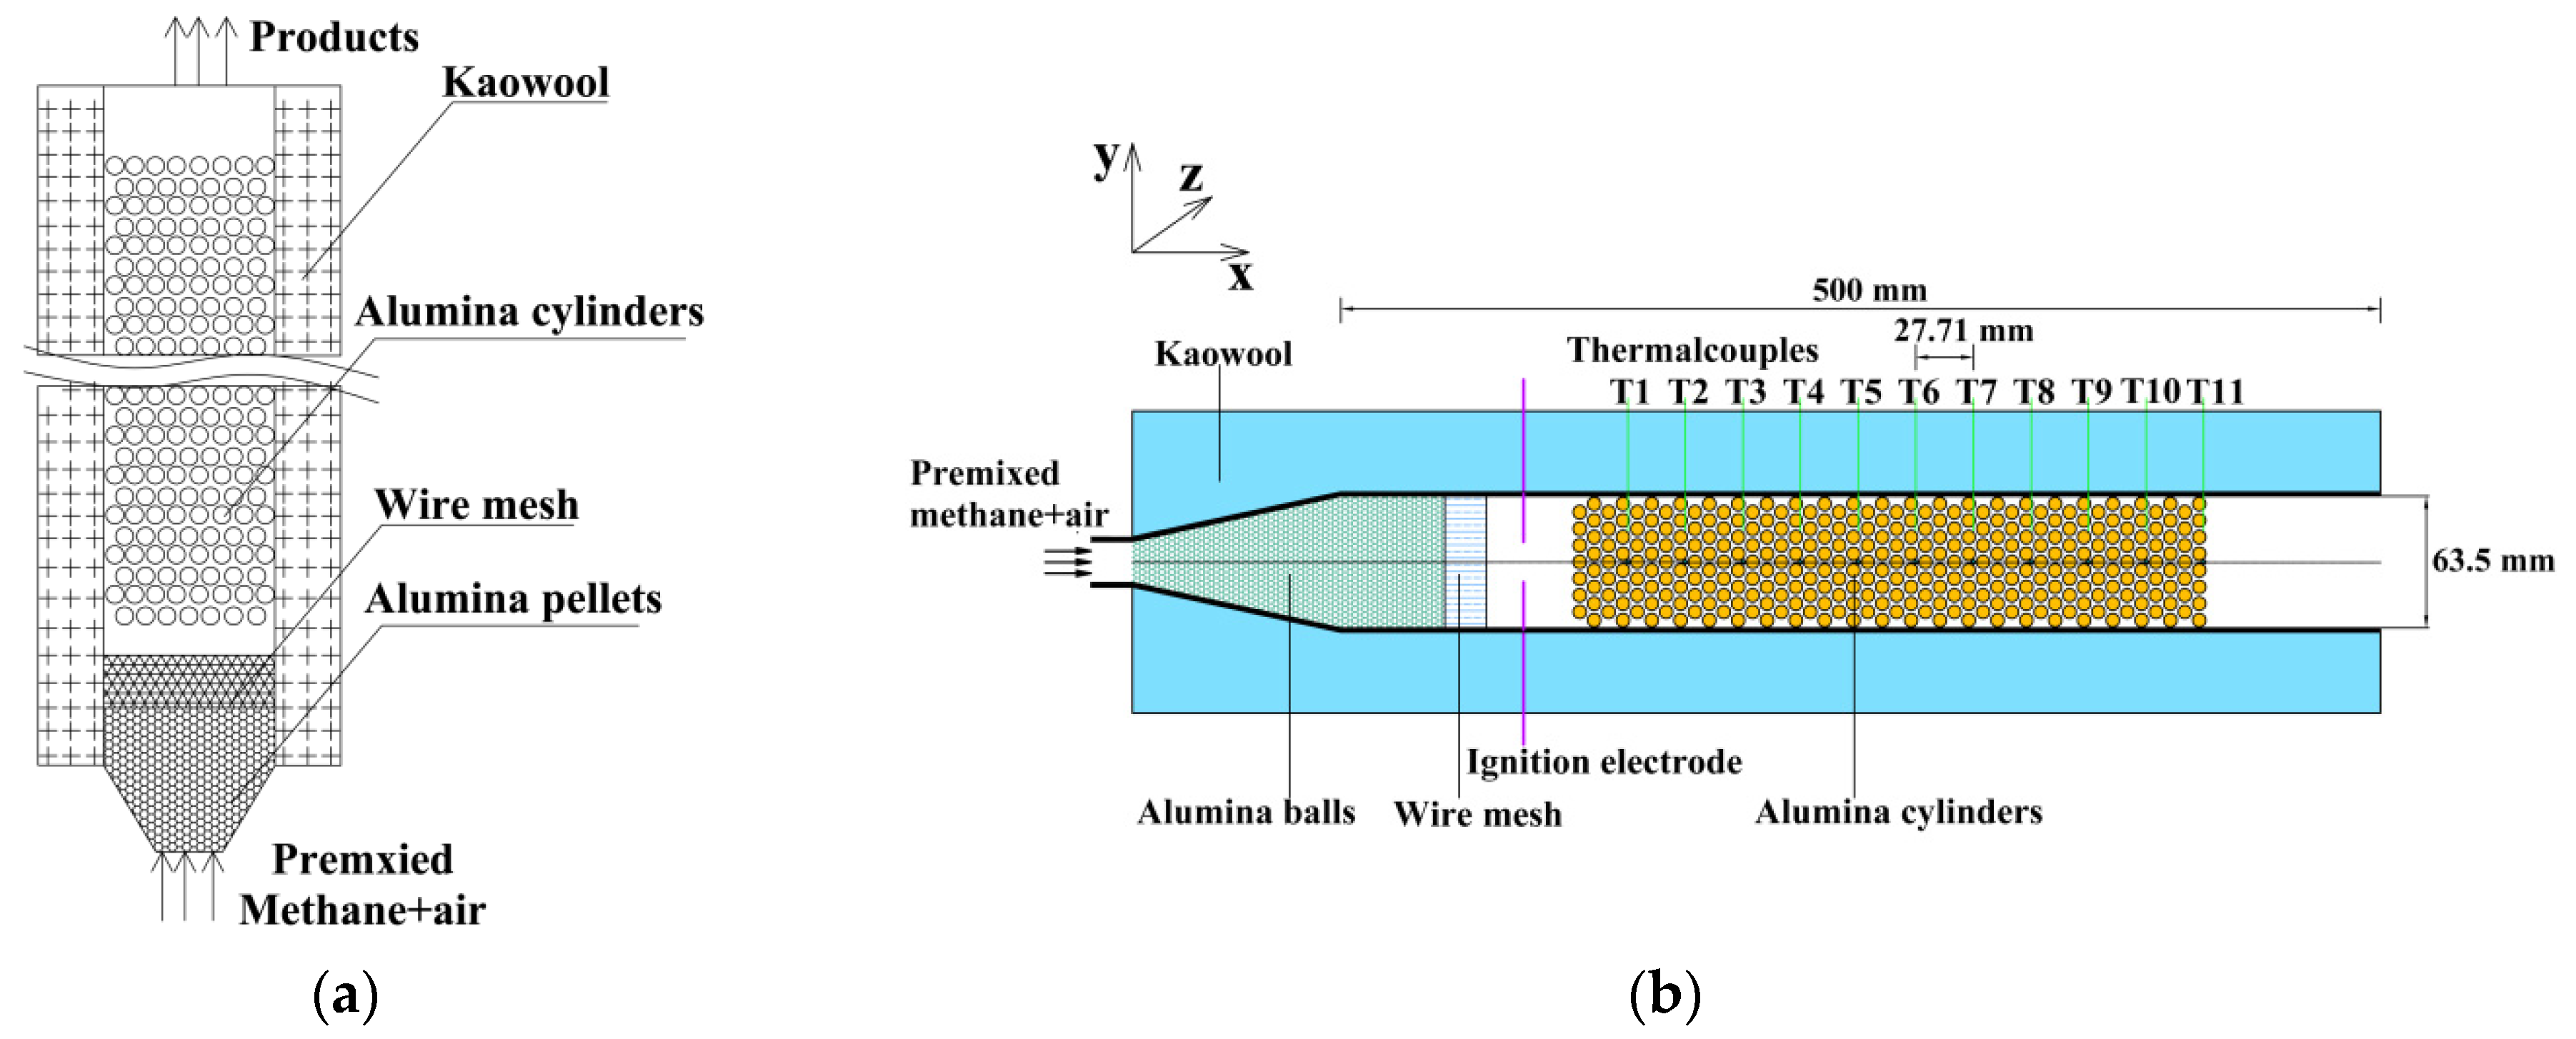
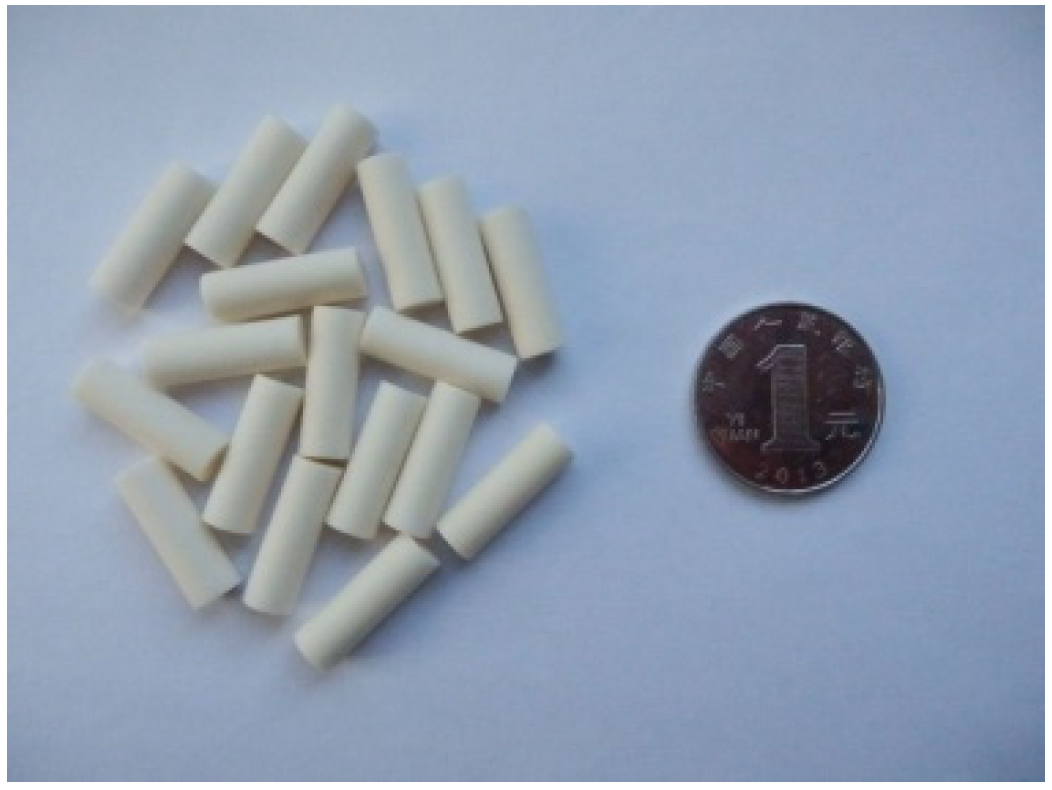
2.1. Experimental Setup

The experimental system is presented in Figure 1; such a system consists of three parts, i.e., a gas supply system, combustor, and experimental data acquisition system. The gas supply system contained air and fuel supply units. The air was furnished by an air compressor, and then entered into the premixed chamber through the gas tank and the oil–gas separator, while the fuel was provided by the methane tank. The flow rates of the methane and the air were regulated and gauged by mass flow controllers (Beijing Sevenstar Electronics Co., Ltd., Beijing, China) with the range of 0–200 L/min for the air and 0–2 L/min for the methane, respectively. By altering the flow rates of the methane and the air, the equivalence ratio under the experimental conditions can be obtained. The equivalence ratio is generally stated as quantitative relationship of fuel/oxidant mixture, which is defined as φ = (A/F)stoic/(A/F).
The body of the burner had a rectangular shaped stainless-steel shell with a length of 500 mm and a width of 63.5 mm, as depicted by Figure 2, in which 330 alumina cylinders were arranged in a staggered formation. For the alumina cylinder (as shown in Figure 3), its diameter was 6.5 mm and the length was 19.5 mm, and it was made of 99.99% experimental-grade alumina and supplied by Shenyang Sunio Chemical Co., Ltd., Shenyang, China. The corresponding porosity of the porous media region was about 0.43 eventually. To measure the temperatures in the burner, eleven K-type thermocouples labeled as T1-T11 were inserted to the bottom part of the burner with an interval of 27.71 mm, whose signals were transferred to a computer via an NI-PXIe-1073 (Shanghai Juxing Instrument Co., Ltd., shanghai, China) data acquisition system. A pair of ignition electrodes were used to ignite the methane–air mixture. The burnt products were collected by a probe placed at the axis 40 mm upstream from the burner exit and measured by way of a gas analyzer (Gasmet DX4000, Helsinki, Finland).

2.2. Experimental Steps

To achieve sufficient preheating for the porous region, lower flow rates were provided for the methane and the air, 1.34 L/min and 19 L/min, respectively. When T1 reached the objective temperature of 1473 K, the flow rates of the methane and the air were adjusted to the test conditions and stop the trials once the peak temperature of T11 was observed. In this procedure, the temperatures were recorded at 5 s intervals. The uncertainty analyses of the temperature, inlet gas mixture velocity and equivalence ratio were conducted through the root-sum-squares approach by Moffat [34]. The uncertainties of the temperature, inlet gas velocity and equivalence ratio were 7.5 °C, 1.6%, and 6.5%, respectively.

3. Mathematical Model

To make a comparison with the experiment, a numerical study was conducted with a two-dimensional packed bed. The length of the burner was 349.99 mm. The porous region was 304.49 mm in length and 63.5 mm in width. To eliminate the effect from the inlet and outlet boundaries, it extended 19.5 mm upstream and 26 mm downstream from the porous region. In order to save computation cost, only half of the burner was selected as the computational domain, as shown in Figure 4.

3.1. Governing Equations

In order to streamline the numerical calculations, some assumptions were made as follows:
(1)
The matrix was considered as opaque and inert homogenous porous media.
(2)
Given the lower gas flow velocities, it was assumed to be laminar for all the cases to be discussed.
(3)
The heat loss by the burner outer walls to the surroundings was neglected.
(4)
Pressure drop in the burner was ignored.
Under these assumptions, all the equations involved are shown as follows:
(1)
Continuity equations:
ρ g t + ( ρ g v ) = 0
where ρg is gas density; t is time, and v is the gas velocity vector.
(2)
Momentum equations:
( ρ g u i ) t + ( ρ g v u i ) = ( μ u i )
where ui is the ith component of velocity vector; μ is dynamic viscosity.
(3)
Species conservation equation:
( ρ g Y i ) t + ( ρ g v Y i ) ( ρ g D i Y i ) ω i W i = 0
where Yi, Di, ωi, Wi are the mass fraction, diffusion coefficient, reaction rate, and the molecular weight of species i, respectively. The reaction of methane is represented by one-step reaction mechanism provided by ANSYS Fluent (version 15.0, ANSYS Inc., Park City, UT, USA). The reaction rate of methane is calculated as
ω CH 4 = A ( ρ g Y CH 4 / W CH 4 ) 0.2 ( ρ g Y O 2 / W O 2 ) 1.3 exp ( E / R T g )
where A is pre-exponential factor and the value is used to 2.119 × 10¹¹ m1.5/(kmol0.5⋅s); E is activation energy and its value is 2.027 × 10⁸ J/(kmol); R is the universal gas constant.
(4)
Gas phase energy equation
( ρ g c g T g ) t + ( ρ g c g v T g ) = ( λ g T g ) ω i W i Q
where Tg, cg, λg are the gas mixture temperature, special heat, and thermal conductivity, respectively. Q is the heat content of the premixed mixture.
(5)
Solid phase energy equation
( ρ s c s T s ) t + ( λ s T s ) = 0
where ρs, Ts, cs, λs are the solid density, temperature, special heat, and thermal conductivity, respectively.
(6)
Ideal gas state equation
p = ρ g R T g
where p is the pressure.

3.2. Boundary Conditions

The boundary conditions were adopted in the numerical simulations.
Gas temperature, velocities, and species mass fraction were set at the inlet zone of the burner:
T g = 300 K ,   u = u 0 ,   v = v 0 ,   Y CH 4 = Y CH 4 , i n ,   Y O 2 = Y O 2 , i n
The outflow boundary condition was selected at the outlet:
T g x = ( Y CH 4 ) x = ( Y O 2 ) x = 0
At the interface of the burner walls and gas–solid interfaces, we used the no slip boundary condition for velocity. The outer wall of the burner was set up to the adiabatic condition. The solid radiative heat transfer between alumina cylinders was considered as the discrete ordinate model.

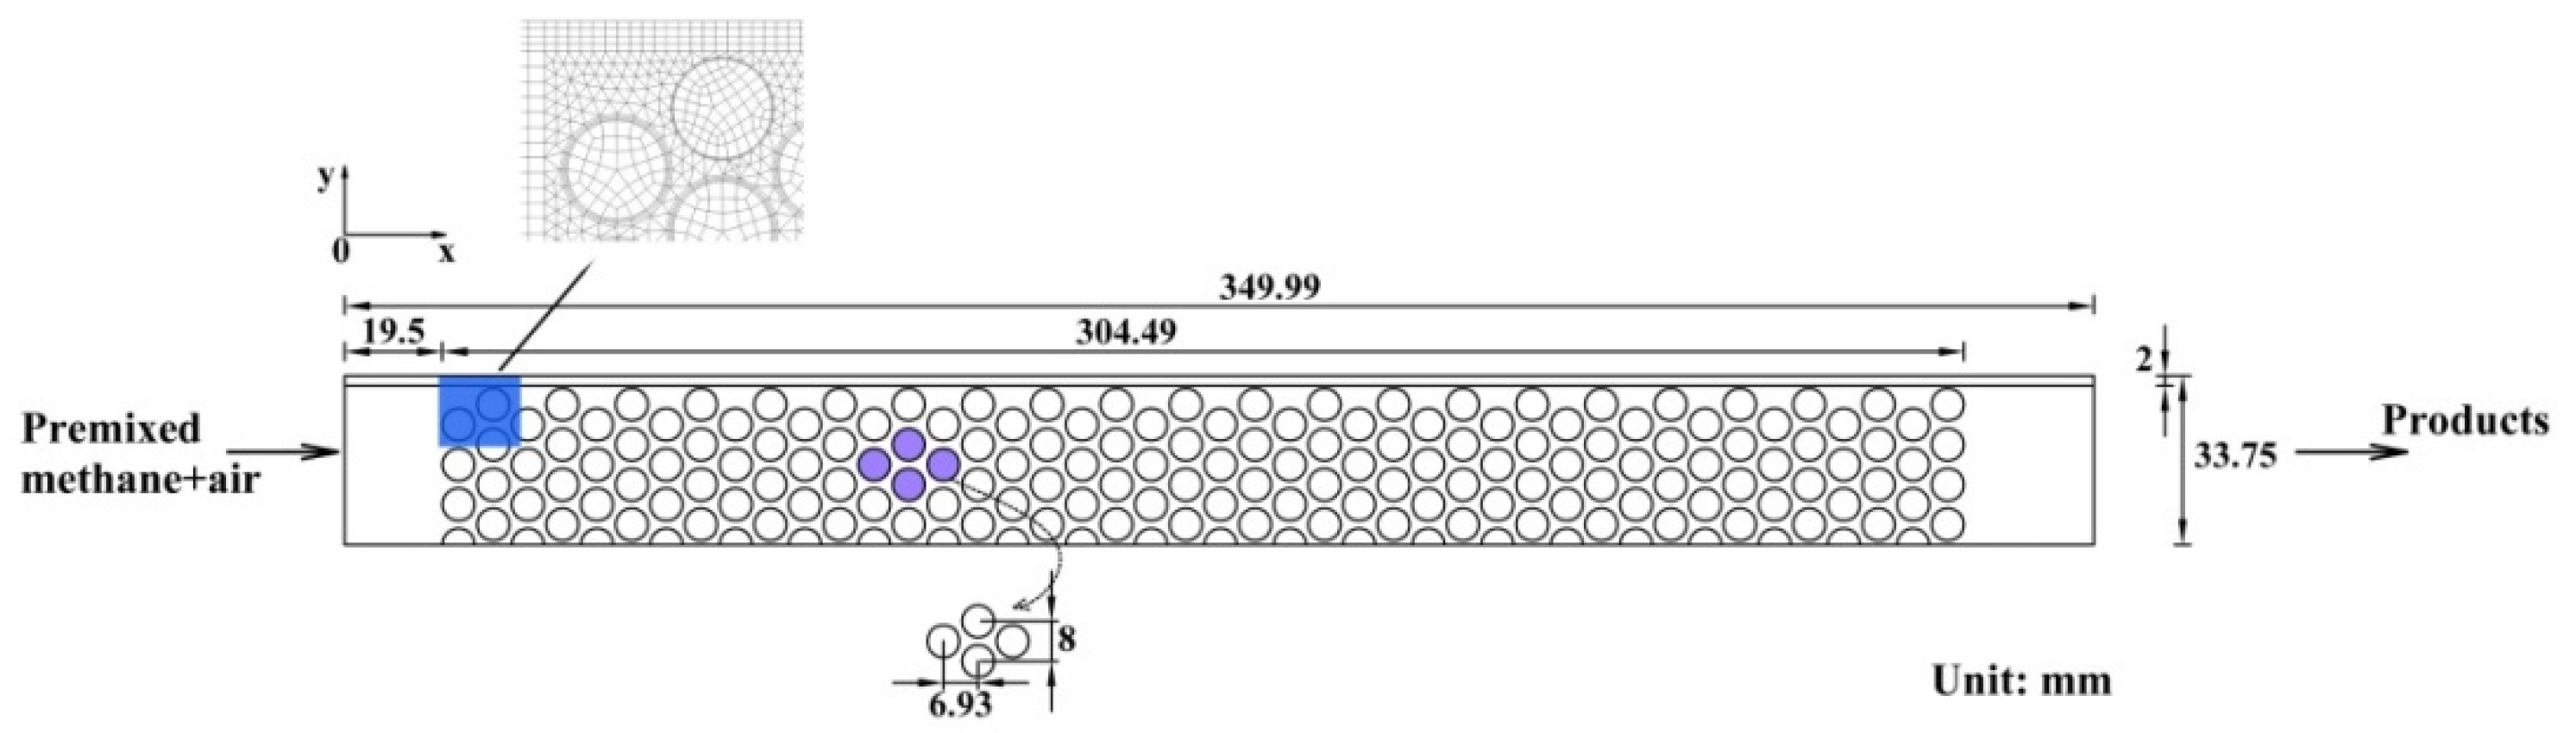
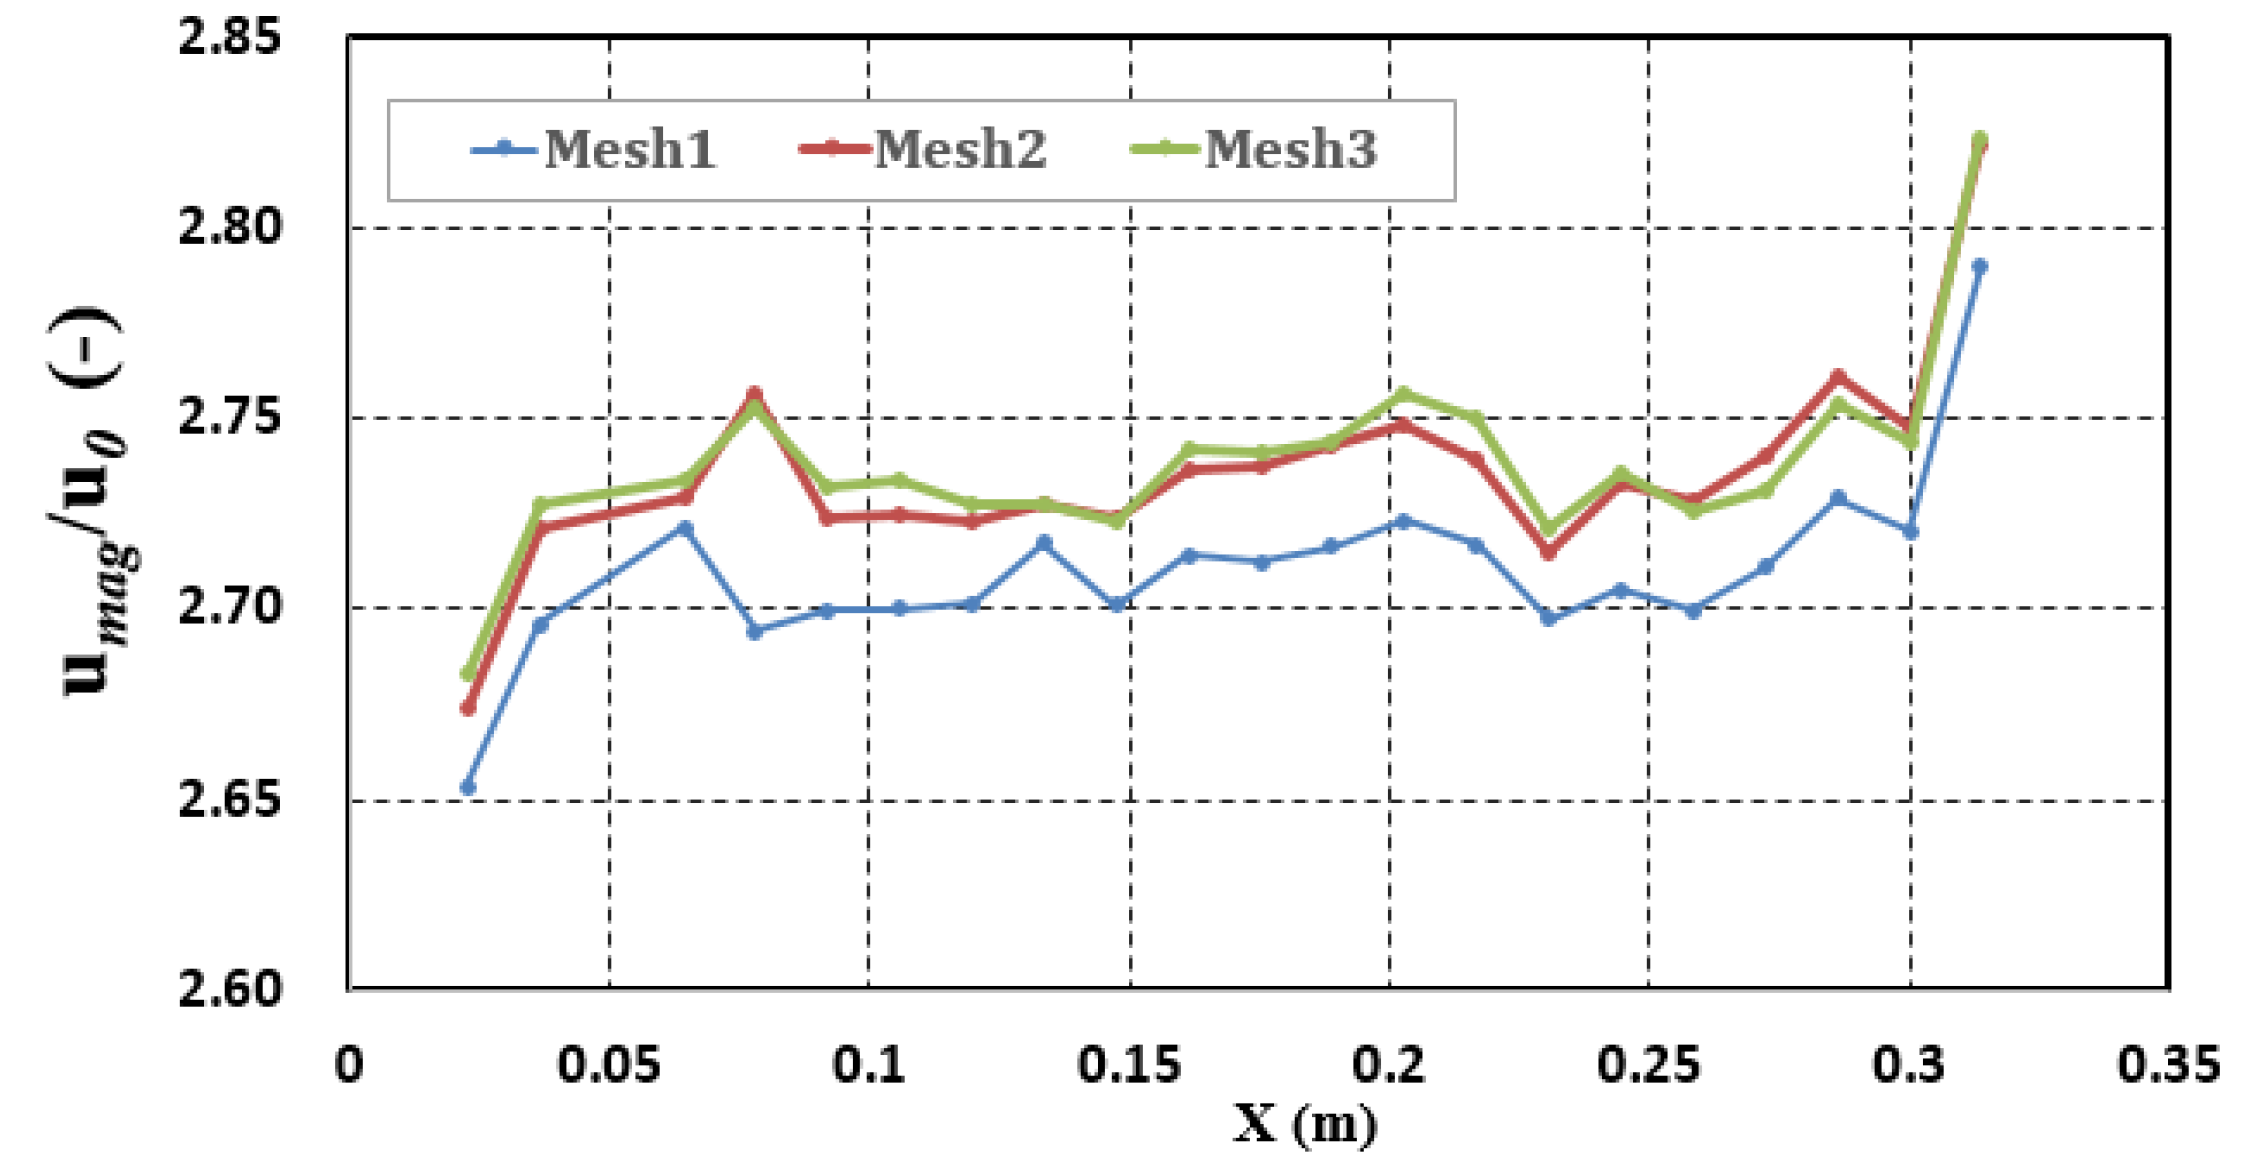
3.3. Computation Scheme

The numerical simulation was conducted with the CFD software package ANSYS 15.0. Two computational domains with the solid phase and the fluid phase were created by Gambit software. The solid phase domain was made of alumina cylinders and the fluid phase domain was composed of the gas mixture. At the inlet and outlet zones, the structure meshes were used. A structured grid was used in the outer wall region of combustion. Within the porous media domain, unstructured meshes were exploited and the local refinements at the interface between the gas mixture and alumina cylinder were made by the boundary layers to advance the calculation accuracy.
To perform a grid-independence check, three meshes with different resolutions in the interstitials were presented, i.e., Mesh 1, Mesh 2, and Mesh 3. The minimum cell volume and cell total numbers are listed in Table 1. A pure flow (no reaction) with inlet gas mixture velocity of 0.86 m/s was considered, and the comparison of velocity profiles at some specific points for different mesh is depicted in Figure 5. From the simulated results, one can see that the discrepancy between Mesh 2 and Mesh 3 was very fine, and the maximum relative error was about 0.36; this indicates that the mesh independency was achieved. Finally, a non-uniform grid generation system with 27,780 cells was employed in the following numerical computation. The mesh quality was evaluated by the EquiSize Skew. In our simulations, this value was in the range of 0.1 to 0.5. In particular, the cells with EquiSize Skew values less than 0.2 accounted for 85%, and the remainder were still required to be less than 0.5, which were concentrated in the narrow gaps between cylinders and the outer wall of the burner.
The pressure and velocity coupling in this work employed the SIMPLE numerical algorithm. The residual of the energy equations was set to 10−6, while the other numerical equations were taken as 10−3. To model the ignition process exactly, the initial solid temperature profiles were set to be the same as those in the experimental work. The numerical cases are presented in Table 2.

4. Results and Analysis

4.1. Flame Temperature Distributions

The validation of the two-dimension pore lever combustion model needed to be confirmed, therefore the predicted temperatures along the axis in the bottom of the burner were compared with the experimental data. The temperature profiles by numerical simulation and experimental data are presented in Figure 6 for the equivalence ratio of φ = 0.162 and gas mixture inlet velocity of u0 = 0.86 m/s. The predicted temperatures were selected by the gas and solid phases along the centerline of the porous burner. The profile of the predicted temperature was continuous but not smooth, due to the two-dimensional numerical simulation and the thermal non-equilibrium in the interface between the premixed gas and the alumina cylinders. The peak temperature in the numerical simulation held at 1520 K, about 103 K larger than that in the experiment. The temperature difference between the simulation and the experiment became smaller until the position of the temperature was located at around 128.9 mm. The predicted temperature was larger than that of the experiment at the downstream zone. Overall, the predicted temperature trend had a good agreement with that of the experimental data.
The main reason of discrepancy between the predicted and experimental temperature is that the global methane oxidation kinetics mechanism was used in this study. Hus and Matthews [35] suggested that the multistep kinetics mechanism has an important influence on the temperature. However, in this work it was still not feasible to perform the multistep kinetics mechanism because of restrictions by the computational conditions. The heat loss from the outer wall of the combustor in the experiment was not considered in the simulation, which may also have attributed to the discrepancy between the predicted results and experimental data.

4.2. Species Fractions and Reaction Rate

Figure 7 shows the mass fractions of methane, YCH4 and carbon dioxide, YCO2, along with chemical reaction rate of methane, ωCH4, in the porous combustor for the equivalence ratio φ = 0.162 and gas mixture inlet velocity u0 = 0.43 m/s at 656 s.
It is noted that the distributions of YCH4, YCO2, and ωCH4 represent the similar sharp peak at the chemical reaction zone, which was located in the range of 130–136 mm. Their structures show highly two-dimensional characteristics. Major changes of YCH4, YCO2, and ωCH4 between the cylinders at the chemical reaction zone are observed. The chemical reaction zone is not uniform over cylinders and the flame thickness is about one-cylinder in diameter.

4.3. Effect of u0 on the Peak Flame Temperature

Figure 8 presents the peak temperature during the flame propagation under various equivalence ratios and inlet velocities. The peak flame temperature is the parameter that reflects the combustion characteristics of PMC. The magnitude of the peak was in the range of 1500–1800 K. The peak flame temperature had a positive correlation with the equivalence ratio. With the same equivalence ratio, the peak temperature increased with gas mixture inlet velocity. As the gas mixture inlet velocity increased from 0.43 m/s to 0.645 m/s at the situation of ϕ = 0.162, the increment of the peak flame temperature was 59 K. The results indicate that at a smaller equivalence ratio, a bigger gas mixture inlet velocity leads to the lower increment of the maximum flame temperature. At the certain equivalence ratio, the increment of the maximum temperature is 157 K, 168 K and 177 K at inlet velocities of 0.43 m/s, 0.645 m/s and 0.86 m/s, respectively. With the increases in equivalence ratio and gas mixture inlet velocity, more fuel can be supplied, which induces more intensive burning of the gas mixture in the porous combustor. The greater energy released by combustion increases the peak flame temperature.
The calculated adiabatic combustion temperatures of the CH4–air mixture at the equivalence ratio of 0.162 and 0.243 were 737 K and 934 K, respectively. However, the peak temperature was 2.16 times larger than the adiabatic combustion temperature under the condition of φ = 0.162 and u0 = 0.86 m/s, due to the existence of a porous matrix. All the numerical results were higher than the flame adiabatic temperature at the same equivalence. This indicates that the combustions were super-adiabatic under all the test conditions.

4.4. Effect of u0 on the Flame Propagation Velocity

Figure 9 presents the influence of gas mixture inlet velocity on the flame propagation velocity for experimental data, and the numerical results. The flame propagation velocity is computed by dividing of the length of the porous media zone by the propagating time through the porous media zone. It was found that the magnitudes of the flame propagation velocity by experiment and simulation are the order of 0.1 mm/s, which belongs to the range of low-velocity filtration combustion by Babkin et al. [36]. They reported that the classification of filtration combustion is based on the combustion mechanism, which is the heat exchange between the gas mixture and the solid matrix. With the increases in gas mixture inlet velocity, the flame propagation velocity increases at the same equivalence ratio. At a certain equivalence ratio, more combustion heat released by the gas mixture in unit time can be generated with increasing the gas mixture inlet velocity, resulting in a higher flame propagation velocity.
The flame propagation velocities in simulation agreed well with the experimental results. The flame propagation velocity in the simulation was 0.145 mm/s at φ = 0.162 and u0= 0.43 m/s, under the same condition which was 0.173 mm/s for the experiment. The relative error of the flame propagation velocity was less than 16% for φ = 0.162 and different inlet velocities. The peak relative error of the flame propagation velocity under the equivalence ratio of 0.243 was 14%. As expected, the flame propagation velocities by the simulation showed high quality representations of those in the experiment.

5. Conclusions

Numerical and experimental flame propagations of a methane–air mixture in a staggered arrangement porous burner were performed with inlet velocities of u0 = 0.43–0.86 m/s and equivalence ratios of φ = 0.162, 0.243. The temperature distributions for the numerical result were compared with those by experimental data. The maximum temperature and flame propagation velocity by simulation under various situations were investigated and analyzed. The results below were found:
(1)
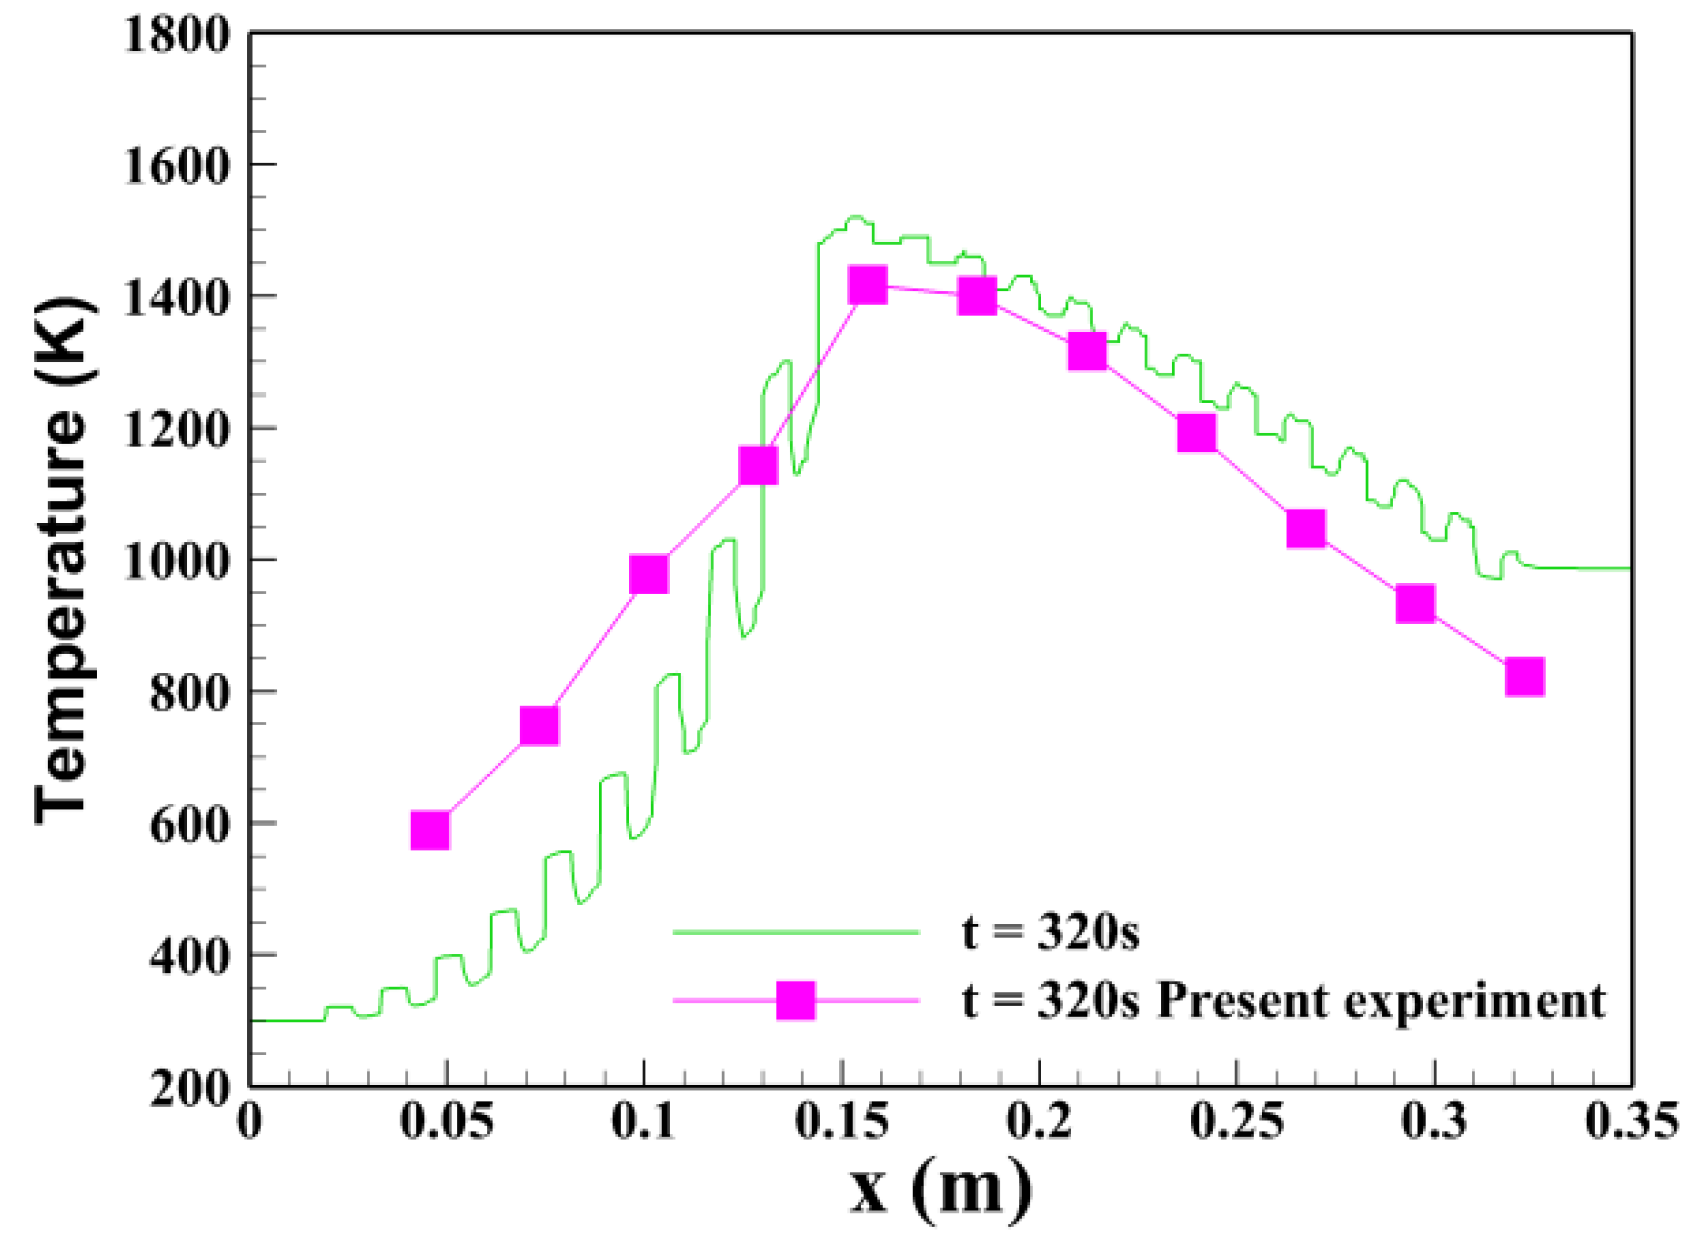
At φ = 0.162 and u0 = 0.86 m/s, the trends of the temperature distributions towards the centerline of the burner between the simulation and experiment were similar. The peak temperature by numerical calculation was maintained at 1520 K, about 103 K greater than that by the experiment. The main reason of discrepancy between the predicted and experimental temperatures was that the global methane oxidation kinetics mechanism was used in the two-dimensional pore level simulation model.
(2)
The high temperature zone was located at the range of 130–140 mm, and the peak temperature was 1526 K at φ = 0.162 and u0 = 0.43 m/s. The flame thickness can be regards as the length of cylinder diameter under the test condition.
(3)
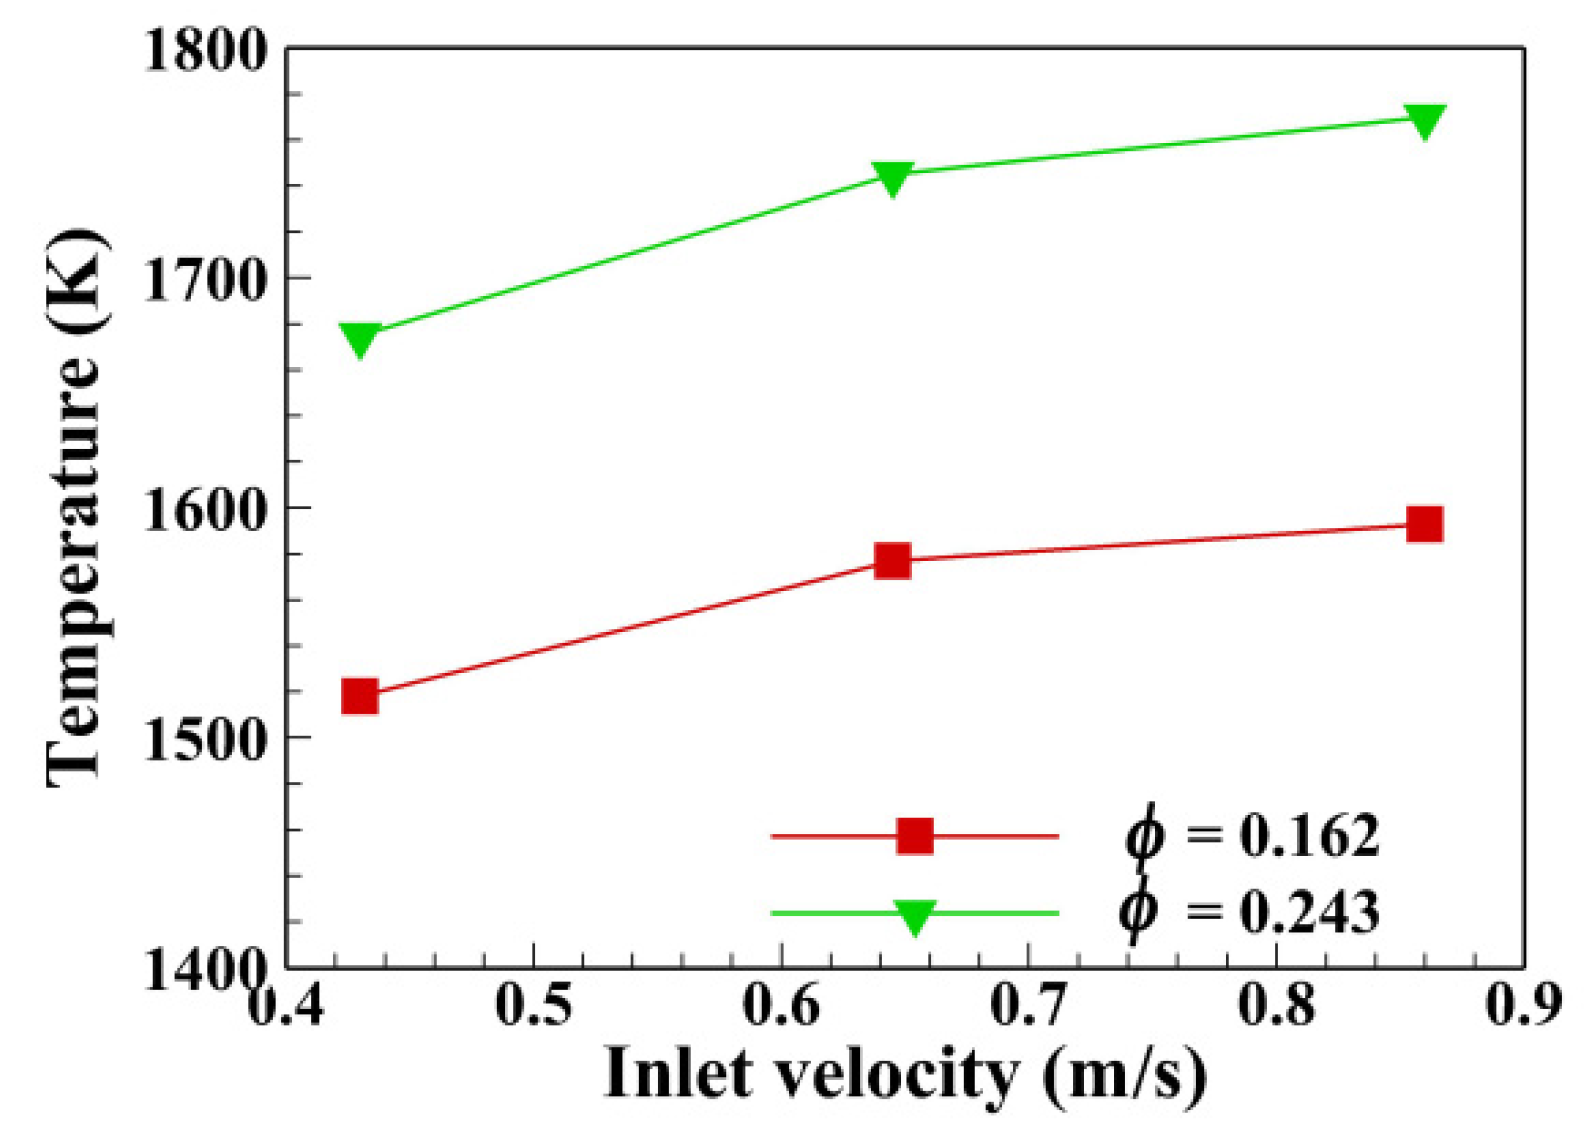
The peak temperatures along the flame propagation under various equivalence ratios and inlet velocities increased with inlet velocity at the same equivalence ratio. The magnitudes of the maximum temperature were greater than adiabatic temperature at the corresponding test conditions. It was demonstrated that all the test conditions were under the situation of the sub-adiabatic combustion. The maximum temperature was 2.16 times higher than the flame adiabatic temperature at φ = 0.162 and u0 = 0.86 m/s.
(4)
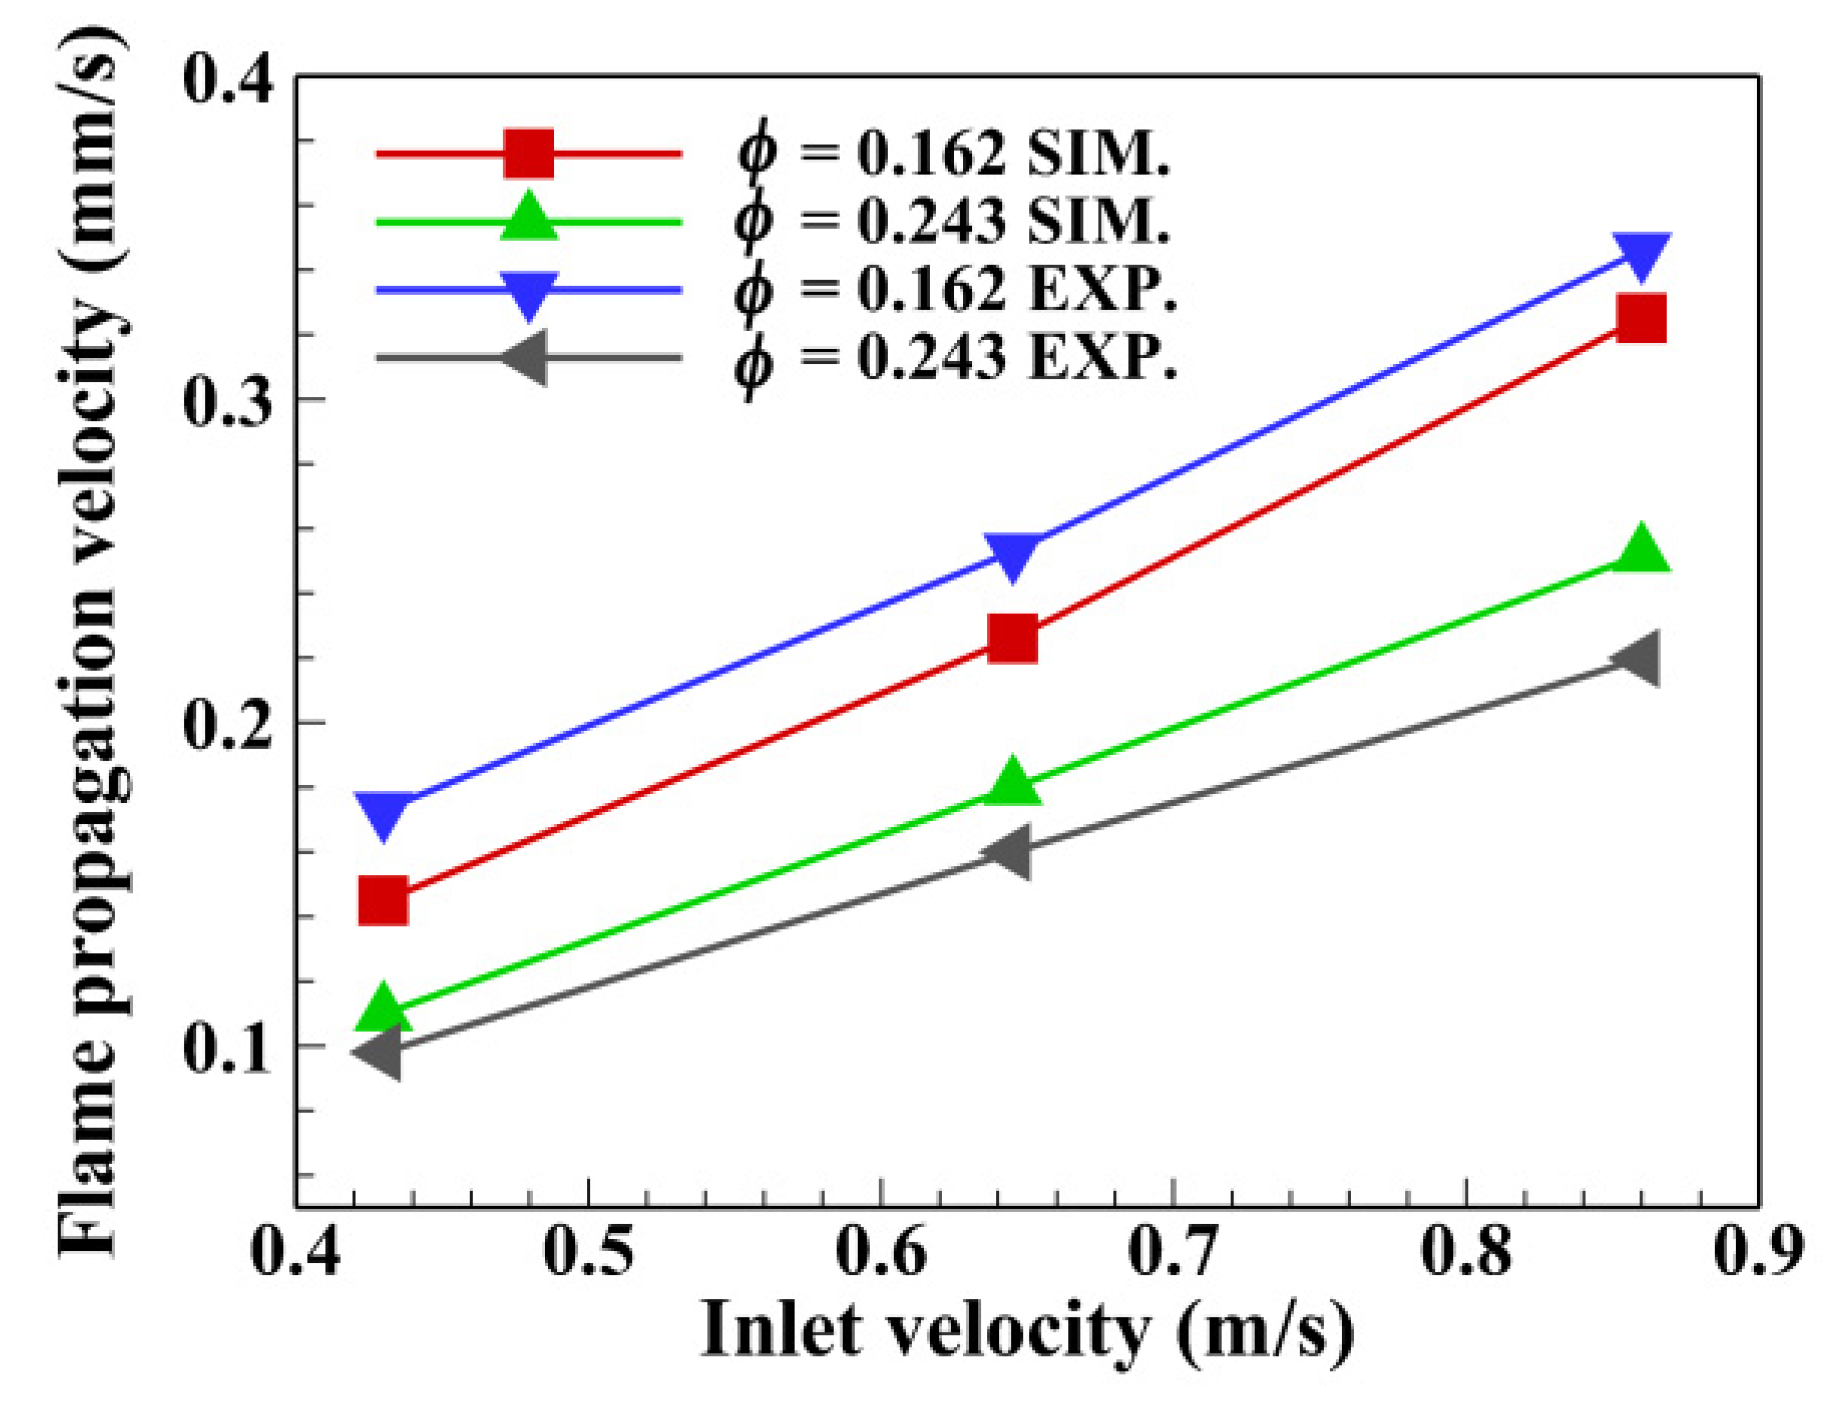
The flame propagation velocity had a positive relationship with the inlet velocity under the same equivalence ratio. The magnitude of the flame propagation velocity was in the order of 0.1 mm/s, which was typical low-velocity filtration combustion reported by Babkin et al. [36]. The predictions of flame propagation velocities were in good agreement with the experimental data. The peak relative error of flame propagation velocity between the numerical and experimental results was 16% at ϕ = 0.162 and u0 = 0.43 m/s.

Author Contributions

All of the authors contributed to publishing this paper. M.-Z.X. and J.-R.S. conceived and devised the experiments. M.Y. performed the experiments and wrote the paper. H.-S.L., Z.-S.C. and Y.-C.C. prepared the experiments and performed the experimental data analysis. All authors have read and agreed to the published version of the manuscript.

Funding

This work was supported by National Natural Science Foundation of China, grant numbers 51376029, 51476105, 51576029 and 51706033.

Conflicts of Interest

The authors declare no conflict of interest.

Nomenclature

c special heat (kJ/kg·K)
l length of the burner (m)
w width of the burner (m)
d diameter of cylinder (m)
p pressure (Pa)
t time (s)
T temperature (K)
u velocity (m/s)
u 0 vertical velocity (m/s)
u mag magnitude of local velocity (m/s)
v velocity vector of gas mixture (m/s)
W molecular weight of species (kg/kmol)
x vertical coordinate axis (m)
y horizontal coordinate axis (m)
z transversal coordinate aixs (m)
Greek Symbols
ε porosity
z transversal coordinate axis (m)
ρ density (kg/m3)
λ thermal conductivity (W/m·K)
μ dynamic viscosity (Pa·s)
ω reaction rate (kmol/m3·s)
φ equivalence ratio
Subscripts
g gas phase
s solid phase
i n inlet zone of burner
o u t outlet zone of burner
i species in the gas mixture

References

  1. Zhdanok, S.; Kennedy, L.A.; Kosster, G. Superadiabatic combustion of methane air mixture under filtration in packed bed. Combust. Flame 1995, 100, 221–231. [Google Scholar] [CrossRef]
  2. Foutko, S.I.; Shabunya, S.I.; Zhdanok, S.A.; Kennedy, L.A. Superadiabatic combustion wave in a diluted methane-air mixture under filtration in a packed bed. Symp. Combust. 1996, 26, 3377–3382. [Google Scholar] [CrossRef]
  3. Bubnovich, V.I.; Zhdanok, S.A.; Dobrego, K.V. Analytical study of the combustion waves propagation under filtration of methane-air mixture in a packed bed. Int. J. Heat Mass Transfer 2006, 49, 2578. [Google Scholar] [CrossRef]
  4. Zhang, G.; Cai, X.; Liu, M. Characteristic analysis of low-velocity gas flirtation combustion in an inert packed bed. Combust. Theory Model. 2006, 10, 683–700. [Google Scholar] [CrossRef]
  5. Shi, J.R.; Xie, M.Z.; Liu, H.; Li, G.; Zhou, L. Numerical simulation and theoretical analysis of low-velocity filtration combustion of lean mixture. Int. J. Heat Mass Transfer 2008, 51, 1818–1829. [Google Scholar] [CrossRef]
  6. Mital, R.; Gore, J.P.; Viskanta, R. A study of the structure of submerged reaction zone in porous ceramic radiant burners. Combust. Flame 1997, 111, 175–184. [Google Scholar] [CrossRef]
  7. Barra, A.J.; Diepvens, G.; Ellzey, J.L.; Henneke, M.R. Numerical study of the effects of material properties on flame stabilization in porous burner. Combust. Flame 2003, 134, 369–379. [Google Scholar] [CrossRef]
  8. Liu, H.; Dong, S.; Li, B.W.; Chen, H.G. Parametric investigations of premixed methane-air combustion in two-section porous media by numerical simulation. Fuel 2010, 8, 1736–1742. [Google Scholar] [CrossRef]
  9. Gao, H.B.; Qu, Z.G.; He, Y.L.; Tao, W.Q. Methane/air premixed combustion in a two-layor porous media burner with different foam materials. Fuel 2014, 115, 154–161. [Google Scholar] [CrossRef]
  10. Liu, Y.; Fan, A.W.; Yao, H.; Liu, W. Numerical investigation of filtration gas combustion in a mesoscale combustor filled with inert fibrous porous media. Int. J. Heat Mass Transfer 2015, 91, 18–26. [Google Scholar] [CrossRef]
  11. Li, J.; Wang, Y.T.; Chen, J.X.; Shi, J.R.; Liu, X.L. Experimental study on standing wave regimes of premixed H2-air combustion in planar micro-combustors partially filled with porous media. Fuel 2016, 167, 98–105. [Google Scholar] [CrossRef]
  12. Hoffmann, J.G.; Echigo, R.; Yoshida, H.; Tada, S. Experimental study on combustion in porous media with a reciprocating flow system. Combust. Flame 1997, 111, 32–46. [Google Scholar] [CrossRef]
  13. Keramiotis, C.; Stelzner, B.; Trimis, D.; Founti, M. Porous burners for low emission combustion: An experimental investigation. Energy 2012, 45, 213–219. [Google Scholar] [CrossRef]
  14. Toledo, M.; Bubnoich, V.; Saveliev, A.; Kennedy, L. Hydrogen production in ultrarich combustion of hydrocarbon fuels in porous media. Int. J. Hydrogen Energy 2009, 34, 1818–1827. [Google Scholar] [CrossRef]
  15. Dhamrat, R.S.; Ellzey, J.L. Numerical and experimental study of the conversion of methane to hydrogen in a porous media reactor. Combust. Flame 2006, 144, 698–709. [Google Scholar] [CrossRef]
  16. Trimis, D.; Durst, F. Combustion in a porous medium-advances and applications. Combust. Sci. Technol. 1996, 121, 153–168. [Google Scholar] [CrossRef]
  17. Chou, S.K.; Yang, W.M.; Li, J.; Li, Z.W. Porous media combustion for micro thermophotovoltaic system applications. Appl. Energy 2010, 87, 2862–2867. [Google Scholar] [CrossRef]
  18. Liu, Y.; Ning, D.G.; Fan, A.W.; Yao, H. Experimental and numerical investigations on flame stability of methane/air mixtures in mesoscale combustors filled with fibrous porous media. Energy Convers. Manag. 2016, 123, 402–409. [Google Scholar] [CrossRef]
  19. Bani, S.; Pan, J.F.; Tang, A.; Lu, Q.; Zhang, Y. Micro combustion in a porous media for thermophotovoltaic power generation. Appl. Therm. Eng. 2018, 129, 596–605. [Google Scholar] [CrossRef]
  20. Kang, X.; Deng, Y.C.; Fan, A.W. Impact of wall thermal properties on flame stability of small-scale combustors. J. Combust. Sci. Technol. 2019, 25, 11–15. [Google Scholar]
  21. Howell, J.R.; Hall, M.J.; Ellzey, J.L. Combustion of hydrocarbon fuels within porous inert media. Prog. Energy Combust. Sci. 1996, 127, 121–145. [Google Scholar] [CrossRef]
  22. Kamal, M.M.; Mohamad, A.A. Combustion in porous media. Proc. Inst. Mech. Eng. Part A 2006, 220, 487–508. [Google Scholar] [CrossRef]
  23. Mujeebu, M.A.; Abdullah, M.Z.; AbuBakar, M.Z.; Mohamad, A.A.; Abdullah, M.K. Applications of porous media combustion technology—A review. Appl. Energy 2009, 86, 1365–1375. [Google Scholar] [CrossRef]
  24. Mujeebu, M.A.; Abdullah, M.Z.; Mohamad, A.A.; AbuBakar, M.Z. Trends in modeling of porous media combustion. Prog. Energy Combust. Sci. 2010, 36, 627–650. [Google Scholar] [CrossRef]
  25. Mujeebu, M.A. Hydrogen and syngas production by superadiabatic combustion—A review. Appl. Energy 2016, 173, 210–224. [Google Scholar] [CrossRef]
  26. Wood, S.; Harris, A.T. Porous burners for lean-burn applications. Prog. Energy Combust. Sci. 2008, 34, 667–684. [Google Scholar] [CrossRef]
  27. Zheng, C.H.; Cheng, L.M.; Saveliev, A.; Luo, Z.Y.; Cen, K.F. Gas and solid phase temperatures measurements of porous media combustion. Proc. Combust. Inst. 2011, 33, 3301–3308. [Google Scholar] [CrossRef]
  28. Henneke, M.R.; Ellzey, J.L. Modeling of filtration combustion in a packed bed. Combust. Flame 1991, 117, 832–840. [Google Scholar] [CrossRef]
  29. Yang, J.; Wang, Q.W.; Zeng, M.; Nakayama, A. Computational study of forced convective heat transfer in structured packed beds with spherical or ellipsoidal particles. Chem. Eng. Sci. 2010, 65, 726–738. [Google Scholar] [CrossRef]
  30. Yang, J.; Wang, J.; Bu, S.S.; Zeng, M.; Wang, Q.W.; Nakayama, A. Experimental analysis of forced convective heat transfer in novel structured packed beds of particles. Chem. Eng. Sci. 2012, 71, 126–137. [Google Scholar] [CrossRef]
  31. Min, D.K.; Shin, H.D. Laminar premixed flame stabilized inside a honeycomb ceramic. Int. J. Heat Mass Transfer 1991, 34, 341–356. [Google Scholar]
  32. Sahraoui, M.; Kaviany, M. Direct simulation vs volume-averaged treatment of adiabatic, premixed flame in a porous medium. Int. J. Heat Mass Transfer 1994, 37, 2817–2834. [Google Scholar] [CrossRef] [Green Version]
  33. Jouybari, N.F.; Maerefat, M.; Nimvari, M.E. Pore scale simulation vs volume averaged treatment of turbulent reacting and nonreacting flow in a porous medium. J. Porous Media 2014, 17, 103–116. [Google Scholar] [CrossRef]
  34. Moffat, R.J. Describing the uncertainties in experimental results. Exp. Therm. Fluid Sci. 1988, 1, 3–17. [Google Scholar] [CrossRef] [Green Version]
  35. Hsu, P.F.; Matthews, R.D. The necessity of using detailed kinetics in models for premixed combustion within porous media. Combust. Flame 1993, 93, 457–466. [Google Scholar] [CrossRef]
  36. Babkin, V.S.; Korzhavin, A.A.; Bunev, V.A. Propagation of premixed gaseous explosion flames in porous media. Combust. Flame 1991, 87, 182–190. [Google Scholar] [CrossRef]
Figure 1. Diagram of experimental system. (1. Air compressor; 2. Gas tank; 3. Oil–gas separator; 4. Methane tank; 5. Mass flow controllers; 6. Premixed chamber; 7. Combustor; 8. Thermocouples; 9. NI-apparatus; 10. Computer; 11. Portable sample system; 12. Gasmet DX4000 gas analyzer; 13. Laptop computer; 14. Relief valve; 15. Pressure gauge for methane; 16. Check valve; 17. Pressure gauge for air; 18. Safety valve).
Energies 13 06397 g001
Figure 2. The setup of the burner. (a) The schematic diagram of the burner; (b) The arrangement of the alumina cylinder.
Energies 13 06397 g002
Figure 3. Alumina cylinders (a dime of RMB used for scale).
Energies 13 06397 g003
Figure 4. Computational domain and meshes.
Energies 13 06397 g004
Figure 5. Comparison of velocity profiles for different meshes.
Energies 13 06397 g005
Figure 6. Comparison of temperature profiles by numerical prediction and experimental result.
Energies 13 06397 g006
Figure 7. Mass fractions of methane and carbon dioxide and chemical reaction rate of methane with φ = 0.162, u0 = 0.43 m/s at t = 656 s.
Energies 13 06397 g007
Figure 8. Effect of gas mixture inlet velocity on the peak flame temperature.
Energies 13 06397 g008
Figure 9. Effect of gas mixture inlet velocity on the flame propagation velocity.
Energies 13 06397 g009
Table 1. The minimum cell volume and cell total number.
Mesh PropertiesMesh 1Mesh 2Mesh 3
Minimum Cell Volume3.98 × 10−89.62 × 10−92.34 × 10−9
Cell total number27,80037,45161,394
Table 2. Numerical cases.
Equivalence ratio φ (-)0.243, 0.324
Inlet velocity u0 (m/s)0.43, 0.645, 0.86
Publisher’s Note: MDPI stays neutral with regard to jurisdictional claims in published maps and institutional affiliations.

