Abstract
We experimentally explored the modulation of various forward- and backward-facing topographic steps on the wake and power output of a wind turbine model. The sharp surface changes located in the vicinity of the turbine tower consisted of steps , −0.42, −0.21, 0, 0.21, and 0.42, where is the level difference between the upwind and downwind sides of the step and is the turbine diameter. Particle image velocimetry was used to obtain the wake statistics in the wake within the streamwise distance 5] and vertical span 0.7], where the origin is set at the rotor hub. Complementary single-point hotwire measurements were obtained in the wake along the rotor axis every within 8]. Mean power output and its fluctuations were obtained for each of the six scenarios. The results indicate strong modulation of the steps in the wake statistics and some effect on the power output. Remarkably, the backward-facing steps induced a larger velocity deficit in the wake with respect to the base case with substantial wake deflection. In contrast, the forward-facing steps exhibited a much lower velocity deficit and negligible wake deflection. The mean flow and velocity gradients’ changes promoted distinct turbulence dynamics and, consequently, associated levels. In particular, turbulence intensity and kinematic Reynolds shear stress were enhanced and reduced with the backward- and forward-facing steps, respectively. It is worth pointing out the particular effect of the steps on the transport of the turbulence kinetic energy . Ejections were predominant around the top tip, whereas sweeps dominated around the turbine hub height. The magnitude of these quantities was sensitive to the step height. In particular, a much weaker sweep occurred in the forward-facing steps; in addition, the flat terrain and the backward-facing step cases shared strong sweeps.
1. Introduction
Wind energy is playing a central role in the renewable energy portfolio worldwide. The power production of single turbines and wind farms is modulated by the incoming wind speeds, topography, and atmospheric conditions, among other factors [1]. Due to the limited availability of flat terrains for large-scale wind energy development, substantial research is being placed on understanding the distinct modulation of complex landscapes in various wind-power phenomena [2,3]. Terrain may induce particular dynamics on the incoming flow and wake of a turbine and may significantly alter the turbulent exchange in wind farms. As a result, the estimation of wind turbine performance, fatigue loads, and wind farms’ optimum operation is more challenging.
Comparatively, a few studies have explored the effect of terrain and topography on wakes (e.g., [4,5]). Numerical simulations have offered valuable insight into understanding the modulation of complex terrains in wind turbines and wind farms’ performance. Gravdahl et al. [6] showed that minor height elevation in the terrain might produce significant changes in the power production of a wind farm. Yang et al. [7] studied the spatial evolution of a wind-turbine wake placed at various locations downwind of three-dimensional hills and found substantial enhancement of the turbulence kinetic energy (TKE) in the wake. An early study by Chaviaropoulos and Douvikas [8] indicated that the wake of wind turbines might extend further downwind in hill terrains compared to those in flat surfaces. Politis et al. [9] simulated the flow around a quasi-3D Gaussian hill, with and without a wind turbine, and found that hill modulated the wake’s development in a complex way, resulting in a velocity deficit that extended for a long distance. They also noted that the center of the wake moved to lower heights compared to the flat terrain.
Experimental investigations have provided complementary insight into the topographic effects on the turbine performance, wake dynamics, and turbine-turbine interaction. Early measurements by Fragoulis and Fragoulis [10] using cup–vane systems and 3D-sonic anemometers noted a significant effect on the turbine operation and enhanced fatigue loads. Using three short-range and three long-range WindScanners LiDAR (Light Detection and Ranging) measurements, Menke et al. [11] investigated the velocity deficit propagation of a 2 MW wind turbine wake in complex terrain. They categorized wake displacements and showed a strong dependence on the vertical wake motions with atmospheric stability. In particular, they noted that the wake follows the terrain with a large inclination under stable conditions. However, they observed substantial upward advection in unstable conditions. Very recently, Gao et al. [12] conducted a field study using SCADA data and LiDAR measurements to investigate the power generation and wake of four wind turbines placed in a hill with large slopes resulting in speed-up and flow separation. Their results show that in addition to the terrain height, the ’speed-up effect’ induced by the large surface gradient significantly enhanced power production and promoted flow recovery in the wake. Wind-tunnel experiments by Tian et al. [13] explored the interference of wind turbines on two-dimensional hilly terrain with different slopes. They noted a modulation of the hill slope on the wake of the turbines with the wind farm over hilly terrain and wake expansion with comparatively low hill heights, but not evident effects on relatively high hills. A combined numerical and experimental work by Castellani et al. [14] indicated wake distortions induced by the features of the terrain. Shamsoddin and Porté-Agel [15] proposed a model accounting for the effect of the pressure gradient in axisymmetric wakes. They pointed out a complex interaction in wind turbine wake over topography modulated by the pressure gradient. Using wind-tunnel experiments and numerical simulations, Kim and Jeon [16] recently explored the impact of a seawall structure on the performance of wind turbines. They noted a wind speed-up and wind shear reduction that contributed to power increase. This was consistent with the windbreak theory given by Tobin et al. [17].
A particular topographic feature that serves as a fundamental scenario towards understanding the modulation of complex terrain on wind turbines is the abrupt step, both in the forward- and backward-facing modes. The flow features around these particular singularities have been explored in detail and well-documented, where flow separation and reattachment point have received particular interest.
In the case of forward-facing steps (FFS), investigations have reported two recirculation zones [18,19]. Experimental work using time-resolved PIV by Nematollahi and Tachie [20] characterized the flow behavior over FFS with various upstream roughnesses and reported spanwise vortices generated by Kelvin–Helmholtz instability downstream of the step; this has been related to the developing shear layer past the step [21,22]. They also noted that upstream roughness affected the recirculation bubble height and the reattachment distance (). A range of reattachment lengths (, where H is the step height) have been reported under various flow condition; these include [23], [24], and [25]. Observations also indicate increased reattachment length with increased Reynolds numbers, and reduced roughness [23,25,26,27,28,29]. Shao [29] reported a negative transport of TKE near the forward-facing steps, slowly turning into positive TKE transport moving away from the step.
Backward-facing steps (BFS) impose different modulations on the flow. Early experimental work by Armaly et al. [30] explored BSF under a range of Reynolds numbers within . They found a positive correlation between and Reynolds number for , with a shortened reattachment length marking the onset of flow transition, followed by an increase of with Reynolds number until eventually reaching a plateau. They also reported the possibility of secondary flow separation downstream of the step caused by the substantial change in pressure gradient induced at the step location. Isomoto and Honami [31] investigated the effect of turbulence and showed a negative trend between turbulence intensity and reattachment length. Biswas et al. [32] focused on the expansion ratio effect for low to moderate Reynolds numbers flows and showed that increased non-linearly with the expansion ratios. For additional details on the backward-facing steps, see a recent review by Chen et al. [33].
Even though wind turbines have been and will likely be placed in the vicinity of sharp topographic changes, our understanding of these distinct topographic singularities’ impact is very limited. The effect of flow acceleration and deceleration, sharp changes in pressure gradient, and the magnitude of the steps are some of the quantities that require close inspection to operate wind turbines and design wind farms better. We aim to tackle such a problem using laboratory experiments under various configurations. In this study (Part A), we focus on the wake statistics and power output of a model wind turbine operated in the vicinity of steps. The experimental setup is described in Section 2, results and discussion are presented in Section 3, and conclusions are provided in Section 4.
2. Experimental Set-Up
A model horizontal axis wind turbine was placed in the upwind vicinity of various topographic forward- and backward-facing steps in a boundary-layer wind tunnel. The Eiffel-type structure is located in Renewable Energy and Turbulent Environment Group of the University of Illinois at Urbana-Champaign. The 6.1-m long test section has a cross-section 0.91 m wide and 0.45 m high. The top wall is adjustable along the test section to control the pressure gradient, which was set to nearly zero in the base-case scenario with no topographic change. For details on this facility, see the work by Adrian et al. [34].
The topographic steps were placed in the developed boundary layer with height changes characterized by , −0.42, −0.21, 0, 0.21, and 0.42, where is the height difference between the surface right downwind and right upwind the step. Note that the scenario serves as the reference case, which is equivalent to a wind turbine placed on flat terrain. The basic schematic of the experimental setup is shown in Figure 1. Surface roughness consisting of 5-mm bulk-diameter chains spaced every 0.2 m along the test section [35,36] was used to promote the development of the turbulence boundary layer (TBL). An active turbulence generator located at the beginning of the test section was used to induce high turbulence levels with an inertial subrange spanning two decades [37]. The turbulence generator consists of vertical and horizontal rods, which rotate at a customized frequency, set to 0.1 Hz here, using a stepper motor per rod; more details of the active turbulence generator are given in [38].
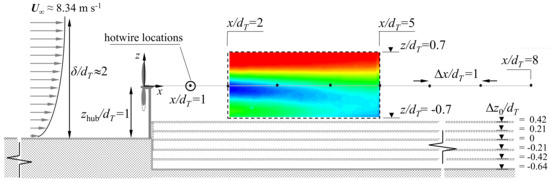
Figure 1.
Basic schematic of the experimental setup illustrating the topographic forward- and backward-facing steps, PIV field of view and locations of the complementary hotwire measurements.
At the turbine location, the mean incoming flow velocity at hub height was set to = 8.45 m s, resulting in a TBL with a roughness length ≈ 0.12 mm, and a thickness 2 (see additional details in Liu et al. [39]). Figure 2 illustrates dimensionless vertical profiles of the incoming flow , turbulence intensity and kinematic shear stress of the boundary layer near the turbine location; here, is the streamwise velocity fluctuations’ standard deviation.
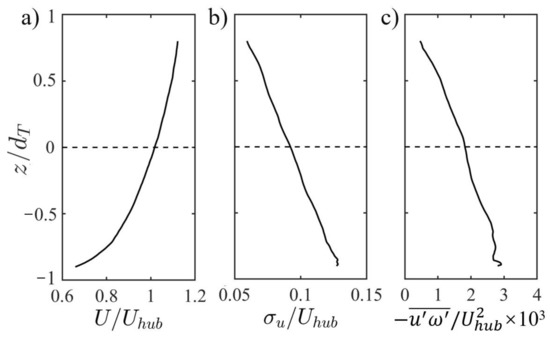
Figure 2.
Characteristics of the turbulent boundary layer near the turbine: (a) mean velocity ; (b) turbulence intensity ; and (c) kinematic shear stress . The horizontal dashed line indicates the hub height location of the turbine rotor.
The model wind turbine rotor is based on one of the reference models from Sandia National Laboratory [40,41]. The rotor (nacelle and blades) was manufactured with an Objet Eden 350 3D printer at the University of Illinois Rapid-Prototyping Laboratory. The three-blade turbine has a = 120 mm rotor diameter, and = 120 mm hub height, resulting in a Reynolds number , where is the kinematic viscosity of air. The selected conditions produce wake statistics with a reasonable independence [42,43]. A 12 mm Precision Micro-drive 112-001 Micro Core was used as the generator, resulting in a rated power 1 W [44]. During the experiment, the turbine operated at a tip-speed ratio of = r/U∼ 5, where is the angular velocity of the rotor determined by the motor loading system [44]. The tip-speed ratio is on the order of that observed in utility-scale wind turbines [45]. The instantaneous power output of the wind turbine was obtained for periods of 120 s, at 10 kHz sampling frequency, using a Measurement Computing USB-1608HS data logger. The resultant voltage and resistance across the terminals of the generator, measured with a data acquisition system (DAQ), was used to determine the power output. Power measurements had a correlation time scale of s, resulting in a normalized uncertainty in the mean value , where is the measured mean power, and is the associated standard deviation. Additional characteristics of the turbine, its response, and operation can be found in [17]. High-resolution particle image velocimetry (PIV) was used to characterize the instantaneous flow and associated statistics of the incoming boundary layer and turbine wake in the near and intermediate fields at a plane coincident with the rotor axis. The incoming flow was seeded with 1 m olive-oil droplets, which were released by several Laskin nozzles. The selected field of view (FOV) consisted on an area within and (i.e., mm × 168 mm), where the origin of the coordinate system was set at the center of the rotor. The FOV was illuminated by a 1 mm thick laser sheet from a 250 mJ/pulse double-pulsed Quantel laser. Two thousand image pairs were collected in each scenario using an 8 MP (3320 pixels × 1560 pixels), 16 bit frame-straddle CCD camera at a frequency sampling of 1 Hz. The image pairs were interrogated with the TSI Insight 4G software package, using a recursive cross-correlation method. A final vector grid spacing of mm was obtained using an interrogation window of 24 pixels × 24 pixels with a 50% overlap. Effects of minor camera misalignment, resolution, light sheet plane alignment, and PIV processing were accounted for, which resulted in a free-stream velocity error with a standard deviation of [46,47]. Complementary single-point velocity measurements at a frequency of kHz were obtained at selected locations with a constant temperature hotwire anemometry (CTA) for periods of 120 s. These include measurements along the axis of symmetry of the rotor within every . The hotwire calibration was performed at the beginning and after each experiment to ensure negligible voltage drift in the data acquisition system.
3. Results and Discussion
In this section, we discuss the impact of various forward- and backward facing topographic steps on the turbine wake statistics and mean power output.
3.1. Wake Characteristics
The topographic steps imposed a distinct modulation in the mean features and statistics of the turbine wake in the near and intermediate fields. A well-known feature of the backward-facing steps in this turbulent regime is a recirculation zone that extends roughly [31,33]. For the cases under consideration, , , and , i.e., a streamwise extent on the order of , 3, and 1. Within this streamwise region, undisturbed streamlines of the flow undergo deformation right past the steps, which decreases with increasing height. Likewise, forward-facing steps produce a recirculating zone with an extent of and a maximum height of in the absence of the turbine. The flow diverted by the turbine with the flow acceleration and deceleration, pressure gradient variation, and streamline curvature [15] modulated by the steps results in distinct effects on the mean direction, magnitude, and statistics of the wake, which are indicated as follows.
First, the bulk effect induced by these steps on the mean wake is illustrated in Figure 3. It reveals a distinct modulation of the magnitude () and type (forward vs. backward) of the step. In particular, a larger velocity deficit in the wake with the turbine right upwind of backward-facing steps occurred compared to the base case (flat terrain). The delay in the flow recovery exhibits qualitatively similar features noted in axisymmetric setups with adverse pressure gradients [48,49]. Conversely, the forward-facing steps induced reduced velocity deficit. This effect impacted the mean power, as discussed below. Here, the undisturbed flow is recovered more quickly, as evidenced by the entrainment of the outer flow levels. A notorious, distinct effect induced by the steps is the deflection of the wake. The center of the wakes shown with the dash-dotted lines evidence deflections negligible for the forward-facing steps and the base case, with deviations , as indicated in Figure 4. However, this is not the case for the backward-facing step; a noticeable deflection of around occurred in the near field at .
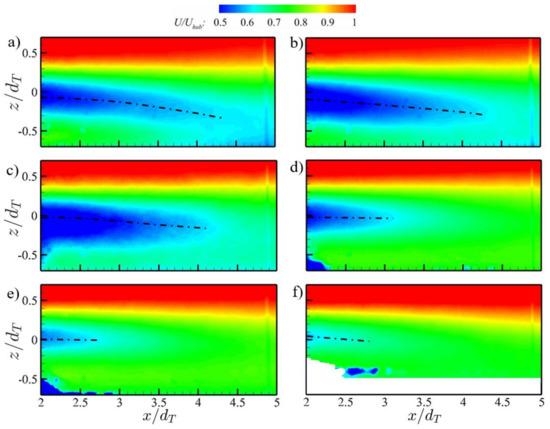
Figure 3.
Mean velocity distributions, , in the center plane () for the backward- and forward-facing step cases and flat terrain with equal to: (a) −0.64; (b) −0.42; (c) −0.21; (d) 0; (e) 0.21; and (f) 0.42. The dashed, dotted lines indicate the location of the wake core.
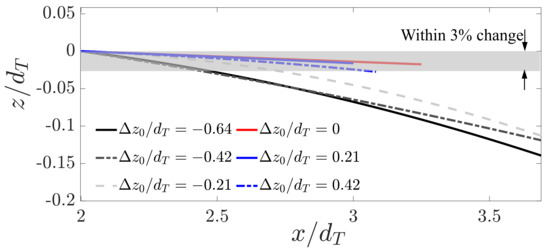
Figure 4.
Location of the wake core (velocity minimum around the hub) for the backward- and forward-facing step cases and flat terrain.
The different velocity deficits and the wake’s deflection triggered distinct changes in the turbulence and its statistics. Figure 5 and Figure 6 illustrate the distributions of the turbulence intensity, , and kinematic Reynolds stress, , where is the standard deviation of the streamwise velocity fluctuations and denotes a fluctuating quantity. Consistent with the mean velocity distribution and associated vertical gradients, these quantities are larger for the backward-facing steps. The forward-facing steps showed reduced levels compared to the base case. The deflection of is not evident, except for the enhanced interaction of the higher turbulence levels at the bottom tip with the shear layer turbulence induced by the step (Figure 5a). Deflection and magnitude changes are, however, further highlighted in the kinematic shear stress distributions. Figure 6 allows us to identify how the recirculation bubble indirectly affected the high-order statistics in the wake. In particular, the shear layer induced by the turbine top tip in the largest backward-facing step () exhibits a slight downward deflection up to . This distance reduced as the topographic step-change become less distinctive. The impact of turbulent transport is illustrated later.
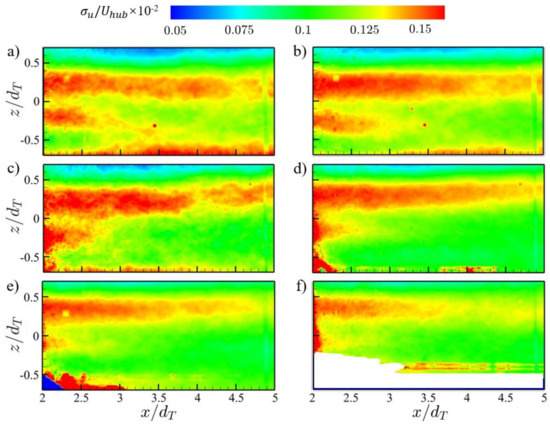
Figure 5.
Turbulence intensity distribution, , in the center plane () for the backward- and forward-facing step cases and flat terrain with equal to: (a) −0.64; (b) −0.42; (c) −0.21; (d) 0; (e) 0.21; and (f) 0.42.
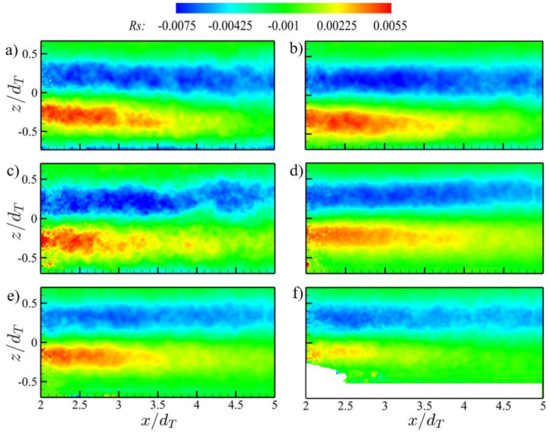
Figure 6.
Kinematic shear stress distribution, , in the center plane () for the backward- and forward-facing step cases and flat terrain with equal to: (a) −0.64; (b) −0.42; (c) −0.21; (d) 0; (e) 0.21; and (f) 0.42.
A closer look at the step effects on the wake statistics is evidenced with selected vertical profiles of , , and in the near and intermediate wakes. Figure 7a1 profiles taken at the very near wake at highlights the wake recovery rate difference between various topographies. A comparison with those in the intermediate field (Figure 7a2) shows a persistent delay with the backward-facing steps that imposed a favorable pressure gradient. Figure 7b1–c2 also highlights the changes in the magnitude, distribution, and vertical shift of the second-order statistics. Interestingly, the strongest did not coincide with the largest step in the near wake (). This phenomenon may be related to the shorter but more intense recirculation zone at the near wake for smaller steps.
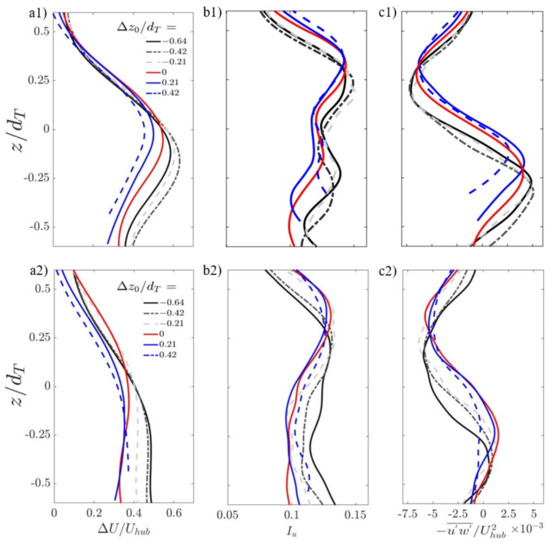
Figure 7.
Vertical profiles of: (a1,a2) the velocity deficit ; (b1,b2) turbulence intensity ; and (c1,c2) kinematic shear stress for the backward- and forward-facing step cases and flat terrain. Profiles were obtained at: (a1,b1,c1) ; and (a2,b2,c2) .
3.2. Step-Modulated Transport of Turbulence in the Wake
Inspection of the third-order velocity fluctuations allows us to identify the direction and strength of the transport of the turbulence kinetic energy . Transport of streamwise contribution is illustrated in Figure 8 for the extreme steps, namely and 0.42, along with the flat terrain case as a reference.
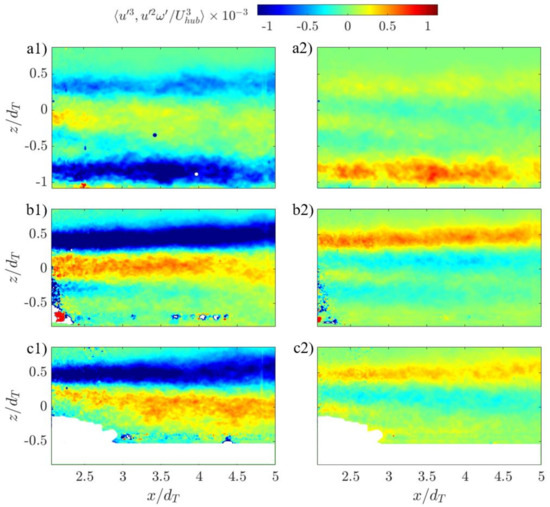
Figure 8.
Transport of streamwise contribution of turbulent kinetic energy in the center plane () with distribution of (a1,b1,c1) and (a2,b2,c2) for (a1,a2) −0.64, (b1,b2) 0, and (c1, c2) 0.42 steps.
The wake exhibited distinct zones with the magnitude modulated by the topographies. The region near the top tip (i.e., ) exhibited negative and positive for the three cases; there, ejections ( and ) were predominant. Another distinct region occurred around the turbine hub height with an opposite trend of those at the tip and dominated by sweep motions ( and ). Here, a much weaker sweep is observed in the forward-facing step. In contrast, the flat terrain and the backward-facing step shared strong sweeps, indicating the adverse pressure gradient created by the backward-facing step delayed entrainment into the wake, thus slowing the wake recovery [50]. Note that an additional region below the turbine bottom tip () occurred due to the separated shear layer rolled up from the presence of the backward-facing step [51] (Figure 8a), which had an impact on the energy redistribution in the turbine wake.
Despite that in this work the focus is placed on the statistics, it is worth pointing out features of the instantaneous wake. Representative snapshots of normalized swirling strength are shown in Figure 9 to illustrate the distinct shear layer effect caused by topographic steps. Here, is the imaginary part magnitude of the eigenvalues obtained from the velocity gradient tensor, which follows the definition used in [52]. Instability around the top tip height () is captured in all cases as these are energetic vortices generated from the wind-turbine blades. Significant differences can be distinguished in the vicinity of the bottom-tip height (), extending the field of view. There, the recirculation-bubble shear layer [53,54] plays a dominant role. Distributed vortices are more frequent in the forward-facing step, as noted in Figure 9c. The particular modulation of the steps on the coherent motions also affected the structure of the flow. In particular, Figure 10 shows the difference of the compensated velocity spectra () between each topographic step with the flat terrain along the rotor axis. A clear trend of the spectral peak moving from the intermediate and far-field to the near wake as the step change varies from the steep backward-facing to forward-facing steps. This once again demonstrates the dominant role of the BFS shear layer on the energy redistribution in the turbine wake (see Figure 8a), which sustained further downstream.
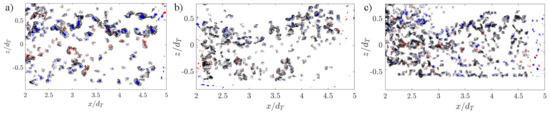
Figure 9.
Instantaneous swirling strength distributions in the center plane () for equal to: (a) −0.64 step; (b) 0 step; and (c) 0.42 step.
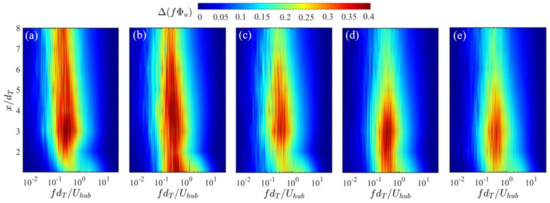
Figure 10.
Compensated streamwise velocity spectral difference between various topographic steps and the flat terrain, , along the rotor axis for i equal to: (a) −0.64 step; (b) −0.42 step; (c) −0.21 step; (d) 0.21 step; and (e) 0.42 step.
3.3. On the Power Output
Finally, basic insight into the bulk effect of the sharp topographic steps onto wind-turbine performance can be obtained by comparing the mean power output, , and associated levels of fluctuations, namely, the standard deviations, .
Figure 11 illustrates the mean power for all the scenarios normalized by that with the turbine on the flat terrain (). A modest but consistent power increase of over 2% was induced by the backward-facing steps , whereas a negligible (but negative) change occurred with the forward-facing steps . The power differences among the cases are primarily due to the changes in the wake modulated by the local topographic singularity; the magnitude of the velocity deficit is linked with the power generated [55]. In addition, distinct flow fluctuations triggered by the steps may play a role in the turbulent energy entrainment. This particular phenomenon requires a close inspection with sufficiently high-frequency PIV measurements. Note that the topographic changes produced a minor difference between the cases on the intensity of the power fluctuations, . There, is normalized by the mean of each case. This quantity was within the range for all configurations. The modest changes of the mean power but the substantial differences of the wake among the various cases motivates an inspection of the effects of sharp topographic changes in the context of a wind-farm layout design and operation.
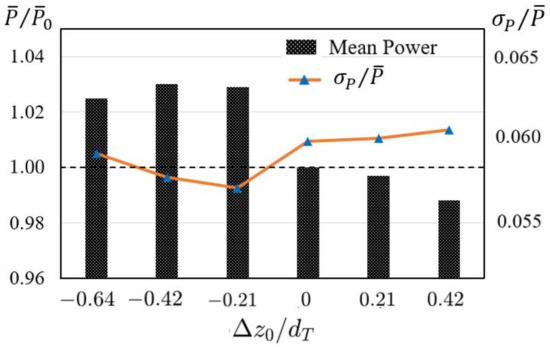
Figure 11.
Mean power output () and intensity of the power output fluctuations () for the backward- and forward-facing step cases and flat terrain.
4. Remarks and Conclusions
The forward- and backward-facing topographic steps induced distinct changes on the wind-turbine wake and associated statistics. In particular, the backward-facing steps promoted significant wake deflection and a more persistent velocity deficit in the wake compared to the base case (flat terrain). In contrast, the wake deflection was negligible in the forward-facing steps with a deviation of the wake center were . It reached around in the near field at in the backward-facing steps. Interestingly, the largest topographic change in this configuration did not result in the largest turbulence levels and kinematic shear stress. The steps particularly modulated the transport of the turbulence kinetic energy . Ejections ( and ) were predominant around the top tip, and sweeps ( and ) dominated around the turbine hub height. The magnitude of these quantities was sensitive to the step height. Much weaker sweeps were observed in the forward-facing steps. In contrast, the flat terrain and the backward-facing steps shared strong sweeps. Inspection of instantaneous vortices in the wake revealed the steps’ strong modulation; their distribution was largely affected, where distributed vortices were more frequent in the forward-facing steps.
Finally, it is worth stressing that modest changes in the mean power but substantial differences in the wake among the various cases motivate a close look into the effect of sharp topographic changes in the context of layout design and operation of wind farms. Follow-up work will focus on the modulation of the steps on the structure of the wind-turbine wake.
Author Contributions
Experiments, B.Z.; methodology, B.Z., S.C., F.L. and L.P.C.; formal analysis, S.C., F.L. and L.P.C.; writing—original draft preparation, S.C.; supervision and project administration, Y.Z.; and writing—review and editing, L.P.C. All authors have read and agreed to the published version of the manuscript.
Funding
This research received no external funding.
Acknowledgments
This work was supported by the Department of Mechanical Science and Engineering, University of Illinois at Urbana-Champaign.
Conflicts of Interest
The authors declare no conflict of interest.
Abbreviations
| TBL | Turbulence Boundary Layer |
| CTA | Constant Temperature Anemometry |
| PIV | Particle Image Velocimetry |
| FFS | Forward Facing Step |
| BFS | Backward Facing Step |
| FOV | Field of View |
References
- Kuo, J.Y.; Romero, D.A.; Beck, J.C.; Amon, C.H. Wind farm layout optimization on complex terrains–Integrating a CFD wake model with mixed-integer programming. Appl. Energy 2016, 178, 404–414. [Google Scholar] [CrossRef]
- Carvalho, D.; Rocha, A.; Santos, C.S.; Pereira, R. Wind resource modelling in complex terrain using different mesoscale–microscale coupling techniques. Appl. Energy 2013, 108, 493–504. [Google Scholar] [CrossRef]
- Prósper, M.A.; Otero-Casal, C.; Fernández, F.C.; Miguez-Macho, G. Wind power forecasting for a real onshore wind farm on complex terrain using WRF high resolution simulations. Renew. Energy 2019, 135, 674–686. [Google Scholar] [CrossRef]
- Vermeer, L.; Sørensen, J.N.; Crespo, A. Wind turbine wake aerodynamics. Prog. Aerosp. Sci. 2003, 39, 467–510. [Google Scholar] [CrossRef]
- Migoya, E.; Crespo, A.; Garcia, J.; Moreno, F.; Manuel, F.; Jiménez, Á.; Costa, A. Comparative study of the behavior of wind-turbines in a wind farm. Energy 2007, 32, 1871–1885. [Google Scholar] [CrossRef]
- Gravdahl, A.; Rorgemoen, S.; Thogersen, M. Power prediction and siting—When the terrain gets rough. In Proceedings of the World Wind Energy Conference and Exhibition, 2002 (ETA-Florence), Berlin, Germany, 2–6 July 2002. [Google Scholar]
- Yang, X.; Howard, K.B.; Guala, M.; Sotiropoulos, F. Effects of a three-dimensional hill on the wake characteristics of a model wind turbine. Phys. Fluids 2015, 27, 025103. [Google Scholar] [CrossRef]
- Chaviaropoulos, P.; Douvikas, D. Mean wind field prediction over complex terrain in the presence of wind turbine(s). EWEC-CONFERENCE 1999, 1208–1211. [Google Scholar]
- Politis, E.S.; Prospathopoulos, J.; Cabezon, D.; Hansen, K.S.; Chaviaropoulos, P.; Barthelmie, R.J. Modeling wake effects in large wind farms in complex terrain: The problem, the methods and the issues. Wind Energy 2012, 15, 161–182. [Google Scholar] [CrossRef]
- Fragoulis, A.; Fragoulis, A. The complex terrain wind environment and its effects on the power output and loading of wind turbines. In Proceedings of the 35th Aerospace Sciences Meeting and Exhibit, Reno, NV, USA, 6–9 January 1997; p. 934. [Google Scholar]
- Menke, R.; Vasiljević, N.; Hansen, K.S.; Hahmann, A.N.; Mann, J. Does the wind turbine wake follow the topography? A multi-lidar study in complex terrain. Wind Energy Sci. 2018, 3, 681–691. [Google Scholar] [CrossRef]
- Gao, X.; Wang, T.; Li, B.; Sun, H.; Yang, H.; Han, Z.; Wang, Y.; Zhao, F. Investigation of wind turbine performance coupling wake and topography effects based on LiDAR measurements and SCADA data. Appl. Energy 2019, 255, 113816. [Google Scholar] [CrossRef]
- Tian, W.; Ozbay, A.; Hu, H. Terrain effects on characteristics of surface wind and wind turbine wakes. Procedia Eng. 2015, 126, 542–548. [Google Scholar] [CrossRef]
- Castellani, F.; Astolfi, D.; Mana, M.; Piccioni, E.; Becchetti, M.; Terzi, L. Investigation of terrain and wake effects on the performance of wind farms in complex terrain using numerical and experimental data. Wind Energy 2017, 20, 1277–1289. [Google Scholar]
- Shamsoddin, S.; Porté-Agel, F. A model for the effect of pressure gradient on turbulent axisymmetric wakes. J. Fluid Mech. 2018, 837, R3. [Google Scholar] [CrossRef]
- Kim, H.G.; Jeon, W.H. Experimental and Numerical Analysis of a Seawall’s Effect on Wind Turbine Performance. Energies 2019, 12, 3877. [Google Scholar] [CrossRef]
- Tobin, N.; Hamed, A.M.; Chamorro, L.P. Fractional flow speed-up from porous windbreaks for enhanced wind-turbine power. Bound.-Layer Meteorol. 2017, 163, 253–271. [Google Scholar] [CrossRef]
- Eaton, J.; Johnston, J. A review of research on subsonic turbulent flow reattachment. AIAA J. 1981, 19, 1093–1100. [Google Scholar] [CrossRef]
- Graziani, A.; Kerhervé, F.; Martinuzzi, R.; Keirsbulck, L. Dynamics of the recirculating areas of a forward-facing step. Exp. Fluids 2018, 59, 154. [Google Scholar] [CrossRef]
- Nematollahi, A.; Tachie, M.F. Time-resolved PIV measurement of influence of upstream roughness on separated and reattached turbulent flows over a forward-facing step. AIP Adv. 2018, 8, 105110. [Google Scholar] [CrossRef]
- Hudy, L.M.; Naguib, A.M.; Humphreys, W.M., Jr. Wall-pressure-array measurements beneath a separating/reattaching flow region. Phys. Fluids 2003, 15, 706–717. [Google Scholar] [CrossRef]
- Hoarau, C.; Borée, J.; Laumonier, J.; Gervais, Y. Analysis of the wall pressure trace downstream of a separated region using extended proper orthogonal decomposition. Phys. Fluids 2006, 18, 055107. [Google Scholar] [CrossRef]
- Camussi, R.; Felli, M.; Pereira, F.; Aloisio, G.; Di Marco, A. Statistical properties of wall pressure fluctuations over a forward-facing step. Phys. Fluids 2008, 20, 075113. [Google Scholar] [CrossRef]
- Leclercq, D.; Jacob, M.; Louisot, A.; Talotte, C. Forward-backward facing step pair-Aerodynamic flow, wall pressure and acoustic characterisation. In Proceedings of the 7th AIAA/CEAS Aeroacoustics Conference and Exhibit, Maastricht, The Netherlands, 28–30 May 2001; p. 2249. [Google Scholar]
- Largeau, J.; Moriniere, V. Wall pressure fluctuations and topology in separated flows over a forward-facing step. Exp. Fluids 2007, 42, 21. [Google Scholar] [CrossRef]
- Hattori, H.; Nagano, Y. Investigation of turbulent boundary layer over forward-facing step via direct numerical simulation. Int. J. Heat. Fluid Flow 2010, 31, 284–294. [Google Scholar] [CrossRef]
- Ji, M.; Wang, M. Surface pressure fluctuations on steps immersed in turbulent boundary layers. J. Fluid Mech. 2012, 712, 471. [Google Scholar] [CrossRef]
- Pearson, D.; Goulart, P.J.; Ganapathisubramani, B. Turbulent separation upstream of a forward-facing step. J. Fluid Mech. 2013, 724, 284–304. [Google Scholar] [CrossRef]
- Shao, W. Experimental Study of Turbulent Boundary Layer Flows over forward Facing Steps with Different Surface Conditions. Master’s Thesis, Ontario Tech University, Oshawa, ON, Canada, 2014. [Google Scholar]
- Armaly, B.F.; Durst, F.; Pereira, J.; Schönung, B. Experimental and theoretical investigation of backward-facing step flow. J. Fluid Mech. 1983, 127, 473–496. [Google Scholar] [CrossRef]
- Isomoto, K.; Honami, S. The effect of inlet turbulence intensity on the reattachment process over a backward-facing step. J. Fluid Eng. 1989, 111, 87–92. [Google Scholar] [CrossRef]
- Biswas, G.; Breuer, M.; Durst, F. Backward-facing step flows for various expansion ratios at low and moderate Reynolds numbers. J. Fluids Eng. 2004, 126, 362–374. [Google Scholar] [CrossRef]
- Chen, L.; Asai, K.; Nonomura, T.; Xi, G.; Liu, T. A review of backward-facing step (BFS) flow mechanisms, heat transfer and control. Therm. Sci. Eng. Prog. 2018, 6, 194–216. [Google Scholar] [CrossRef]
- Adrian, R.J.; Meinhart, C.D.; Tomkins, C.D. Vortex organization in the outer region of the turbulent boundary layer. J. Fluid Mech. 2000, 422, 1–54. [Google Scholar] [CrossRef]
- Fu, S.; Jin, Y.; Zheng, Y.; Chamorro, L.P. Wake and power fluctuations of a model wind turbine subjected to pitch and roll oscillations. Appl. Energy 2019, 253, 113605. [Google Scholar] [CrossRef]
- Ohya, Y. Wind-tunnel study of atmospheric stable boundary layers over a rough surface. Bound. Layer Meteorol. 2001, 98, 57–82. [Google Scholar] [CrossRef]
- Jin, Y.; Ji, S.; Liu, B.; Chamorro, L. On the role of thickness ratio and location of axis of rotation in the flat plate motions. J. Fluids Struct. 2016, 64, 127–137. [Google Scholar] [CrossRef]
- Jin, Y.; Liu, H.; Aggarwal, R.; Singh, A.; Chamorro, L. Effects of freestream turbulence in a model wind turbine wake. Energies 2016, 9, 830. [Google Scholar] [CrossRef]
- Liu, H.; Hayat, I.; Jin, Y.; Chamorro, L.P. On the evolution of the integral time scale within wind farms. Energies 2018, 11, 93. [Google Scholar] [CrossRef]
- Shiu, H.; Johnson, E.; Barone, M.; Phillips, R.; Straka, W.; Fontaine, A.; Jonson, M. A design of a hydrofoil family for current-driven marine-hydrokinetic turbines. In Proceedings of the International Conference on Nuclear Engineering (ICONE), Anaheim, CA, USA, 11–15 November 2012; pp. 839–847. [Google Scholar]
- Johnson, E.; Fontaine, A.; Jonson, M.; Meyer, R.; Straka, W.; Young, S.; van Dam, C.; Shiu, H.; Barone, M. A1: 8.7 scale water tunnel test of an axial flow water turbine. In Proceedings of the 1st Marine Energy Technology Symposium, METS13, Washington, DC, USA, 10–11 April 2013; pp. 10–11. [Google Scholar]
- Chamorro, L.P.; Arndt, R.; Sotiropoulos, F. Reynolds number dependence of turbulence statistics in the wake of wind turbines. Wind Energy 2012, 15, 733–742. [Google Scholar] [CrossRef]
- Sarlak, H.; Nishino, T.; Martínez-Tossas, L.; Meneveau, C.; Sørensen, J.N. Assessment of blockage effects on the wake characteristics and power of wind turbines. Renew. Energy 2016, 93, 340–352. [Google Scholar] [CrossRef]
- Tobin, N.; Hamed, A.M.; Chamorro, L.P. An Experimental Study on the Effects of Winglets on the Wake and Performance of a ModelWind Turbine. Energies 2015, 8, 11955–11972. [Google Scholar] [CrossRef]
- Ragheb, M.; Ragheb, A.M. Wind turbines theory-the betz equation and optimal rotor tip speed ratio. Fund. Adv. Top. Wind Power 2011, 1, 19–38. [Google Scholar]
- Raffel, M.; Willert, C.E.; Scarano, F.; Kähler, C.J.; Wereley, S.T.; Kompenhans, J. PIV uncertainty and measurement accuracy. In Particle Image Velocimetry; Springer: Berlin/Heidelberg, Germany, 2018; pp. 203–241. [Google Scholar]
- Adrian, L.; Adrian, R.J.; Westerweel, J. Particle Image Velocimetry; Number 30; Cambridge University Press: Cambridge, UK, 2011. [Google Scholar]
- Rogers, M.M. The evolution of strained turbulent plane wakes. J. Fluid Mech. 2002, 463, 53. [Google Scholar] [CrossRef]
- Thomas, F.O.; Liu, X. An experimental investigation of symmetric and asymmetric turbulent wake development in pressure gradient. Phys. Fluids 2004, 16, 1725–1745. [Google Scholar] [CrossRef]
- Na, J.S.; Koo, E.; Mu noz-Esparza, D.; Jin, E.K.; Linn, R.; Lee, J.S. Turbulent kinetics of a large wind farm and their impact in the neutral boundary layer. Energy 2016, 95, 79–90. [Google Scholar] [CrossRef]
- Ma, X.; Schröder, A. Analysis of flapping motion of reattaching shear layer behind a two-dimensional backward-facing step. Phys. Fluids 2017, 29, 115104. [Google Scholar] [CrossRef]
- Zhou, J.; Adrian, R.J.; Balachandar, S.; Kendall, T. Mechanisms for generating coherent packets of hairpin vortices in channel flow. J. Fluid Mech. 1999, 387, 353–396. [Google Scholar] [CrossRef]
- Ratha, D.; Sarkar, A. Analysis of flow over backward facing step with transition. Front. Struct. Civ. Eng. 2015, 9, 71–81. [Google Scholar] [CrossRef]
- Saleel, C.; Shaija, A.; Jayaraj, S. On simulation of backward facing step flow using immersed boundary method. Am. J. Fluid Dyn. 2013, 3, 9–19. [Google Scholar]
- Chamorro, L.P.; Arndt, R.A. Non-uniform velocity distribution effect on the Betz–Joukowsky limit. Wind Energy 2013, 16, 279–282. [Google Scholar] [CrossRef]


Publisher’s Note: MDPI stays neutral with regard to jurisdictional claims in published maps and institutional affiliations. |
© 2020 by the authors. Licensee MDPI, Basel, Switzerland. This article is an open access article distributed under the terms and conditions of the Creative Commons Attribution (CC BY) license (http://creativecommons.org/licenses/by/4.0/).