Abstract
We conducted the Life Cycle Analysis (LCA) of energy production from biogas for maize and three types of wetland biomass: reed Phragmites australis, sedges Carex elata, and Carex gracilis, and “grassy vegetation” of wet meadows (WM). Biogas energy produced from maize reached over 90 GJ ha−1, which was more than four times higher than that gained from wetland biomass. However, an estimation of energy efficiency (EE) calculated as a ratio of energy input to the energy produced in a biogas plant showed that the wet fermentation (WF) of maize was similar to the values obtained for dry fermentation (DF) of sedge biomass (~0.30 GJ GJ−1). The greenhouse gases (GHG) emissions released during preparation of the feedstock and operation of the biogas plant were 150 g CO2 eq. kWhel.−1 for DF of sedges and 262 g CO2 eq. kWhel.−1 for WF of Phragmites. Compared to the prevailing coal-based power generation in Central Europe, anaerobic digestion (AD) of wetland biomass could contribute to a reduction in GHG emissions by 74% to 85%. However, calculations covering the GHG emissions during the entire process “from field to field” seem to disqualify AD of conservation biomass as valid low-GHG energy supply technology. Estimated emissions ranged between 795 g CO2 eq. kWhel.−1 for DF of Phragmites and 2738 g CO2 eq. kWhel.−1 for the WM and, in most cases, exceeded those related to fossil fuel technologies.
1. Introduction
Biomass presents an energy source that can be stored and converted into electricity and gas fuels in both solid and liquid forms. Thus, in the European Union (EU) and worldwide, the bioenergy sector is growing substantially due to a broad spectrum of biomass applications, despite the tremendous development of solar and wind technologies, biomass remains the primary source of renewable energy. In 2016, bioenergy derived from a range of feedstocks contributed 116 Mtoe to the EU’s gross final energy consumption, with heating and cooling sectors consuming about 75% of all bioenergy produced. Forestry delivered more than 60% of all EU biomass for energy purposes, while 27% of biomass (36 Mtoe) originated from crops and agricultural by-products [1]. The availability of resources varies regionally: e.g., forest biomass was the most important feedstock for renewable energy in Scandinavia [2], while, in the UK, the highest bioenergy potential was found for household wastes, energy crops, and agricultural residues [3]. The majority of agricultural biomass was utilized as a substrate for the anaerobic digestion (AD), making biodiesel and bioethanol.
Recently, concerns have arisen over the extent of bioenergy deployment and its impact on the environment and society [4,5,6,7], primarily when biofuel production entails changes in land use [6]. The intensified use of forest biomass as a carbon-neutral fuel commenced to near-term emissions greater than most fossil fuels and created a long carbon payback period extending from decades to more than a century [7]. Therefore, the increase in the share of bioenergy in the European energy mix that is expected to fulfill 2030 and 2050 low-carbon policies, is supposed to meet the requirements of sustainability-related to the protection of biodiversity, climate, and greenhouse gases (GHG) emissions, food security [8], as well as the efficiency of energy cropping and generation [9]. As a result of its importance, several studies on the potential and actual negative impact of energy crops on the environment have been published for a wide range of locations [6,10,11,12].
Since all biofuels and bioliquids consumed in the EU are subjected to public support, their production must comply with the sustainability criteria of the Renewable Energy Directive II (RED II) [13]. It introduced a set of constraints to produce raw agricultural materials, i.e., bioenergy feedstock in areas of high biodiversity value and high-carbon stock: primary forests, highly biodiverse grasslands, and wetlands. In terms of RED II, they should be excluded from the production of agricultural biofuels. The incentives aimed at promoting their use should not cause any deterioration to their integrity, ecosystem value, and the services they provide.
Valley wetlands and wet meadows belong to the most valuable and diverse ecosystems in Europe and are essential elements of the agricultural landscape sustained by low-input traditional farming. The transformation of agriculture that began in the late 19th century led to a drastic decline in their range [14] and far-reaching alteration of species composition [15]. Therefore, in the management of biodiversity and biota of non-forested ecosystems, introducing measures to reproduce the traditional farming landscape with characteristic species composition is the most common prescription [16]. At present, limited alternative exploitation of biomass harvested in extensively managed marshes and riparian grasslands is generally supportive of its use for raw material extraction or energy generation [17,18]. Since landscape management often supports nature conservation objectives [19], a high social acceptance level is assumed. Thus, the use of conservation biomass for the generation of bioenergy and biomaterials is recommended to policymakers [20] to avoid negative consequences associated with energy crop production [21]. This is especially true for the utilization of grassy biomass for biogas generation that is suggested to be an up-and-coming and sustainable option [19,22], despite that the material from landscape management often has adverse features, which are challenging compared to the commonly used agricultural substrates or bio-wastes [23]. Unfortunately, even though some new papers have recently appeared, there is still a shortage of comprehensive studies that quantify energy generation efficiency from residual biomass and its contribution to the mitigation of climate change [21]. Moreover, only a few studies covered the entire energy balance and Life Cycle Analysis.
The published Life Cycle Analysis (LCA) of biogas production differed in goal, scope, and methodology [24]. They compared diverse feedstocks and digestate utilization scenarios [25] or assessed various environmental impacts: eutrophication, acidification [26], toxicity potential [27], land-use change [28], with particular attention paid to climate and GHG emissions [26,29,30,31,32].
According to the extensive review of [24], most LCA studies evaluated biogas production from maize or co-digestion of maize with animal slurry. Feedstock analyzed much less frequently included other energy crops, such as miscanthus or sugar beet, a mixture of maize with perennial grasses [33], food waste [34,35,36], macroalgae [26]. Numerous researches compared LCA of anaerobic digestion to other bioenergy systems [37,38,39,40]. There is a general agreement that biogas production’s environmental impact depends on the substrate used, biogas yield, energy input, direct emissions from the digestion process, and management of the digestate [41,42]. Additionally, Berglund and Börjesson [43] and Chevalier and Meunier [44] emphasized the role of energy expenditures for feedstock transport.
Among LCA studies, system boundaries varied significantly depending on the feedstock used for biogas production. LCA of AD systems using energy crops included crop cultivation, while for wastes, the system boundary encompassed biogas production and utilization exclusively [24]. Digestate management and utilization were usually excluded; although, Timonen et al. [45] noticed significant emissions during digestate application on the field. Recently, the LCA methodology focused on environmental aspects of biogas upgrading [46,47].
This study analyzes energy generation from biomass harvested in nature and landscape conservation areas and GHG emissions during the entire energy generation process from harvest to digestate utilization. We focus on AD because biogas production seems a beneficial option for both the environment and the economy. It includes the possibility of storage and flexible use of biogas: electricity, heat, methanation, and vehicle propulsion while preserving organic matter and biogen reused in agriculture.
We hypothesize that the sustainable use of marsh and grassland ecosystems may contribute to solving the problem of energy shortages by providing a sustainable and environmentally friendly energy source.
2. Materials and Methods
2.1. Goal, Scope, and Functional Unit
The main goal of the LCA was to determine the energy requirements and GHG emissions from biogas generation based on conservation biomass and digestate utilization for several defined systems compared to the most popular biogas production from maize silage. The study is based on primary data (e.g., feedstock yield, biogas potential) collected for north-eastern (NE) Poland, where vast wetlands subject to conservation measures. In the region, agriculture is the dominant sector of the economy with prevailing dairy and meat production. The data on fuel consumption by machinery, materials, fertilizers, GHG emissions, etc., were adopted from the literature.
The scope included various biomass feedstocks, AD technologies, and pathways of digestate utilization. Based on the multiple pathways, we employed three grouping systems to analyze the differences in bioenergy production. Moreover, within each group, we divided the digestate utilization into pathway without separation and pathway with digestate separation and composting.
The first group contains two systems (reference) of maize cultivation, harvest, and biogas production using wet fermentation (WF) technology. Firstly, the utilization of digestate, which is a by-product of WF, by its transportation and spreading on nearby fields without any prior treatment, is assumed (System M–w). Secondly, the digestate is separated, the liquid fraction is used for substrate dilution, and the solid fraction after composting is transported and spread on the field (System M–w/c; Figure 1).
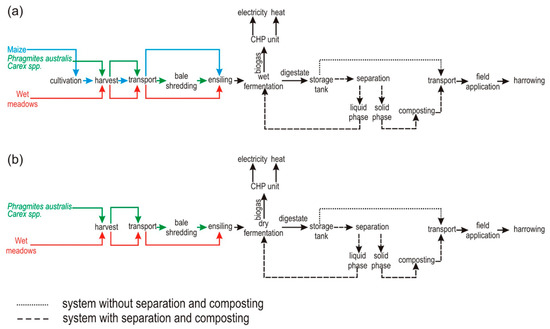
Figure 1.
Simplified diagrams of analyzed systems of bioenergy production, including feedstock preparation, biogas production, and digestate utilization: (a) wet fermentation; (b) dry fermentation.
The second group of systems includes WF of biomass harvested during landscaping and vegetation management of Phragmites australis (Systems Ph–w and Ph–w/c), Carex elata, and Carex gracilis (Systems Ca–w and Ca–w/c), and wet meadows (Systems WM–w and WM–w/c). The digestate is spread on the field without any pretreatment (Systems Ph–w, Ca–w, and WM–w) or digestate is separated and composted prior to the application on the field (Systems Ph–w/c, Ca–w/c, and WM–w/c).
The third group of systems includes AD of wetland (Systems Ph–d, Ph–d/c, Ca–d, and Ca–d/c) and wet meadows biomass (Systems WM–d and WM–d/c) in dry fermentation (DF) technology. The digestate is transported and spread on the field without pretreatment (Systems Ph–d, Ca–d, and WM–d) and in Systems: Ph–d/c, Ca–d/c, and WM–d/c, the digestate after separation is composted and subsequently spread on the field.
The functional unit (FU) provides the logical basis for comparing the energy requirements and environmental impact of studied alternatives. In the LCA of biogas production, different FUs can be used depending on the scope, such as the produced energy, the volume of biogas or biomethane, and the energy contained in biomethane [24]. One of the most typical FU is a mass unit of feedstock delivered to the biogas plant [26,30,48]; however, the biomass analyzed in this LCA has different characteristics and biogas potential. Therefore, the mass unit of biomass as FU seems inappropriate because it does not compare various feedstocks [49]. In this LCA, the FU, to which the energy requirements were normalized and the GHG emissions were calculated, was 1 ha. The unit related to the area allowed comparing different feedstock harvest technologies, two biogas production processes, and different digestate utilization pathways. This FU is in good agreement with Bühle et al. [37], who used 1 ha of semi-natural grassland as an area-related unit to assess the technological approach to producing energy from semi-natural meadows.
2.2. Biogas Production Pathways
2.2.1. Feedstock
The handling of feedstock varies depending on its type. The production chain of maize starts with seed-bed preparation and fertilization, followed by drilling and sowing. The calculations include the use of fertilizers and crop protection. The biomass is shredded during harvest, and chips are transported to the biogas plant. The material is unloaded into a concrete bunker, compacted with the tractor, and covered with plastic sheets for ensiling.
The technologies adaptable for wetland biomass harvesting depend on the characteristics of the harvested area. Floodplains and riverbanks are often difficult to access by the conventional agricultural machinery; thus, the feedstock is collected by the redesigned alpine snow-grooming machines [22]. During harvest, wetland biomass is baled in large round bales and transported to the biogas plant, unlike maize. The material needs to be shredded before ensilaging in a concrete bunker silo, applying the same method as for maize. On the other hand, the biomass from wet meadows is transported in a self-loading forage wagon and ensiled in a concrete bunker silo without any prior preparation in a similar manner to maize.
We assumed the average maize yield in NE Poland to amount to 14 tDM ha−1 [50]. The data of wetland biomass typical for the region was taken from Banaszuk et al. [22]. The most productive community was the reed rush dominated by Phragmites australis (9.78 ± 1.66 tDM ha−1), followed by the tall sedge community with Carex elata and C. gracilis (6–7 tDM ha−1). The wet grass communities produce 4–7 tDM ha−1 per year, and the yield of 5 tDM ha−1 [51] was used in this study.
2.2.2. Biogas Production
AD is used for processing ensiled material to produce biogas, which is then converted through a combined heat and power (CHP) unit to produce electricity and heat. Depending on a dry matter (DM) content, AD can be classified as WF used for substrates with DM content lower than 20%, and DF used when DM content is higher than 20% [52]. The WF is carried out in continuously stirred tank reactors. In this technology, feeding requires screw conveyors for biomass and pumps to add liquid to the feedstock and pumping out digestate from the digester. In a vertical digester, the stirring system is responsible for mixing and homogenizing the substrate, and minimizing swimming-layers and sediment formation [52]. For this analysis, the total solids (TS) concentration in the reactor was assumed to equal 8%, the temperature 38 °C, and hydraulic retention time (HRT)—30 days.
The DF is best suited for processing dry, fibrous materials, such as green waste or landscape management materials. In batch mode with regular emptying and refilling, a solid feedstock is used, which is not moistened beforehand. During fermentation, exiting liquid (percolate) is collected and fed back to the feedstock from above. The biomass can be added with the agriculture machinery. For this study, we chose the batch mode with 30 days of HRT. We assumed the TS in the biogas reactor to amount to 35% and the temperature 38 °C. The fermenting substrate is sprayed with percolates to maintain the correct moisture content. Methane potential yield of maize silage was assumed at 350 m3 tDM−1. The yield of wetland biomass differs depending on plant species. According to Roj-Rojewski et al. [53], the average specific methane yield equals 108 m3 tDM−1 for Phragmites australis and 117 m3 CH4 tDM−1 for Carex spp., while the biomass harvested in wet meadows produces on average 65 m3 CH4 tDM−1 [51]. We assumed the methane content of the biogas as 65%.
2.2.3. Digestate Utilization
This study assumed two possible technologies for digestate management. In the first option, the digestate is spread without pretreatment on a nearby field using a slurry tanker with a splash plate and harrowed to avoid excessive GHG emissions [54]. This technology requires a tank for digestate storage and produces a high fertilizer volume with a high demand for fuel for transportation and spreading.
The second option was digestate separation with the screw conveyor. After separation, the liquid phase was returned to the digester to dilute high solid feedstock. The solid phase was stabilized in the composting process. The simplest and most common method of composting is windrow composting, as considered in this study. In this method, the substrate is placed in long windrows, periodically turned to accelerate the composting process, reduce the anaerobic areas, and provide a uniform product. The compost was assumed to be spread on nearby fields with a manure spreader and mixed with soil with a disc harrow. This technique produces less fertilizer, thus, requiring less fuel for its transportation and field application; however, energy has to be supplied for separation, pumping of the liquid phase to digester, and for composting process.
2.3. Energy Model
Energy analysis was performed using the cumulative energy (Es) demand method [55] that includes primary energy from four energy inputs (Equation (1)).
Es = En + Em + Ei + Ep,
- Es—cumulative energy demand (GJ ha−1);
- En—direct energy input from fuel (GJ ha−1);
- Em—indirect energy input from materials (GJ ha−1);
- Ei—indirect energy input from machinery (GJ ha−1);
- Ep—indirect energy input from labor (GJ ha−1).
Inputs of materials, fuels, and labor for maize cultivation and wetland biomass harvest were obtained from literature, official statistics, and manufacturers. The direct energy input from fuel for maize cultivation was taken from Pawlak [56]. The energy demand for harvesting, baling, and transportation to the river valley outskirts were taken from previous studies [22]. The energy input for ensiling was taken from Evrenosoğlu and Borowski [57]. The indirect energy input from materials used for maize cultivation was calculated based on the doses of fertilizers, seeds, and pesticides according to state-of-the-art maize production technology [58]. The indirect energy input from machinery and labor was assessed according to Formulas (2)–(4) taken from Holka et al. [55]:
- Ei—indirect energy input from machinery (GJ ha−1);
- n—number of machineries used;
- Dk—the energy of machinery per hour (GJ h−1);
- tk—a time of usage of machinery “k” throughout the year (h);
- Ak—area (ha).
The energy of machinery per hour was calculated according to the formula below:
- D—energy of machinery (GJ h−1);
- mk—a mass of machinery “k” (kg);
- wc—energy consumption indicator for machinery (GJ kg−1);
- mzk—mass of spare parts (kg);
- wz—energy consumption indicator for spare parts (GJ kg−1);
- mmk—a mass of materials for repairs (kg);
- wm—energy consumption indicator for materials for repairs (GJ kg−1);
- Tk—a time of usage throughout the year (h);
- Lk—number of years of usage.
The energy input from labor was calculated according to the following formula:
- Ep—energy input from labor (GJ ha−1);
- l—human labor (rbh ha−1);
- wl—energy consumption indicator for human labor (GJ rbh−1).
Results from the energy flow analysis were shown in the Sankey diagrams, which were prepared with e!Sankey 5 pro software (ifu Hamburg GmbH, Hamburg, Germany). The diagrams were performed for three systems: M–w/c, Ph–w, and Ph–w/c. The reference unit used on diagrams was GJ ha−1. The energy flow includes the input of primary energy in biomass, the input of energy necessary for all operations in the entire process from feedstock preparation through bioenergy production to digestate utilization, and output of energy accumulated in produced heat, electricity, and digestate.
2.3.1. Feedstock and Digestate Transportation
The distance between the biogas plant or the composting facility and maize field, valley outskirts, or wet meadows was assumed to be 15 km. The field fertilized with digestate or compost was located 5 km from the biogas plant or composting facility. The energy input for transportation of baled biomass harvested from wetlands was calculated based on biomass weight and fuel consumption of vehicles used for its transport, provided by the manufacturers. The fuel consumption for transportation of maize and wet meadows biomass was taken from ÖKL [59], while energy input for the transportation of untreated digestate and compost was taken from Berglund and Börjesson [43]. All calculations included the empty return of vehicles.
2.3.2. Anaerobic Digestion
The energy inputs for AD depend on the substrate, fermentation technology, and the plant’s operating regime, such as temperature, digester type, HRT, and organic loading rate (OLR) [60]. In WF, the fuel consumption for loading the substrate using a tractor with a front loader was taken from Souček et al. [61]. The biogas plant process has a continuous heat demand to maintain the digester temperature of 38 °C and electricity demand for substrate transportation, mixing, and pumping of digestate. The thermal energy consumption is 30%, and electric use is 9% of produced energy.
In DF, the energy input for bale unrolling was calculated based on manufacturer information, and energy requirements for ensiling were taken from Evrenosoğlu and Borowski [57]. Fuel consumption for substrate loading was assumed the same as it was in WF. The most common garage-type mesophilic reactor for DF was considered, with an average energy expenditure of 5% of the produced energy.
In both technologies, biogas is converted to electricity and heat in the CHP unit. Before combustion, the biogas is desulfurized and dehumidified [60]. Cogeneration is one of the most effective methods to efficiently convert biogas’ chemical energy into electricity and heat [62]. The CHP unit’s electrical and thermal conversion efficiency was assumed to be 38% and 43%, respectively. The power produced in the biogas plant was fed to the national electricity grid, while the heat supplied the plant’s internal needs, which is a common situation in agricultural biogas plants [63], and the surplus heat was assumed to be distributed to the final consumer.
2.3.3. Digestate
Spraying the untreated digestate using a slurry tanker with a splash plate requires 17 MJ tFM−1 of energy and the mixing of the organic fertilizer into the soil by disc harrowing uses 14.1 L of fuel per hectare [64]. For the digestate separation, we assumed screw conveyor technology; after separation, the liquid fraction is applied for substrate dilution, while the solid fraction is composted in all systems. We calculated the energy demand for separation using the manufacturers’ data. The nitrogen (N) and DM content of the maize silage digestate was adopted from our previous study [65], and the N content of digestate from wetland and grassy plants was calculated based on Banaszuk et al. [22] and Gáborčík [66]. The DM content of solid fraction after separation was assumed to be 40%. The amount of digestate applied to the crop fields was dependent on the nutrient content, mainly N. In Poland, according to the Act of 10 July 2007, on fertilizers and fertilizing [67], the recommended annual rate of N applicated with organic fertilizers should not exceed 170 kg N ha−1.
2.3.4. Composting of Digestate
We estimated the energy consumption for the most common windrow composting of solid fraction from DF and WF. Specific fuel consumption of tractor with front loader used in windrow formation was adopted from Souček et al. [61]. The windrows were assumed to be mixed every two weeks with a compost turner; fuel consumption was estimated based on manufacturer information. The compost was transported and spread on the nearby field. The energy consumption of manure spreader was taken from Berglund and Börjesson [43]. Disc harrowing was used as an agricultural practice for mixing compost with the soil.
The N content in plant biomass was taken from Banaszuk et al. [22] and Gáborčík [66]. The amount of N in the solid fraction of digestate was calculated based on N in the untreated digestate and the assumption that the solid fraction after separation retains 25–35% of its original N content. Mass loss during composting ranges from 11.5% [68] to 57% [69]; however, in a majority of studies, the mass loss is reported to be around 20% [68,70,71,72], which we adopted in this study. N losses during composting may reach 42% [69,70,71]. In this study, a 40% N loss was used.
2.4. The GHG Calculations
We calculated the GHG emissions by summing up emissions from fuel consumption, machinery production, and processing. In Systems M–w and M–w/c, we included the GHG emissions from maize cultivation. Emission factors (EF) for fuel consumption, electricity, production of fertilizers, farm equipment, and machinery employed in a biogas plant and the composting facility are given in Table 1.

Table 1.
Emission factors used in calculations.
The GHG emissions for the CHP unit were estimated using the BioGrace II GHG calculator [76]. Carbon dioxide released during the combustion of biogas was considered to be climate neutral. The CO, SO2, NOx, and non-methane volatile organic compounds (NMVOC), along with CH4 emitted due to incomplete combustion of biogas were not examined in this study. Emissions caused by fertilization were calculated according to Intergovernmental Panel on Climate Change (IPCC) [77]. EFs were also taken from that IPCC database except for the annual amount of N in crop residues, which was calculated according to Corrigenda for 2006 IPCC Guidelines [80] with N content in the above-ground residues, the ratio of above-ground residue DM to harvested yield and the fraction of total above-ground crop biomass removed from the field taken from Olecka et al. [81]. In composting, we calculated CH4 and N2O emissions, which were related to a lack of oxygen during the process. The emissions of CO2 derived from organic matter degradation were not considered because of its biogenic origin [82].
The allocation factor of GHG emissions between heat and electricity produced in the CHP unit was calculated according to the CO2- tool for electricity, gas, and heat from biomass [83]. In the CHP unit, two final products, i.e., electricity and heat, were generated. The GHG emissions were distributed among the energy carriers. The allocation factors for electricity and heat were calculated according Formulas (5) and (6), given below:
- Cel—fraction of exergy in the electricity;
- Ch—fraction of exergy in the heat (Carnot efficiency = 0.3546);
- ƞel—electric efficiency;
- ƞh—heat efficiency.
2.5. The Sensitivity Analysis
The evaluation of energy and GHG emissions in different systems utilizing the conservation biomass is based on data collected from various sources. The high variation of applied background data and indicators may influence the results; therefore, a sensitivity analysis was conducted to examine the influence of two main parameters: biomass yield and specific methane yield. The lowest and the highest reasonable values from the literature were used.
3. Results
3.1. Energy
The highest energy density per hectare was produced in System M–w because of high maize yield and the best specific biogas potential of this feedstock (Figure 2). Energy produced from maize reached over 90 GJ ha−1 and was more than four times higher than that obtained from conservation biomass. Among the wetland feedstocks, the most energy produced, regardless of the technology used, was from AD of high productive Phragmites australis, followed by tall sedge communities and wet meadows.
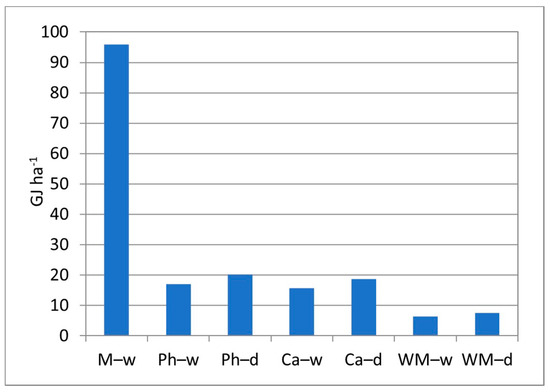
Figure 2.
Energy density of analyzed feedstocks. M–w—wet fermentation of maize, Ph–w—wet fermentation of Phragmites, Ph–d—dry fermentation of Phragmites, Ca–w—wet fermentation of Carex spp., Ca–d—dry fermentation of Carex spp., WM–w—wet fermentation of wet meadows biomass, WM–d—dry fermentation of wet meadows biomass.
In the AD of maize, almost half of the energy accumulated in the feedstock is converted to electricity and heat. Such a high rate of conversion resulted from the methane potential of maize. Conservation biomass is characterized by much lower methane potential yield; therefore, most of the energy contained in this feedstock flows along with a digestate and is supplied to the soil of the field, independently of the AD technology (Figure 3).

Figure 3.
The flow of energy in GJ per hectare calculated for various systems: (a) wet fermentation of maize silage; (b) wet fermentation of common reed silage; (c) dry fermentation of common reed silage.
A comparison of the two AD technologies: WF and DF pointed to the advantage and higher (by several percent) energy efficiency of DF, mostly due to fewer energy requirements (e.g., no energy consumption for mixing the substrates in the fermentation chamber).
Generating energy from maize silage was, however, the most energy-consuming process, especially in System M–w, in which unprocessed digestate was directly applied in liquid form as a crop fertilizer (Figure 4). In that case, the whole energy demand reached 30 GJ ha−1 and was 4–9 times higher than the energy input for the conversion of wetland biomass.
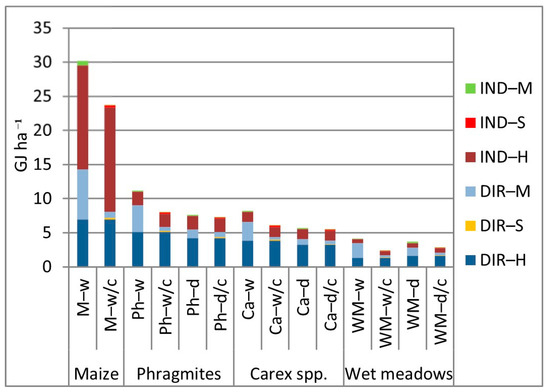
Figure 4.
Energy consumption calculated for all steps of energy production from biomass; w—wet fermentation, d—dry fermentation, c—separation and composting of digestate; DIR—direct energy input from fuel, IND—indirect energy input; H—cultivation and harvest, S—separation of digestate and composting of solid phase, M—management of digestate/compost.
The energy in System M–w is heavily influenced by the indirect energy demand (~16 GJ ha−1), which exceeds 50% of total energy needs (Figure 5). The indirect energy covers the energy incurred on the production of machinery and materials (fertilizers and pesticides) used for cultivation, harvesting, and processing of biomass and on human labor. In systems where conservation biomass is used as feedstock, the indirect energy demand accounts for less than 30%. The lowest needs for indirect energy sources (~0.7 GJ ha−1) were calculated for wet meadows systems. This is primarily the result of the lowest demand for this substrate in terms of human labor and harvesting machines.
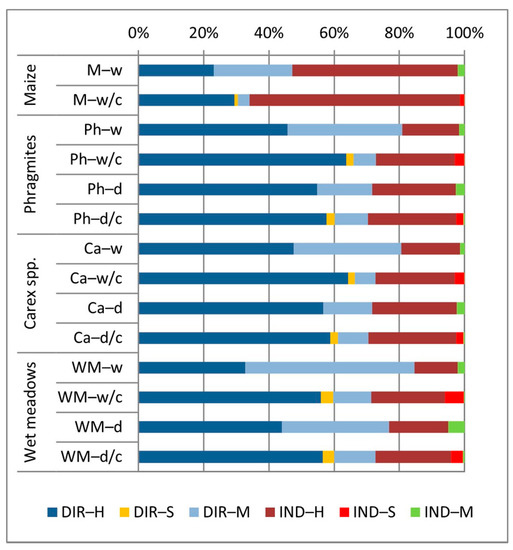
Figure 5.
Share of different energy categories in total energy demand; w—wet fermentation, d—dry fermentation, c—separation and composting of digestate; DIR—direct energy input from fuel, IND—indirect energy input; H—cultivation and harvest, S—separation of digestate and composting of solid phase, M—management of digestate/compost.
For both maize and wetland conservation feedstocks, an energy-saving option provided the separation of the digestate into a liquid and solid fraction and composting of solid material for later use as organic fertilizer. In System M–w/c, this process reduced energy demand by ~20% (Figure 4) compared to untreated digestate application. The separation was beneficial for the total energy demand in all cases of AD of conservation biomass. In WF technology, it was clearly due to the lower energy demand for transportation of the separated digestate from the biogas plant to the field. The positive effect was much smaller for the DF, mostly due to the insignificant change in DM content during composting of digestate.
While analyzing the energy efficiency (EE) calculated as a ratio of energy inputs to the energy produced in a biogas plant (the lower the value, the higher the efficiency of the system chain), the maize silage and sedges biomass in DF technology performed the best (Figure 6). In both cases, the calculated ratio amounted to ~0.3 GJ GJ−1. The least attractive was the WF of Phragmites (System Ph–w; 0.66 GJ GJ−1) and wet meadows (System WM–w; 0.65 GJ GJ−1). EE could be improved for systems that included the DF, especially in the case of wetland plants. For Phragmites, the EE decreased from 0.66 to 0.38 GJ GJ−1, while for sedges, it dropped from 0.52 to 0.31 GJ GJ−1, which does not differ significantly from the EE of maize silage.
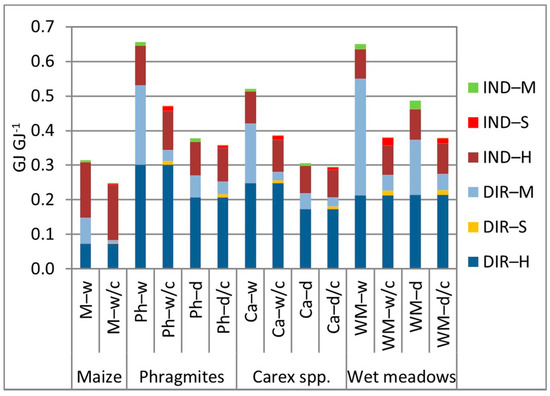
Figure 6.
Energy efficiency of various feedstocks; w—wet fermentation, d—dry fermentation, c—separation and composting of digestate; DIR—direct energy input from fuel, IND—indirect energy input; H—cultivation and harvest, S—separation of digestate and composting of a solid phase, M—management of digestate/compost.
3.2. GHG Emissions
The highest amount of GHG released during energy generation was recorded from the maize silage (9255 kg CO2 eq. ha−1 of the crop; Figure 7), with the cultivation of feedstock being the most significant contributor. GHG emissions from the digestion of wetland feedstocks were relatively leveled and ranged between 3000 and 4500 kg CO2 eq. ha−1, the biomass of reed-beds subjected to WF recorded the highest GHG release. The digestate separation, combined with the subsequent composting of the solid phase, significantly increased the amount of gases released into the atmosphere.
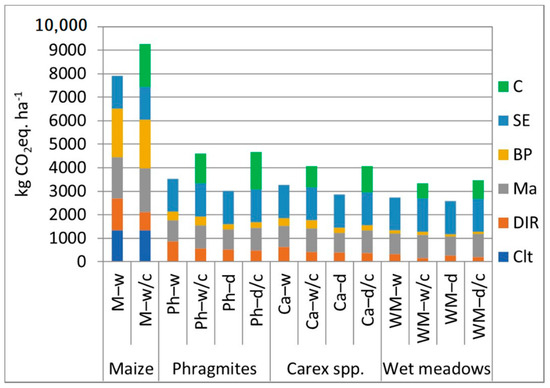
Figure 7.
GHG emissions per hectare of feedstock; w—wet fermentation, d—dry fermentation, c—separation and composting of digestate; Clt—emissions from materials for cultivation, DIR—emissions from fuel, Ma—emissions from machinery production, BP—emissions from biogas plant operations, SE—emissions from soil after digestate/compost application, C—emissions from composting.
The values presented in Figure 7 refer to the entire process related to the production of biogas, including the cultivation of the feedstock, its collection, and transport to the biogas plant, operation of the biogas plant, and digestate management. Taking into account only the production of biogas, the value of 4062 kg CO2 eq. ha−1 for maize and the range of 241 (WM–d)–853 (Ph–w) kg CO2 eq. ha−1 were obtained. The same results expressed per unit of energy produced showed that emissions from maize were ~40 kg CO2 eq. GJ−1, while in the case of conservation biomass, they were in the range of 42–50 kg CO2 eq. GJ−1 (WF) and 28–32 kg CO2 eq. GJ−1 (DF).
Among the various emission sources related to the AD of wetland feedstocks, the release of GHG from organic matter (OM) applied as a crop fertilizer was of great importance, regardless of whether the OM was used in untreated digestate or its solid phase (Figure 8). Unseparated digestate accounts for 40–55% of the total emissions from the entire chain of the energetic conversion of biomass. Separation of the digestate resulted in a decrease of GHG emissions from the fields to a range of 30–40%.
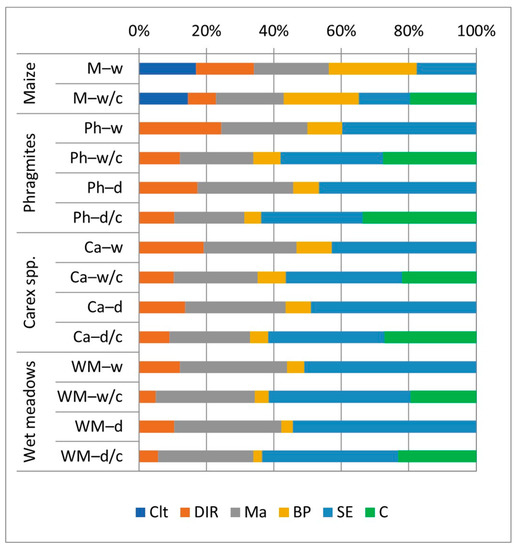
Figure 8.
Share of different emission sources in total GHG emissions; w—wet fermentation, d—dry fermentation, c—separation and composting of digestate; Clt—emissions from materials for cultivation, DIR—emissions from fuel, Ma—emissions from machinery production, BP—emissions from biogas plant operations, SE—emissions from soil after digestate/compost application, C—emissions from composting.
The total GHG emissions calculated per energy unit (heat and electricity) were the lowest (~80 kg CO2 eq. GJ−1) for the WF of maize (Figure 9). This included all steps of bioenergy production (from cultivation/harvest, operation of the biogas plant to the management of the digestate) together with emissions caused by manufacturing and processing of machinery and materials. Among the conservation biomass, the lowest GHG release showed the DF of Phragmites (System Ph–d; 148 kg CO2 eq. GJ−1), while WF of wet meadows biomass with digestate separation resulted in the highest emissions (System WM–w/c); 524 kg CO2 eq. GJ−1). The calculations demonstrated a significant impact of digestate management on GHG balance. Excluding the management of digestate, its transportation, and application on the field (which is a common practice in published LCA studies) from the analysis resulted in much lower estimated emissions that ranged from 58.4 to 143.8 kg CO2 eq. GJ−1 for WF of maize and wet meadows biomass, respectively.
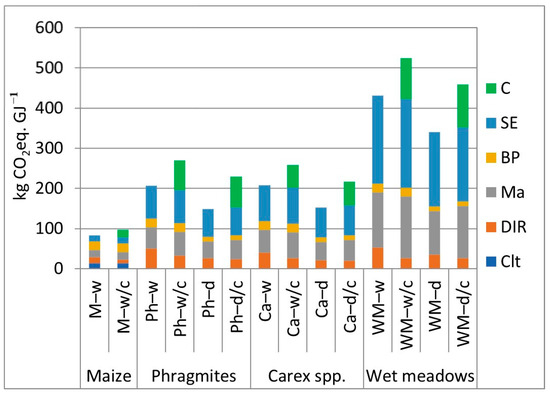
Figure 9.
GHG emissions per GJ of produced energy; w—wet fermentation, d—dry fermentation, c—separation and composting of digestate; Clt—emissions from materials for cultivation, DIR—emissions from fuel, Ma—emissions from machinery production, BP—emissions from biogas plant operations, SE—emissions from soil after digestate/compost application, C—emissions from composting.
However, the allocation of emissions between heat and electricity and assignment of the GHG to the unit of electricity (kWh) gave a much less promising result. The GHG emissions “from field to field” that included all steps in bioenergy production (cultivation/harvest, operation of the biogas plant, and the management of the digestate) together with emissions caused by manufacturing and processing of machinery and materials were far higher, and ranged between 431 g CO2 eq. kWhel.−1 for maize and 2738 g CO2 eq. kWhel.−1 for the biomass harvested in wet meadows (Figure 10). GHG emissions varied, depending on fermentation technology and digestate management. The use of DF, compared to WF, reduced emissions by ~10–13% in systems with digestate separation and by ~20–26% in systems without separation. In turn, separation and composting of digestate after WF led to an increase in emissions by 16–30%. For DF plants, it was 34–55%.
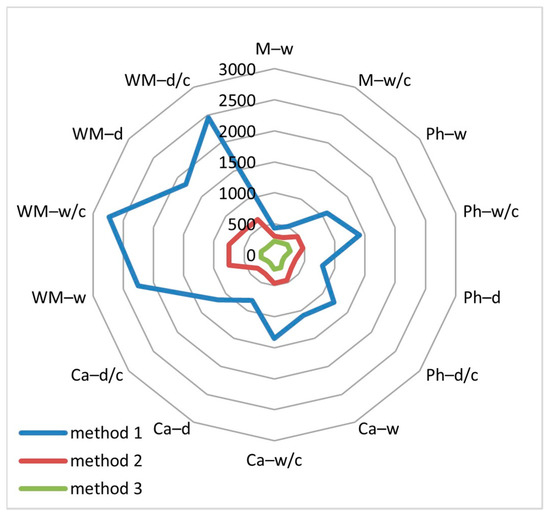
Figure 10.
Differences in the assessment of greenhouse gas emissions (g CO2 eq. kWhel.−1) related to anaerobic digestion depending on the calculation method. Method 1—all steps included in bioenergy production (from cultivation/harvest, operation of the biogas plant to the management of the digestate) together with emissions caused by manufacturing and processing of machinery and materials. Method 2—the cultivation and processing of the feedstock and operation of the biogas plant together with emissions caused by manufacturing and processing of machinery and materials. Method 3—the cultivation and processing of the feedstock and operation of the biogas plant without emissions caused by manufacturing and processing of machinery and materials.
Limiting the analysis to only the preparation of feedstock and operation of the AD plant and excluding (according to the Directive EU 2018/2001 [13]) emissions related to machinery and equipment production, much lower results were obtained (Figure 10). They ranged from 150 g CO2 eq. kWhel.−1 (System Ca–d) to 262 g CO2 eq. kWhel.−1 (System Ph–w).
4. Discussion
4.1. Searching for Substitutes for Energy Crops
Bioenergy is considered as a renewable substitution of fossil fuels, which may mitigate climate harming GHG emissions and contribute to energy security [84]. However, dedicated energy crops used as a feedstock in biorefineries receive growing caution because of their identified or anticipated negative impact on the environment [6,10,11,12]. Recently, the search for sustainable substitutes for dedicated energy crops has indicated the usefulness of wastes from agricultural and food production. Another possible feedstock is biomass from landscape management [85]. The conservation biomass which is a mixture of herbs, grasses, and woody material, has limited agricultural value, which virtually defines its practical application. Recently, it received much attention as a potential source of multipurpose renewable raw materials [86], including energy generation. Among the conversion technologies of biomass to energy, the utilization of wetland plants for biogas generation seems to be a promising and sustainable option, delivering energy [18], but also digestate, which can be applied as a soil fertilizer rich in carbon (C), nitrogen, and phosphorus [65].
The quality of feedstock and possible energy conversion pathways are highly determined by the timing of biomass harvest, which is often subordinate to conservation objectives and, to some extent, weather conditions and the accessibility of the land to machinery. Thus, very often, late mown biomass may have disadvantageous features compared to the commonly used feedstock, such as widely used dedicated energy crops, e.g., maize silage [23]. A severe deficiency of wetland feedstock is the relatively small biomass yield and the low specific biogas production. The biomass yield of common marsh plant communities with a dominance of Phalaris arundinacea, Glyceria maxima, Phragmites australis, Carex elata, and Carex lasiocarpa ranges between 1.4–9.3 tDM ha−1 [53]. The methane yield of grasses and wetland plants varies between 60 NL CH4 kgVS−1 [17] and 430 NL CH4 kgVS−1 [87]. Our previous study showed that the methane yield ranged from 102 to 221 NL CH4 kgVS−1 [53]. Moreover, biogas generation might be a reasonable utilization pathway for grassy biomass collected in mid- or late summer, as a late harvest in the fall harms methane potential [53]. Herrmann et al. [17] found that methane yields of grassy biomass decreased from up to 309 NL kgVS−1 in May to below 60 NL kgVS−1 in February and was correlated with increasing content of crude fiber. Among the vegetation of Alopecuretum pratensis, Molinietum caeruleae, and Caricetum gracilis, the biomass of Caricetum was the least suitable feedstock, recording a 25% lower methane yield compared to other vegetation types.
In this context, maize silage seems to have a significant advantage over conservation biomass, which consists of a higher yield per hectare (in NE Poland equals to 14.7 tDM ha−1) [50] and a more favorable methane potential (205–450 NL CH4 kgVS−1) [88], which directly results in significantly higher energy density per unit area. Our comparison of the energy performance of individual feedstocks to energy inputs for their extraction, transportation, operation of the biogas plant, and management of the digestate showed maize as the most energy-efficient substrate for biogas generation, which has already been demonstrated by, e.g., Pöschl et al. [89]. The final EE was very favorable, amounting to ~0.30 GJ GJ−1, even though maize required much higher energy input for cultivation and transportation compared to the conservation biomass. Due to a high energy density and relatively low impact on the environment related to supply logistics and land use, the maize silage is sometimes considered as a sustainable feedstock for biogas production. LCA by Poeschl et al. [90] suggested that maize silage, due to lower agricultural land occupation, can exert up to six times lower stress to ecosystem diversity compared to, e.g., grass silage.
Although Fernando et al. [91] advocate the cultivation of annual energy crops not to cause severer environmental conflicts than, e.g., potato and wheat farming, numerous research questions the sustainability of dedicated energy crops [6,10,11,12,92]. One of the most severe environmental burdens related to biogas production from maize and wheat is the disturbance of the nitrogen cycle and associated emissions [49]. Land for energy crops comes mostly from the displacement of other crops. Subventions of bioenergy markets often inflate the profitability of dedicated energy crops, which regionally can pose a competition to traditional forage and food production and affect the economy and social security of rural areas, i.e., by a rise of prices of other crops, trade in agricultural products, and land lease payments [93,94]. Demonstration of the limited ecological rationale behind extensive diverting of farmland or crops for biofuels production [95,96], combined with the ethical debate “food for fuel” [97,98], has resulted in increasing caution or even stepwise reversal of social and political attitudes towards first-generation biofuels [99].
4.2. Energy Efficiency and GHG Emissions from Energy Production Based on Conservation Biomass
Our results indicate that wetland biomass can provide a promising alternative pathway for sustainable biogas generation. However, the process is usually more energy-intensive compared to the AD of maize, and despite lower expenditures on the extraction of raw material, EE of that feedstock ranges from 0.29 GJ GJ−1 to 0.66 GJ GJ−1 (assuming the transportation distance amounts up to 15 km). Ignoring the digestate management stage, the results were 0.23 GJ GJ−1 for maize and 0.25–0.41 GJ GJ−1 for conservation biomass. The obtained values are consistent with the results of Pöschl et al. [89]. Comparing these results with the efficiency of production of other biofuels, e.g., ethanol, it was found that they are significantly lower than the production of ethanol from maize (0.91 GJ GJ−1), similar to the efficiency of ethanol production from sugar cane (0.27 GJ GJ−1) [100], while they are higher than those resulting from the production of ethanol from coffee pulp (0.17 GJ GJ−1) [101]. Expressing the obtained results as the ratio of total energy output/total energy input, the results were 3.18–4.05 and 1.52–3.40 for biogas from maize and biogas from conservation biomass, respectively. These values correspond to the ranges given by Arodudu et al. [102] for maize biogas, while they are higher in relation to maize ethanol production.
Garage-type DF is particularly advantageous because of the reduction in energy expenditures for feedstock treatment and the whole AD plant’s operation. This technology also alleviates other problems faced by WF working on grassy biomass from landscape management. Due to a high content of lignin, cellulose, and silica, the machinery/technology of WF biogas plants that process this feedstock must be much more robust than those that use maize or manure. Feeding technologies, such as screw conveyors or pumps, must be designed significantly more powerful, i.e., with a higher diameter of feeding pipes and material thickness. The same applies to the stirring technique [103].
The energy output, i.e., heat and electricity generated from one hectare of reeds or sedges, cannot match with maize. Generally, the much weaker biogas potential and energy density for the unit area compared to maize silage means that much larger areas are needed to obtain the same amount of energy. However, the entire process’s EE of DF of selected wetland feedstocks, which slightly exceeds 0.3 GJ GJ−1, may approach the EE of maize.
This estimate depends on the yield and methane potential of feedstocks. In this study, we used data that oscillated around or were even below the mean values found in published studies. Literature reveals a high variability in yield per hectare and biogas generation’s potential of the tested feedstocks. In fertile habitats, the crop of Phragmites may approach or even exceed the typical maize yield reported for NE Poland (~15 tDM ha−1) [50]. Specific biogas yields of Phragmites harvested in June reached 580 NL kgVS−1 [104], while the methane potential was reported to exceed ~300 NL CH4 kgVS−1 (harvested in May/June) [105], which is only slightly less than the average value for maize silage (~350 NL CH4 kgVS−1) [106].
Choosing less conservative data will yield another picture of the energy density of analyzed biomass. The differences in energy density between the “average scenario” presented in this study and the extreme (but possible) values are nearly 7-fold for Phragmites and 3–5-fold for the remaining feedstock. As a result, in an “optimistic” maximum scenario, the energy density of highly productive reed beds can be comparable to maize (Figure 11).
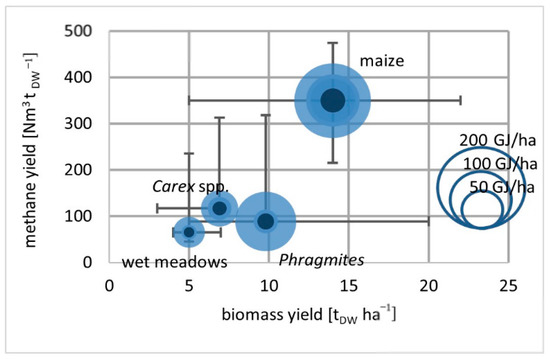
Figure 11.
Energy production from the anaerobic digestion (AD) of analyzed feedstocks related to biomass harvest and methane yield. Whiskers show the range of values represented on the x and y axes; blue circles show the energy yield per hectare (compare the legend on the right side of the graph): dark blue—the minimum value; blue—average value; light blue—maximum value (“optimistic scenario”).
Our analysis did not consider the transportation of liquid manure, which is the primary liquid substrate in many biogas plants. It was intentionally because, in NE Poland, investors of biogas plants (usually about 1 MW el.) cut costs and regularly decided to use tap water to liquefy the substrate. Including this factor in our calculations would impair the favorable position of maize silage as an energy source.
Biomass is often shown as a low-GHG alternative essential for the decarbonization of the energy supply system and mitigation of the threat of climate change [107], with a unique role of AD, as a robust and mature technology, expected to provide, apart from a stable and secure energy generation, opportunities for the local economy. Our assessments demonstrated that the expected input of AD of conservation biomass to reduce specific GHG emissions differed substantially depending on the applied feedstock, technology, and calculation approach.
The calculation of GHG emissions limited to the cultivation and processing of the feedstock and operation of the biogas plant without emissions from the production of machinery and equipment showed that, in the case of maize, it was lower by about 20% compared to the ethanol production from maize in the U.S. [100]. These values were similar, and in some cases lower than the GHG emissions from ethanol-directed crops calculated by Pereira et al. [108] who used life-cycle GHG emission models. Additionally, they presented high GHG reduction compared to the most emissive electricity generation from coal (median value ~1000 g CO2 eq. kWh−1 electricity) [107] that prevails in central European countries. AD of conservation biomass reduced GHG emissions from 74% in the WF system of Phragmites to 85% in the DF technology of sedges. These values indicated the possibility of saving GHG emissions from 738 to 850 g CO2 eq. kWhel.−1, which is consistent with the results of Bachmaier et al. [109]. The DF technology gives higher GHG reduction for all types of conservation biomass.
The addition of GHG emissions from the production of machinery and equipment used in the cultivation and processing of the feedstock and operation of the biogas plant gave much less favorable results. The DF technology reduced GHG emissions by 37% (wet meadows) to 66% (Carex spp.), while the WF process reduced GHG by 25% (wet meadows) and 54% (Carex spp.).
The GHG emissions calculated for all steps of the AD process (starting from harvest, through the operation of the biogas plant to the management of digestate with emissions from the production of machinery and materials) showed that only the DF of Phragmites (21%) and Carex spp. (18%) without separation of digestate were lower compared to electricity generation from coal. All other systems emitted more GHG than coal, with the highest GHG yield found for the WF of wet meadows biomass.
In fact, compared to modern-to-advanced hard coal power plants (specific GHG 710–950 g CO2 eq. kWh−1) and natural gas combined-cycle plants (410–650 g CO2 eq. kWh−1) [107], AD of the wetland feedstocks yielded similar or even higher GHG emissions per kWh of electricity, which seems to question its future validity as a low-GHG energy supply technology.
Furthermore, our analysis did not comprise energy losses by transmission and distribution (included in the estimates by Bruckner et al. [107]) that would additionally weaken the potency of the AD of conservation biomass for low-carbon development. Notwithstanding the above, the results suggest that, for the current Polish power system (856 g CO2 eq. kWh−1 for electricity generated by the biggest electricity supplier in NE Poland [75]), which is based on coal, AD of grassy biomass may still be considered as an attractive climate mitigation technology.
The primary analyzed feedstock (that is, conservation biomass) is obtained in wetlands, both protected and economically used for agriculture. If performed following conservation recommendations; harvesting biomass is treated as a measure protecting the biodiversity of open ecosystems. It does not trigger a loss of ecosystems or extensive environmental burdens, like an intensified production in agroecosystems or land-use changes.
5. Conclusions: Climate—Wetlands—Nature Conservation
The extensive management of wetlands and grasslands has been widely approved as a useful measure towards protecting their landscape and ecosystem functions. More recently, biomass generated during the management of nature conservation areas was identified as a sustainable source of renewable energy [85]. Our results indicate that wetland biomass can provide a promising alternative pathway for sustainable biogas generation. The process is, however, more energy-intensive compared to the AD of maize silage. The expected input of conservation biomass to reduce GHG emissions differed depending on the applied feedstock, AD technology, and calculation method. The calculation of GHG emissions according to the RED II methodology [13] gives very favorable results, which suggest that, compared to coal-based energy, the AD of conservation biomass can reduce GHG emissions by 74% in the WF system of Phragmites to 85% in the DF technology of sedges. The DF gives higher GHG reduction for all types of conservation biomass. However, the full analysis, covering the entire process “from field to field”—from obtaining the feedstock to the agricultural management of the digestate, gave results that disqualified conservation biomass as valid low-GHG energy supply technology.
Finally, there is some well-founded concern that loss of biomass through harvesting can disrupt the essential climatic functions of wetlands, e.g., the long-term storage of CO2 [110]. C released during the energetic conversion of biomass is part of the global cycle of biogenic C and does not affect the amount of C in circulation. However, it is likely that through the extraction of biomass, we will lose the potential of wetlands to offset CO2 from the combustion of fossil fuels and balance out the inevitable C footprint.
Further research is needed to improve our understanding of the effects of biomass extraction for energy purposes on wetland ecosystem services, i.e., C capture and storage.
Author Contributions
Conceptualization, R.C., A.W.-C. and P.B.; formal analysis, R.C. and A.W.-C.; investigation, R.C. and A.W.-C.; writing—original draft preparation, R.C., A.W.-C. and P.B.; visualization, R.C., A.W.-C. and P.B.; writing—review and editing: P.B.; project administration, P.B. All authors have read and agreed to the published version of the manuscript.
Funding
This work was financially supported by the Ministry of Science and Higher Education as part of the project WZ/WB-IIŚ/1/2020.
Conflicts of Interest
The authors declare no conflict of interest.
References
- Brief on Biomass for Energy in the European Union. The European Commission’s Knowledge Centre for Bioeconomy, European Union. Available online: https://publications.jrc.ec.europa.eu/repository/bitstream/JRC109354/biomass_4_energy_brief_online_1.pdf (accessed on 15 September 2020).
- Koponen, K.; Sokka, L.; Salminen, O.; Sievänen, R.; Pingoud, K.; Ilvesniemi, H.; Routa, J.; Ikonen, T.; Koljonen, T.; Alakangas, E.; et al. Sustainability of forest energy in Northern Europe. In VTT Technology 237; VTT Technical Research Centre of Finland Ltd: Espoo, Finland, 2015. [Google Scholar]
- Welfle, A.; Gilbert, P.; Thornley, P. Increasing biomass resource availability through supply chain analysis. Biomass Bioenergy 2014, 70, 249–266. [Google Scholar] [CrossRef]
- Popp, J.; Lakner, Z.; Harangi-Rákos, M.; Fári, M. The effect of bioenergy expansion: Food, energy, and environment. Renew. Sustain. Energ. Rev. 2014, 32, 559–578. [Google Scholar] [CrossRef]
- Paolini, V.; Petracchini, F.; Segreto, M.; Tomassetti, L.; Naja, N.; Cecinato, A. Environmental impact of biogas: A short review of current knowledge. J. Environ. Sci. Health A 2018, 53, 899–906. [Google Scholar] [CrossRef] [PubMed]
- Wu, Y.; Zhao, F.; Liu, S.; Wang, L.; Qiu, L.; Alexandrov, G.; Jothiprakash, V. Bioenergy production and environmental impacts. Geosci. Lett. 2018, 5, 8886. [Google Scholar] [CrossRef]
- Reid, W.V.; Ali, M.K.; Field, C.B. The future of bioenergy. Glob Chang. Biol. 2020, 26, 274–286. [Google Scholar] [CrossRef]
- Kluts, I.; Wicke, B.; Leemans, R.; Faaij, A. Sustainability constraints in determining European bioenergy potential: A review of existing studies and steps forward. Renew. Sustain. Energy Rev. 2017, 69, 719–734. [Google Scholar] [CrossRef]
- Odum, H.T. Environment, Power, and Society for the Twenty-First Century: The Hierarchy of Energy; Columbia University Press: New York, NY, USA, 2007. [Google Scholar]
- Hof, C.; Voskamp, A.; Biber, M.F.; Böhning-Gaese, K.; Engelhardt, E.-K.; Niamir, A.; Willis, S.G.; Hickler, T. Bioenergy cropland expansion may offset positive effects of climate change mitigation for global vertebrate diversity. Proc. Natl. Acad. Sci. USA 2018, 115, 13294–13299. [Google Scholar] [CrossRef]
- Solinas, S.; Deligios, P.A.; Sulas, L.; Carboni, G.; Virdis, A.; Ledda, L. A land-based approach for the environmental assessment of Mediterranean annual and perennial energy crops. Eur. J. Agron. 2019, 103, 63–72. [Google Scholar] [CrossRef]
- Couto, A.A., Jr.; da Conceição, F.T.; Fernandes, A.M.; Spatti, E.P., Jr.; Lupinacci, C.M.; Moruzzi, R.B. Land use changes associated with the expansion of sugar cane crops and their influences on soil removal in a tropical watershed in São Paulo State (Brazil). Catena 2019, 172, 313–323. [Google Scholar] [CrossRef]
- Directive (EU) 2018/2001 of the European Parliament and of the Council of 11 December 2018 on the Promotion of the Use of Energy from Renewable Sources (Text with EEA Relevance). Off. J. Eur. Union 2018, L 328, 82–209. Available online: https://eur-lex.europa.eu/legal-content/EN/TXT/?uri=uriserv:OJ.L_.2018.328.01.0082.01.ENG&toc=OJ:L:2018:328:TOC (accessed on 2 September 2020).
- Tye, H. The Lowland Grasslands of Central and Eastern Europe; Monographic Series 004; IUCN, East European Programme; Information Press: Oxford, UK, 1991. [Google Scholar]
- Diekmann, M.; Andres, C.; Becker, T.; Bennie, J.; Blüml, V.; Bullock, J.M.; Culmsee, H.; Fanigliulo, M.; Hahn, A.; Heinken, T.; et al. Patterns of long-term vegetation change vary between different types of semi-natural grasslands in Western and Central Europe. J. Veg. Sci. 2019, 30, 187–202. [Google Scholar] [CrossRef]
- Kołos, A.; Banaszuk, P. Mowing may bring about vegetation change, but its effect is strongly modified by hydrological factors. Wetl. Ecol. Manag. 2018, 26, 879–892. [Google Scholar] [CrossRef]
- Herrmann, C.; Prochnow, A.; Heiermann, M.; Idler, C. Biomass from landscape management of grassland used for biogas production: Effects of harvest date and silage additives on feedstock quality and methane yield. Grass Forage Sci. 2013, 69, 549–566. [Google Scholar] [CrossRef]
- Roj-Rojewski, S.; Wysocka-Czubaszek, A.; Czubaszek, R.; Banaszuk, P. Does wetland biomass provide an alternative to maize in biogas generation? In Renewable Energy Sources: Engineering, Technology, Innovation; Springer Proceedings in Energy; Mudryk, K., Werle, S., Eds.; Springer International Publishing: Cham, Switzerland, 2018; pp. 127–137. [Google Scholar] [CrossRef]
- Noll, R.; Wern, B.; Peters, W.; Schicketanz, S.; Kinast, P.; Müller-Rüster, G.; Clemens, D. Naturschutzbezogene Optimierung der Rohstoffbereitstellung für Biomasseanlage, Endbericht im Projekt BiogasNatur, BfN-Skripten 555; Bundesamt für Naturschutz: Bonn-Bad Godesberg, Germany, 2020. [Google Scholar]
- Dornburg, V.; van Vuuren, D.; van de Ven, G.; Langeveld, H.; Meeusen, M.; Banse, M.; van Oorschot, M.; Ros, J.; van den Born, G.J.; Aiking, H.; et al. Bioenergy revisited: Key factors in global potentials of bioenergy. Energy Environ. Sci. 2010, 3, 258–267. [Google Scholar] [CrossRef]
- Pfau, S.F.; Hanssen, S.V.; Straatsma, M.W.; Koopman, K.R.; Leuven, R.S.E.W.; Huijbregts, M.A.J. Life cycle greenhouse gas benefits or burdens of residual biomass from landscape management. J. Clean. Prod. 2019, 220, 698–706. [Google Scholar] [CrossRef]
- Banaszuk, P.; Kamocki, A.K.; Wysocka-Czubaszek, A.; Czubaszek, R.; Roj-Rojewski, S. Closing the loop—Recovery of nutrients and Energy from wetland biomass. Ecol. Eng. 2020, 143, 105–643. [Google Scholar] [CrossRef]
- Sauter, P.; Billig, E.; Döhling, F.; Pilz, A.; Brosowski, A.; Kirsten, C.; Bosch, J.; Büchner, D.; Majer, S.; Weller, N.; et al. Grünlandenergie Havelland Entwicklung von üBertragbaren Konzepten zur Naturverträglichen Energetischen Nutzung von Gras und Schilf am Beispiel der Region Havelland (Endbericht); Deutsches Biomasse Forschungs Zentrum (DBFZ): Leipzig, Germany, 2013. [Google Scholar]
- Bacenetti, J.; Sala, C.; Fusi, A.; Fiala, M. Agricultural anaerobic digestion plants: What LCA studies pointed out and what can be done to make them more environmentally sustainable. Appl. Energe 2016, 179, 669–686. [Google Scholar] [CrossRef]
- Hijazi, O.; Munro, S.; Zerhusen, B.; Effenberger, M. Review of life cycle assessment for biogas production in Europe. Renew. Sustain. Energe Rev. 2016, 54, 1291–1300. [Google Scholar] [CrossRef]
- Ertem, F.C.; Neubauer, P.; Junne, S. Environmental life cycle assessment of biogas production from marine macroalgal feedstock for the substitution of energy crops. J. Clean. Prod. 2017, 140, 977–985. [Google Scholar] [CrossRef]
- Lansche, J.; Müller, J. Life cycle assessment (LCA) of biogas versus dung combustion household cooking systems in developing countries—A case study in Ethiopia. J. Clean. Prod. 2017, 165, 828–835. [Google Scholar] [CrossRef]
- Mezzullo, W.G.; McManus, M.C.; Hammond, G.P. Life cycle assessment of a small-scale anaerobic digestion plant from cattle waste. Appl. Energy 2013, 102, 657–664. [Google Scholar] [CrossRef]
- Buratti, C.; Babanera, M.; Fantozzi, F. Assessment of GHG emissions of biomethane from energy cereal crops in Umbria, Italy. Appl. Energy 2013, 108, 128–136. [Google Scholar] [CrossRef]
- Chen, B.; Chen, S. Life cycle assessment of coupling household biogas production to agricultural industry: A case study of biogas-linked persimmon cultivation and processing system. Energy Policy 2013, 62, 707–716. [Google Scholar] [CrossRef]
- Di Maria, F.; Sisani, F. Greenhouse gas emissions and environmental impact from recycling the organic fraction of solid waste: Comparison of different treatment schemes from a life cycle perspective. Recycling 2017, 2, 13. [Google Scholar] [CrossRef]
- Hijazi, O.; Tappen, S.; Effenberger, M. Environmental impacts concerning flexible power generation in a biogas production. Carbon Resour. Convers. 2019, 2, 117–125. [Google Scholar] [CrossRef]
- Lask, J.; Guajardo, A.M.; Weik, J.; von Cossel, M.; Lewandowski, I.; Wagner, M. Comparative environmental and economic life cycle assessment of biogas production from perennial wild plant mixtures and maize (Zea mays L.) in southwest Germany. GCB Bioenergy 2020, 12, 571–585. [Google Scholar] [CrossRef]
- Woon, K.S.; Lo, I.M.C.; Chiu, S.L.H.; Yan, D.Y.S. Environmental assessment of food waste valorization in producing biogas for various types of energy use based on LCA approach. Waste Manag. 2016, 50, 290–299. [Google Scholar] [CrossRef] [PubMed]
- Bartocci, P.; Zampilli, M.; Liberti, F.; Pistolesi, V.; Massoli, S.; Bidini, G.; Fantozzi, F. LCA analysis of food waste co-digestion. Sci. Total Environ. 2020, 709, 136–187. [Google Scholar] [CrossRef]
- Brunklaus, B.; Rex, E.; Carlsson, E.; Berlin, J. The future of Swedish food waste: An environmental assessment of existing and prospective valorization techniques. J. Clean. Prod. 2018, 202, 1–10. [Google Scholar] [CrossRef]
- Bühle, L.; Hensgen, F.; Donnison, I.; Heinsoo, K.; Wachendorf, M. Life cycle assessment of the integrated generation of solid fuel and biogas from biomass (IFBB) in comparison to different energy recovery, animal-based and non-refining management systems. Bioresour. Technol. 2012, 111, 230–239. [Google Scholar] [CrossRef]
- Colón, J.; Cadena, E.; Pognani, M.; Barrena, R.; Sánchez, A.; Font, X.; Artola, A. Determination of the energy and environmental burdens associated with the biological treatment of source-separated Municipal Solid Wastes. Energy Environ. Sci. 2012, 2, 5731–5741. [Google Scholar] [CrossRef]
- Evangelisti, S.; Lettieri, P.; Borello, D.; Clift, C. Life cycle assessment of energy from waste via anaerobic digestion: A UK case study. Waste Manag. 2014, 34, 226–237. [Google Scholar] [CrossRef] [PubMed]
- Budzianowski, W.M.; Postawa, K. Renewable energy from biogas with reduced carbon dioxide footprint: Implications of applying different plant configurations and operating pressures. Renew. Sustain. Energy Rev. 2017, 68, 852–868. [Google Scholar] [CrossRef]
- Börjesson, P.; Berglund, M. Environmental system analysis of biogas systems - Part I: Fuel-cycle emissions. Biomass Bioenergy 2005, 30, 469–485. [Google Scholar] [CrossRef]
- Collet, P.; Hélias, A.; Lardon, L.; Ras, M.; Goy, R.A.; Steyer, J.P. Life-cycle assessment of microalgae culture coupled to biogas production. Bioresour. Technol. 2011, 102, 207–214. [Google Scholar] [CrossRef]
- Berglund, M.; Börjesson, P. Assessment of energy performance in the life-cycle of biogas production. Biomass Bioenergy 2006, 30, 254–266. [Google Scholar] [CrossRef]
- Chevalier, C.; Meunier, F. Environmental assessment of biogas co- or tri-generation units by life cycle analysis methodology. Appl. Therm. Eng. 2005, 25, 3025–3041. [Google Scholar] [CrossRef]
- Timonen, K.; Sinkko, T.; Luostarinen, S.; Tampio, E.; Joensuu, K. LCA of anaerobic digestion: Emission allocation for energy and digestate. J. Clean. Prod. 2019, 235, 1567–1579. [Google Scholar] [CrossRef]
- Lyng, K.-A.; Brekke, A. Environmental Life Cycle Assessment of biogas as a fuel for transport compared with alternative fuels. Energies 2019, 12, 532. [Google Scholar] [CrossRef]
- Florio, C.; Fiorentino, G.; Corcelli, F.; Ulgiati, S.; Dumontet, S.; Güsewell, J.; Eltrop, L. A Life Cycle Assessment of biomethane production from waste feedstock through different upgrading technologies. Energies 2019, 12, 718. [Google Scholar] [CrossRef]
- Bacenetti, J.; Negri, M.; Fiala, M.; González-García, S. Anaerobic digestion of different feedstocks: Impact on energetic and environmental balances of biogas process. Sci. Total Environ. 2013, 463–464, 541–551. [Google Scholar] [CrossRef]
- Bacenetti, J.; Fusi, A.; Negri, M.; Guidetti, R.; Fiala, M. Environmental assessment of two different crop systems in terms of biomethane potential production. Sci. Total Environ. 2014, 466–467, 1066–1077. [Google Scholar] [CrossRef] [PubMed]
- Statistics Poland. Production of Agricultural and Horticultural Crops in 2017; Statistical information, Statistics Poland: Warsaw, Poland, 2018. [Google Scholar]
- Thrän, D.; Lenz, V.; Zeller, V.; Schwenker, A.; Lorenz, H.; Peters, W. Gutachterliche Einordnung des Landschaftspflegebonus im EEG 2009; Deutsches Biomasse Forschungs Zentrum (DBFZ): Leipzig, Germany, 2009. [Google Scholar]
- Al Seadi, T. Biogas Handbook; University of Southern Denmark: Esbjerg, Denmark, 2008. [Google Scholar]
- Roj-Rojewski, S.; Wysocka-Czubaszek, A.; Czubaszek, R.; Kamocki, A.; Banaszuk, P. Anaerobic digestion of wetland biomass from conservation management for biogas production. Biomass Bioenergy 2019, 122, 126–132. [Google Scholar] [CrossRef]
- Wilken, D.; Rauh, S.; Fruhner-Weiß, R.; Strippel, F.; Bontempo, G.; Kramer, A.; Fürst, M.; Wiesheu, M.; Kedia, G.; Hernández Chanto, C.; et al. Digestate as fertilizer. Biogas Know-How 4; Fachverband Biogas e.V.: Freising, Germany, 2018. [Google Scholar]
- Holka, M.; Bieńkowski, J.; Jankowiak, J. Cumulated energy consumption in intensive crop production (in Polish). Fragm. Agron. 2019, 36, 16–26. [Google Scholar] [CrossRef]
- Pawlak, J. Consumption of the diesel oil in Polish agriculture (in Polish). Probl. Agric. Eng. 2012, 3, 57–64. [Google Scholar]
- Evrenosoğlu, M.; Borowski, P. An optimization study on corn silage mechanization in Ege University Agricultural Research Farm. J. Agric. Mach. Sci. 2014, 10, 87–92. [Google Scholar]
- Budzyński, W.; Szempliński, W.; Parzonka, A.; Sałek, T. Agricultural, energy and economic efficiency of biomass production of selected plant species for biogas. In Model Agro-Energy Complexes: Technologies for Obtaining and Conditioning Agricultural and Water Biomass for Biogas Plants and Gas Generators; Gołaszewski, J., Ed.; Wydawnictwo UWM: Olsztyn, Poland, 2014; pp. 11–282. (In Polish) [Google Scholar]
- ÖKL-Richtwerte für die Maschinenselbstkosten 2008; Österreichisches Kuratorium für Landtechnik und Landentwicklung: Wien, Austria, 2008.
- Li, Y.; Manandhar, A.; Li, G.; Shah, A. Life cycle assessment of integrated solid state anaerobic digestion and composting for on-farm organic residues treatment. Waste Manag. 2018, 76, 294–305. [Google Scholar] [CrossRef] [PubMed]
- Souček, J.; Kocánová, V.; Novák, M. Parameters of energy crop biomass handling. Res. Agric. Eng. 2007, 53, 161–165. [Google Scholar] [CrossRef]
- Piętak, A.; Meus, M.; Nitkiewicz, S. The demand analysis of the biogas plant with CHP system on substrate, the aim to obtain required electrical and thermal power. J. Kones Powertrain Transp. 2012, 19, 335–344. [Google Scholar] [CrossRef]
- Agostini, A.; Battini, F.; Giuntoli, J.; Tabaglio, V.; Padella, M.; Baxter, D.; Marelli, L.; Amaducci, S. Environmentally sustainable biogas? The key role of manure co-digestion with energy crops. Energies 2015, 8, 5234–5265. [Google Scholar] [CrossRef]
- López-Vázquez, A.; Cadena-Zapata, M.; Campos-Magaña, S.; Zermeño-Gonzalez, A.; Mendez-Dorado, M. Comparison of energy used and effects on bulk density and yield by tillage systems in a semiarid condition of Mexico. Agronomy 2019, 9, 189. [Google Scholar] [CrossRef]
- Wysocka-Czubaszek, A.; Czubaszek, R.; Roj-Rojewski, S.; Banaszuk, P. The fate of nitrogen derived from mown wetland biomass in a swampy river valley landscape. Mires Peat 2019, 25, 1–13. [Google Scholar] [CrossRef]
- Gáborčík, N. Relationship between contents of chlorophyll (a+b) (SPAD values) and nitrogen of some temperate grasses. Photosynthetica 2003, 41, 285–287. [Google Scholar] [CrossRef]
- Journal of Laws. Act. of 10 July 2007 on Fertilisers and Fertilizing; Journal of Laws of 2007, No. 147, Item 1033; Prime Minister of Poland: Warsaw, Poland, 2007.
- Breitenbeck, G.A.; Schellinger, D. Calculating the reduction in material mass and volume during composting. Compos. Sci. Util. 2004, 12, 365–371. [Google Scholar] [CrossRef]
- Tiquia, S.M.; Richard, T.L.; Honeyman, M.S. Carbon, nutrient, and mass loss during composting. Nutr. Cycl. Agroecosys. 2002, 62, 15–24. [Google Scholar] [CrossRef]
- Eghball, B.; Power, J.F.; Gilley, J.E.; Doran, J.W. Nutrient, carbon, and mass loss during composting of beef cattle feedlot manure. J. Environ. Qual. 1997, 26, 189–193. [Google Scholar] [CrossRef]
- Uvarov, R.; Briukhanov, A.; Shalavina, E. Study results of mass and nutrient loss in technologies of different composting rate: Case of bedding poultry manure. In Proceedings of the 15th International Scientific Conference Engineering for Rural Development, Jelgava, Latvia, 25–27 May 2016; 851–857. [Google Scholar]
- Franke-Whittle, I.H.; Confalonieri, A.; Insam, H.; Schlegelmilch, M.; Körner, I. Changes in the microbial communities during co-composting of digestates. Waste Manag. 2014, 34, 632–641. [Google Scholar] [CrossRef]
- Giuntoli, J.; Agostini, A.; Edwards, R.; Marelli, L. Solid and Gaseous Bioenergy Pathways: Input Values and GHG Emissions. Calculated According to the Methodology Set in COM(2016) 767, EUR 27215 EN; Publications Office of the European Union: Luxembourg, 2017. [Google Scholar] [CrossRef]
- Lazzerini, G.; Migliorini, P.; Moschini, V.; Pacini, C.; Merante, P.; Vazzana, C. A simplified method for the assessment of carbon balance in agriculture: An application in organic and conventional micro-agroecosystems in a long-term experiment in Tuscany, Italy. Ital. J. Agron. 2014, 9, 55–62. [Google Scholar] [CrossRef]
- PGE. Communication on the Structure of Fuels; Polska Grupa Energetyczna: Rzeszów, Poland, 2020. (In Polish) [Google Scholar]
- BioGrace-II. BioGrace-II GHG Calculation Tool for Electricity, Heat and Cooling—Version 3. 2015. Available online: https://www.biograce.net/app/webroot/biograce2/content/ghgcalculationtool_electricityheatingcooling/overview (accessed on 2 September 2020).
- Eggleston, H.S.; Miwa, K.; Srivastava, N.; Tanabe, K. 2006 IPCC Guidelines for National Greenhouse Gas. Inventories—A Primer, Prepared by the National Greenhouse Gas. Inventories Programme; Institute for Global Environmental Strategies (IGES): Hayama, Japan, 2008. [Google Scholar]
- Andersen, J.K.; Boldrin, A.; Christensen, T.H.; Scheutz, C. Mass balances and life-cycle inventory for a garden waste windrow composting plant (Aarhus, Denmark). Waste Manag. Res. 2010, 28, 1010–1020. [Google Scholar] [CrossRef]
- Boldrin, A.; Andersen, J.K.; Møller, J.; Christensen, T.H.; Favoino, E. Composting and compost utilization: Accounting of greenhouse gases and global warming contributions. Waste Manag. Res. 2009, 27, 800–812. [Google Scholar] [CrossRef]
- IPCC. 9th Corrigenda for the 2006 IPCC Guidelines. Intergovernmental Panel on Climate Change. Available online: http://www.ipcc-nggip.iges.or.jp/public/2006gl/corrigenda9.html. (accessed on 18 September 2020).
- Olecka, A.; Bebkiewicz, K.; Chłopek, Z.; Dębski, B.; Doberska, A.; Jędrysiak, P.; Kanafa, M.; Kargulewicz, I.; Rutkowski, J.; Sędziwa, M.; et al. Poland’s National Inventory Report 2019. In Greenhouse Gas Inventory for 1988-2017; Submission under the UN Framework Convention on Climate Change and its Kyoto Protocol; National Centre for Emissions Management at the Institute of Environmental Protection—National Research Institute: Warsaw, Poland, 2019. [Google Scholar]
- Sánchez, A.; Artola, A.; Font, X.; Gea, T.; Barrena, R.; Gabriel, D.; Sánchez-Monedero, M.Á.; Roig, A.; Cayuela, M.L.; Mondini, C. Greenhouse gas emissions from organic waste composting. Environ. Chem. Lett. 2015, 13, 223–238. [Google Scholar] [CrossRef]
- NL Agency. Methodology CO2—Tool for Electricity, Gas, and Heat from Biomass, version 1; Ministry of Economic Affairs, Agriculture and Innovation: Den Haag, The Netherlands, 2011.
- Hoekman, S.K.; Broch, A. Environmental implications of higher ethanol production and use in the U.S.: A literature review. Part II—Biodiversity, land use change, GHG emissions, and sustainability. Renew. Sustain. Energy Rev. 2018, 81, 3159–3177. [Google Scholar] [CrossRef]
- Phillips, D.; Mitchell, E.J.S.; Lea-Langton, A.R.; Parmar, K.R.; Jones, J.M.; Williams, A. The use of conservation biomass feedstocks as potential bioenergy resources in the United Kingdom. Bioresour. Technol. 2016, 212, 271–279. [Google Scholar] [CrossRef] [PubMed]
- Wichtmann, W.; Schröder, C.; Joosten, H. (Eds.) Paludiculture—Productive Use of Wet Peatlands. Climate Protection—Biodiversity—Regional Economic Benefits, 1st ed.; Schweizerbart Science Publisher: Stuttgart, Germany, 2016. [Google Scholar]
- Lehtomäki, A. Biogas Production from Energy Crops and Crop Residues. Ph.D. Thesis, University of Jyväskylä, Jyväskylä, Finland, 2006. [Google Scholar]
- Murphy, J.; Braun, R.; Weiland, P.; Wellinger, A. Biogas from Crop. Digestion. IEA Bioenergy, Task 37—Energy from Biogas. 2011. Available online: https://www.ieabioenergy.com/wp-content/uploads/2011/10/Update_Energy_crop_2011.pdf (accessed on 10 October 2020).
- Pöschl, M.; Ward, S.; Owende, P. Evaluation of energy efficiency of various biogas production and utilization pathways. Appl. Energy 2010, 87, 3305–3321. [Google Scholar] [CrossRef]
- Poeschl, M.; Ward, S.; Owende, P. Environmental impacts of biogas deployment—Part II: Life cycle assessment of multiple production and utilization pathways. J. Clean. Prod. 2012, 24, 184–201. [Google Scholar] [CrossRef]
- Fernando, A.L.; Duarte, M.P.; Almeida, J.; Boléo, S.; Mendes, B. Environmental impact assessment of energy crops cultivation in Europe. Biofuels Bioprod. Biorefining 2010, 4, 594–604. [Google Scholar] [CrossRef]
- Wysocka-Czubaszek, A.; Czubaszek, R.; Roj-Rojewski, S.; Banaszuk, P. Methane and nitrous oxide emissions from agriculture on a regional scale. J. Ecol. Eng. 2018, 19, 206–217. [Google Scholar] [CrossRef]
- Von Carsten, H.E.; Theuvsen, L. Einfluss der Biogasproduktion auf den regionalen Pachtmarkt. Ber. Ldw. 2012, 90, 84–112. [Google Scholar]
- Sands, R.D.; Malcolm, S.A.; Suttles, S.A.; Marshall, E. Dedicated Energy Crops and Competition for Agricultural Land; Economic Research Report 223; United States Department of Agriculture: Washington, DC, USA, 2017.
- European Environment Agency. How Much Bioenergy Can. Europe Produce Without Harming the Environment? EEA Report 7; Office for Official Publications of the European Communities: Copenhagen, Denmark, 2006. [Google Scholar]
- Fahrig, L.; Baudry, J.; Brotons, L.; Burel, F.G.; Crist, T.O.; Fuller, R.J.; Sirami, C.; Siriwardena, G.M.; Martin, J.-L. Functional landscape heterogeneity and animal biodiversity in agricultural landscapes. Ecol. Lett. 2011, 14, 101–112. [Google Scholar] [CrossRef]
- Tanenbaum, D.J. Food vs. Fuel. Diversion of crops could cause more hunger. Environ. Health Perspect. 2008, 116, A254–A257. [Google Scholar] [CrossRef]
- Prasad, S.; Ingle, A.P. Impacts of sustainable biofuels production from biomass. In Sustainable Bioenergy. Advances and Impacts; Rai, M., Ingle, A., Eds.; Elsevier: Amsterdam, The Netherlands; Oxford, UK, 2019; pp. 327–346. [Google Scholar] [CrossRef]
- Von Bauhus, J.; Christen, O.; Dabbert, S.; Gauly, M.; Heissenhuber, A.; Hess, J.; Isermeyer, F.; Kirschke, D.; Latacz-Lohmann, U.; Otte, A.; et al. Ernährungssicherung und nachhaltige Produktivitätssteigerung Stellungnahme des Wissenschaftlichen Beirats für Agrarpolitik beim Bundesministerium für Ernährung, Landwirtschaft und Verbraucherschutz. Ber. Ldw. 2012, 90, 5–34. [Google Scholar]
- Dias de Oliveira, M.E.; Vaughan, B.E.; Rykiel, E.J., Jr. Ethanol as fuel: Energy, carbon dioxide balances, and ecological footprint. BioScience 2005, 55, 593–602. [Google Scholar] [CrossRef]
- Gurram, R.; Al-Shannag, M.; Knapp, S.; Das, T.; Singsaas, E.; Alkasrawi, M. Technical possibilities of bioethanol production from coffee pulp: A renewable feedstock. Clean. Technol. Environ. Policy 2016, 18, 269–278. [Google Scholar] [CrossRef]
- Arodudu, O.; Helming, K.; Wiggering, H.; Voinov, A. Bioenergy from low-Intensity agricultural systems: An energy efficiency analysis. Energies 2017, 10, 29. [Google Scholar] [CrossRef]
- Ahlers, J.-G. Gas aus Gras. Biogas J. 2008, 2, 46–49. [Google Scholar]
- Hartung, C.; Andrade, D.; Dandikas, V.; Eickenscheidt, T.; Drösler, M.; Zollfrank, C.; Heuwinkel, H. Suitability of paludiculture biomass as biogas substrate—Biogas yield and long-term effects on anaerobic digestion. Renew. Energy 2020, 159, 64–71. [Google Scholar] [CrossRef]
- Dragoni, F.; Giannini, V.; Ragaglini, G.; Bonari, E.; Silvestri, N. Effect of harvest time and frequency on biomass quality and biomethane potential of common reed (Phragmites australis) under paludiculture conditions. Bioenergy Res. 2017, 10, 1066–1078. [Google Scholar] [CrossRef]
- Eder, J.; Eder, B.; Hofmann, D.; Darnhofer, B.; Lichti, F. Silomais als Biogassubstrat. Bayern Biogas Forum 2012, I–4, 1–12. [Google Scholar]
- Bruckner, T.; Bashmakov, I.A.; Mulugetta, Y.; Chum, H.; de la Vega Navarro, A.; Edmonds, J.; Faaij, A.; Fungtammasan, B.; Garg, A.; Hertwich, E.; et al. Energy Systems. In Climate Change 2014: Mitigation of Climate Change. Contribution of Working Group III to the Fifth Assessment Report of the Intergovernmental Panel on Climate Change; Edenhofer, O., Pichs-Madruga, R., Sokona, Y., Farahani, E., Kadner, S., Seyboth, K., Adler, A., Baum, I., Brunner, S., Eickemeier, P., et al., Eds.; Cambridge University Press: Cambridge, UK; New York, NY, USA, 2014. [Google Scholar]
- Pereira, L.G.; Cavalett, O.; Bonomi, A.; Zhang, Y.; Warner, E.; Chum, H.L. Comparison of biofuel life-cycle GHG emissions assessment tools: The case studies of ethanol produced from sugarcane, corn, and wheat. Renew. Sustain. Energy Rev. 2019, 110, 1–12. [Google Scholar] [CrossRef]
- Bachmaier, J.; Effenberger, M.; Gronauer, A. Greenhouse gas balance and resource demand of biogas plants in agriculture. Eng. Life Sci. 2010, 10, 560–569. [Google Scholar] [CrossRef]
- Watkins, S.C.; Baldwin, D.S.; Waudby, H.P.; Ning, S.E.M.A. Managing rain-filled wetlands for carbon sequestration: A synthesis. Rangel. J. 2017, 39, 145–152. [Google Scholar] [CrossRef]


Publisher’s Note: MDPI stays neutral with regard to jurisdictional claims in published maps and institutional affiliations. |
© 2020 by the authors. Licensee MDPI, Basel, Switzerland. This article is an open access article distributed under the terms and conditions of the Creative Commons Attribution (CC BY) license (http://creativecommons.org/licenses/by/4.0/).