Article

Dutch Offshore Wind Atlas Validation against Cabauw Meteomast Wind Measurements

1
Royal Netherlands Meteorological Institute (KNMI), Utrechtseweg 297, 3731 GA De Bilt, The Netherlands
2
Faculty of Civil Engineering and Geosciences, Delft University of Technology, Stevinweg 1, 2628 CN Delft, The Netherlands
*
Author to whom correspondence should be addressed.
Current address: SkyGeo, Oude Delft 175, 2611 HB Delft, The Netherlands.
Energies 2020, 13(24), 6558; https://doi.org/10.3390/en13246558
Submission received: 26 October 2020 / Revised: 26 November 2020 / Accepted: 9 December 2020 / Published: 11 December 2020
(This article belongs to the Section A3: Wind, Wave and Tidal Energy)

Abstract

:
The Dutch Offshore Wind Atlas (DOWA) is validated against wind speed and direction measurements from the Cabauw meteorological mast for a 10-year period and at heights between 10 m and 200 m. The validation results are compared to the Royal Netherlands Meteorological Institute (KNMI) North Sea Wind (KNW) atlas. It is found that the average difference (bias) between DOWA wind speeds and those measured at Cabauw varies for the different heights between −0.1 m/s to 0.3 m/s. Significant differences between DOWA and KNW are only found at altitudes of 10 m and 20 m, where KNW performs better. For heights above 20 m, there is no significant difference between DOWA and KNW with respect to the 10-year averaged wind speed bias. The diurnal cycle is better captured by DOWA compared to KNW, and the hourly correlation is slightly improved. In addition, a comparison with the global European Center for Medium-Range Weather Forecasts (ECMWF) ERA-Interim and ERA5 reanalyses (used for KNW and DOWA, respectively) is made, highlighting the added skill provided by downscaling those global datasets with the weather model HARMONIE.

Graphical Abstract

1. Introduction

Offshore wind energy is growing fast: in the next 10 years, the total installed capacity on the Dutch part of the North Sea is estimated at 4.5 GW by 2023 and 11.5 GW by 2030. And atmospheric models evolve to higher spatial and temporal resolutions. These are the two reasons why the effect of harvesting wind energy is no longer a sub-grid phenomena that is parametrized or ignored in atmospheric models: the energy subtracted from the atmosphere to produce electricity and the enhanced turbulent kinetic energy caused by wind farms in operation has to be and can be solved by atmospheric models, including wake and blockage effects of wind farms. In the wind energy sector a lot of research is done on wake and blockage effects of wind farms using Reynolds-Averaged Navier–Stokes (RANS) simulations [1], Large Eddy Simulations (LES) [2], or other models [3,4]. These studies provide useful insights but also have disadvantages. Often, the inflow of the wind farm is assumed to be uniform and the atmosphere neutral, while, in reality, there will be a horizontal gradient in the “free-stream” wind (especially with wind farms growing in size) and a large effect of stability on wakes and blockage. Another disadvantage of these models is that they are run on a limited domain with constraints on the edges. In addition, wind tunnel experiments have to deal with these unrealistic lateral and top of the wind tunnel constraints [5]. Atmospheric models are run on a much larger domain and the effect of the constraints at the top of the model (for global models typically around 80 km, for regional models around 35 km), and the edges of the model are small or non-existent.
So, there are huge benefits of using atmospheric models to determine the effects of wind farms on the “free-stream”. The aim of the Royal Netherlands Meteorological Institute (KNMI) is to model the effect of wind farms in weather model HARMONIE (HIRLAM ALADIN Research on Mesoscale Operational NWP In Euromed) which covers a large part of Europe. The work described in this paper contributes to this aim. It is about validating the “free-stream” wind profiles that HARMONIE produces against high quality measurements from the Cabauw wind mast.
Before launching the first KNMI “free-stream” wind atlas in 2013, KNMI reviewed existing North Sea “free-stream” wind atlases [6]: the European Wind Atlas [7], the OWA-NEEZ wind atlas [8], the NORSEWInD atlas [9] and the KEMA/SenterNovem Wind Atlas [10]. The conclusion was that (1) none of the atlases included the long-term variability of the wind climate, (2) most atlases did not give any information above 100 m (too low with turbines growing in size), and (3) almost all wind atlases were based on measurements at 10 m height or sea-surface extrapolated to higher levels, not taking into account variations of stability in time and space (only model-based atlas OWA-NEEZ took stability into account, but this atlas was based on a inhomogeneous dataset made with different model versions of the HIRLAM weather model).
The KNMI North Sea Wind (KNW) atlas [11] released in 2013 describes offshore “free-stream” wind climatology for the North Sea, including long-term variability of the wind climate (1979–2013, later extended to 2019) and including the effect of temporal and spatial variations of stability. It provides information up to 300 m. The KNW atlas is based on global reanalysis ERA-Interim, downscaled with HARMONIE and validated against offshore and onshore wind measurements [12,13]. Validation proved the ability of the KNW-atlas to describe the wind speed climatology (long-term averages and extremes) with an accuracy comparable to the accuracy of standard cup or sonic anemometer measurements.
The disadvantage of the KNW-atlas is the poor hourly correlation with the measurements (and consequently poor representation of the diurnal cycle) and the fact that a uniform (in space and time) wind shear correction had to be applied to compensate for the fact that HARMONIE underestimated the increase of wind with height. So, in January 2019, KNMI released a new “free-stream” wind atlas with a better hourly correlation and a better representation of the vertical wind shear: the Dutch Offshore Wind Atlas DOWA [14]. The DOWA is a “free-stream” wind atlas based on an 11-year reanalysis (2008–2018, now being extended to 2021) and gives information up to a height of 600 m. Compared to KNW, the DOWA is made with an improved global reanalysis (ERA5), a new version of HARMONIE (with a better turbulence scheme) and an improved method [15]. Producing, validating and comparing this “free-stream” atlas to other atlases and global re-analyses [16,17] was part of the DOWA-project, where also major progress was made on including wind farms and their effects in HARMONIE [18]. The DOWA and KNW atlas do not only provide validated offshore wind climatology, but also wind climatology for the Netherlands (and parts of Belgium and Germany), which makes the information potentially useful not only for onshore wind energy, but also for building regulations and airborne spread of pollution.
During the DOWA-project the New European Wind Atlas (NEWA) was released. NEWA [19] is a “free stream” wind atlas based on the community Weather Research and Forecasting model (WRF) [20]. For the Baltic Sea NEWA has recently been compared to reanalysis MERRA, ERA5, and UERRA by Hallgren et al. [21], for the North Sea NEWA has been compared to DOWA and its hosting global reanalyses ERA5 by Kalverla et al. [22]. Kalverla concluded that DOWA’s wind profile climatology is better than in both ERA5 and NEWA: ERA5 represents the wind shear well but underestimates the mean wind speed throughout the profile, and NEWA correctly represents the near surface wind but underestimates the wind shear.
In this validation study the DOWA is compared to wind measurements from the Cabauw meteorological mast for a 10-year period (2008–2017) and up to a height of 200 m. The results are compared to those of the KNW atlas, demonstrating the improved hourly correlation and representation of the diurnal cycle in the DOWA. In addition, DOWA is compared to the ERA-Interim/HARMONIE data without the uniform wind shear correction of KNW and the global reanalyses of ERA-Interim and ERA5 without downscaling.
This paper is structured as follows. In Section 2, an overview of the relevant atmospheric models is given and the KNW and DOWA wind atlases are described. In Section 3, the wind measurements of the Cabauw meteorological mast are discussed. In Section 4, the methodology of the validation is described, and, in Section 5, the main results of the validation study are presented. The discussion of the validation results and the conclusions are given in Section 6 and Section 7, respectively.

2. DOWA and KNW Atlas

The KNW atlas and the DOWA are based on different global ECMWF (European Center for Medium-Range Weather Forecasts) reanalyses: ERA-Interim for the KNW atlas, ERA5 for the DOWA. Those reanalyses are downscaled using different versions of the numerical weather prediction model HARMONIE. HARMONIE is a non-hydrostatic limited-area model that runs on a high-resolution grid spacing of 2.5 by 2.5 km. More details regarding HARMONIE/AROME can be found in Ref. [23]. HARMONIE model set-up can be found in Ref. [24]. HARMONIE version 37h1.1 was used to produce the KNW atlas and HARMONIE version 40h1.2.tg2 was used to make the DOWA. Compared to 37h1.1, 40h1.2.tg2 incorporates an improved turbulence parametrization (HARATU), resulting in more accurate wind speeds [25]. Another difference is that 37h1.1 uses global surface database ECOCLIMAP-I [26] and 40h1.2.tg2 ECOCLIMAP-II [27].
The KNW atlas [11] was the first atlas that was based on a period that was long enough to capture the variability in the Dutch wind climate. The KNW atlas released in 2013 captured 35 years of atmospheric variability from 1979 to 2013. As part of the DOWA project, the KNW atlas was extended using the same model-setup to guarantee a homogeneous dataset and encompasses more than 40 years (i.e., 1979–31 August 2019). There are eight published height levels: 10, 20, 40, 60, 80, 100, 150, and 200 m. It was found that the wind speeds require a shear correction [12,28]. This shear correction is tuned to match wind measurements made at the Cabauw meteomast (for the period of 2004–2013) and is uniformly applied (i.e., the same for all heights and locations) throughout the KNW domain:
U KNW ( h ) = U KNW wowsc ( 20 ) + U KNW wowsc ( h ) U KNW wowsc ( 20 ) 0.85 ,
where U KNW ( h ) and U KNW wowsc ( h ) are the corrected (KNW) and uncorrected (KNW without wind shear correction) wind speed at height h, respectively. Note that U KNW ( 20 m ) = U KNW wowsc ( 20 ) m and U KNW ( h ) > U KNW wowsc ( h ) for h > 20 m.
Previous validation studies of the KNW atlas demonstrate a bias of less than 0.5 m/s at heights of 10 m, and less than 0.2 m/s at higher levels (including hub heights), compared to undisturbed (i.e., without wake effects) measurements. Validation studies also demonstrated the ability of the KNW atlas to represent the climatological extremes [12,13].
Creating the DOWA [14] was part of a project with ECN part of TNO, Whiffle, and KNMI. The DOWA is a wind atlas based on a 11-year (2008–2018) reanalysis. Due to the limited time span of the DOWA, it cannot adequately capture North Sea wind climate variability like the KNW atlas. Therefore, the DOWA is not expected to provide any significant improvements to the climatological accuracy of the KNW atlas. However, it is expected to improve hourly wind correlation and the representation of vertical wind shear. There are 17 height levels: 10, 20, 40, 60, 80, 100, 120, 140, 150, 160, 180, 200, 220, 250, 300, 500, and 600 m, which is a larger range than that of KNW. Figure 1 shows the DOWA domain, which is also larger than that of the KNW atlas. DOWA contains not only wind climatology, but also information required for further downscaling with LES models. This means that it is possible to downscale the information in DOWA locally from hourly to 10 s and from 2.5 km to 100 m horizontally.
In addition to using new models, new methodologies were implemented within the DOWA. The full potential of HARMONIE as a weather forecasting model was leveraged by assimilating additional measurements (both conventional and innovative) that were not used in ERA5. The 3DVAR assimilation technique was used to assimilate these measurements at three-hour intervals at the beginning of each HARMONIE forecast cycle. Innovative measurements included high-resolution satellite surface wind fields (Advanced Scatterometer (ASCAT)) and aircraft wind profile measurements (MODE-S EHS). Using these additional measurements is expected to improve the quality of the time series and provide a more detailed depiction of the diurnal cycle. Note that the Cabauw meteomast wind measurements are not assimilated in DOWA. For the KNW atlas, no additional measurements were assimilated into HARMONIE during the process of downscaling.
For the KNW atlas, each six-hour forecast period started with the ERA-Interim reanalysis (“cold start”). Subsequently, HARMONIE was used to produce the +1 h up to the +6 h forecast. No cold starts were used in the DOWA, except at the beginning of each parallel stream. Note that for the computation of DOWA several “streams” were run simultaneously: stream A (2010–2012), stream B (2013–2014), stream C (2008–2009), and stream D (2015–2017), to speed up the calculations. The DOWA is comprised of +1 h, +2 h, and +3 h HARMONIE forecasts. At each hour, the boundaries of the DOWA-domain (North, South, East, and West at all model levels) are fed with ERA5 reanalysis data, and each three-hour forecast cycle is initialized using the latest HARMONIE forecast of the previous cycle (i.e., no cold starts with ERA5 data) and data-assimilated measurements.

3. Cabauw Meteorological Mast Wind Measurements

The Cabauw Experimental Site for Atmospheric Research (CESAR) is located in an open and flat polder landscape, 0.7 m below mean sea level (51.971° N, 4.927° E). An impression of the location is given in Figure 2. The site is centered around a 213-m research tower, used for meteorological measurements in the lowest few hundred meters of the atmosphere. Its instrumentation and siting, in particular in the context of wind measurements, have been extensively described [29,30]. An updated description of the in-situ observation program in Cabauw is provided by Bosveld [31].
Wind speed and wind direction are measured with KNMI cup anemometers and wind vanes, respectively, at six levels: 10 m, 20 m, 40 m, 80 m, 140 m, and 200 m. Precautions are taken to avoid large flow obstruction from the 213-m tall mast (“A-mast”) and the main building at the bottom of it:
  • At levels 40 m, 80 m, 140 m, and 200 m of the A-mast, the wind direction is measured at three booms and wind speed is measured at two booms; the selection between the booms depends on the wind direction.
  • At levels 10 m and 20 m the wind direction and wind speed are measured at smaller masts: “B-mast” (30 m SE of A-mast) and two “C-masts” (70 m and 140 m NE of A-mast for wind measurements at 20 m and 10 m height, respectively) of the main building; the selection between these masts depends on the wind direction.
Careful calibration procedures and corrections assure an accuracy of the KNMI cup anemometer of 1% (or 0.1 m/s for low wind speeds). During operation, the accuracy of the cup anemometers is monitored to stay within 1% by comparing the two available instruments at the same height, provided that wind direction allows for proper wind measurements for both. The KNMI wind vane has a resolution of 1.5°. Accuracy of the vane depends on the instrument and on orientation of the vane plug. The vane meets the World Meteorological Organization (WMO) requirement of 3° accuracy. An overall check of the three vanes at each measurement level in the A-mast suggests a comparability of 2°. Calibration periods for the cup anemometer and wind vane are 14 and 26 months, respectively. The wind data is quality controlled, including corrections for remaining flow distortions from the mast. The monthly data availability of the mast measurements is at least 99.6%.

4. Materials and Methods

The strategy adopted for this validation study is based on the previous KNW validation report [12], which describes the performance of the KNW atlas against offshore and Cabauw mast measurements. Besides the DOWA and KNW atlases, we have also included KNW without wind shear correction (“KNW-wowsc”) in our validation study. The wind shear correction that was used to postprocess the HARMONIE data for the KNW atlas is derived using the 10-year averaged Cabauw meteomast measurements for the years 2004–2013. This means that there is no difference between the wind profile climatology based on the measurements and the KNW atlas at the Cabauw site. By comparing DOWA to KNW-wowsc, instead of KNW, the improvements made by using the newer HARMONIE version become more visible. We have also included the global reanalysis datasets of ERA-Interim and ERA5 in our validation study to assess whether downscaling with HARMONIE adds skill and to investigate whether differences between DOWA and KNW can be traced back to their host reanalysis model. The time period of all datasets is from 1 January 2008 up to and including 31 December 2017.
The different datasets (measurements and wind atlases) have to be collocated to make a comparison possible:
  • The wind atlases have an hourly output (except ERA-Interim, which is 6-h) that represents the state of the atmosphere at the full hour. The Cabauw meteomast measurements used are 10-min averages. To validate DOWA with Cabauw measurements, one hour of Cabauw measurements is averaged, i.e., six 10-min averaged data values are taken, namely those belonging to the half hour before and the half hour after the full hour. This 60 min average was compared to the hourly DOWA output (that represents a 2.5 by 2.5 km grid box average). The method to compare the wind atlases with the Cabauw measurements is conform the one used to validate the KNW atlas [12]. In Appendix A, results based on shorter averaging times are shown.
  • The validation is conducted for all measuring heights of the Cabauw meteomast: 10 m, 20 m, 40 m, 80 m, 140 m, and 200 m. These levels are all present within the DOWA; for the KNW atlas, a cubic-spline interpolation scheme was used to interpolate the model data to 140 m.
    The sigma levels from ERA-Interim and ERA5 are converted into heights. A constant height for each level is taken, based on the averages over the 10-year period. For both ERA-Interim and ERA5 the lowest 15 levels are taken into account. For ERA-Interim those correspond to 9.9, 35, 71, 123, 193, 285, 400 m, ... , 2.3 km; for ERA5 to 10, 31, 54, 79, 107, 137, 170, 205, 245, 288 m, ... , 566 m. A cubic-spline interpolation scheme was used to interpolate the model data to the measuring heights.
  • For both temporal averaging and height interpolation, “scalar averaging” of wind speed and wind direction is applied. This means that the wind speed and wind direction are averaged independently (in contrast to “vector averaging” in which the wind vector is averaged; therefore, the wind direction is weighted with the corresponding wind speed).
  • For the Cabauw meteomast measurements, we filter out wind speed and wind direction data for which the wind speed is less than 0.5 m/s.
  • We only consider hourly wind atlas information for which there is a valid Cabauw meteomast measurement. Thus, timestamps for which Cabauw meteomast measurements are missing, or the measured wind speed is too low for a reliable measurement, are filtered out. No more than 0.4% of the data is filtered out.
  • We derived KNW-wowsc by applying the inverse of Equation (1) to the KNW output data:
    U KNW wowsc ( h ) = 0.85 U KNW ( h ) + 0.15 U KNW ( 20 ) ,
    where U is the wind speed, and h is the height.
  • For DOWA and KNW, no spatial interpolation of the wind atlas data has been performed. We simply took the nearest grid point to the Cabauw meteomast. Details on the coordinates and chosen grid points, and a sensitivity study on the neighboring grid points, are given in Appendix B. For ERA-Interim and ERA5, four grid points close to Cabauw were obtained from ECMWF (with a spacing of 0.125°; also see Appendix B) and further interpolated to the location of the Cabauw meteomast.
  • The model variance is used to assess the significance of the differences between the atlases and the measurements (i.e., the bias). The model variance is estimated by calculating the standard deviation of the mean, taking into account an equivalent sample size (ESS) based on an autoregression of order 1 model (see Appendix C). We apply (and show) the uncertainty estimates solely on the bias (measurements-model) to avoid seasonal effects, and only on the model part, not taking into account the measurement uncertainty (which is described in Section 3).

5. Results

The focus of the validation is the comparison between DOWA and KNW atlas. Bias is defined as the difference between the measurement and the atlas (henceforth referred to as “model”). Thus, a negative (positive) bias can be interpreted as an overestimation (underestimation) by the model with respect to the measurements. Model variance is indicated in the bias plots as the shaded areas (which in some cases are too narrow to be visible). Measurement uncertainty is not included, but, with a wind speed measurement accuracy of 0.1 m/s or 1%, one can state that (for wind speeds below 20 m/s) a bias below 0.2 m/s is insignificant.
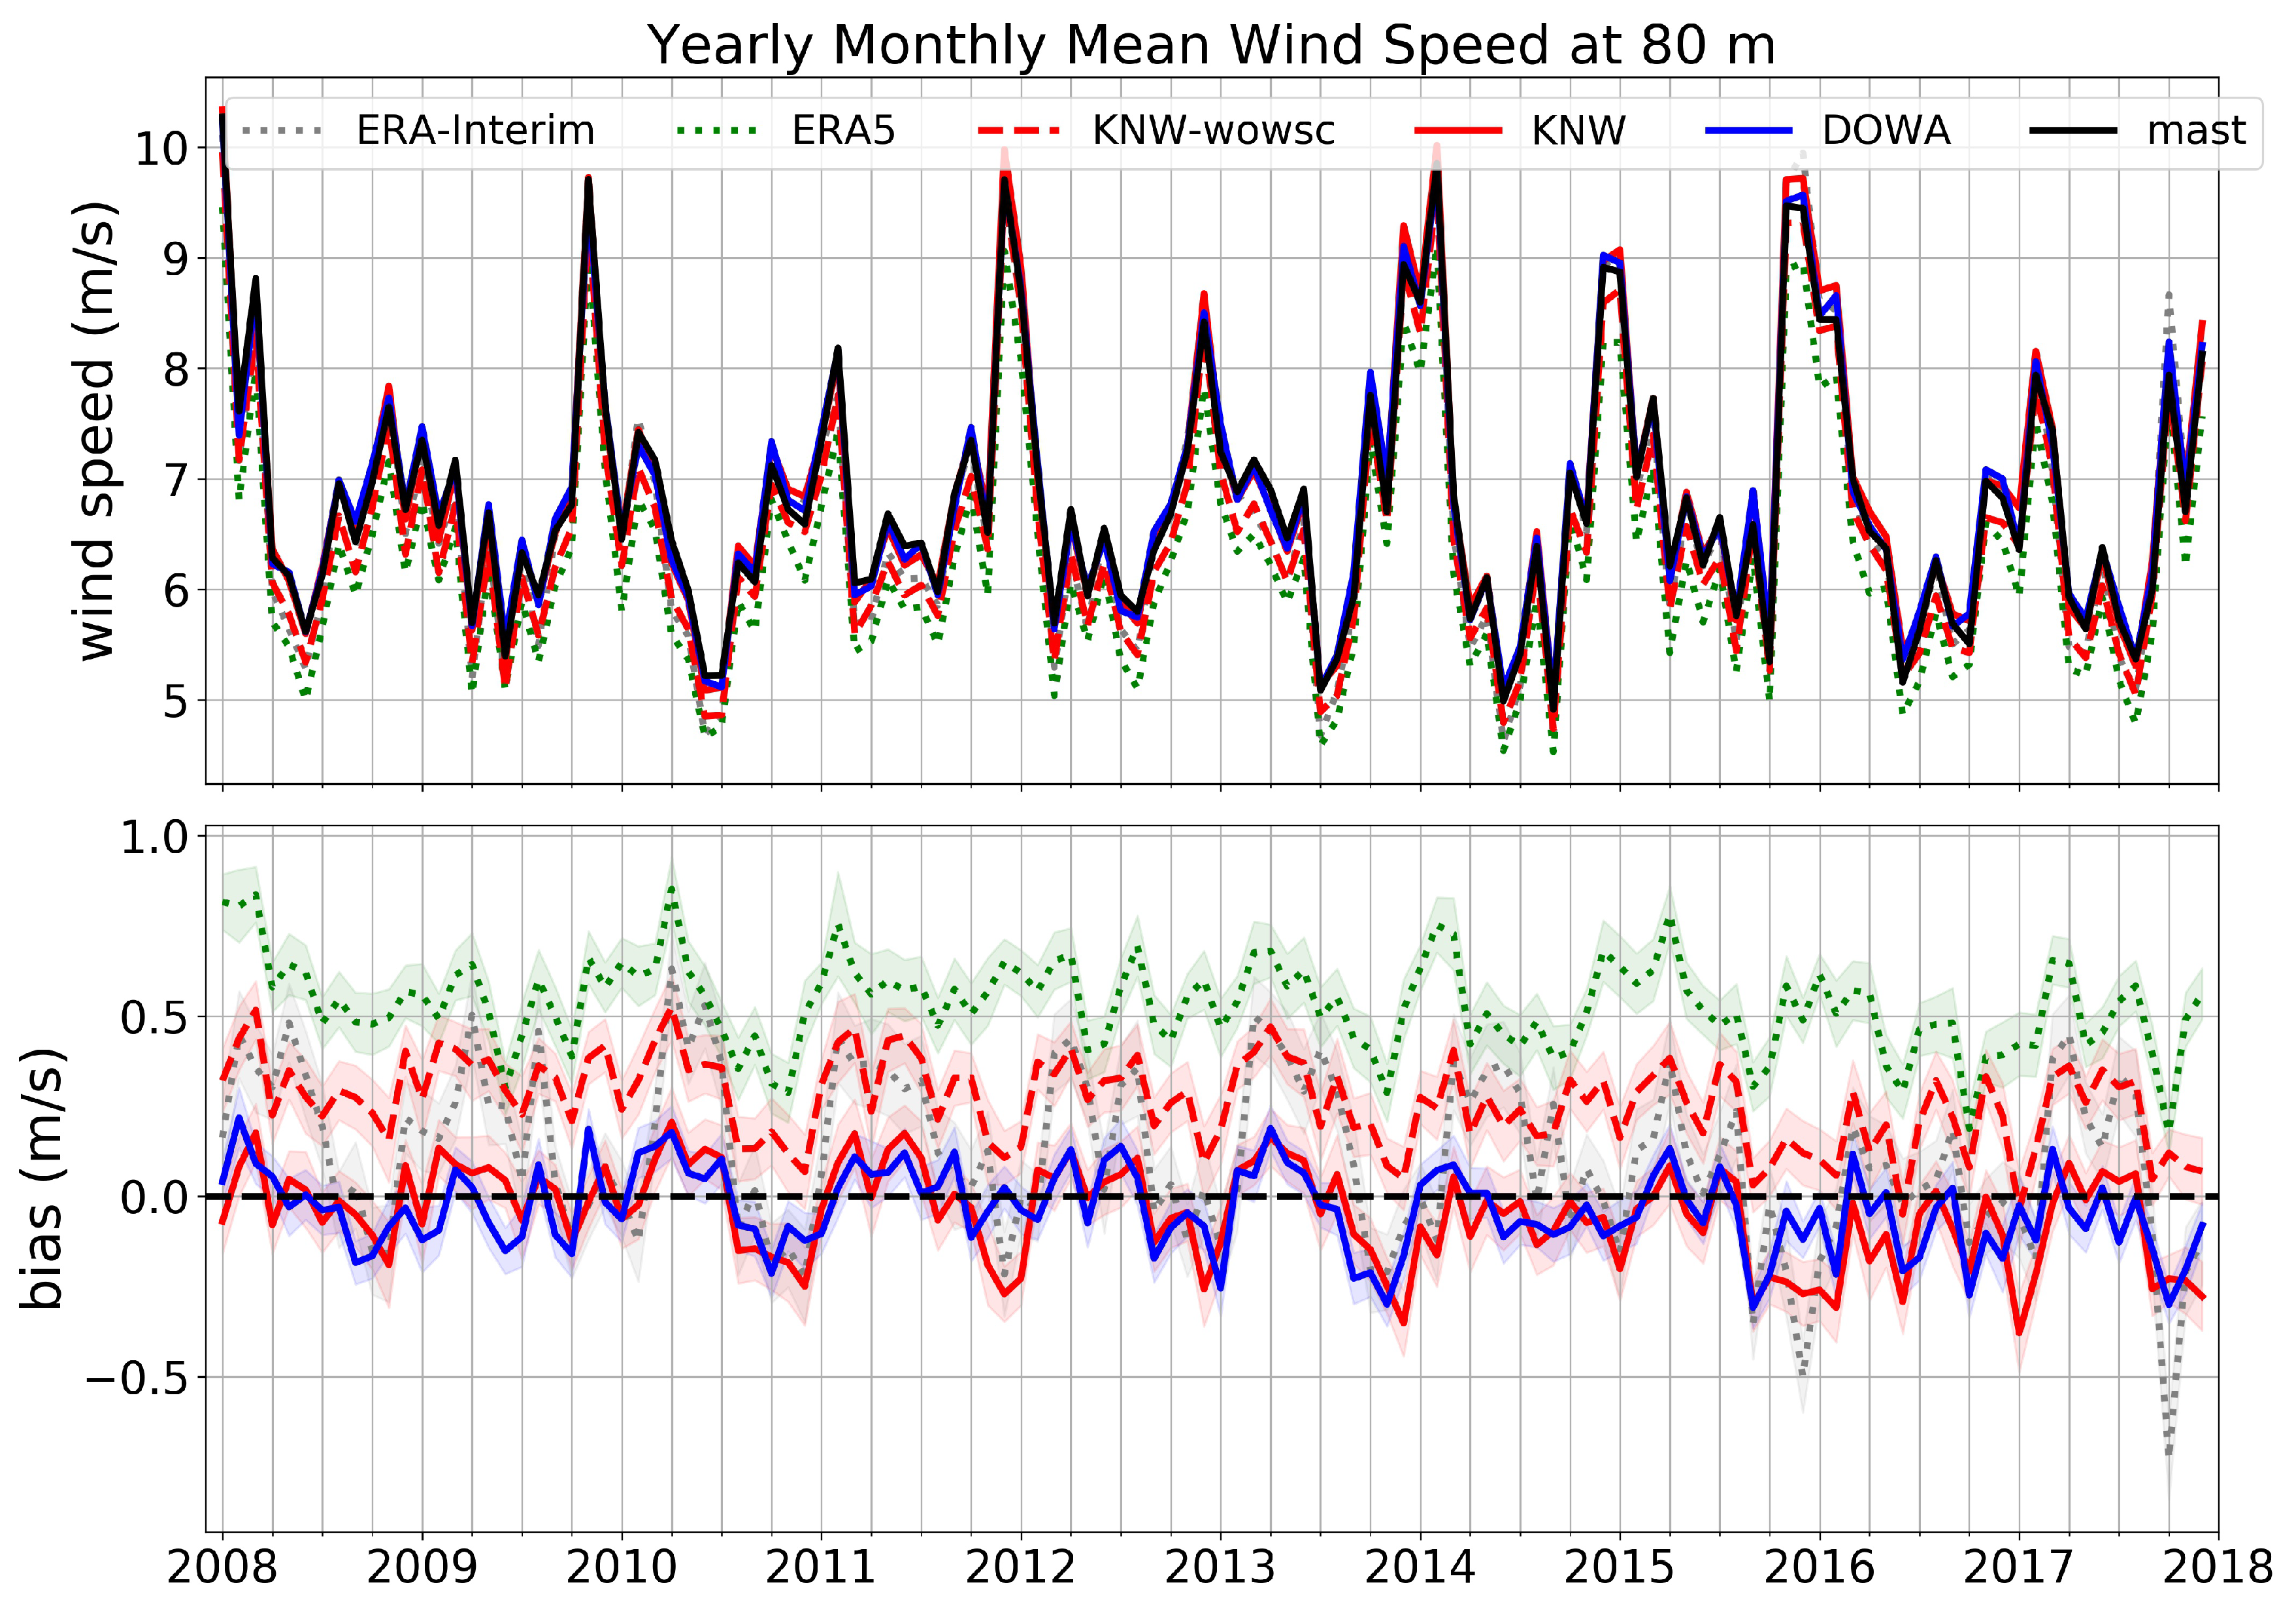
As an example, a time series of the wind speed at a height of 80 m is shown in Figure 3. The upper panel illustrates the monthly mean wind speed of mast measurements and the models, while the lower panel indicates the bias between the two. The monthly mean wind speed varies significantly, especially with a seasonal pattern: higher speeds in winter and lower ones in summer. DOWA and KNW show a very similar bias, varying around zero with an amplitude of about 0.2 m/s. ERA5 shows a positive bias varying around 0.5 m/s, whereas ERA-Interim has a lower bias, ranging between −0.5 m/s and +0.5 m/s. Note that these results vary for the different heights.

5.1. Mean Wind Speed

In Figure 4, the height profiles of the mean wind speed (a), the mean bias (b), and (c) the standard deviation of the bias for the full period of 10 years is shown. The model variances are indicated in the bias plot but these are too small to be visible. All the profiles show an increase of the mean wind speed with height. DOWA and KNW are very similar for the higher levels (80 m, 140 m, and 200 m), with DOWA having slightly lower negative biases than KNW, but less than 0.1 m/s. At 40 m, the absolute biases of DOWA and KNW are less than 0.1 m/s. These biases all are within the measurement uncertainty; therefore, no distinction between DOWA and KNW can be made for these heights. However, DOWA and KNW deviate at lower levels (10 m and 20 m), where DOWA shows a maximum positive bias of 0.3 m/s, while KNW has a bias with an absolute value less than 0.1 m/s. For these levels, one can conclude that KNW performs better than DOWA. ERA5 shows an almost constant positive bias of about 0.5 m/s, whereas ERA-Interim has negative bias at lower levels and a positive bias at higher levels. The mean wind speeds at 200 m for ERA-Interim and ERA5 are almost the same.
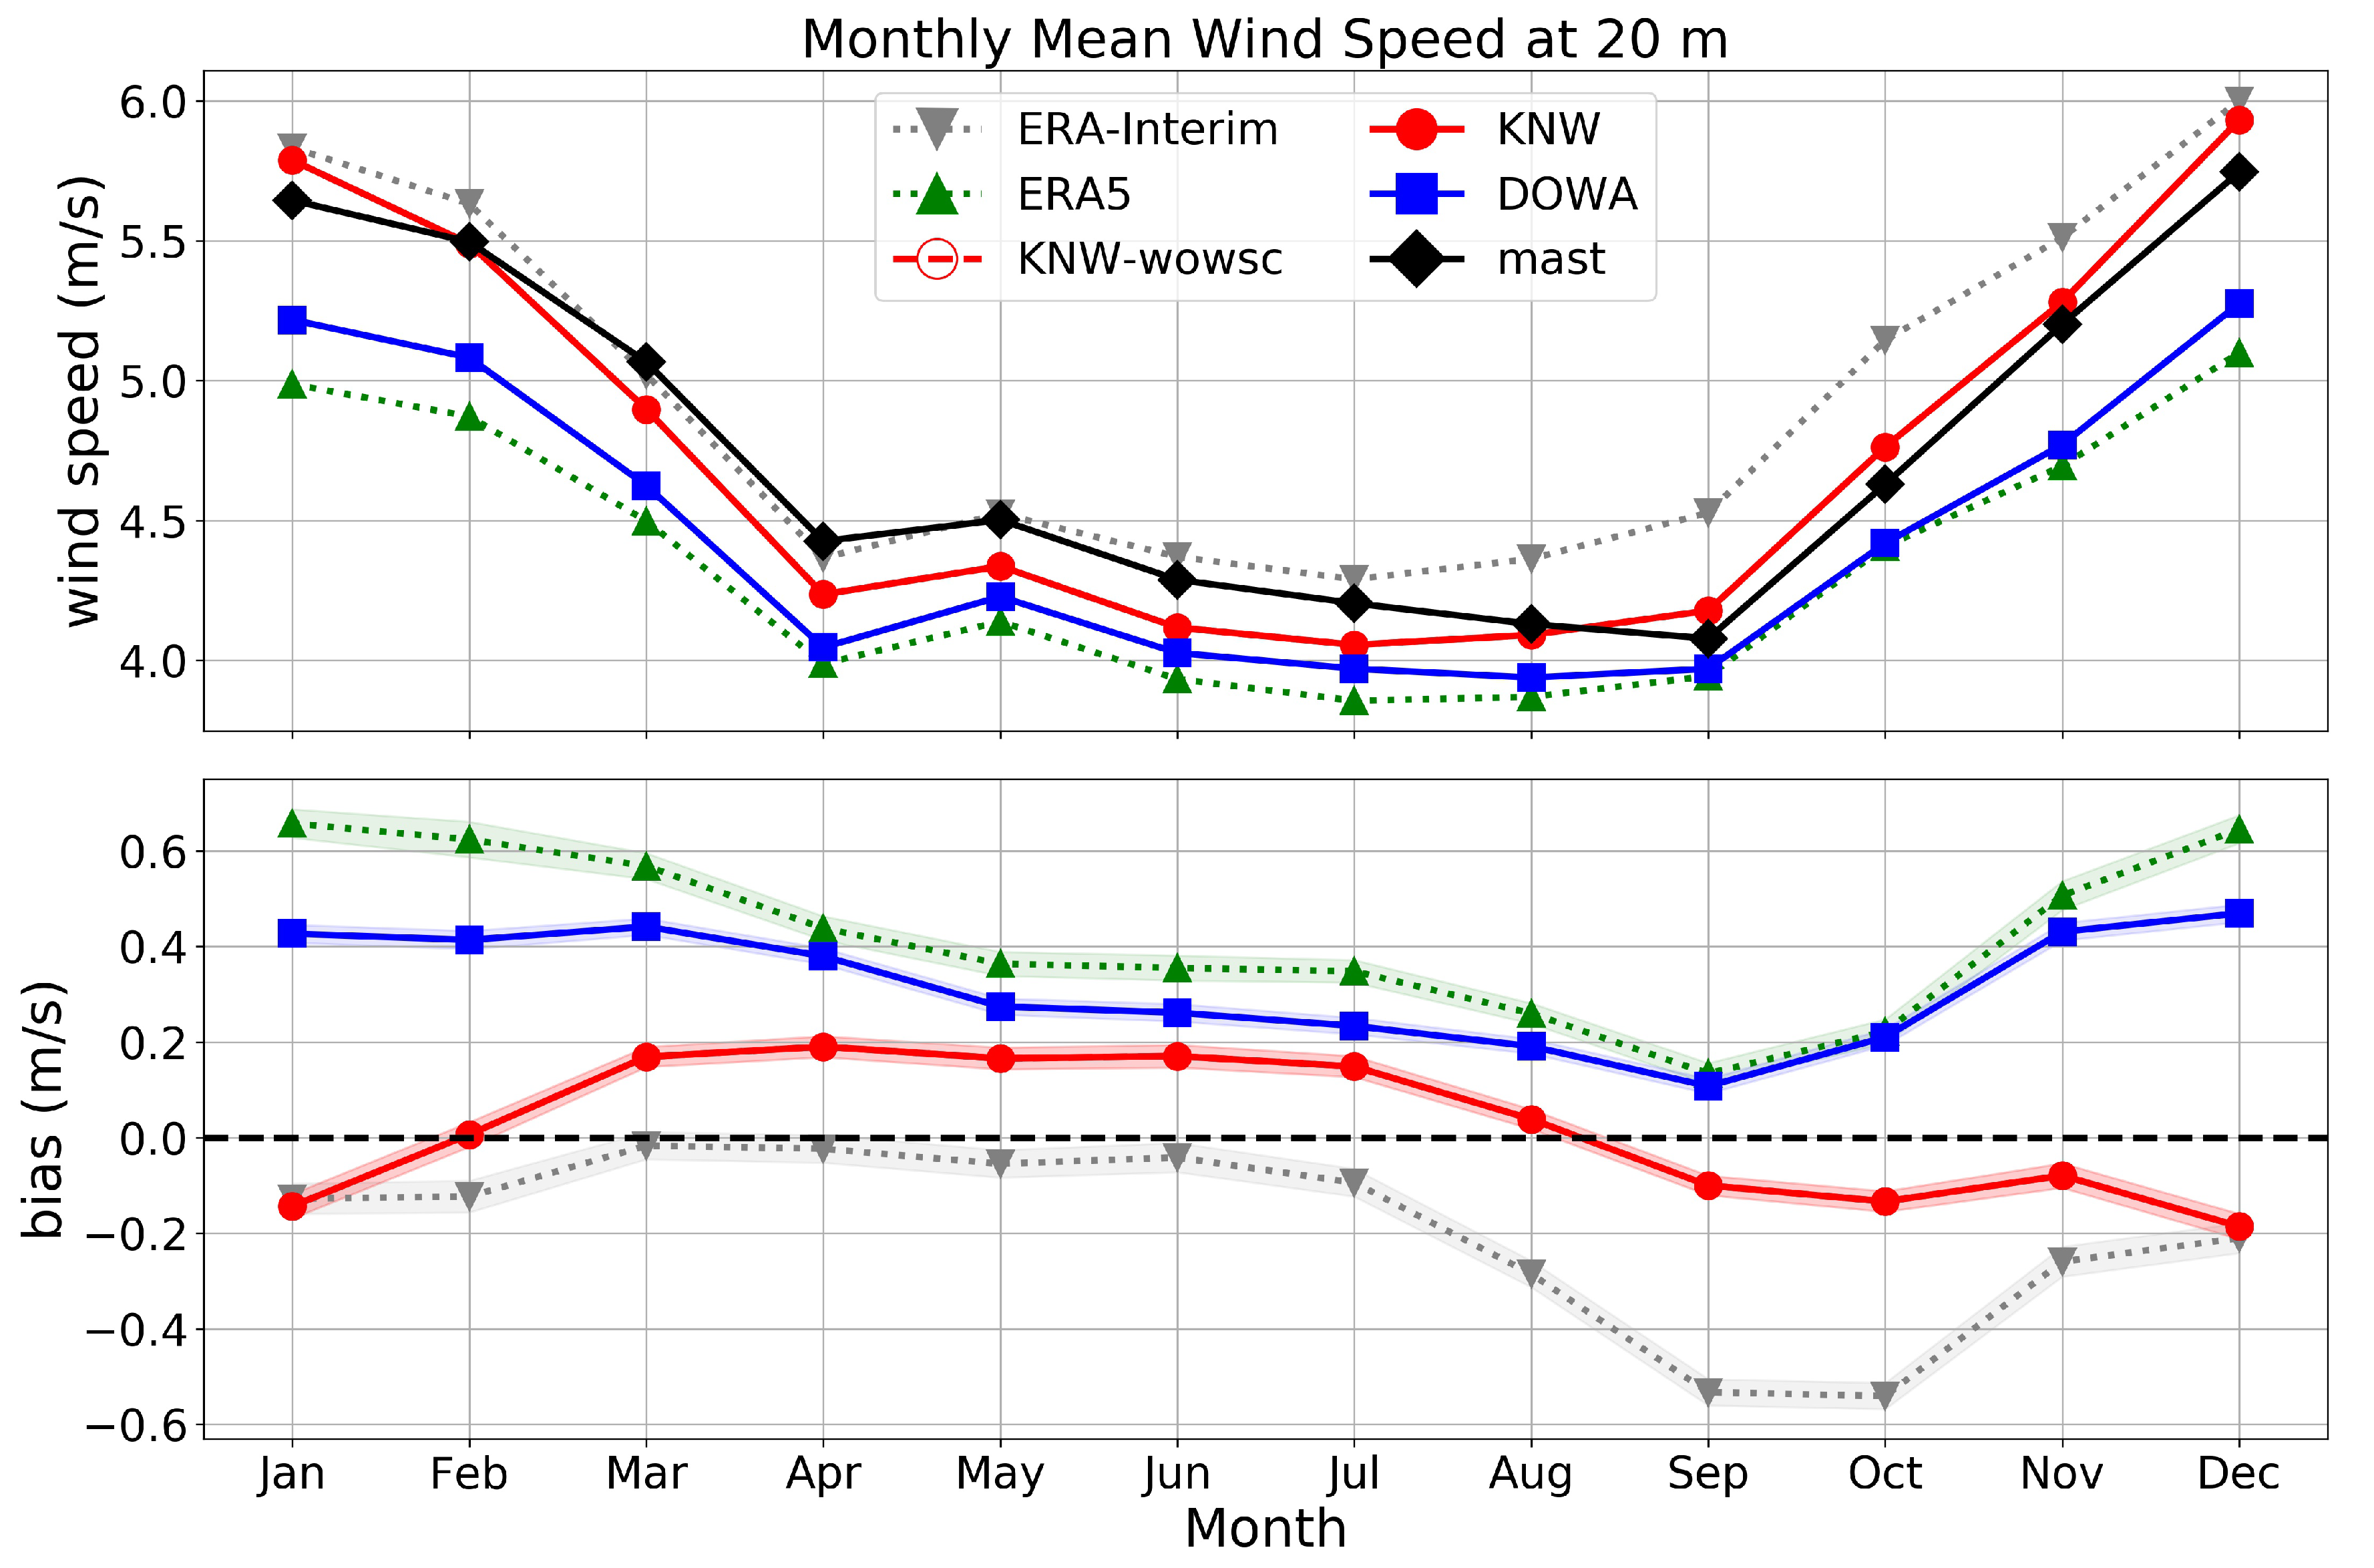
To further investigate the difference in the bias at the lower levels between DOWA and KNW, the monthly mean wind speed at 20 m is shown in Figure 5. The seasonal behavior of the mean wind speed is captured well by all models showing a larger mean wind speed in the winter than in the summer. For the summer months, there is no significant difference in bias between DOWA and KNW (less than 0.1 m/s). In the winter months, the difference is significant (up to 0.5 m/s for January and December). Additionally, while DOWA underestimates (positive bias) the wind in the winter months, KNW overestimates (negative bias). The same behavior is observed at 10 m and to a lesser extent at 40 m. Thus, the differences in mean wind speed observed between DOWA and KNW at the lower levels are primarily due to the differences in winter.
The standard deviation of the bias is a measure of the precision of the data: the “random” (non-systematic, non-predictable) error. A bias can be corrected for, but a lack of precision not. In Figure 4c, the height profiles of the standard deviation of the bias between the measurements and the models are shown. For heights above 20 m, the standard deviation of the bias for DOWA and ERA5 is smaller than that of KNW, KNW-wowsc, and ERA-Interim. Thus, DOWA and ERA5 correlate better with the measurements. For 10 m and 20 m heights, DOWA shows the smallest standard deviation of the bias.

5.2. Diurnal Cycle

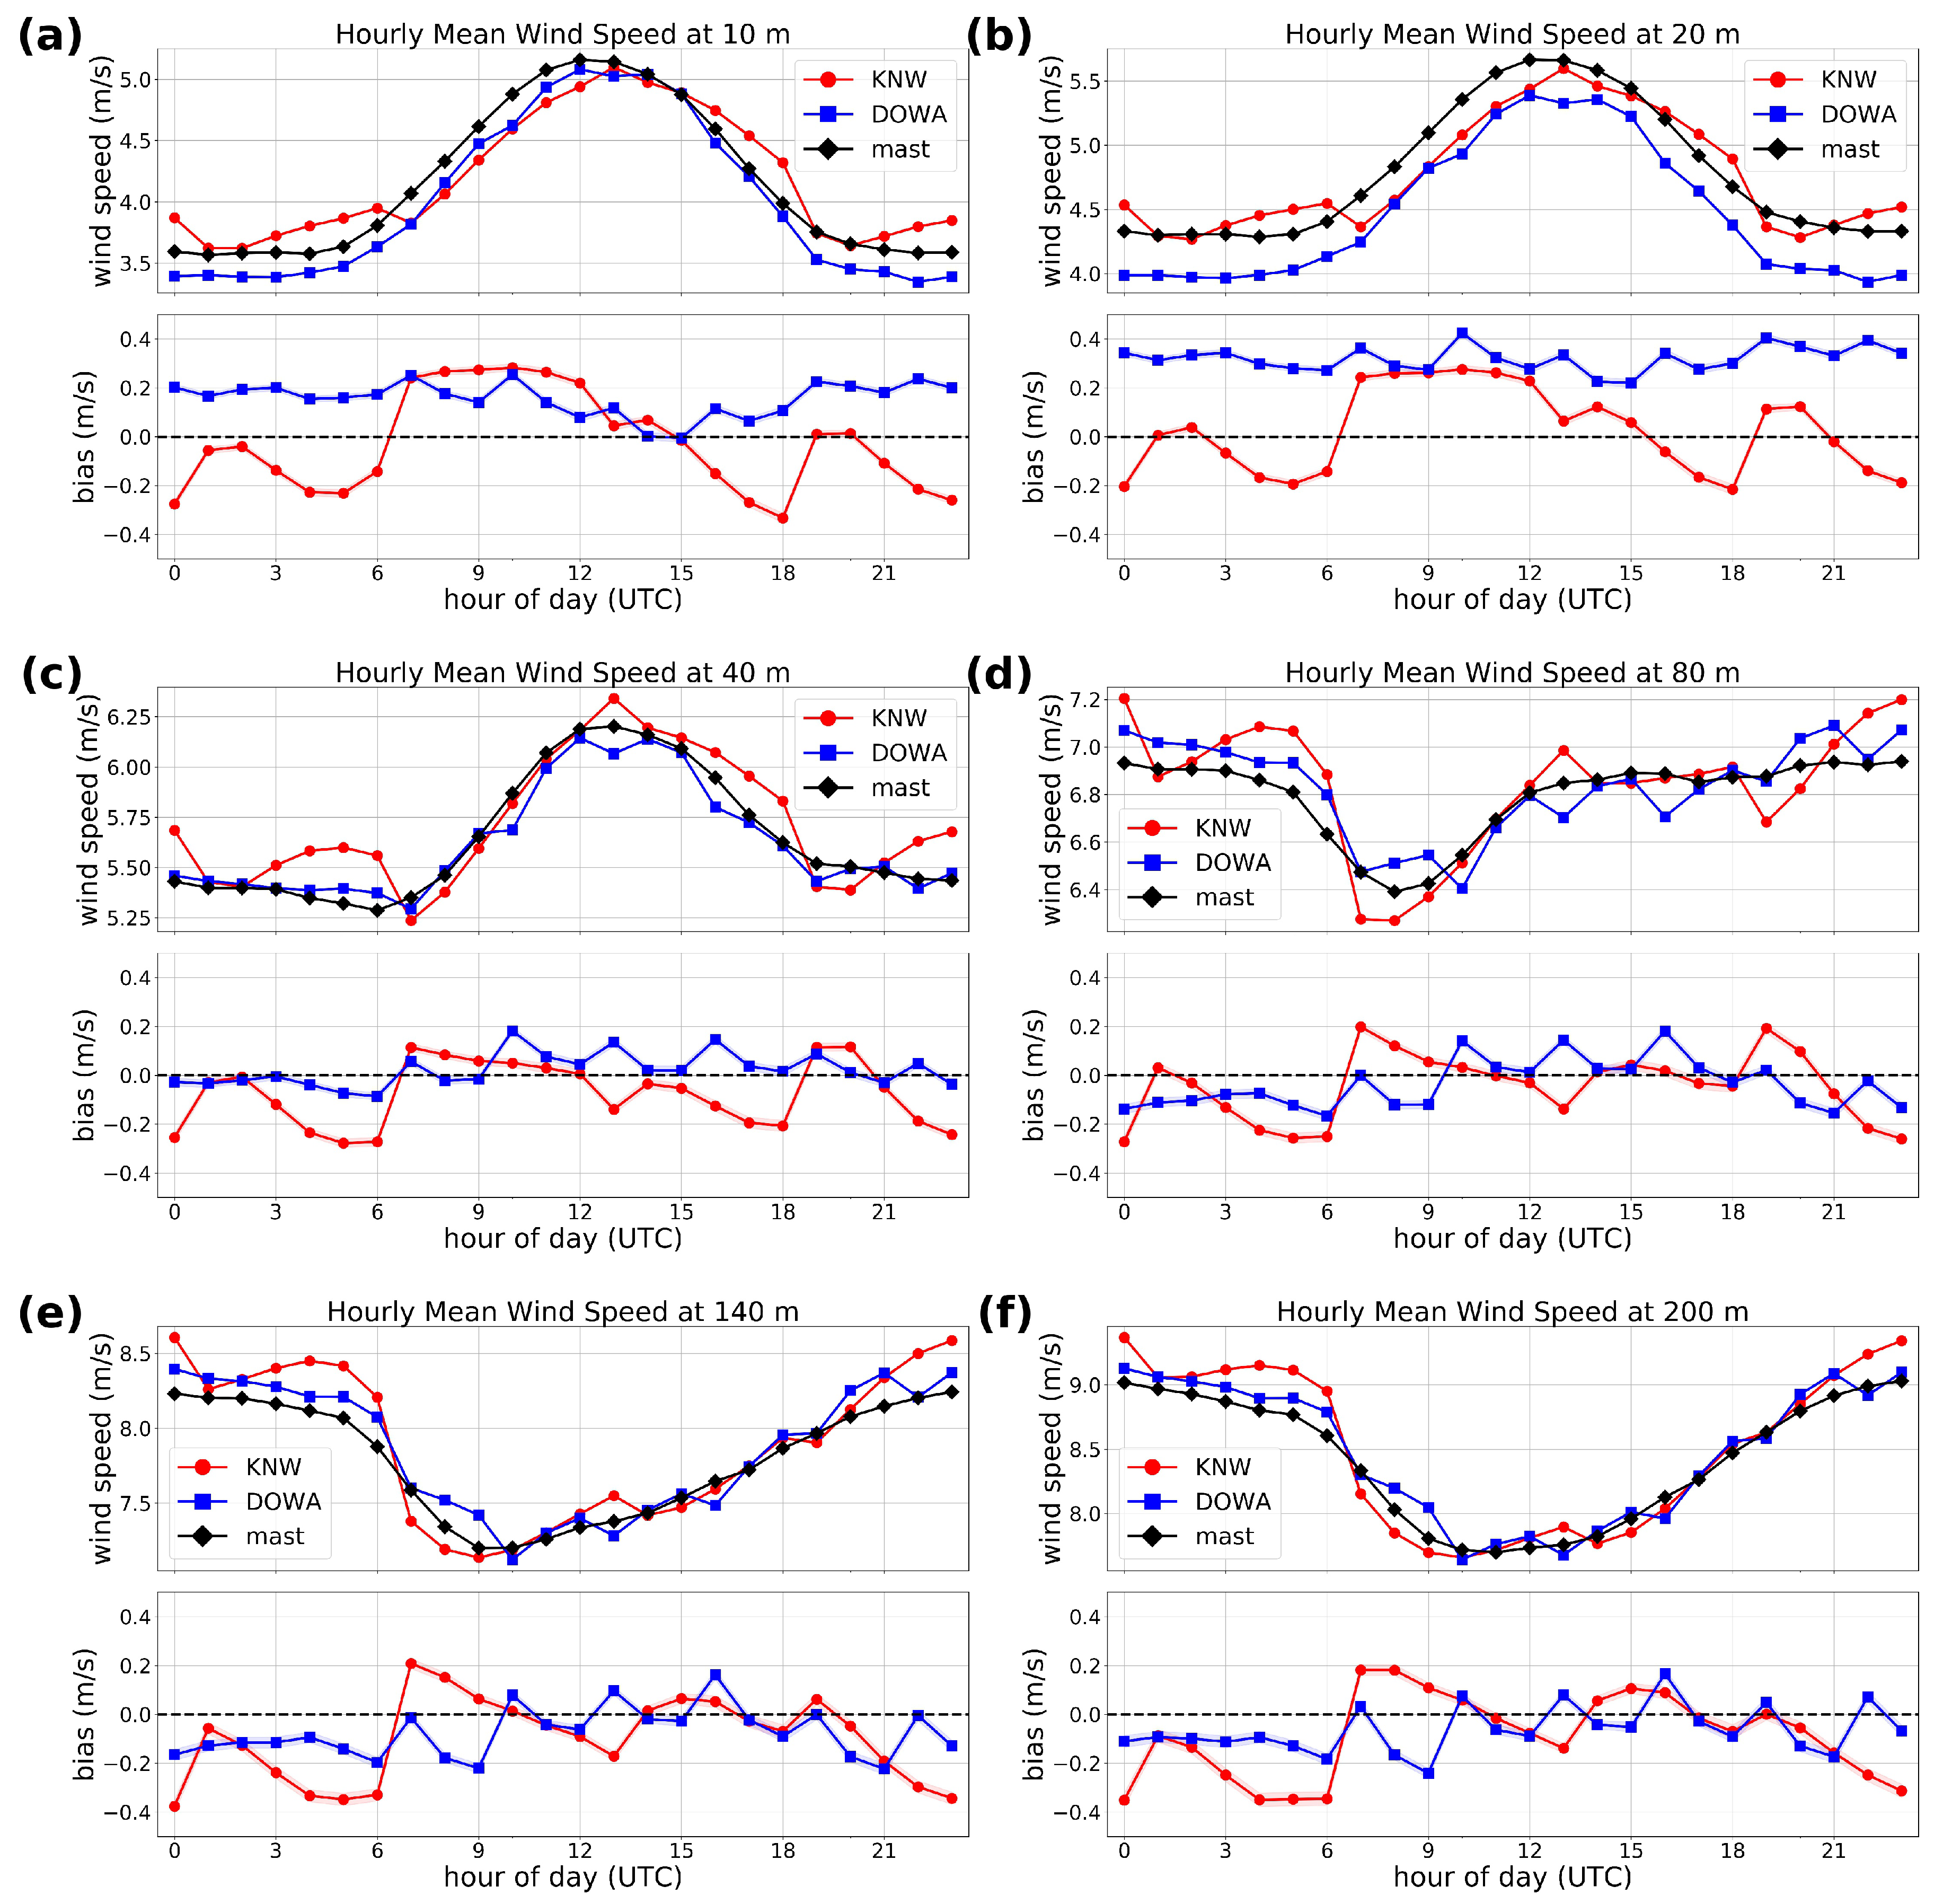
The validation of the hourly mean wind speed shows how well the models capture the diurnal cycle. In Figure 6, the hourly mean wind speed is shown for the different levels. It can be seen that the diurnal cycle depends strongly on height: at lower levels, the wind speed is maximum during daytime and minimum during nighttime, while, at higher levels, it is the other way around. This behavior is captured by both DOWA and KNW. When considering the biases, one notices that KNW shows strong non-physical “jumps” every 6 h. DOWA, on the other hand, shows weaker “jumps” but for the higher levels and every 3 h instead of 6 h. The KNW “jumps” correspond with the use of cold starts every 6 h, while the DOWA features are due to the 3 h data assimilation. Differences between night and day can be explained by the fact that the assimilated Mode-S EHS observations are only available during the day. Again, for the lower levels, DOWA has a large positive bias, especially for 20 m, which is fairly independent of the hour of day.
The diurnal cycle is not only height-dependent but also strongly dependent on the season. Daytime solar radiation is much stronger in summer than in winter. As a result, there is more mixing in the boundary layer and wind changes less with altitude. In Figure 7, the hourly mean mast measurements and DOWA data are displayed separately for the four seasons, illustrating these clear differences between the seasons. We see that DOWA does an excellent job of capturing the diurnal dynamics in every seasons and for the whole profile.

5.3. Hourly Wind Speed Correlation

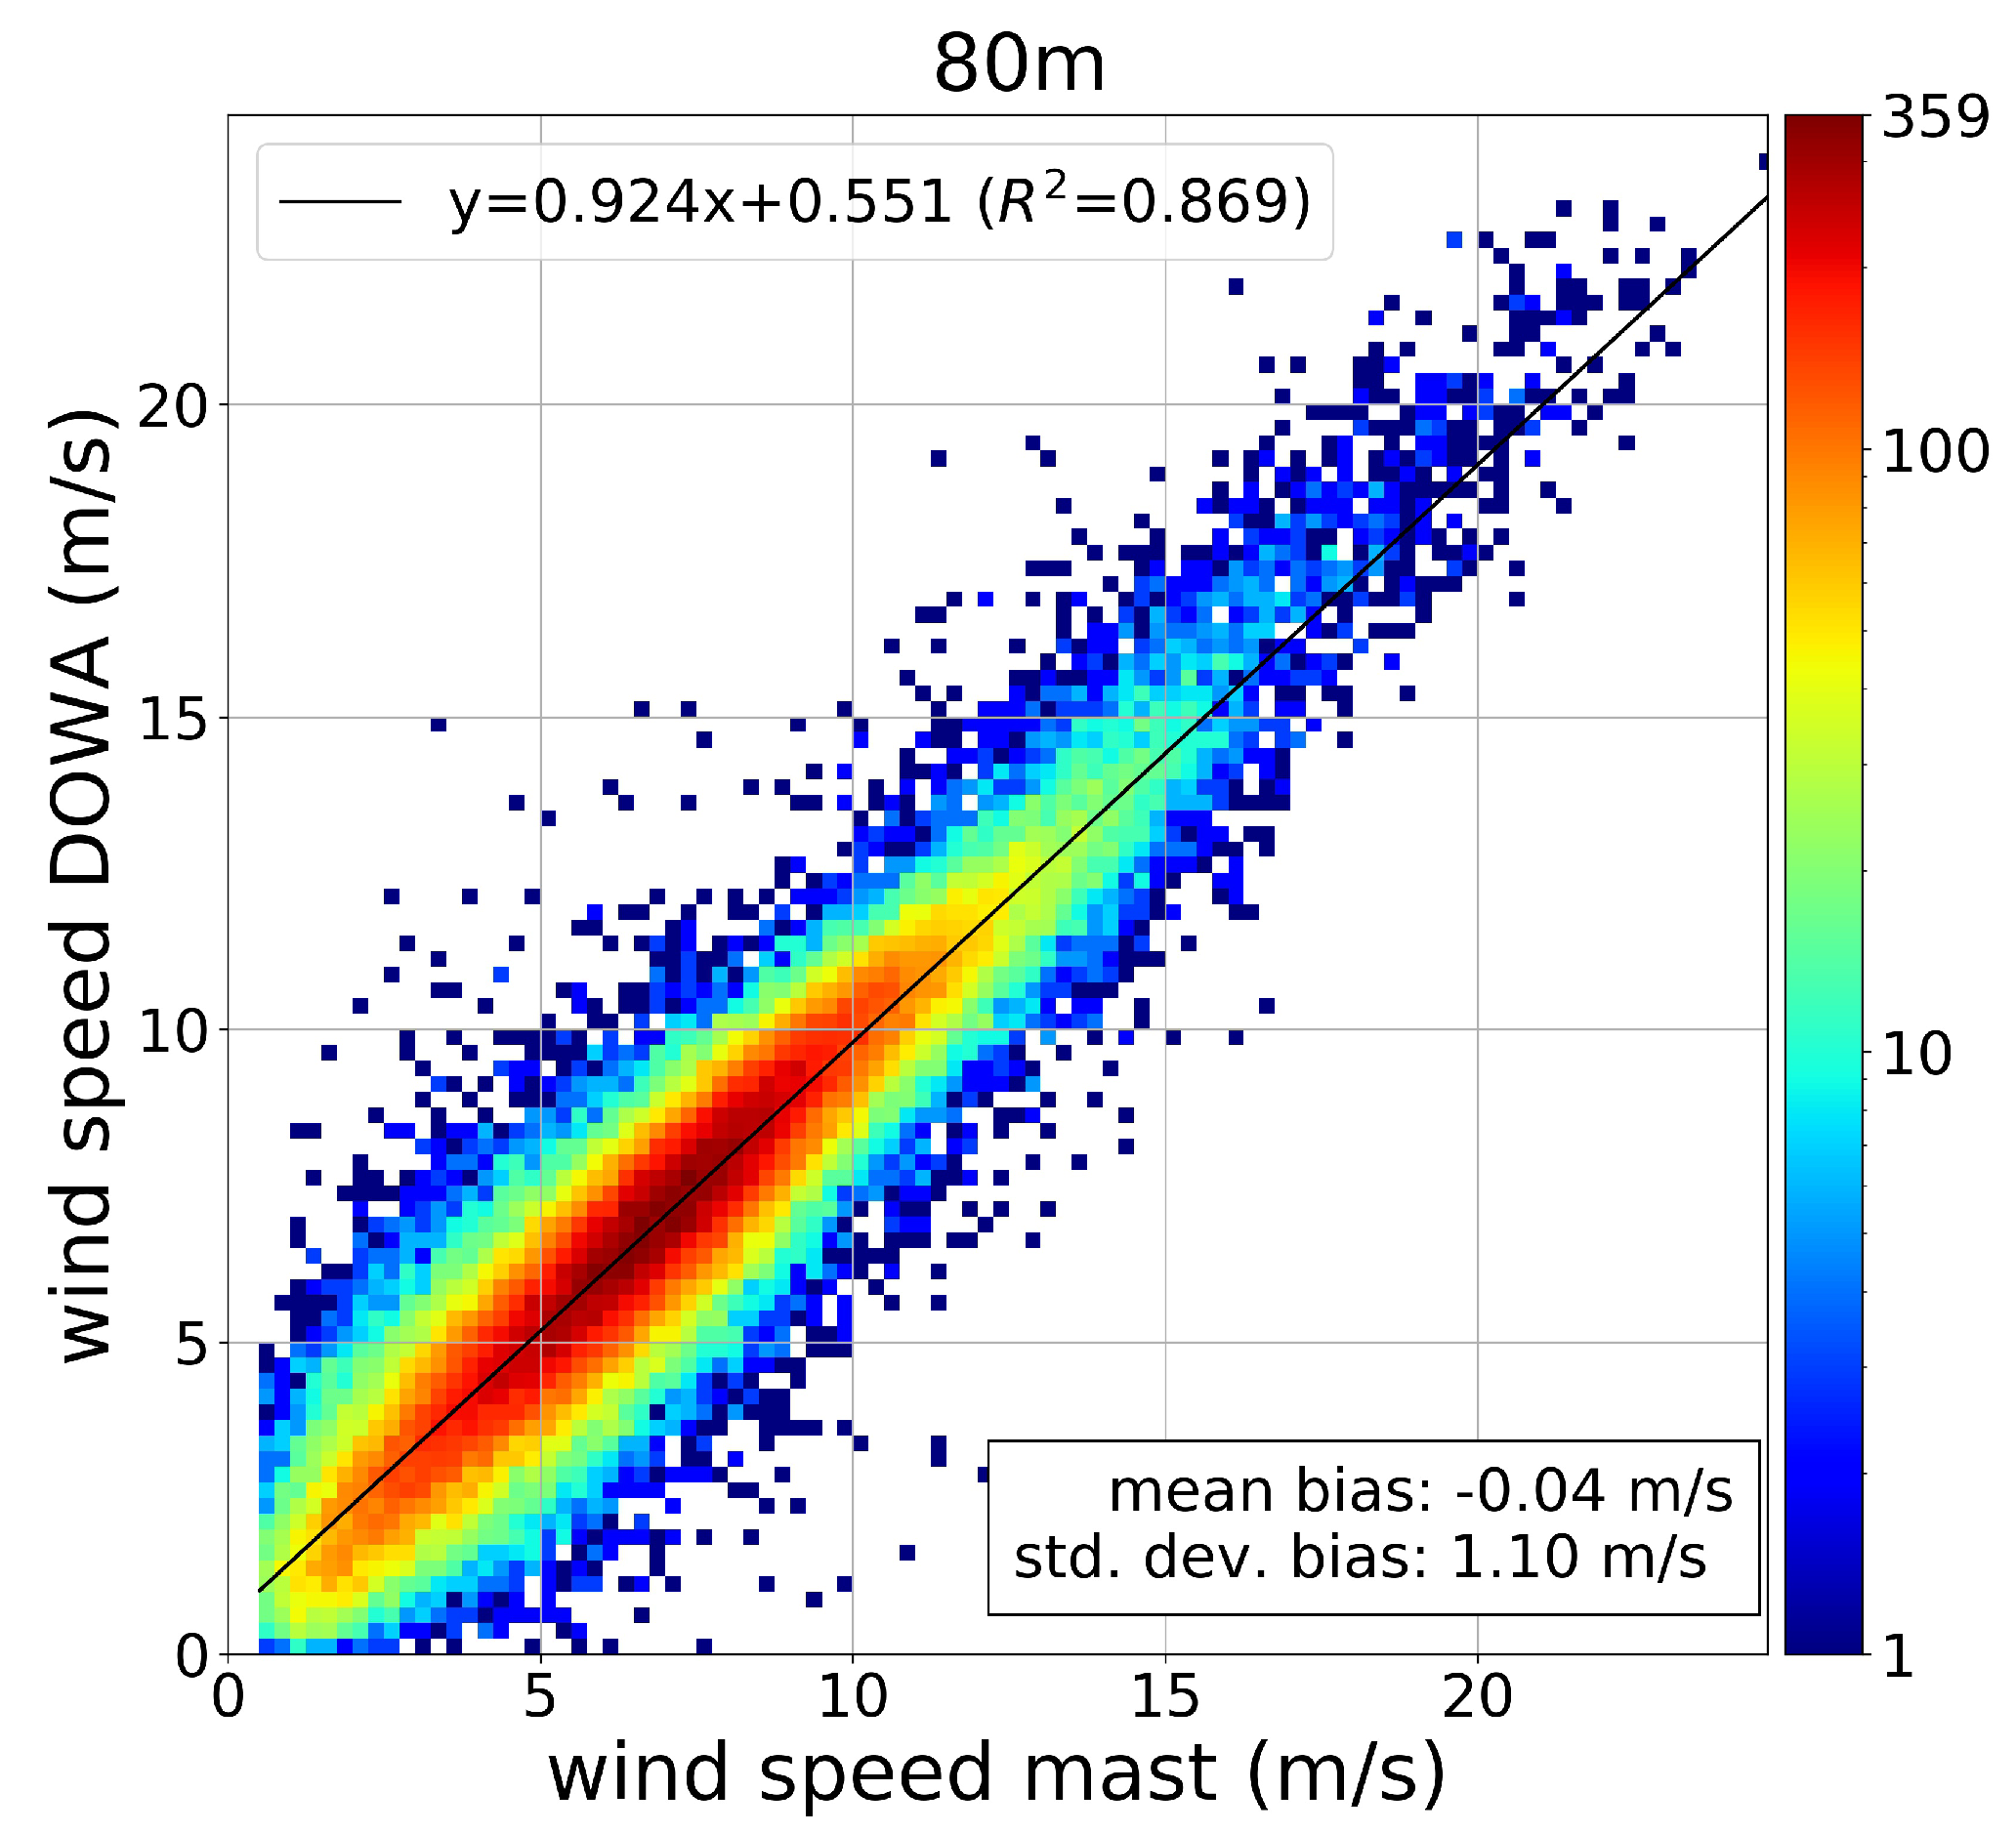
Another way to validate the models is to consider the hourly correlation between the modeled wind speeds and the mast measurements. As an example, the DOWA wind speeds at 80 m are plotted against the mast corresponding wind speeds in Figure 8. Linear regression is performed to quantify the correlation between the models and the measurements: the expression y = a x + b ( a = slope and b = offset) is fitted to the data and the coefficient of determination R 2 is determined.
The fit results (slope, offset and R 2 ) are given in Table 1 for the DOWA and KNW atlas. There is no significant difference in the slope between KNW and DOWA, with DOWA slightly closer to 1 at the higher levels. The offset is clearly smaller in DOWA, especially at 10 m and 20 m. R 2 shows that DOWA correlates better with the mast measurements than KNW for all levels.

5.4. Wind Direction

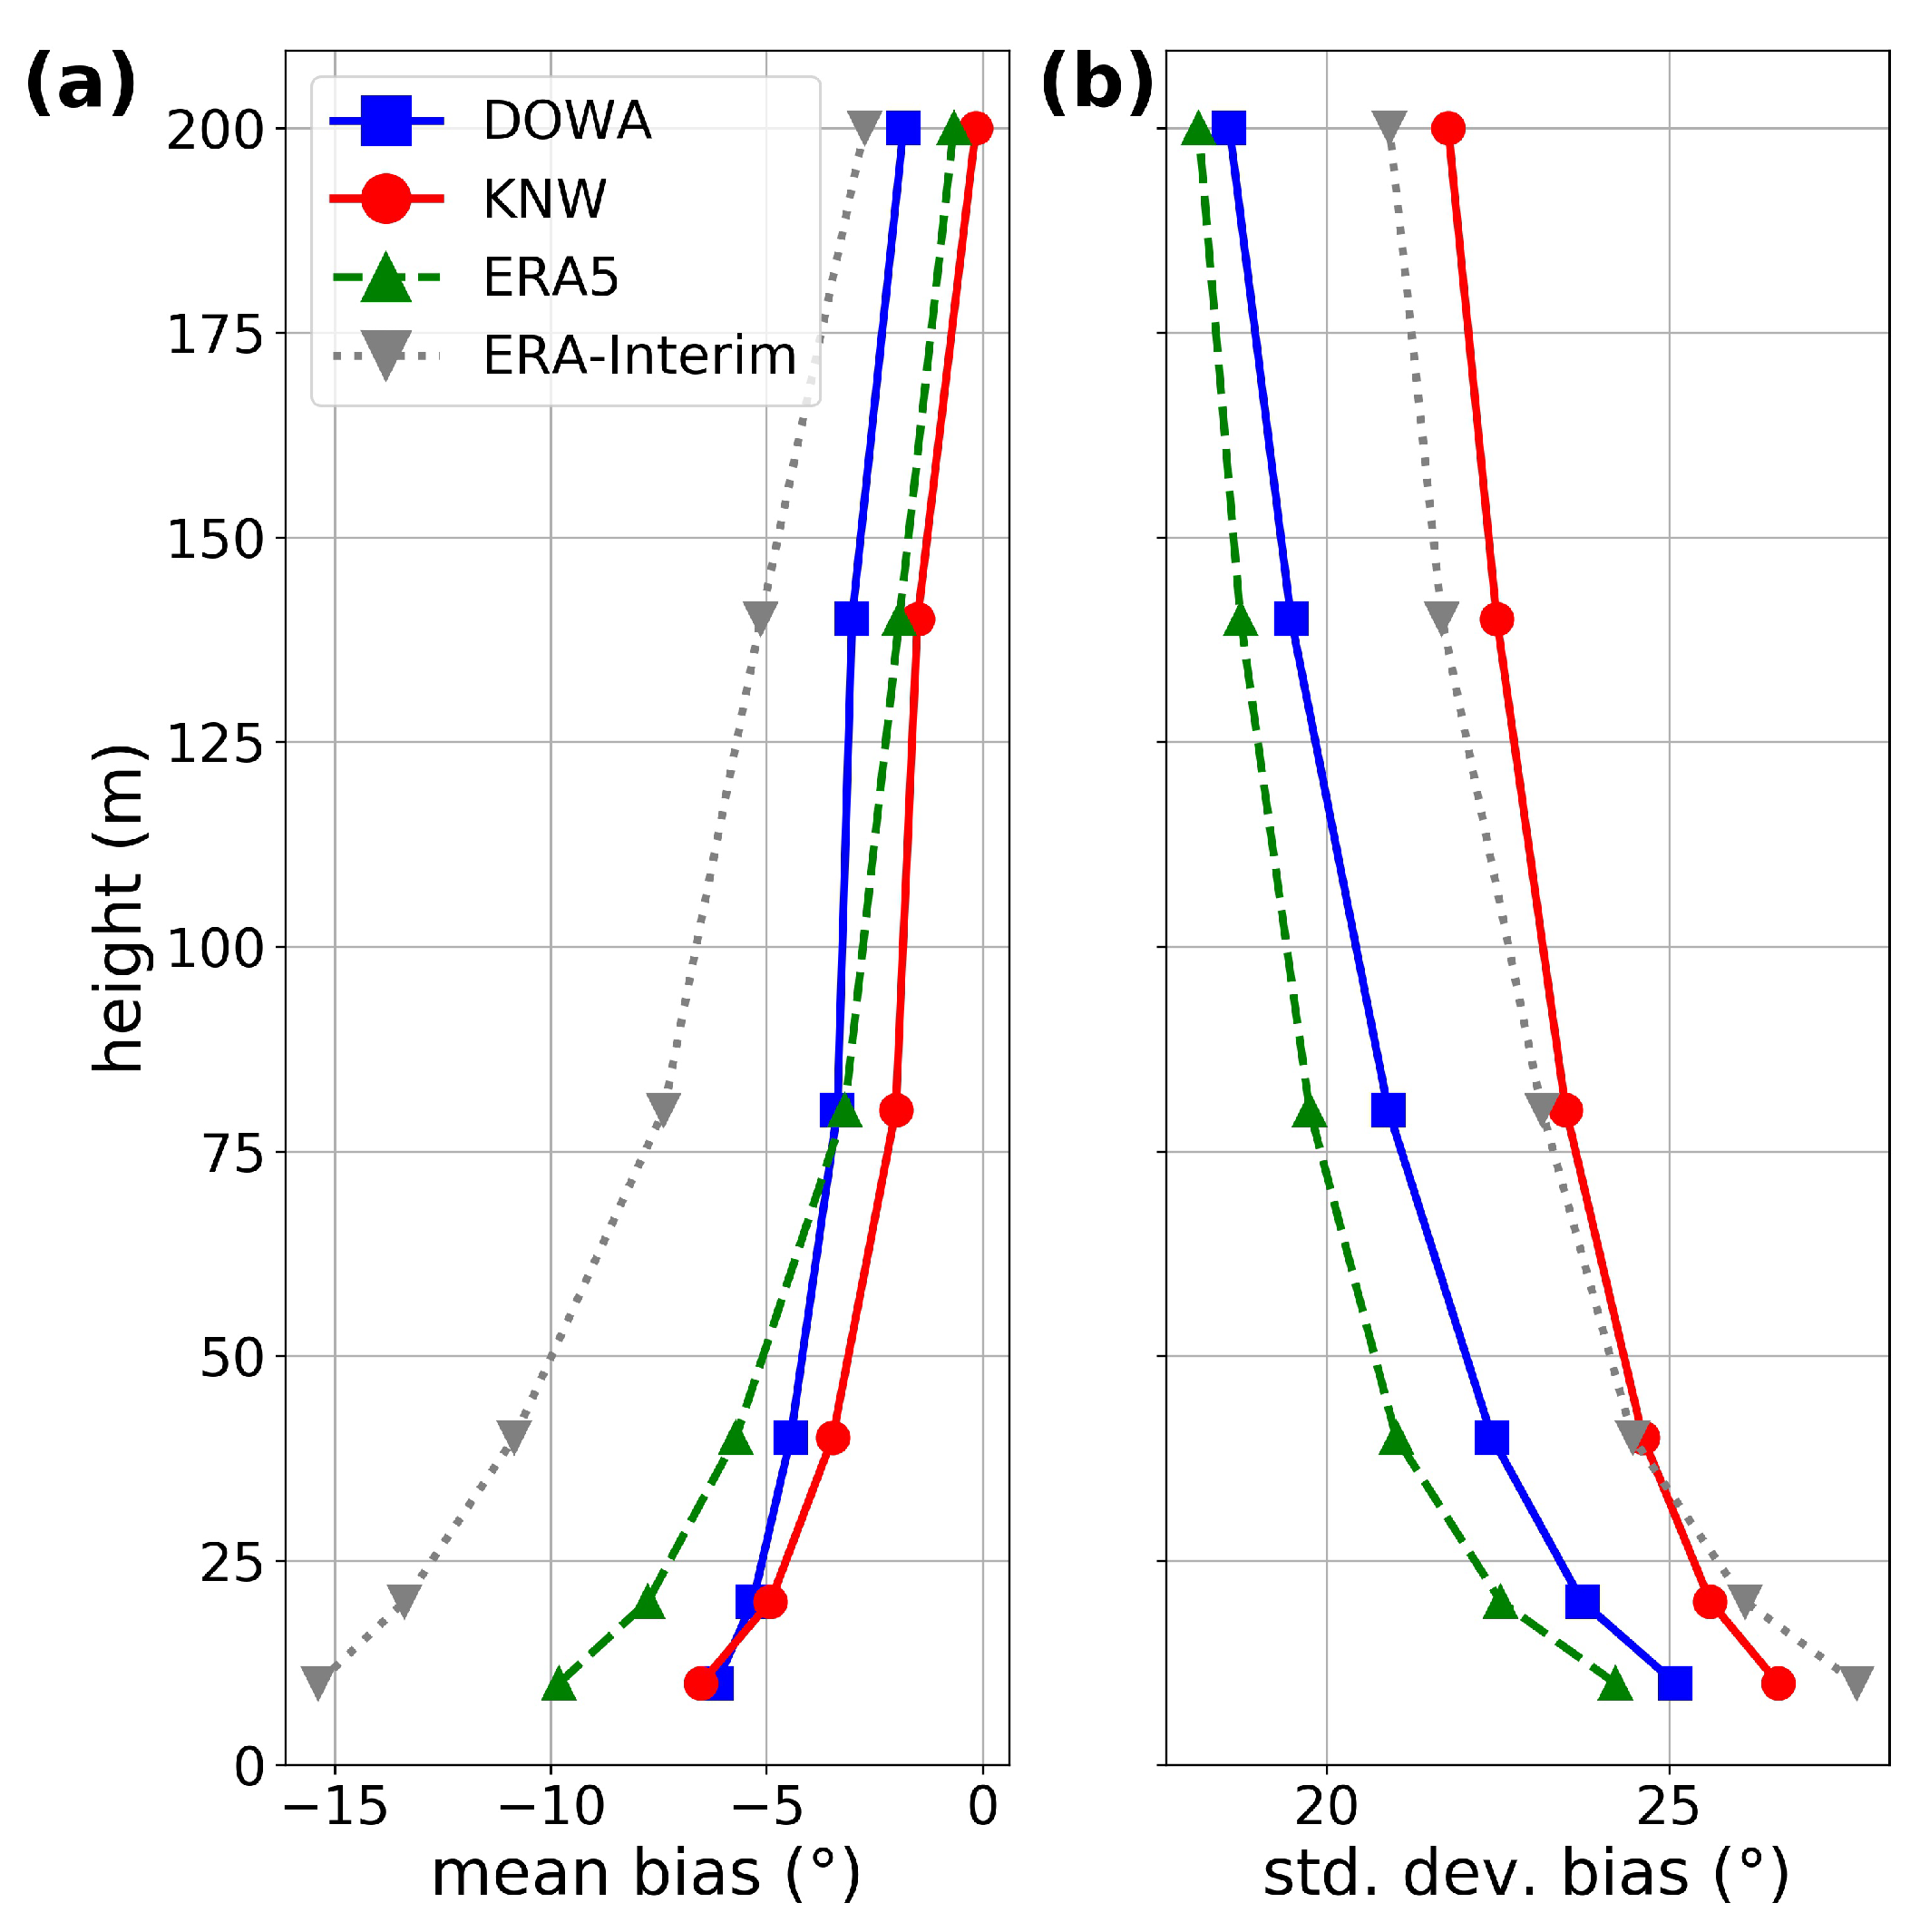
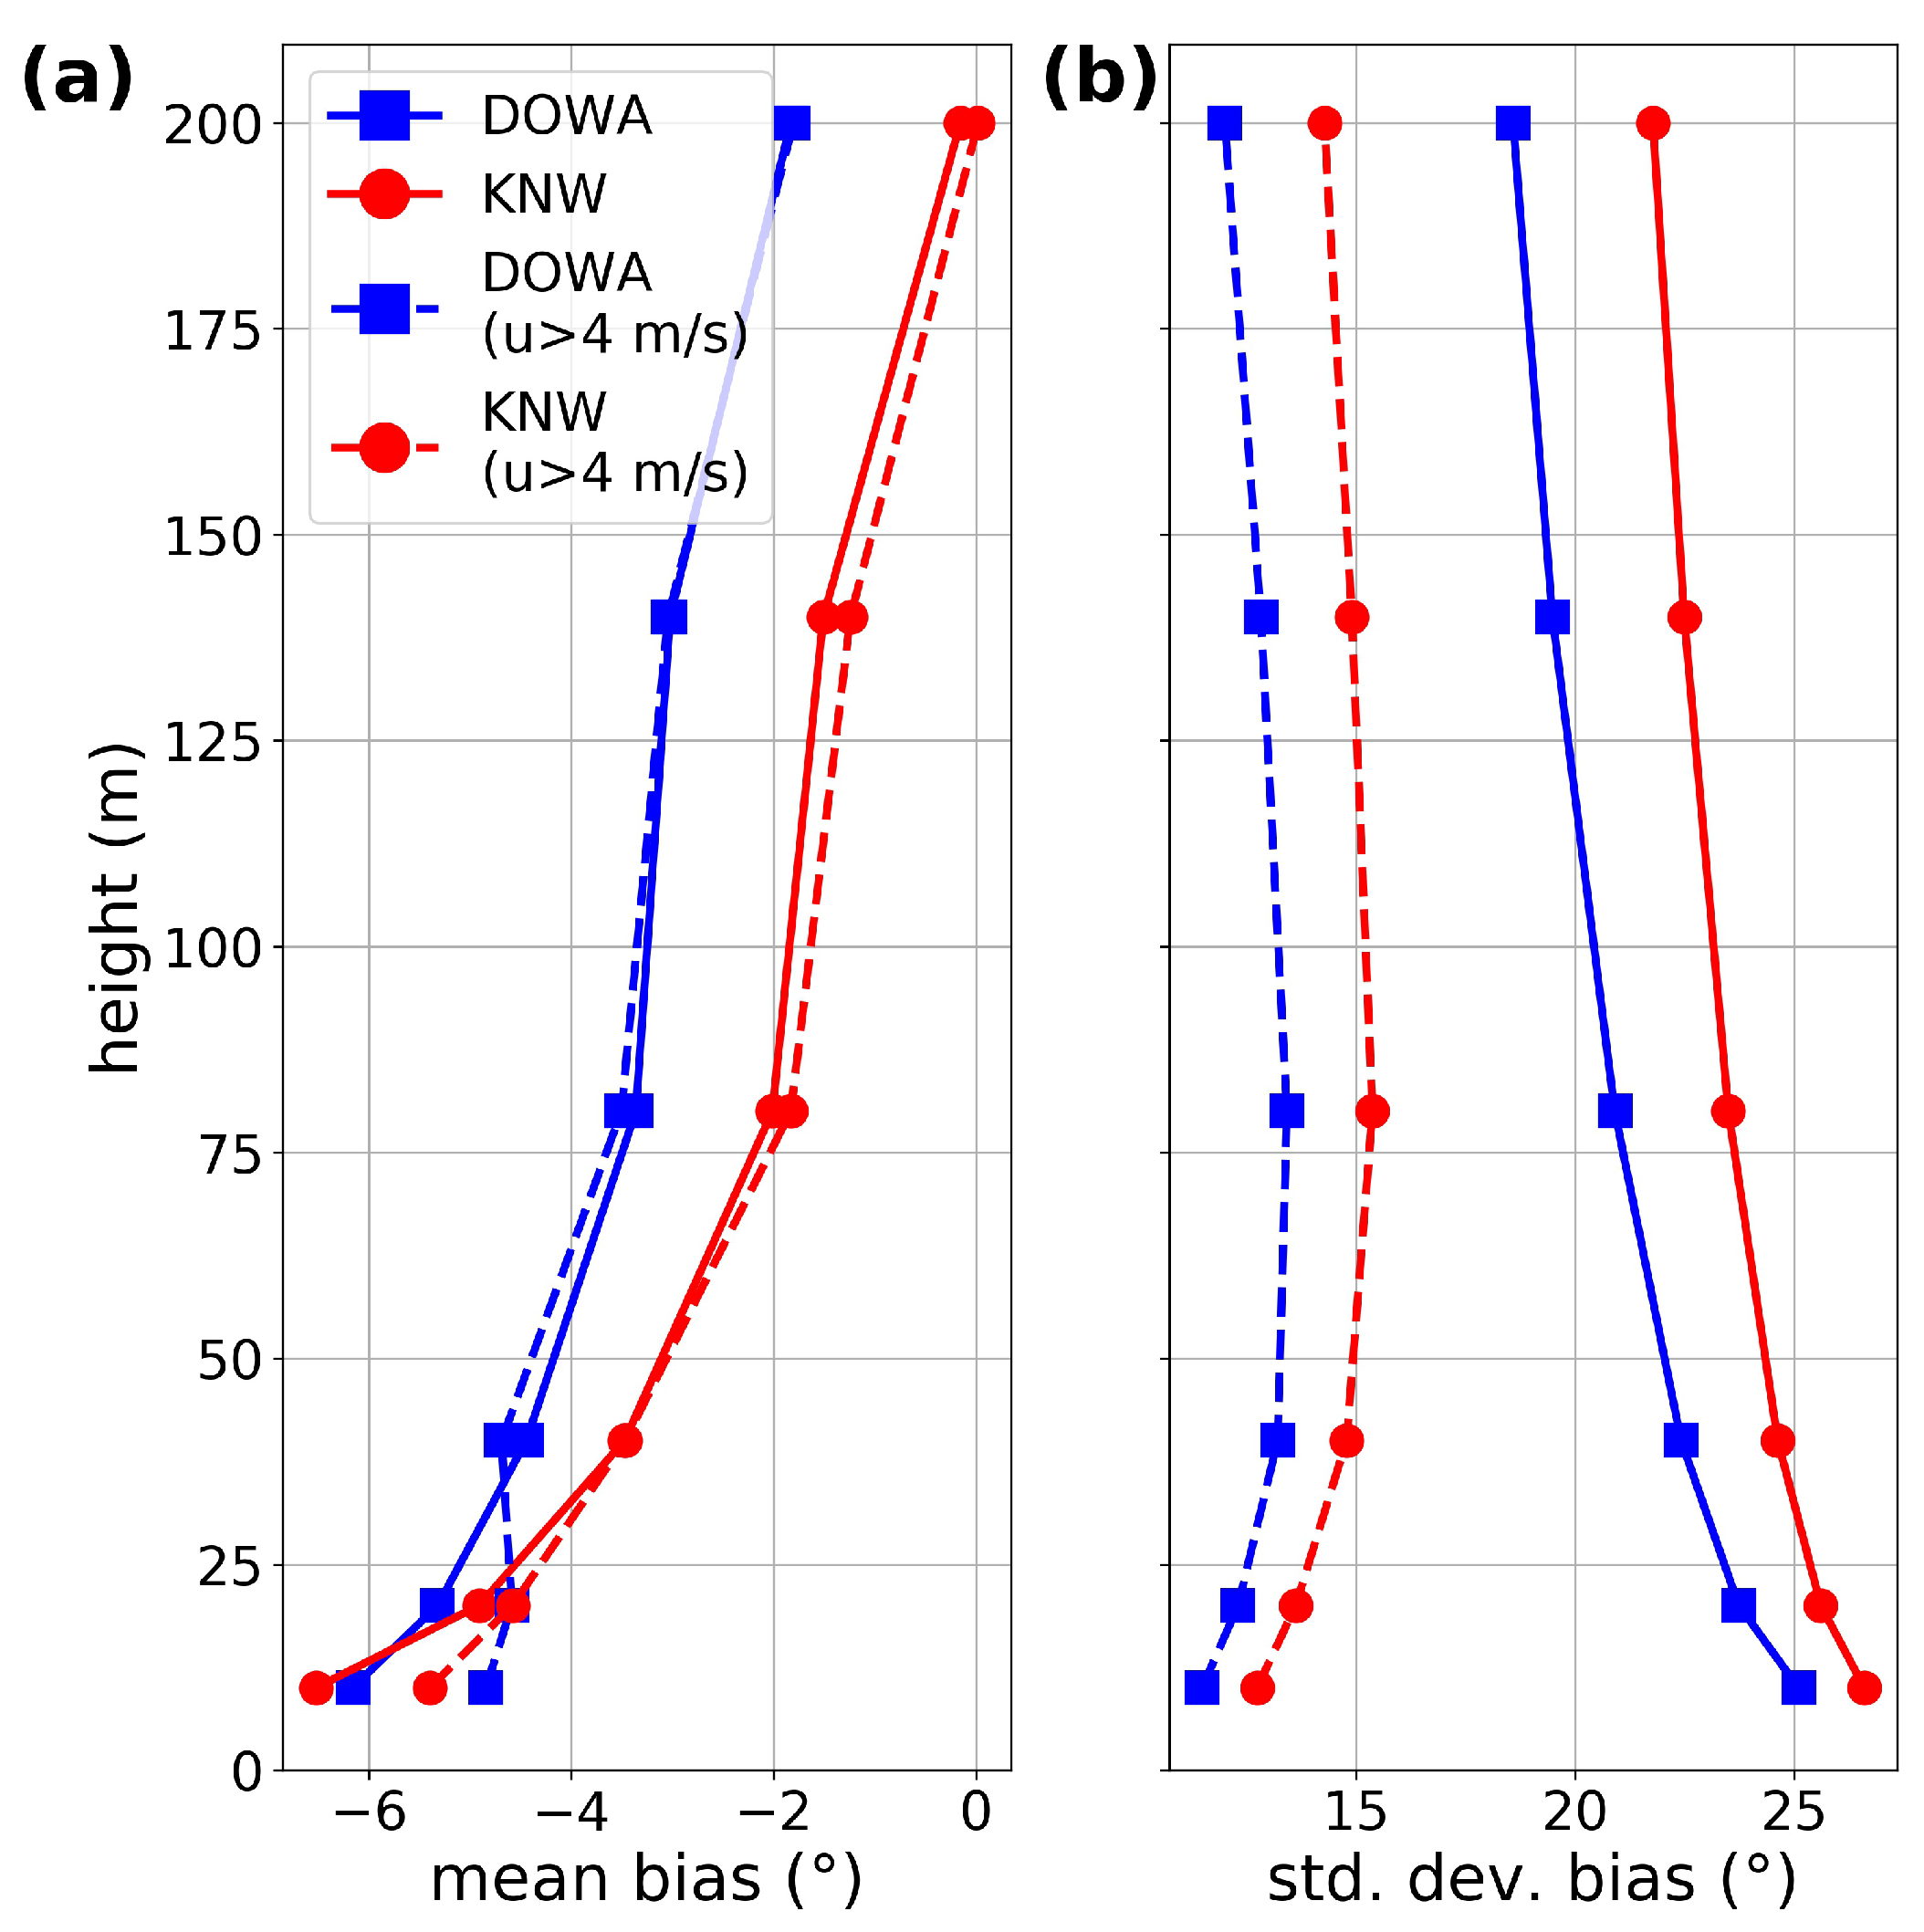
In this section, a validation of the wind direction data is performed. Height profiles of the bias (mean and standard deviation) for the different models are shown in Figure 9. Note that with regards to wind direction the KNW atlas without wind shear correction is the same as the KNW atlas and is therefore omitted in this section. In general, the mean bias decreases with increasing height. For DOWA, the mean bias ranges from −6° to −2° with increasing height, and these biases are similar (at 10 m and 20 m) or slightly larger than those of KNW. ERA5 performs similar to DOWA and KNW for the higher levels (80 m, 140 m, 200 m), and a bit worse for the lower levels (10 m, 20 m, and 40 m). ERA-Interim performs poorly for all heights showing a larger negative bias up to −15° at 10 m. The standard deviation of the bias decreases with increasing height for all models. For DOWA, the standard deviation of the bias ranges from 25° to 19°, and is slightly smaller than that of KNW for all heights. ERA5 and ERA-Interim show standard deviations of the bias similar to those of DOWA and KNW, respectively.
The standard deviation of the wind direction bias is very sensitive to the selected wind speed range. In Figure 10, the same results are shown for DOWA and KNW (solid lines) but now for wind speeds above 4 m/s (dashed lines). Clearly, the mean bias hardly changes, but the standard deviation of the bias is reduced by almost a factor of two.

6. Discussion

In this work, the validation of the DOWA atlas and a comparison with the KNW atlas, and the ECMWF global reanalyses, is performed by direct comparison with the Cabauw meteo mast wind measurements. A general problem for comparisons between model data and measurements is that models represent volume averages at a point in time and measurements represent time averages at one location. Is the model grid box representative for the measurement location? This is much more of an issue for onshore sites than for offshore sites. For instance, the average roughness of the grid box will in general be different (for meteorological observation sites typically higher) from the actual local roughness, which hinders comparisons with modeled and observed surface winds [32]. This issue mostly impacts the wind comparison at the lower levels, which are much more sensitive to the local environment in the vicinity of the measurement site than the wind at higher altitudes. In addition, heterogeneity of the location site can make this issue wind direction dependent.
The differences in model performance of DOWA and KNW can be due to many aspects, including differences in the global reanalysis dataset, the version of HARMONIE (including differences in roughness maps or turbulence schemes), and whether or not additional data assimilation in HARMONIE or cold starts are applied. It is difficult and beyond the scope of this validation work to attribute the validation difference between DOWA and KNW to these different aspects. For instance, a striking observation is the higher mean wind speed biases of DOWA for the 10 m and 20 m levels (see Figure 4). For these levels, DOWA underestimates the mean wind speed by 0.2 m/s–0.3 m/s, which can be attributed to the bias during the winter months. The KNW wind speed biases at those levels are below 0.1 m/s. This difference might be a result of the setting of the so-called XRIMAX parameter [33], which is a threshold that controls the mixing [34]. For HARMONIE version 40 (DOWA) the XRIMAX parameter is set to zero, limiting mixing. As a result, model wind at lower levels is underestimated. For HARMONIE version 37 (KNW), the XRIMAX parameter is non-zero (0.2), resulting in a difference between DOWA and KNW.
Finally, in preparing the different datasets, several choices have been made that may impact the validation results. This includes the temporal averaging of the measurement data and the model gridpoint selection. Their impact are discussed in Appendices Appendix A and Appendix B, respectively.

7. Conclusions

DOWA has been validated with 10 years of Cabauw wind mast measurements between 10 m and 200 m heights and compared to the KNW atlas and the global reanalyses ERA-Interim and ERA5. In terms of long-term climatological comparisons, the DOWA and KNW wind speed biases are within 0.1 m/s for heights of 40 m and above. This means these biases are within the measurement accuracy. For the lowest levels (10 m and 20 m), DOWA underestimates the mean wind speed by 0.2 m/s–0.3 m/s, which might be attributed to a particular parameter setting in HARMONIE version 40 (see Section 6). The KNW wind speed biases at those heights are below 0.1 m/s. The standard deviation of the wind speed bias for DOWA increases with height and ranges from 0.9 m/s to 1.3 m/s (0.1 m/s–0.2 m/s smaller than those of KNW).
The diurnal cycle is better captured by DOWA than by KNW (which can be attributed to the absence of cold starts in DOWA) although some minor non-physical features are still present in DOWA due to the three hourly data assimilation. Linear regression on the hourly wind speed data gives for DOWA a slope and a R 2 that ranges from 0.88 to 0.94 and 0.87 to 0.90, respectively, which is slightly better than KNW (slope: 0.89–0.92, R 2 : 0.84–0.86).
The DOWA mean wind direction bias decreases with height and ranges from −6° to −2°, which is similar to KNW at lower levels and larger (more negative) than KNW by 1° to 2° at higher levels. The standard deviation in the wind direction bias for DOWA also decreases with height and ranges from 20° to 25°, which is 2–3° smaller than those of KNW.
KNW and DOWA outperform ERA-Interim and ERA5 for all analyses and for all heights, demonstrating that downscaling those global reanalysis datasets with HARMONIE does add skill.

Author Contributions

Conceptualization, S.K., P.R., and I.W.; data analysis, S.K. and P.R.; writing—original draft preparation, S.K.; writing—review and editing, S.K., P.R., and I.W. All authors have read and agreed to the published version of the manuscript.

Funding

This research was supported by the Topsector Energy subsidy from the Ministry of Economic Affairs and Climate Policy (SDE + Hernieuwbare Energie Call).

Acknowledgments

The authors would like to thank the CESAR Observatory for providing the Cabauw mast wind data (https://dataplatform.knmi.nl/), Henk van den Brink for downloading and processing the ERA-Interim and ERA5 datasets, Cees de Valk for providing information about the uncertainty analysis, Fred Bosveld and Wiel Wauben for input on the accuracy and calibration Cabauw mast wind measurements, Bert van Ulft, Jan Barkmeijer, Jeanette Onvlee, Wim de Rooij, John de Vries, and Peter Baas for providing information about HARMONIE, and Andrew Stepek for fruitful discussions.

Conflicts of Interest

The authors declare no conflict of interest.

Abbreviations

The following abbreviations are used in this manuscript:
ASCATAdvanced Scatterometer
CESARCabauw Experimental Site for Atmospheric Research
DOWADutch Offshore Wind Atlas
ECMWFEuropean Center for Medium-Range Weather Forecasts
EHSEnhanced Surveillance
ERAECMWF Reanalysis
ESSequivalent sample size
HARATUHARMONIE with RACMO Turbulence
HARMONIEHIRLAM ALADIN Research on Mesoscale Operational NWP In Euromed
HIRLAMHigh Resolution Limited Area Model
KNMIRoyal Netherlands Meteorological Institute
KNWKNMI North sea Wind
KNW-wowscKNW without wind shear correction
LESLarge Eddy Simulations
NEWANew European Wind Atlas
NWPNumerical Weather Prediction
RACMORegional Atmospheric Climate Model
RANSReynolds-Averaged Navier–Stokes
WMOWorld Meteorological Organization
WRFWeather Research and Forecasting model

Appendix A. Mast Measurement Time Averaging
The wind atlases have an hourly output (except ERA-Interim, which is 6-h) that represent the state of the atmosphere at the full hour. The Cabauw meteomast measurements used are 10-min averaged output. To validate DOWA with Cabauw measurements, one hour of Cabauw measurements are averaged, i.e., six 10-min averaged data values are taken, namely those belonging to the half hour before and half hour after the full hour. This method conforms to the one used to validate the KNW atlas [12], in which 60-min-averaging was motivated by comparing the mast and model once-a-year winds for different averaging times.
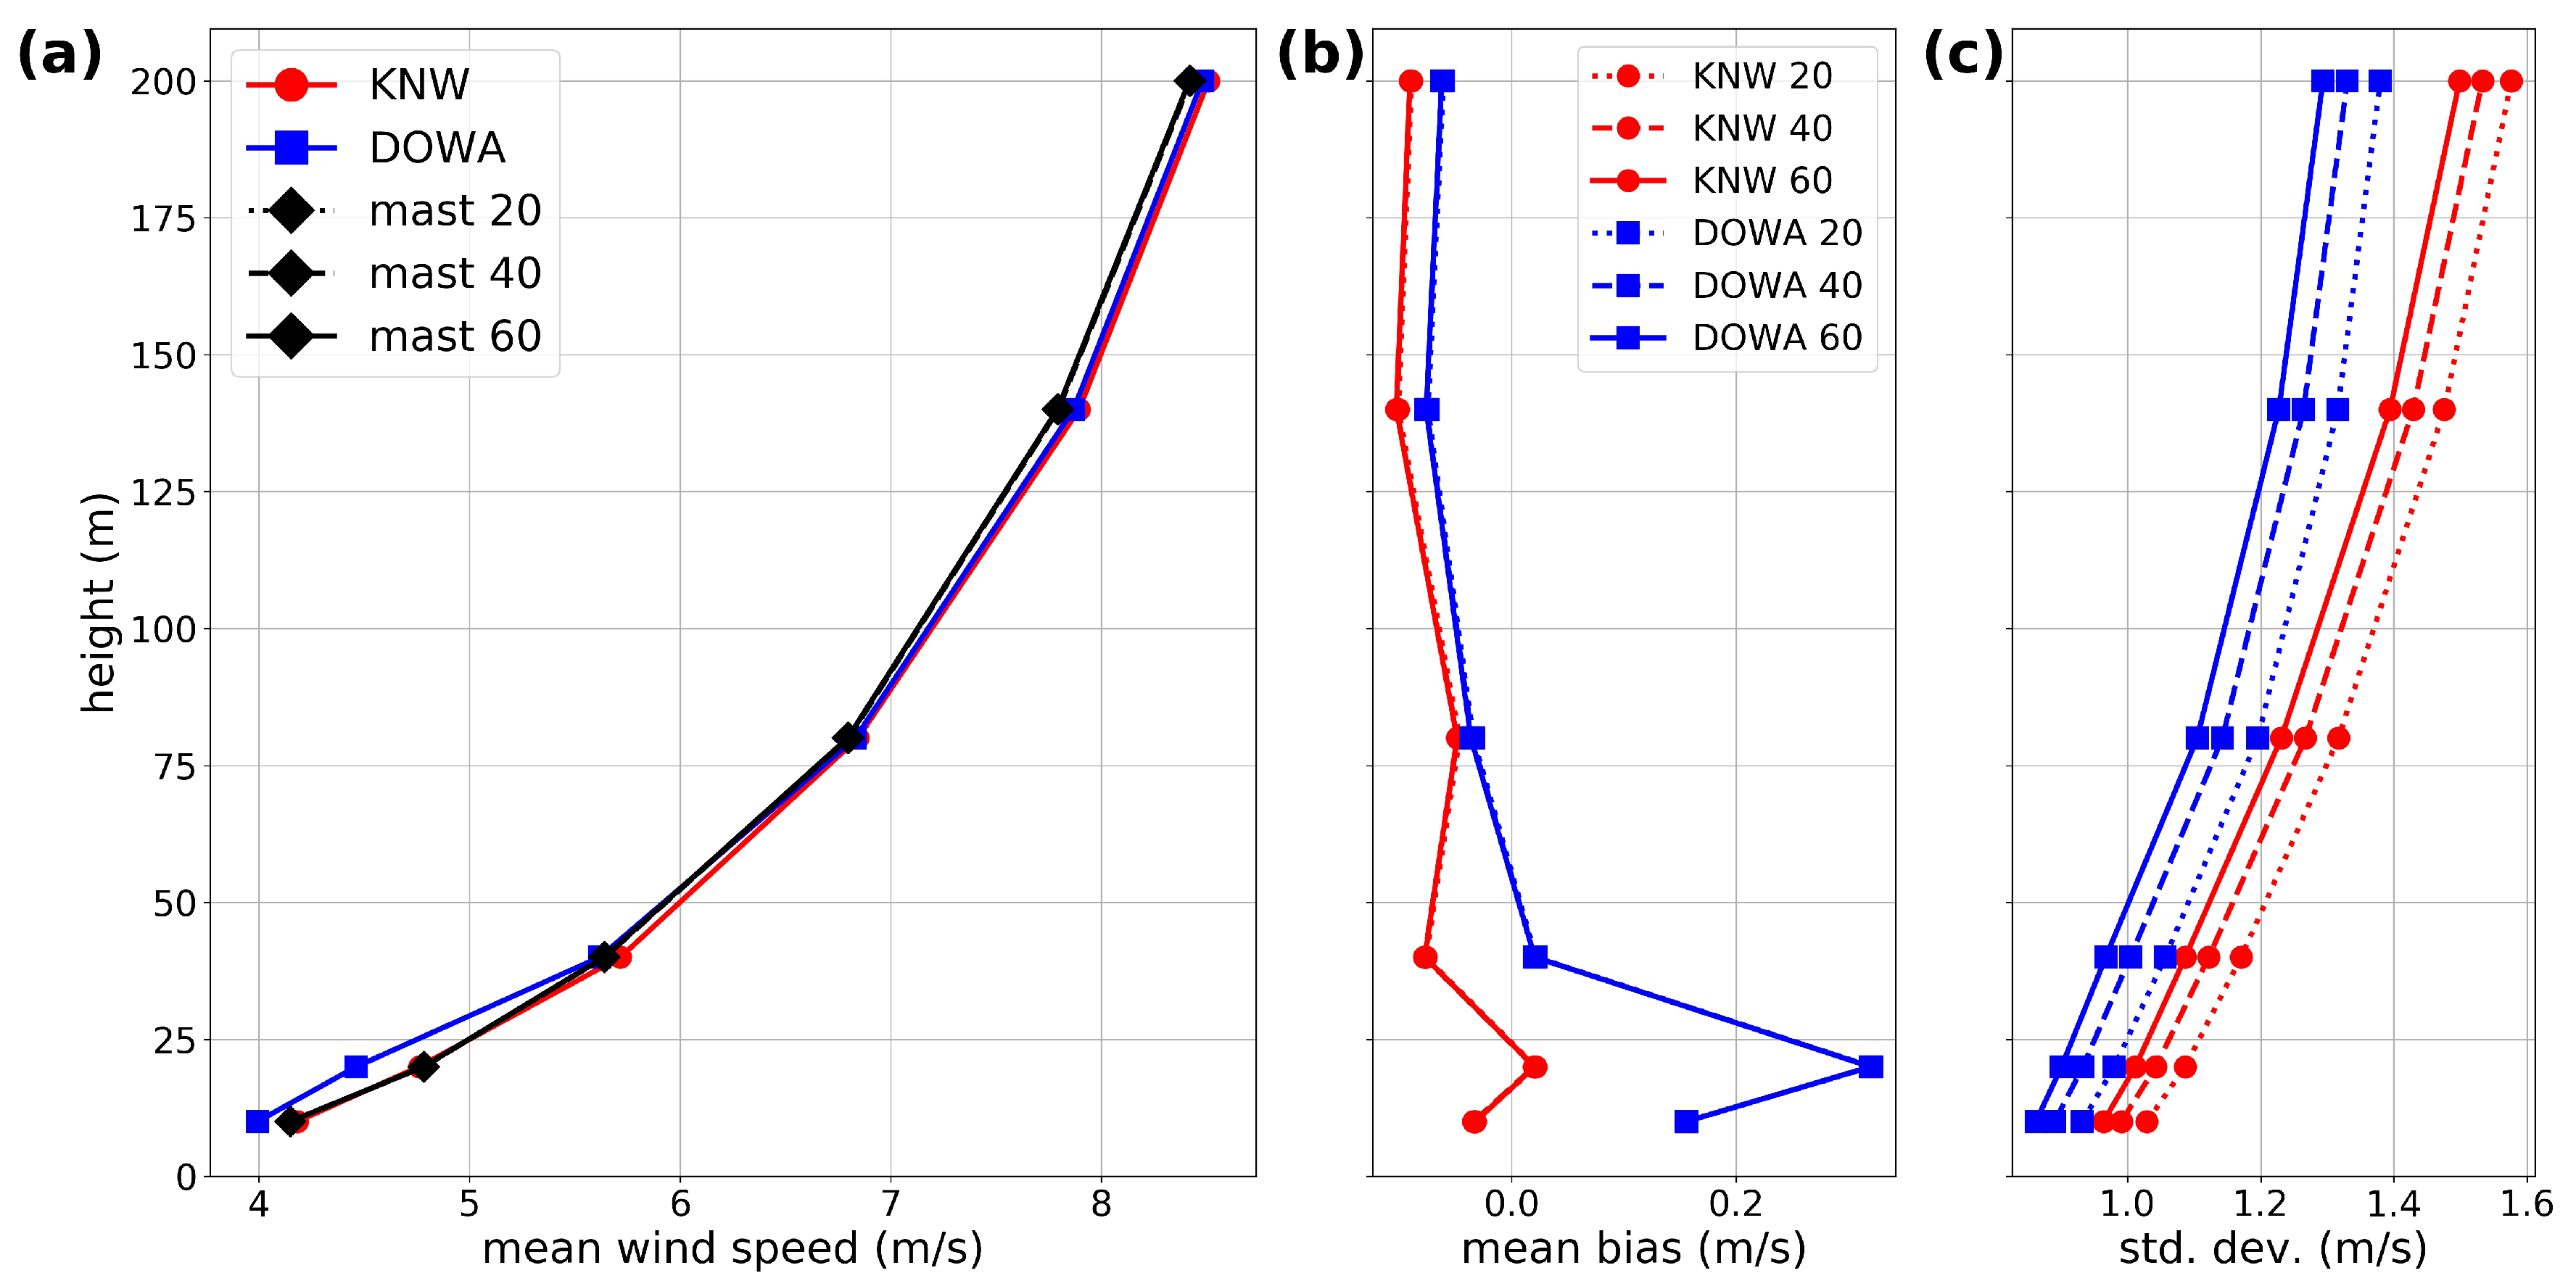
We compare the validation results for DOWA and KNW for averaging times around the full hour of 20, 40 and 60 min of the mast measurements. In Figure A1, the height profiles of (a) the mean wind speed and (b) the mean bias are shown. No difference between the three averaging time can be observed. In Figure A1c, the height profiles of the standard deviation of the bias between the measurements and the models are shown. Here the standard deviation decreases with increasing averaging time, but the comparison between DOWA and KNW remains the same. In Figure A2, the results of the linear regression fits (slope, offset and R 2 ) are shown. The results improve with increasing averaging time but this behavior is the same for DOWA and KNW. Finally, in Figure A3, the height profiles of the mean bias and standard deviation of the bias for DOWA and KNW wind direction are shown. For the mean bias, no differences can be seen, while the standard deviation decreases with increasing averaging time.
To conclude, within averaging times of one hour no effect is seen on the overall bias in wind speed and wind direction but for the standard deviation the results depend on the chosen averaging time. However, the comparison between DOWA and KNW does not depend on this choice.
Figure A1. Height profile of (a) the mean wind speed, (b), mean bias and (c) the standard deviation of the bias, showing mast measurements (black), DOWA (blue), and KNW atlas (red), for different averaging times (20, 40, and 60 min) of the mast measurements.
Energies 13 06558 g0a1
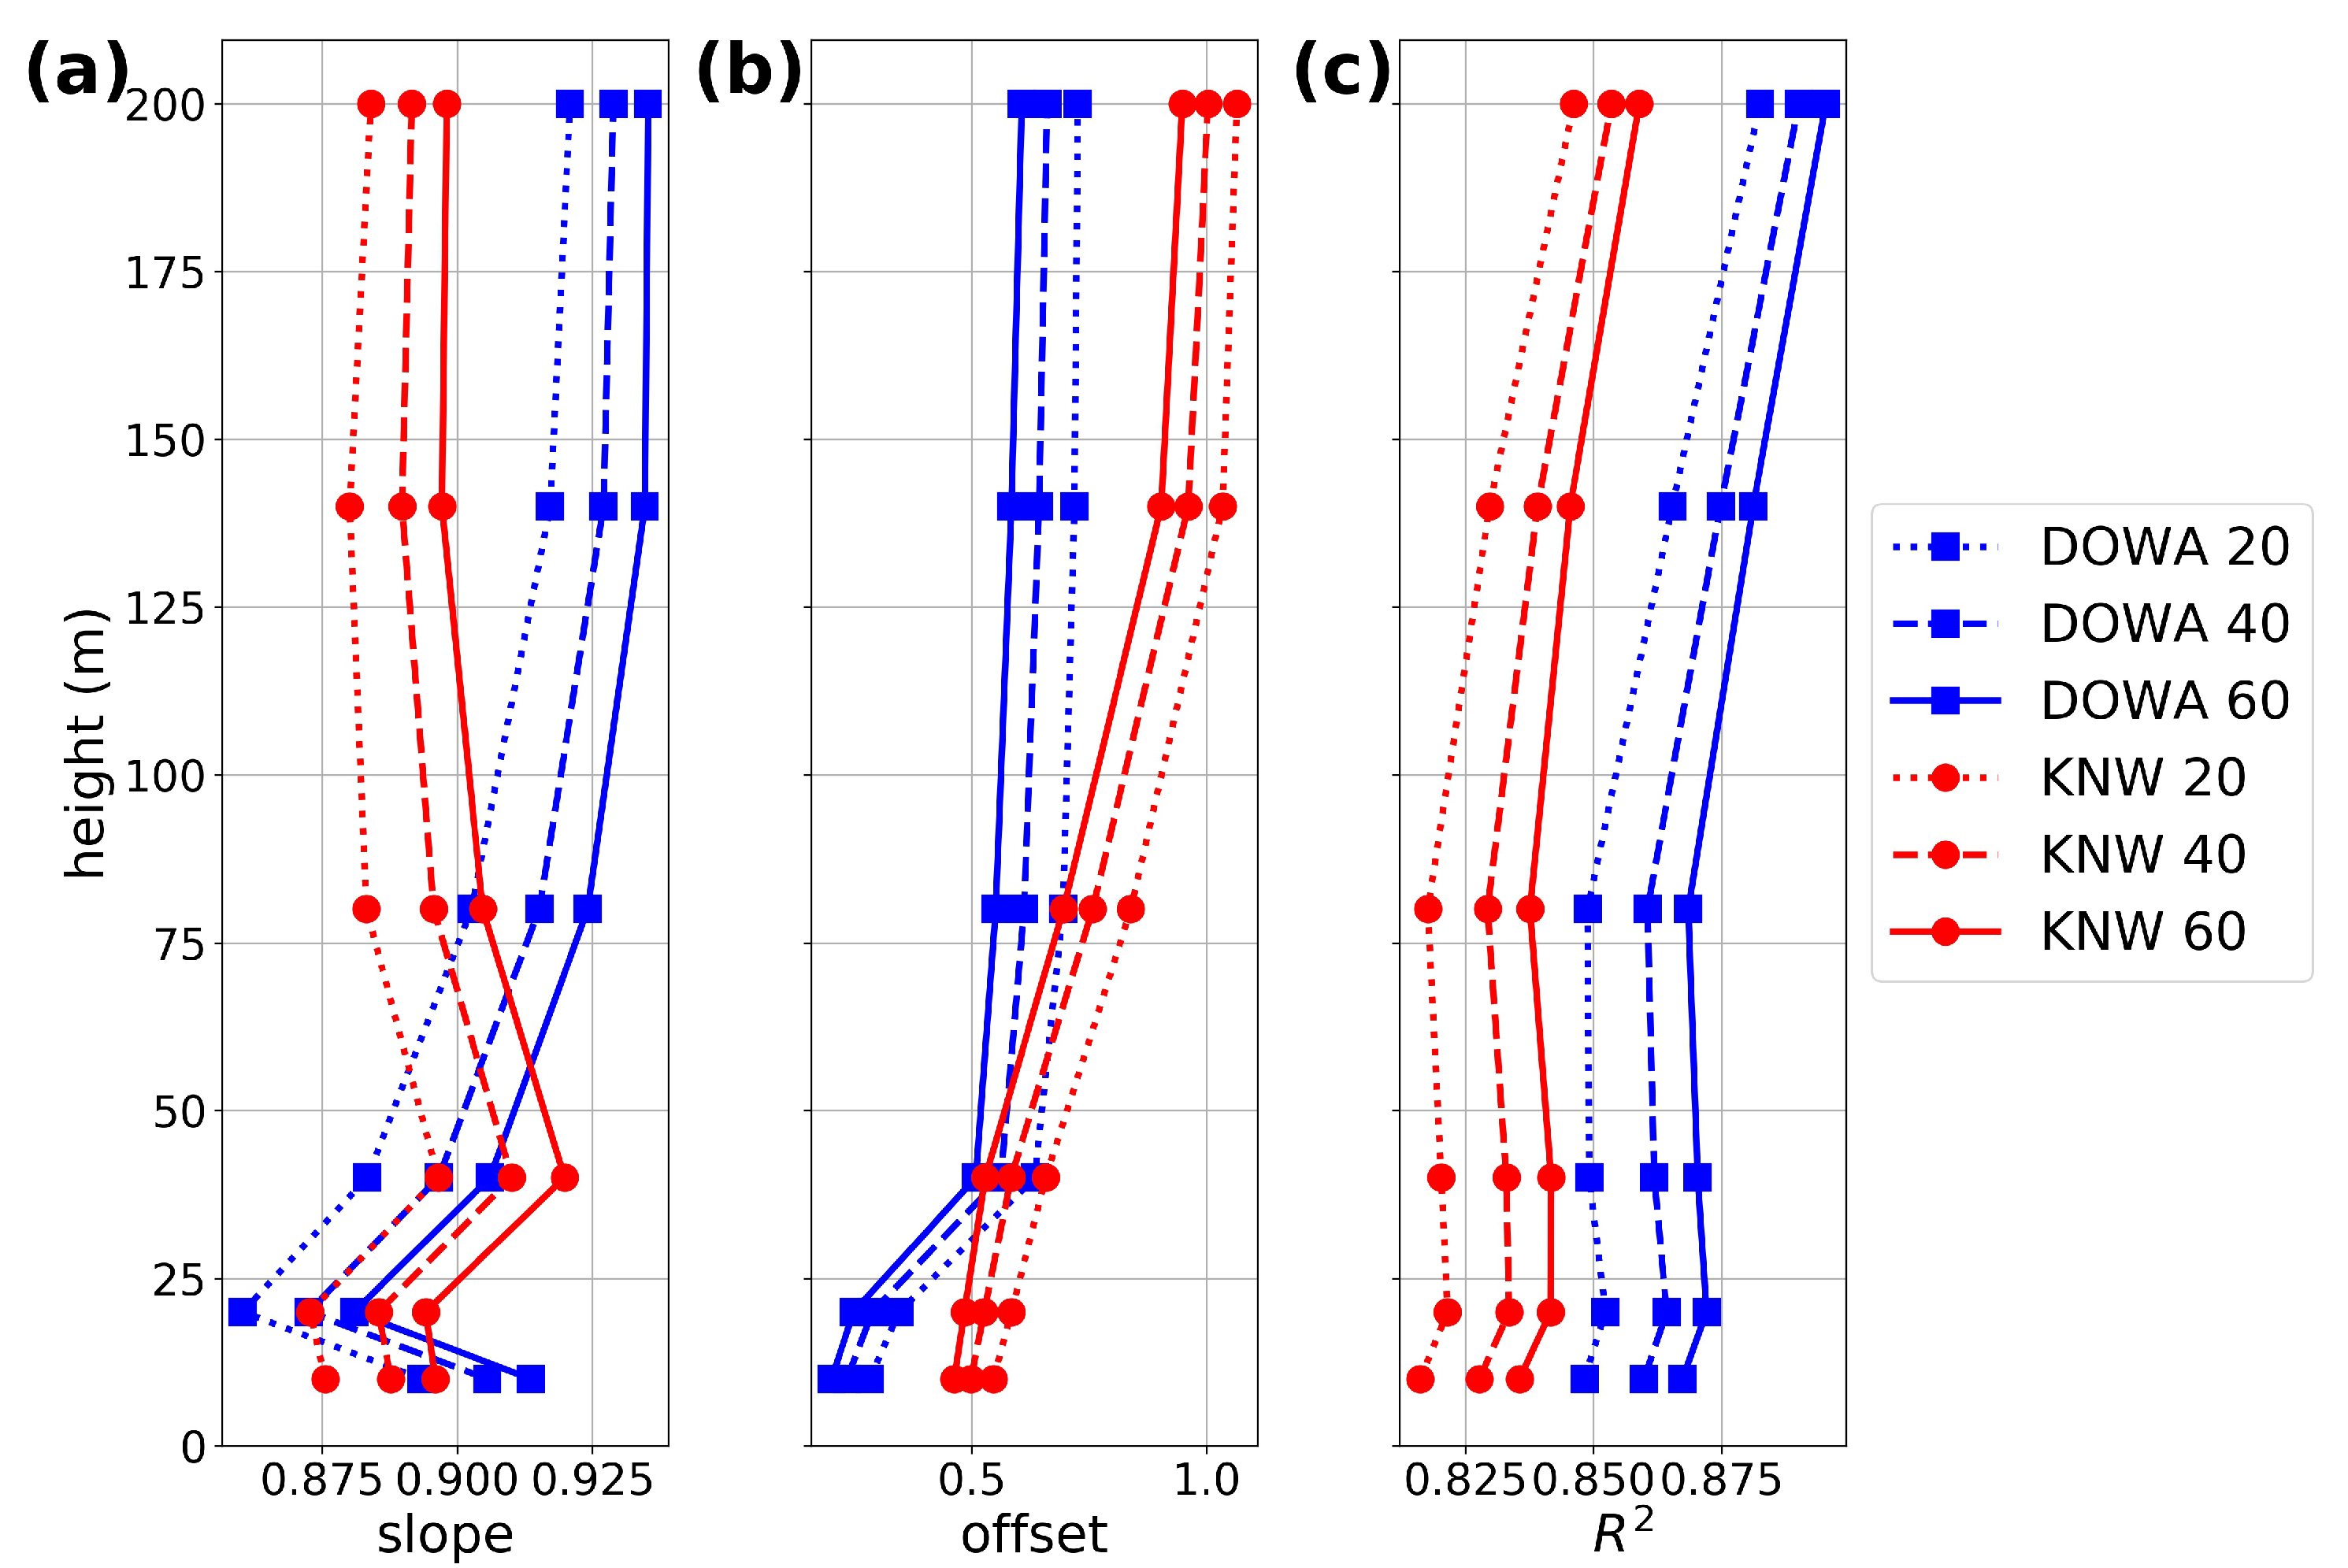
Figure A2. Height profile of the results of the linear regression (a) slope, (b) offset and (c) R 2 of the wind speed data, comparing the DOWA (blue) and KNW atlas (red), for different averaging times (20, 40, and 60 min) of the mast measurements.
Energies 13 06558 g0a2
Figure A3. Height profile of (a) the mean bias and (b) standard deviation of the bias of the wind direction data, comparing the DOWA (blue) and KNW atlas (red), for different averaging times (20, 40, and 60 min) of the mast measurements.
Energies 13 06558 g0a3

Appendix B. Grid Point Selection

The coordinates of the Cabauw meteorological mast are 51.9703° N, 4.9263° E. For DOWA and KNW, the nearest grid point is taken:
  • DOWA:
    -
    grid point indices x = 99, y = 74;
    -
    51.96548° N, 4.936425° E;
  • KNW:
    -
    grid point indices x = 95, y = 71;
    -
    51.962802° N, 4.918203° E;
For ERA-Interim and ERA5, four coordinates are chosen for which the datasets are downloaded from ECMWF: (51.875° N, 4.875° E), (52° N, 4.875° E), (51.875° N, 5° E), (52° N, 5° E), and linearly interpolated for the Cabauw mast location.
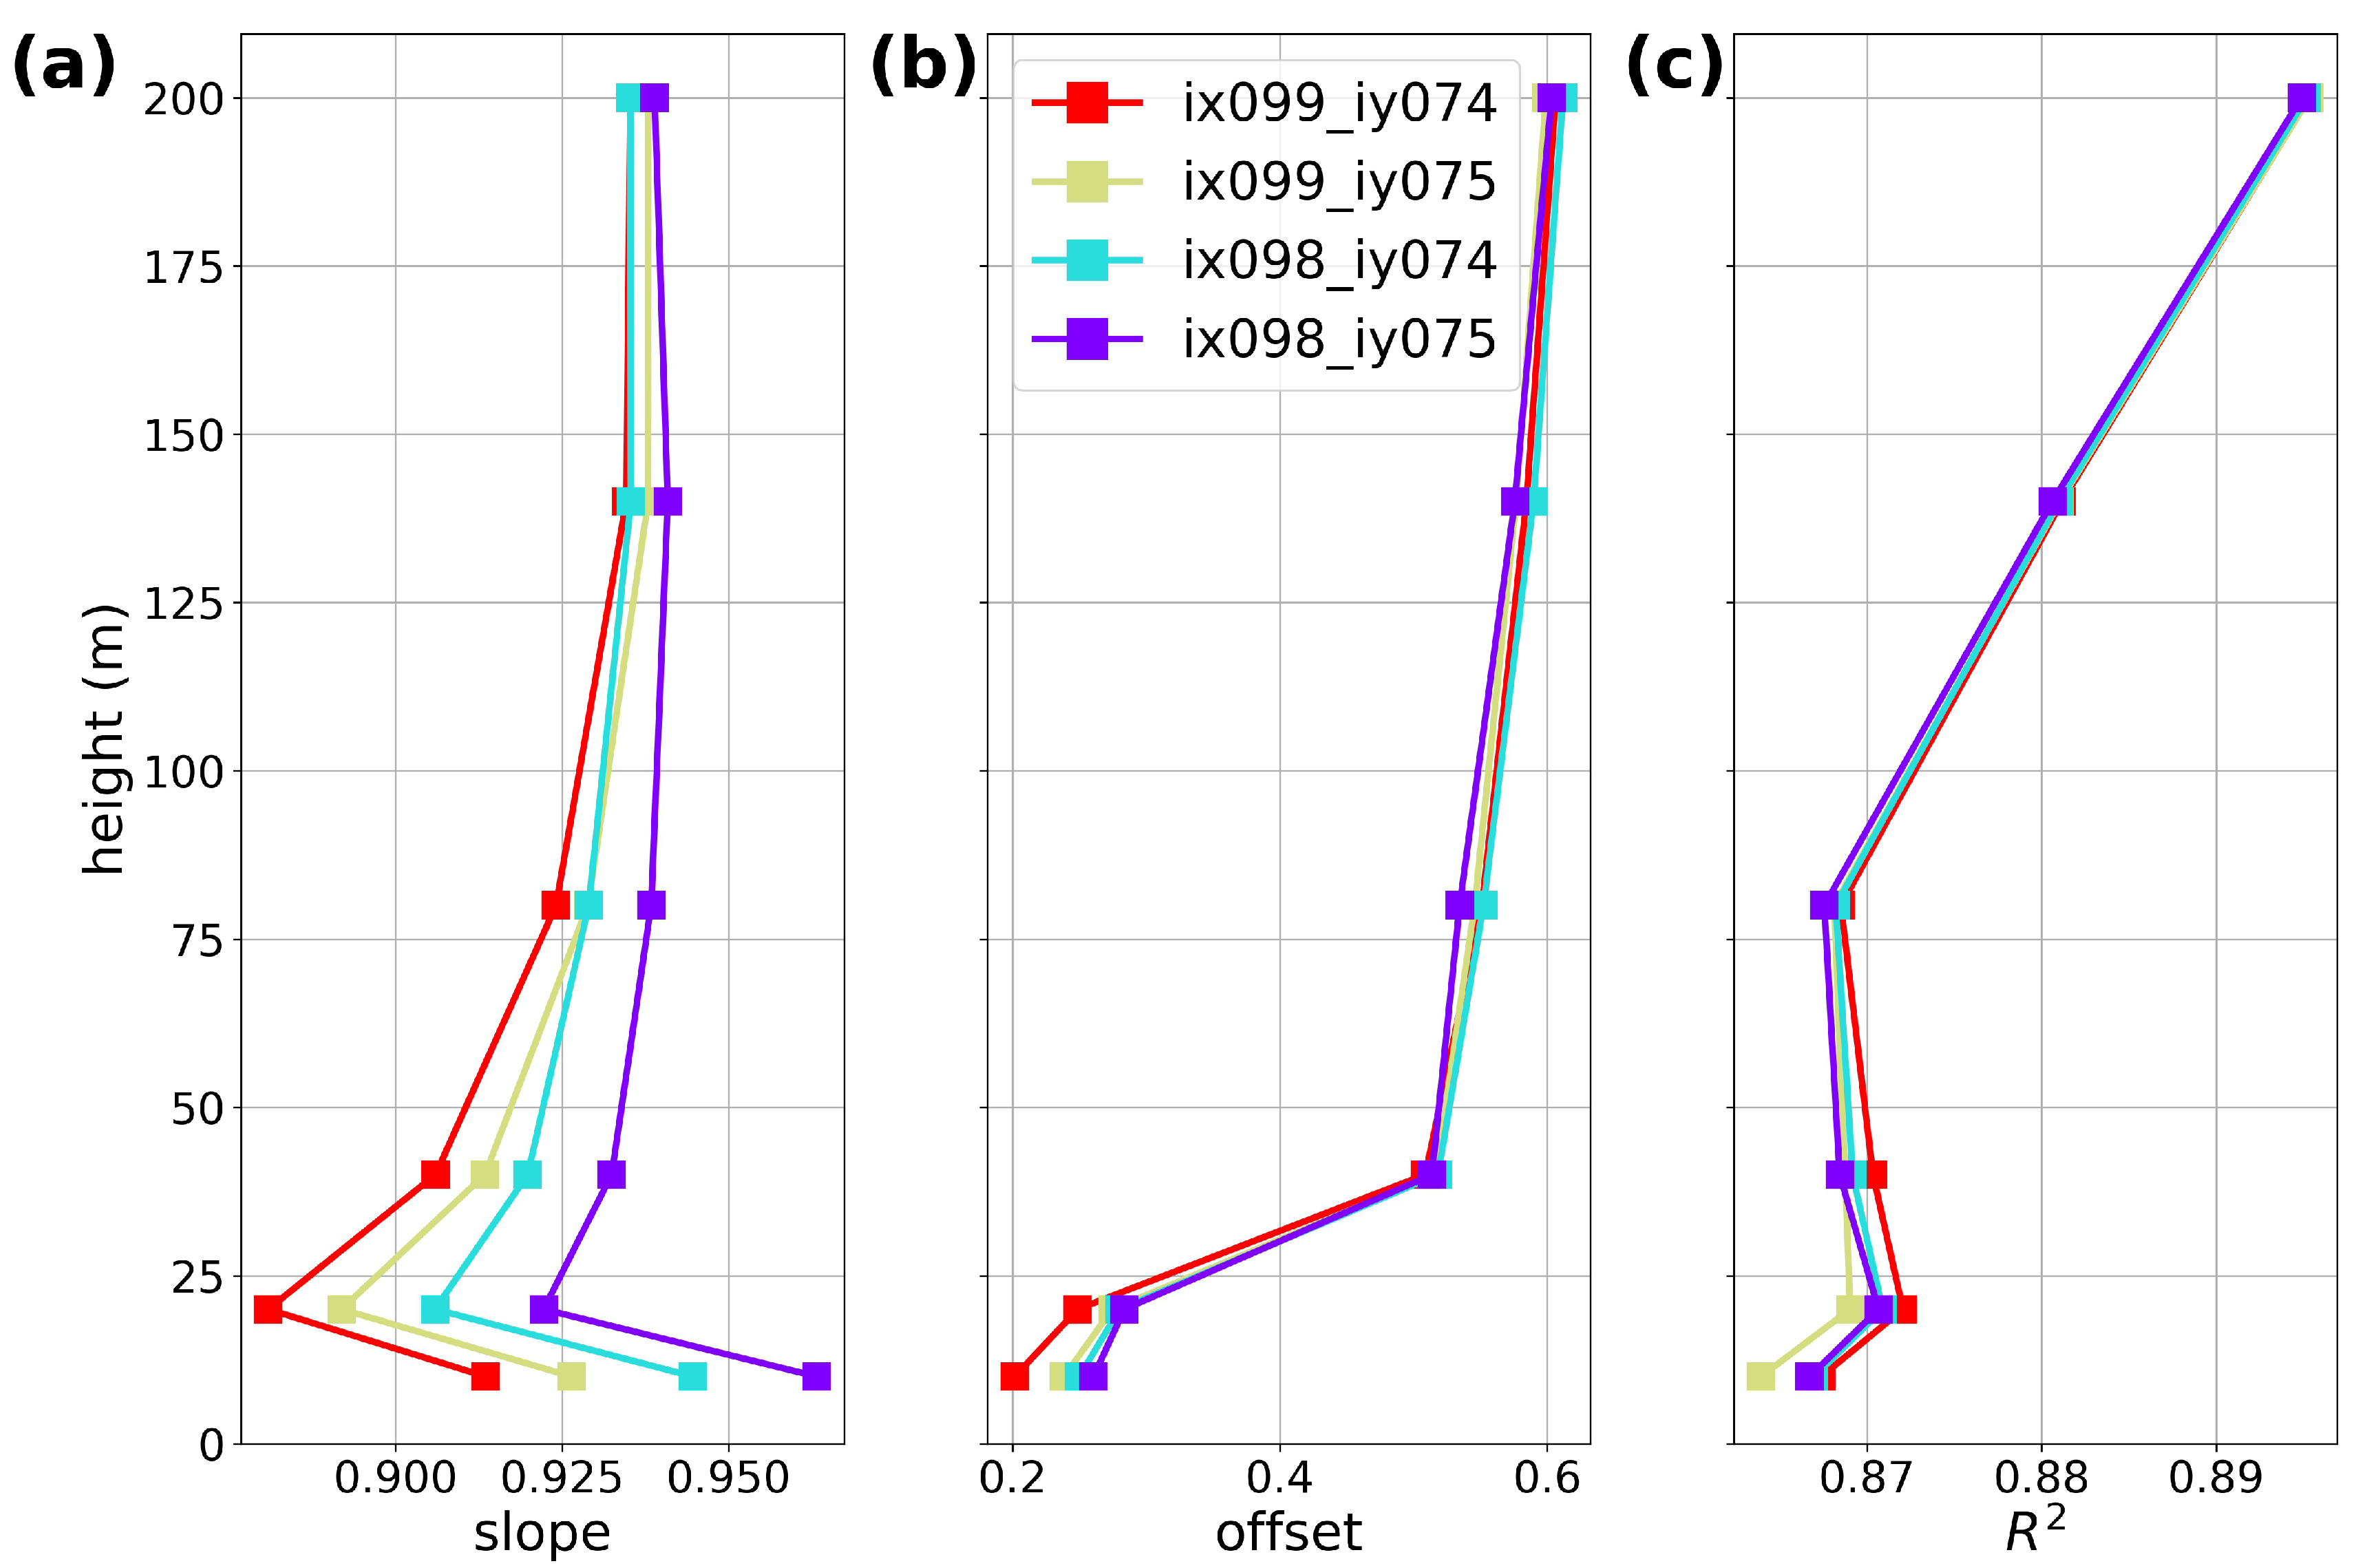
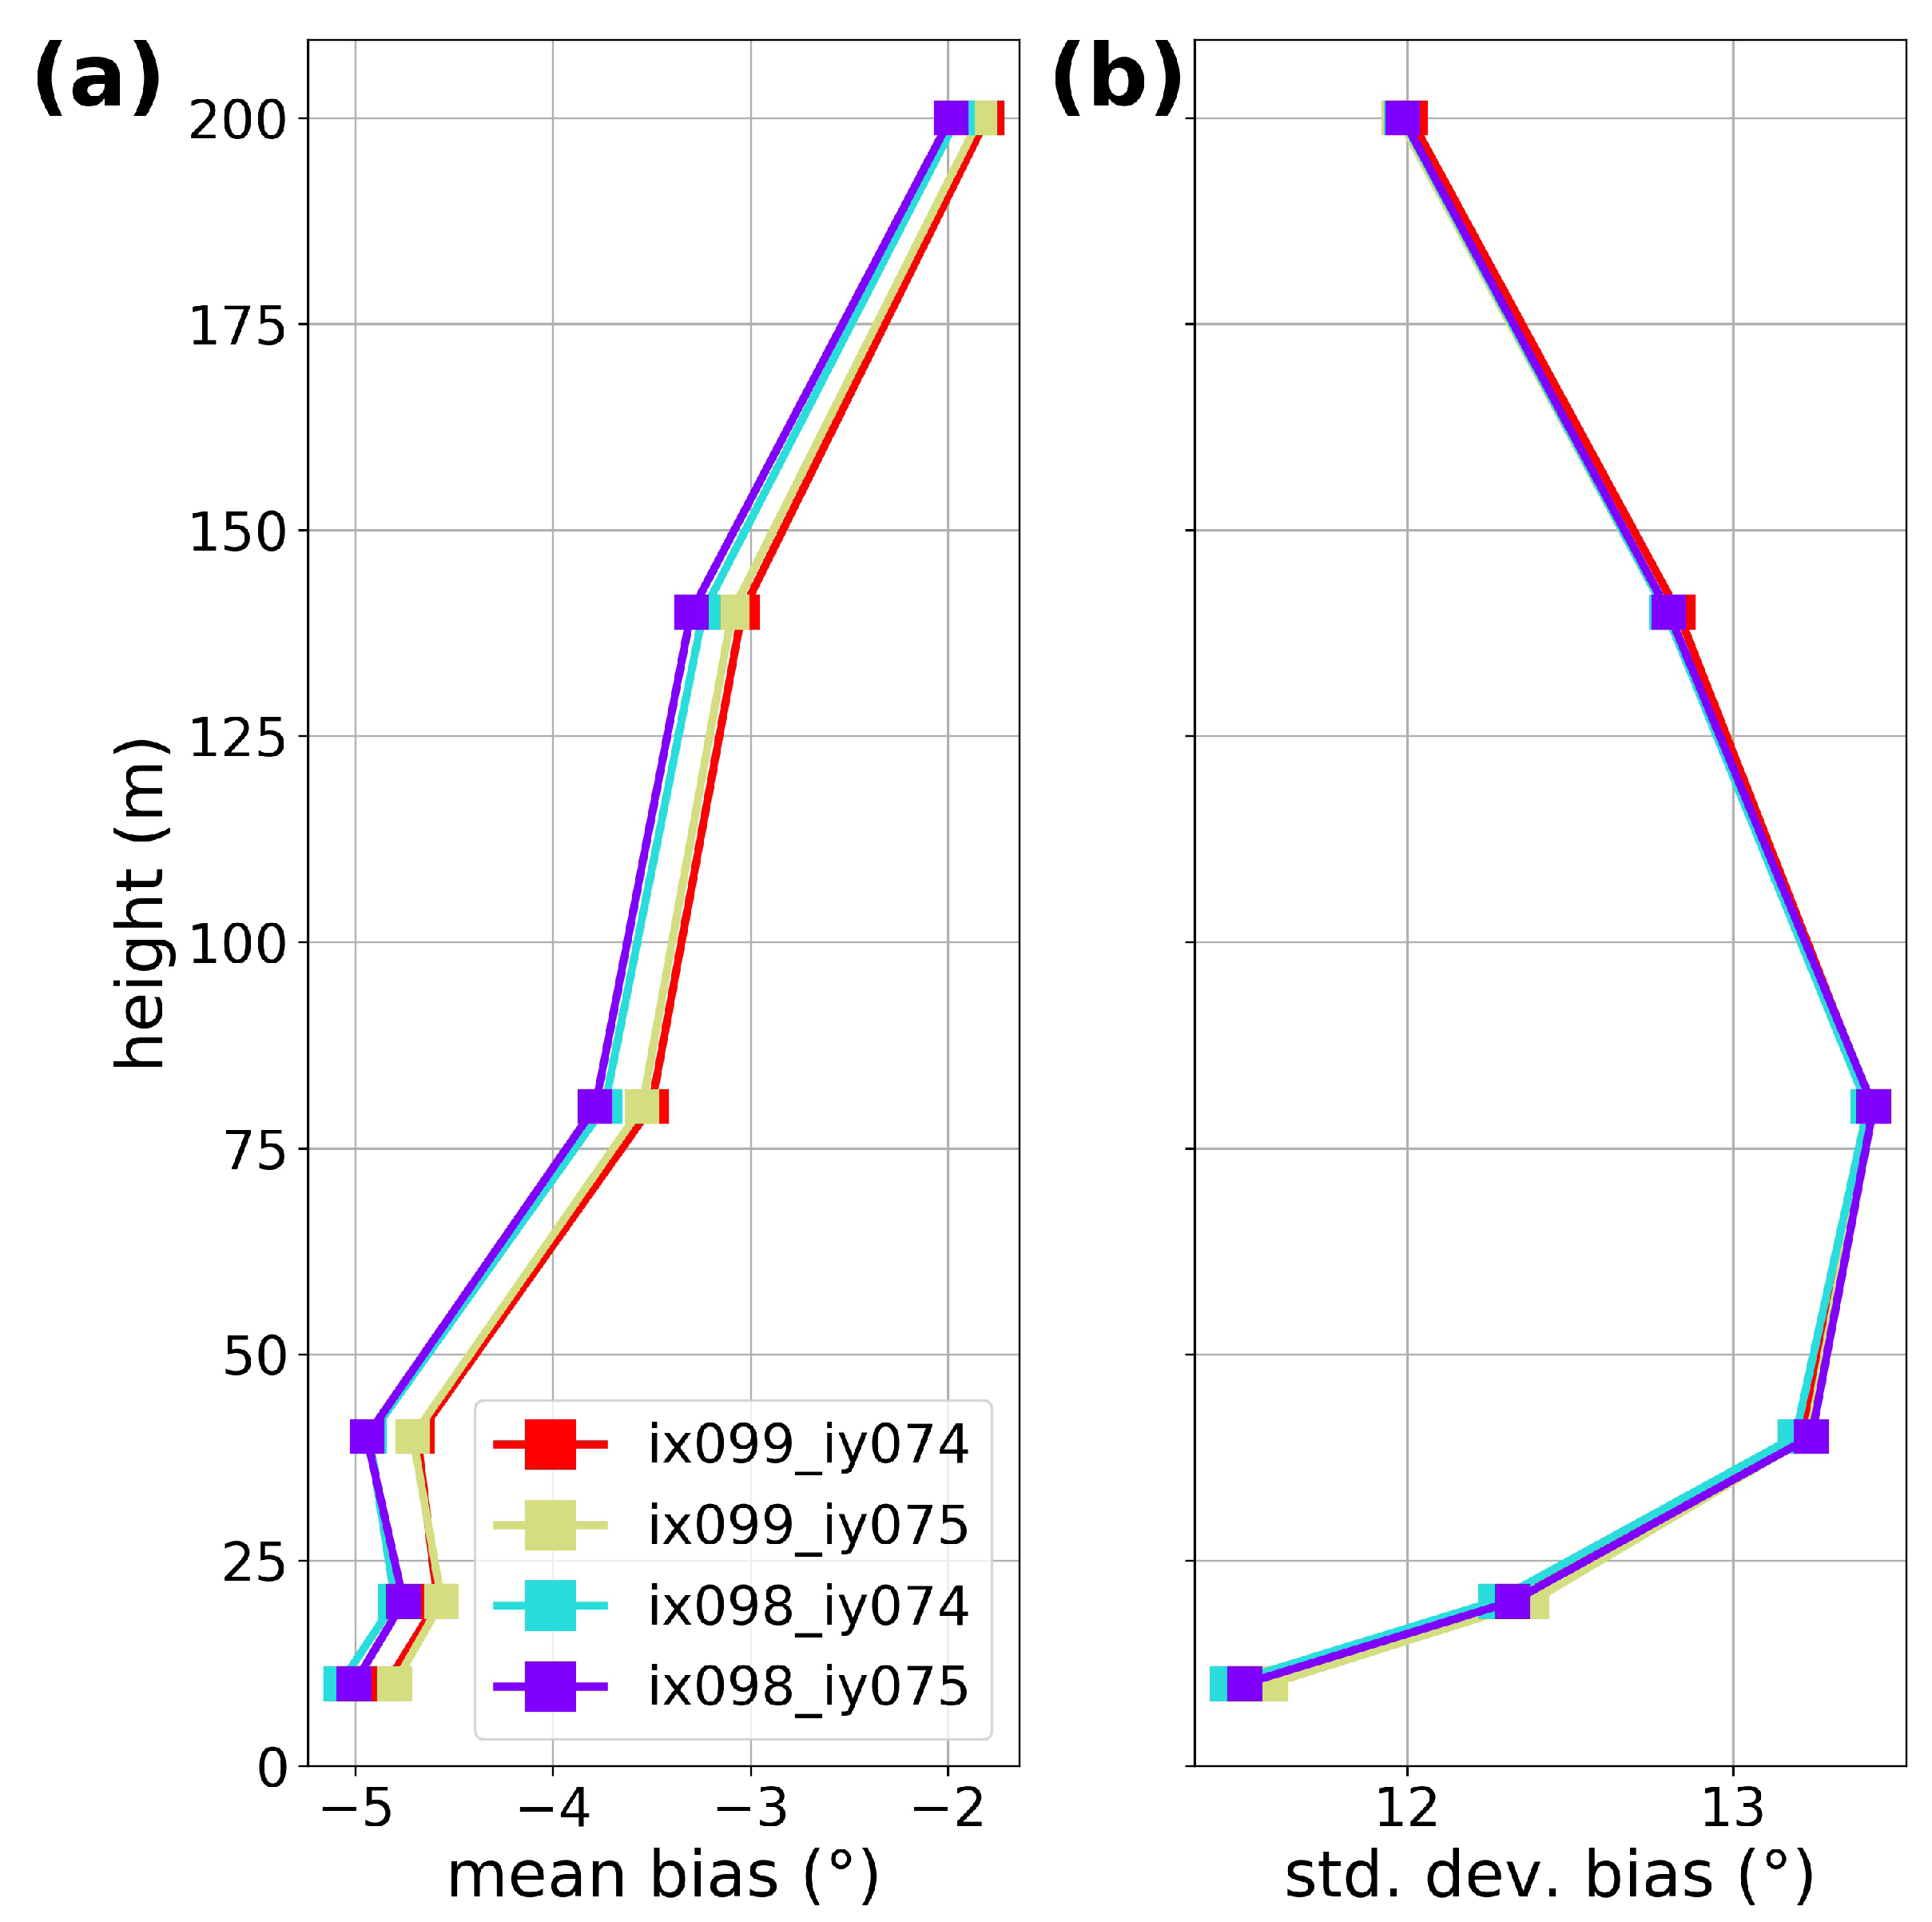
The sensitivity of the grid point selection is investigated by comparing the main DOWA validation results for the four closest grid points around the Cabauw mast. Results are shown in Figure A4 for (a) the mean wind speed and (b) mean bias and (c) standard deviation of the bias, Figure A5 for the linear regression fit parameters, and Figure A6 for the mean bias and standard deviation in the wind direction. The closest grid ([99, 74], which has been used throughout this validation study) is represented with red. The largest impact is seen for the wind speed mean bias and slope with the largest difference at 10 m, 20 m and 40 m height. In all other aspects, the impact is insignificant.
These results show the sensitivity of the choice of the grid point, which is quite large for the mean bias and slope for the lower levels up to 40 m. This is probably related the difference between the grid box averaged roughness and local, wind-direction-dependent, roughness, which determines the wind speed at the lower levels. Considering this sensitivity, one should be very cautious in drawing strong conclusions on the validation results at those heights.
For the higher levels, the roughness of multiple surrounding grid boxes start to play a role, instead of that of the single grid point, and the larger scale wind direction dependent roughness can be resolved. This explains why at 200 m the mean bias and slope of the four grid points are nearly the same.
Figure A4. Height profile of (a) the mean wind speed, (b) mean bias, and (c) standard deviation of the bias, showing mast measurements (black) and the four nearest grid points of DOWA.
Energies 13 06558 g0a4
Figure A5. Height profile of the results of the linear regression (a) slope, (b) offset, and (c) R 2 of the wind speed data, comparing the four nearest grid points of DOWA.
Energies 13 06558 g0a5
Figure A6. Height profile of (a) the mean bias and (b) standard deviation of the bias of the wind direction data, comparing the four nearest grid points of DOWA.
Energies 13 06558 g0a6

Appendix C. Model Uncertainty Estimates

Here we briefly outline the method to estimate the uncertainty on the model mean statistics. For an uncorrelated data set the standard deviation of the mean is σ mean = σ / N , where is σ is the standard deviation of the data set and the N the (independent) number of points. The variance is the square of the standard deviation: σ mean 2 . However, if data has a dependency (the data points are not independent), one needs to estimate an equivalent sample size (ESS), defined as N = N / τ D , which will be smaller than N, leading to a larger σ mean . A rough estimate of τ D can be made on basis of an autoregression of order 1 model AR(1) [35] (as a more simple alternative to bootstrap methods) on data of the form:
x k + 1 = α x k + ε k
with x 1 , ε 1 , . . . , ε n 1 independent random variables. Here k are the timestamps. The estimator is:
τ ^ D = 1 + α ^ 1 α ^
with α ^ the estimate of α . With x ˜ k x k μ and μ the mean of x k :
α ^ = k = 1 n 1 x ˜ k x ˜ k + 1 k = 1 n 1 x ˜ k 2 .
Equation (A3) is applied to the timeseries of the bias to calculate σ mean to derive standard deviation of yearly, yearly monthly, monthly mean and mean of the full period. Values of τ ^ D for the full period are given in Table A1. For the hourly mean an uncorrelated data set is assumed.
Table A1. τ ^ D values for the different models and heights, for the full period of 10 year. Note that τ ^ D for ERA-Interim is 1.0 (i.e., uncorrelated data) because its output is only 6-h. Taking only data every 6-h from DOWA, KNW or ERA5 would also result in τ ^ D = 1.0 .
Height (m)DOWAKNWERA5ERA-Interim
2003.24.34.71.0
1403.04.04.51.0
802.73.74.11.0
402.53.64.21.0
202.84.05.71.0
103.04.37.21.0

References

  1. Bleeg, J.; Purcell, M.; Ruisi, R.; Traiger, E. Wind Farm Blockage and the Consequences of Neglecting Its Impact on Energy Production. Energies 2018, 11, 1609. [Google Scholar] [CrossRef] [Green Version]
  2. Strickland, J.M.I.; Stevens, R.J. Effect of thrust coefficient on the flow blockage effects in closely-spaced spanwise-infinite turbine arrays. J. Phys. 2020, 1618, 062069. [Google Scholar] [CrossRef]
  3. Nygaard, N.G.; Steen, S.T.; Poulsen, L.; Pedersen, J.G. Modelling cluster wakes and wind farm blockage. J. Phys. 2020, 1618, 062072. [Google Scholar] [CrossRef]
  4. Asmuth, H.; Olivares-Espinosa, H.; Ivanell, S. Actuator line simulations of wind turbine wakes using the lattice Boltzmann method. Wind Energy Sci. 2020, 5, 623. [Google Scholar] [CrossRef]
  5. Segalini, A.; Dahlberg, J. Blockage effects in wind farms. Wind Energy 2020, 23, 120. [Google Scholar] [CrossRef]
  6. Wijnant, I.L.; van den Brink, H.W.; Stepek, A. North Sea Wind Climatology Part 1: A Review of Existing Wind Atlases; KNMI Tech. Rep. TR-342; KNMI: De Bilt, The Netherlands, 2014. [Google Scholar]
  7. Troen, I.; Petersen, E.L. European Wind Atlas; Risø National Laboratory: Roskilde, Denmark, 1989. [Google Scholar]
  8. Donkers, J.; Brand, A.; Eecen, P. Offshore Wind Atlas of the Dutch part of the North Sea. In Proceedings of the EWEA 2011, Brussels, Belgium, 14–17 March 2011. [Google Scholar]
  9. Hasager, C.B.; Badger, M.; Mouche, A.; Stoffelen, A.; Driesenaar, T.; Karagali, I.; Bingöl, F.; Pena Diaz, A.; Astrup, P.; Nielsen, M.; et al. NORSEWInD Satellite Wind Climatology; DTU-Wind-Energy-E-0007(EN); DTU Wind Energy; 2012. Available online: https://orbit.dtu.dk/en/publications/norsewind-satellite-wind-climatology (accessed on 10 December 2020).
  10. SenterNovem. Windkaart van Nederland op 100 m Hoogte. Available online: https://docplayer.nl/7262374-Windkaart-van-nederland-op-100-m-hoogte.html (accessed on 25 November 2020).
  11. KNMI North Sea Wind Atlas. Available online: http://projects.knmi.nl/knw/index.html (accessed on 25 November 2020).
  12. Stepek, A.; Savenije, M.; van den Brink, H.W.; Wijnant, I.L. Validation of KNW Atlas with Publicly Available Mast Observations; KNMI Tech. Rep. TR-352; KNMI: De Bilt, The Netherlands, 2015. [Google Scholar]
  13. Wijnant, I.L.; Marseille, G.J.; Stoffelen, A.; van den Brink, H.W.; Stepek, A. Validation of KNW Atlas with Scatterometer Winds; KNMI Tech. Rep. TR-353; KNMI: De Bilt, The Netherlands, 2015. [Google Scholar]
  14. Dutch Offshore Wind Atlas. Available online: http://www.dutchoffshorewindatlas.nl (accessed on 25 November 2020).
  15. Wijnant, I.; van Ulft, B.; van Stratum, B.; Barkmeijer, J.; Onvlee, J.; de Valk, C.; Knoop, S.; Kok, S.; Klein Baltink, H.; Stepek, A. The Dutch Offshore Wind Atlas (DOWA): Description of the dataset. KNMI Tech. Rep. 2019, TR-380. Available online: https://www.dutchoffshorewindatlas.nl/publications/reports/2019/12/05/knmi-report-dowa-dataset (accessed on 25 November 2020).
  16. Duncan, J.B.; Marseille, G.J.; Wijnant, I.L. DOWA Validation against ASCAT Satellite Winds. TNO Report 2018 R11649. 2018. Available online: https://www.dutchoffshorewindatlas.nl/publications/reports/2019/01/18/tno-report-dowa-validation-against-ascat-satellite-winds (accessed on 25 November 2020).
  17. Duncan, J.B.; Wijnant, I.L.; Knoop, S. DOWA Validation against Offshore Meteorological Mast and Lidar Measurements. TNO Report 2019 R10062. 2019. Available online: https://www.dutchoffshorewindatlas.nl/publications/reports/2019/05/21/tno-report-dowa-validation-against-offshore-mast-and-lidar-measurements (accessed on 25 November 2020).
  18. Van Stratum, B.J.H.; Basu, S.; Wijnant, I.L.; Barkmeijer, J.; Onvlee, J.; Siebesma, A.P. Wind Turbine Parametrisation in HARMONIE-AROME. KNMI Tech. Rep. 2019, TR-377. Available online: https://www.dutchoffshorewindatlas.nl/publications/reports/2019/12/06/knmi-report-wind-turbine-parameterisation (accessed on 25 November 2020).
  19. Petersen, E.L.; Troen, I.; Ejsing Jørgensen, H.; Mann, J. The new European wind atlas. Energy Bull. 2014, 17, 34. [Google Scholar]
  20. Powers, J.G.; Klemp, J.B.; Skamarock, W.C.; Davis, C.A.; Dudhia, J.; Gill, D.O.; Coen, J.; Gochis, D.J.; Ahmadov, R.; Peckham, S.E.; et al. The Weather Research and Forecasting model: Overview, system efforts, and future directions. Bull. Am. Meteorol. Soc. 2017, 98, 1717. [Google Scholar] [CrossRef]
  21. Hallgren, C.; Arnqvist, J.; Ivanell, S.; Körnich, H.; Vakkari, V.; Sahlée, E. Looking for an Offshore Low-Level Jet Champion among Recent Reanalyses: A Tight Race over the Baltic Sea. Energies 2020, 13, 3670. [Google Scholar] [CrossRef]
  22. Kalverla, P.C.; Holtslag, A.A.M.; Ronda, R.J.; Steeneveld, G.J. Quality of wind characteristics in recent wind atlases over the North Sea. Q. J. R. Meteorol. Soc. 2020, 146, 1. [Google Scholar] [CrossRef]
  23. Seity, Y.; Brousseau, P.; Malardel, S.; Hello, G.; Bénard, P.; Bouttier, F.; Lac, C.; Masson, V. The AROME-France Convective-Scale Operational Model. Mon. Weather Rev. 2010, 139, 976. [Google Scholar] [CrossRef] [Green Version]
  24. Bengtsson, L.; Andraea, U.; Aspelien, T.; Batrak, Y.; Calvo, J.; de Rooy, W.; Gleeson, E.; Hansen-Sass, B.; Homleid, M.; Hortal, M.; et al. The Harmonie–Arome Model Configuration in the Aladin–Hirlam NWP System. Mon. Weather Rev. 2017, 145, 1919. [Google Scholar] [CrossRef]
  25. De Rooy, W.C.; de Vries, H. HARMONIE verification and evaluation. HIRLAM Tech. Rep. 2017, 70. Available online: http://www.hirlam.org/index.php/hirlam-documentation/doc_download/1805-hirlam-technicalreport-70 (accessed on 10 December 2020).
  26. Masson, V.; Champeaux, J.L.; Chauvin, F.; Meriguet, C.; Lacaze, R. A global dataset of land surface parameters at 1-km resolution in meteorological and climate models. J. Clim. 2003, 16, 1261. [Google Scholar] [CrossRef]
  27. Faroux, S.; Kaptué Tchuenté, A.T.; Roujean, J.L.; Masson, V.; Martin, E.; Moigne, P.L. ECOCLIMAP-II/Europe: A twofold database of ecosystems and surface parameters at 1km resolution based on satellite information for use in land surface, meteorological and climate models. Geosci. Model Dev. 2013, 6, 563. [Google Scholar] [CrossRef] [Green Version]
  28. Geertsema, G.; van den Brink, H. Windkaart van Nederland op 100 m Hoogte; KNMI Tech. Rep. TR-351; KNMI: De Bilt, The Netherlands, 2014. [Google Scholar]
  29. Van Ulden, A.P.; Wieringa, J. Atmospheric boundary layer research at Cabauw. Bound. Layer Meteorol. 1996, 78, 39. [Google Scholar] [CrossRef]
  30. Verkaik, J.W.; Holtslag, A.A.M. Wind profiles, momentum fluxes and roughness lengths at Cabauw revisited. Bound. Layer Meteorol. 2007, 122, 701. [Google Scholar] [CrossRef]
  31. Bosveld, F.C. The Cabauw In-Situ Observational Program 2000—Present: Instruments, Calibrations and Set-Up; KNMI Tech. Rep. TR-384; KNMI: De Bilt, The Netherlands, 2020. [Google Scholar]
  32. Van den Brink, H.W.; Bosveld, F.C. Bringing modelled and observed surface winds together. Int. J. Climatol. 2017, 37, 4783. [Google Scholar] [CrossRef]
  33. Baas, P.; de Rooy, W.C.; Onvlee, J. (Royal Netherlands Meteorological Institute, De Bilt, Netherlands). Personal communication. 2019. [Google Scholar]
  34. Albergel, C.; Boone, A.; Belamari, S.; Decharme, B.; Dumont, M.; Moigne, P.L.; Masson, V. SURFEX Scientific Documentation. SURFEX V8.1 2018, 3. Available online: http://www.umr-cnrm.fr/surfex/IMG/pdf/surfex_scidoc_v8.1.pdf (accessed on 10 December 2020).
  35. Von Storch, H.; Zwiers, F.W. Statistical Analysis in Climate Research; Cambridge University Press: Cambridge, UK, 2003. [Google Scholar]
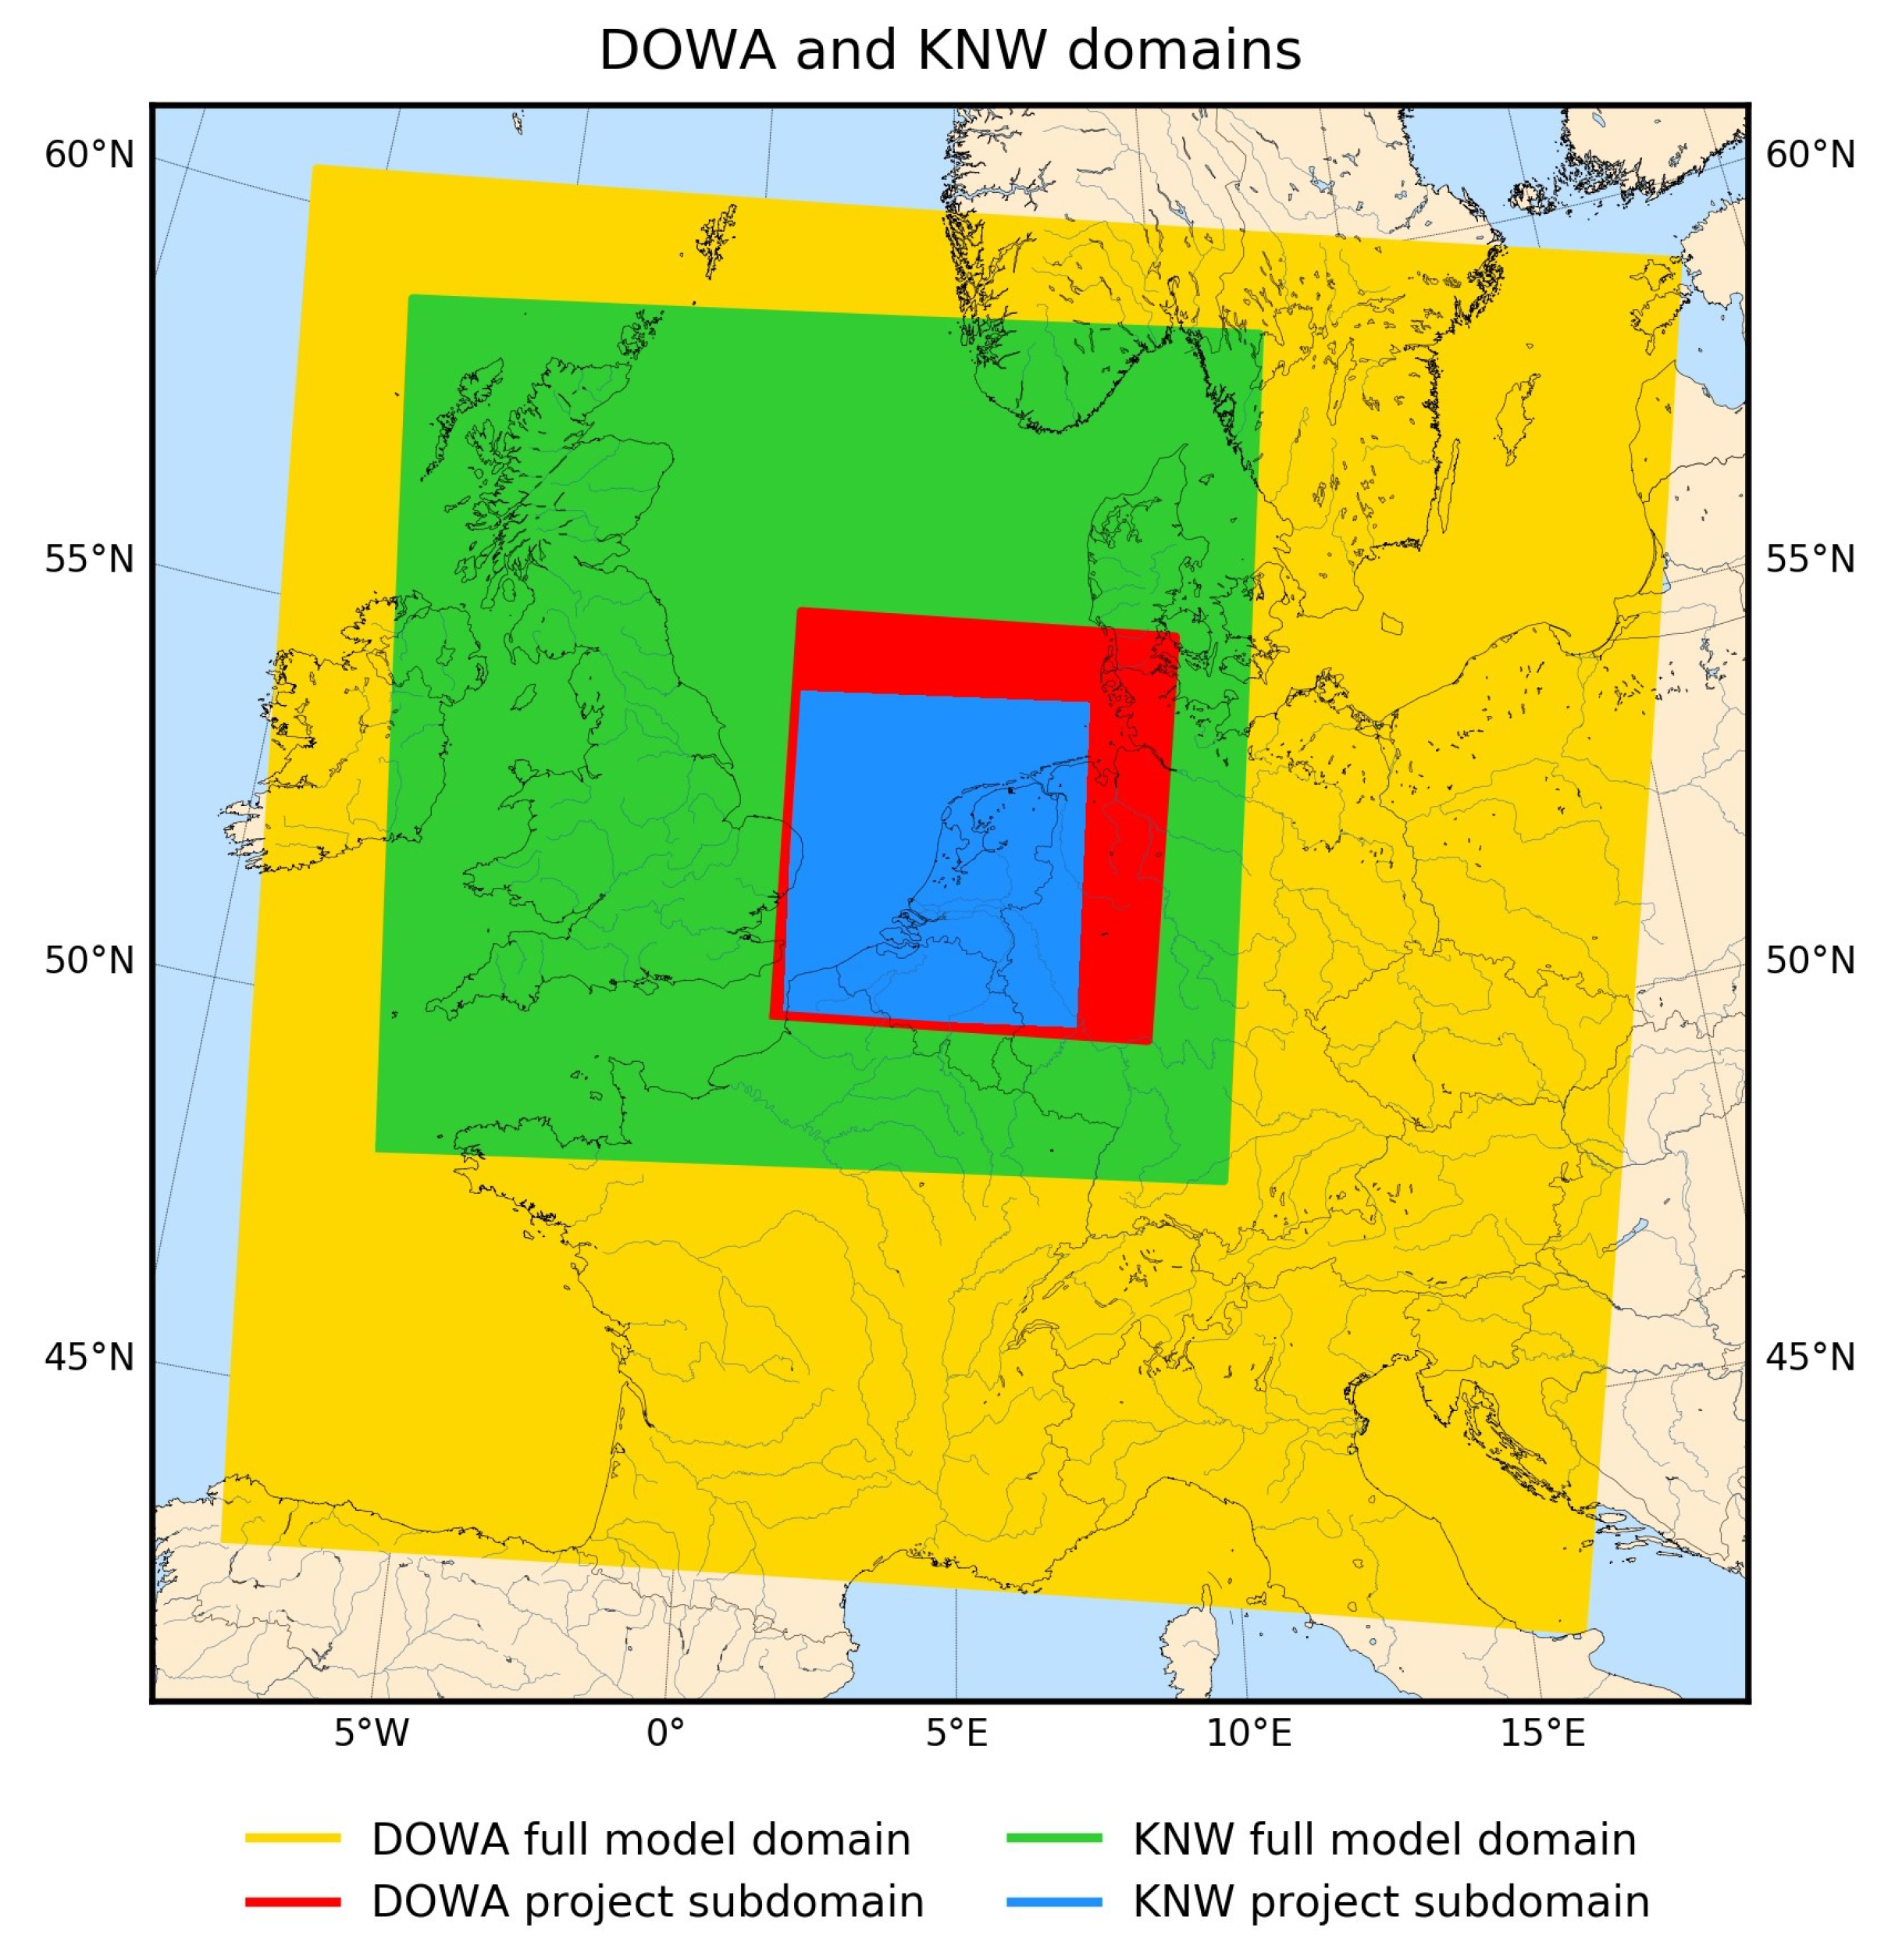
Figure 1. ERA5-HARMONIE domain (yellow) of 789 × 789 points and Dutch Offshore Wind Atlas (DOWA)-subdomain of 217 × 234 points (red). ERA-Interim-HARMONIE domain of 500 × 500 points (green) and KNMI North Sea Wind (KNW)-subdomain of 170 × 188 points (blue).
Energies 13 06558 g001
Figure 2. Overview of the Cabauw site. (a) Map of the Netherlands, indicating the location of measurement site near Cabauw (51.971° N, 4.927° E). (b) Aerial image of the surroundings, indicating the locations of the masts at the measurement site, and the nearby villages Cabauw and Lopik (image from PDOK Landelijke Voorziening Beeldmateriaal, Luchtfoto 2019 Ortho 25 cm RGB). (c) The 213-m tall A-mast (photo by Ruben Jorksveld, KNMI).
Energies 13 06558 g002
Figure 3. Yearly monthly mean wind speed at 80 m, showing mast measurements (black), DOWA (blue), KNW atlas (red), KNW atlas without wind shear correction (red, dashed), ERA5 (green, dotted) and ERA-Interim (gray, dotted). The upper panel shows the wind speed of both mast measurements and models, the lower panel the bias (measurement minus model) between the mast measurements and the models. Model variance is indicated by the shaded areas in the lower panel.
Energies 13 06558 g003
Figure 4. Height profile of (a) the mean wind speed, (b) the mean bias (measurement minus model), and (c) the standard deviation of the bias, showing mast measurements (black), DOWA (blue), KNW atlas (red), KNW atlas without wind shear correction (red, dashed), ERA5 (green, dotted), and ERA-Interim (gray, dotted).
Energies 13 06558 g004
Figure 5. Monthly mean wind speed at 20 m, showing mast measurements (black), DOWA (blue), KNW atlas (red), KNW atlas without wind shear correction (red, dashed), ERA5 (green, dotted), and ERA-Interim (gray, dotted). The upper panel shows the wind speed of both mast measurements and models, the lower panel the bias (measurement minus model) between the mast measurements and the models. Model variance is indicated by the shaded areas in the lower panel.
Energies 13 06558 g005
Figure 6. Hourly mean wind speed at (a) 10 m, (b) 20 m, (c) 40 m, (d) 80 m, (e) 140 m, and (f) 200 m, showing mast measurements (black), DOWA (blue), and KNW atlas (red). The upper panel shows the wind speed of both mast measurements and models, and the lower panel the bias (measurement minus model) between the mast measurements and the models.
Energies 13 06558 g006
Figure 7. Hourly mean wind speed for the mast measurements (a,c,e,g) and DOWA (b,d,f,h), separated into the four seasons: (a,b) winter (December, January, February), (c,d) spring (March, April, May), (e,f) summer (June, July, August), and (g,h) autumn (September, October, November).
Energies 13 06558 g007
Figure 8. Scatterplot of the DOWA and mast wind speed data at 80 m (visualized as a density plot with logarithmic color scale).
Energies 13 06558 g008
Figure 9. Height profile of (a) the mean bias (measurement minus model) and (b) standard deviation of the bias of the wind direction data: DOWA (blue), KNW atlas (red), ERA5 (green, dashed), and ERA-Interim (gray, dotted).
Energies 13 06558 g009
Figure 10. Height profile of (a) the mean bias (measurement minus model) and (b) standard deviation of the bias of the wind direction data, comparing the DOWA (blue) and KNW atlas (red). Solid lines are all data, dashed lines only data with wind speed larger than 4 m/s.
Energies 13 06558 g010
Table 1. Results of the linear regression fit in terms of the slope, offset and R 2 parameters, comparing DOWA and KNW.
Height (m)SlopeOffset (m/s) R 2
DOWAKNWDOWAKNWDOWAKNW
100.910.900.200.460.870.84
200.880.890.250.480.870.84
400.910.920.510.530.870.84
800.920.900.550.700.870.84
1400.930.900.580.900.880.85
2000.940.900.610.950.900.86
Publisher’s Note: MDPI stays neutral with regard to jurisdictional claims in published maps and institutional affiliations.