Article

A New Generation of Thermal Energy Benchmarks for University Buildings

1
Department of Architecture, Faculty of Art and Architecture, University of Kurdistan (UOK), Sanandaj 0871, Iran
2
Department of Architectural Engineering + Technology, Faculty of Architecture and the Built Environment, Delft University of Technology (TU Delft), 2628BX Delft, The Netherlands
3
Department of Planning, Design & Technology of Architecture, Sapienza University of Rome, Via Flaminia 72, 00196 Rome, Italy
4
Solar Energy and Building Physics Laboratory (LESO-PB), Ecole Polytechnique Fédérale de Lausanne (EPFL), 1015 Lausanne, Switzerland
*
Author to whom correspondence should be addressed.
Energies 2020, 13(24), 6606; https://doi.org/10.3390/en13246606
Submission received: 10 November 2020 / Revised: 7 December 2020 / Accepted: 11 December 2020 / Published: 14 December 2020

Abstract

:
In 2008, the Chartered Institution of Building Services Engineers (CIBSE TM46 UC) presented an annual-fixed thermal energy benchmark of 240 kWh/m2/yr for university campus (UC) buildings as an attempt to reduce energy consumption in public buildings. However, the CIBSE TM46 UC benchmark fails to consider the difference between energy demand in warm and cold months, as the thermal performance of buildings largely depends on the ambient temperature. This paper presents a new generation of monthly thermal energy benchmarks (MTEBs) using two computational methods including mixed-use model and converter model, which consider the variations of thermal demand throughout a year. MTEBs were generated using five basic variables, including mixed activities in the typical college buildings, university campus revised benchmark (UCrb), typical operation of heating systems, activities impact, and heating degree days. The results showed that MTEBs vary from 24 kWh/m2/yr in January to one and nearly zero kWh/m2/yr in June and July, respectively. Based on the detailed assessments, a typical college building was defined in terms of the percentage of its component activities. Compared with the 100% estimation error of the TM46 UC benchmark, the maximum 21% error of the developed methodologies is a significant achievement. The R-squared value of 99% confirms the reliability of the new generation of benchmarks.

1. Introduction

There has been a global trend in the recent years to reduce energy demand and greenhouse gas (GHG) emissions in the higher educational institution buildings [1]. The trend is even more accelerated by the new policies and regulations such as the European Green Deal with ambitious goals to achieve neutral GHG cities and areas by 2050 [2]. In this regard, energy benchmarking is a useful tool to evaluate the energy performance of buildings [3]. The higher educational buildings (university buildings) are important in terms of high energy demand (kWh/m2) and the variety of activities in the buildings.
Chartered Institution of Building Services Engineers (CIBSE) TM46:2008 [4] is one of the fundamental references for energy performance certification, and benchmarking in buildings. Despite the improvement of the energy performance of university buildings in recent years, the CIBSE TM46 UC (university campus) benchmark has remained unchanged [5]. The CIBSE TM46 UC benchmark significantly overestimates the thermal demand compared with the actual measurements [6]. Most of the benchmarking methodologies such as ”Energy Star” and CIBSE TM46 have focused on the annual scale [7], while failed to consider the differences in thermal energy consumption in the cold and warm months. This leads to a notable gap in the energy demand estimations where the annual benchmark is incapable to provide detailed information based on outdoor temperature [8]. This can be even more critical considering the convoluted urban microclimate conditions around buildings [9] and complex interactions between outdoor temperature and other climate variables. Although the benchmarking methodology is not feasible to take into account detailed climate variations, it is vital to investigate for finer temporal resolution (e.g., seasonal or monthly) models to assess energy consumption profiles of university buildings. This paper addressed this research gap by introducing a novel method, namely, monthly thermal energy benchmarks (MTEBs). MTEBs aim to represent the monthly variations of mixed-use campus buildings as an accurate tool to move towards sustainable transition pathways in educational buildings.
This paper is structured as follows. First, the background of energy benchmarking systems is assessed (Section 1.1) to highlight the major research gaps in the field. The study of the related works and the discussion of the TM46 benchmarking method are presented in Section 1.2 and Section 1.3, respectively. In Section 1.4, the contributions of this study are discussed. The methods and material adopted and developed in the paper are explained thoroughly in Section 2. The application of major benchmarking methods, including mixed-use and converter models are assessed in Section 3 and Section 4, respectively. The novel benchmarking model (MTEBs) is presented in Section 5, followed by the conclusion to highlight the major findings of the study.

1.1. Background of Energy Benchmarking Systems

The “energy benchmarking” term was used in the 1990s to refer to the knowledge of comparing energy consumption in similar building types (peer buildings) [10]. The top-down benchmarking method uses real consumption data to calculate the energy benchmark of peer buildings. This is a comprehensive method applying officially in the EU, US, Australia, Japan, Canada, and other countries to manage the end-use energy consumption in buildings [11]. Benchmarking is a cornerstone of the European Council Directive 93/76/CEE [12] to improve energy efficiency and reduce CO2 emissions in buildings. Energy benchmarking compares the annual total primary energy required (TPER) per unit area (m2) in a building with the median consumption of peers [13].
Based on Chapter 20 of the original CIBSE Guide F: “Energy efficiency in buildings” and Energy Consumption Guide ECG 19: “Energy efficiency in offices”, the CIBSE TM46 energy benchmark was updated by the Chartered Institution of Building Services Engineers (CIBSE) in 2008. CIBSE TM46 [4] and TM47 [14] explain the statutory energy benchmarks in buildings, which are used as predominant references in the EU and UK to calculate the building energy ratio (BER). BER is the main part of a display energy certificate (DEC).
According to the CIBSE TM46, 237 building types were classified into 29 benchmark categories based on the building’s dominant function (single function). TM46 presumes the buildings as a single function and neglects other functions (activities) in the buildings, while many of them are multifunctional (mixed-use) particularly in city centers. According the CIBSE TM46, a university campus building (a typical educational building on/off campus) needs 240 kWh/m2/yr of thermal energy per year [4].
There are fundamental modifications in thermal demand during a year; however, TM46 and Energy Star methodology cannot explain such variations. The majority of heat demand (80%) in winters is used for space heating purposes, whereas in summers the energy is consumed to prepare domestic hot water [15]. The accuracy of TM46 UC benchmarks has been studied recently by several researchers and a series of problems, such as a significant discrepancy between the benchmark and actual measurements have been reported frequently [16,17]. For example, Vaisi et al. discovered a 30% gap between the actual consumption and TM46 UC benchmark [8]. Based on the actual data of four university buildings in Dublin, the authors revised the CIBSE TM46 thermal benchmark of 240 kWh/m2/yr and introduced a university campus revised benchmark (UCrb) of 130 kWh/m2/yr as a validated annual index. In addition, the reviewed studies not only highlighted the requirement for revising the TM46 benchmarks [18], but also suggested the necessity for renaming the UC category [19]. The majority of current energy models present the annual-fixed benchmark, which take into account buildings as single-use (single function, single activity) because the data on mixed activities usually are unavailable or hard to collect.

1.2. Display Energy Certificate (DEC)

Display energy certificate (DEC) is an authentic certificate that shows the annual energy performance of buildings (Figure 1). The DEC dataset is used frequently for energy management in buildings. In summer 2008, for the first time, DECs were introduced in the EU under the Energy Performance of Building Directive (EPBD) regulation [20]. DEC presents the building energy efficiency, which is calculated using the total primary energy requirement (TPER). TPER is the overall quantity of all energies (electricity, oil, coal, gas, renewables, etc.) delivered to a building, including the energy that is used or lost beyond the boundary of the building during energy transformation, transmission, and distribution processes. The other index displayed on DECs is total primary fossil energy required (TPEFR), which shows the annual fossil thermal energy delivered to the boundary of buildings (Figure 1).
Total final consumption (TFC) or actual consumption (recorded consumption) is the amount of energy consumed in a building. TFC is measured by meters and it is typically the quantity shown on bills [21]. If other types of bulk energy such as oil and coal are used, for calculation of TPFER they must be converted into kgCO2 or kWh of energy. Generally, TPFER is approximately 20% greater than TFC [22].
On DEC, the quantity of TPER (kWh/m2/yr) is divided by the annual benchmark, the consumption of 50% of samples, and the percentage of the result is called BER, which is graded. The alphabetical grades range from “A1” to “G” and show the best to worst efficiency, respectively. The TPER, TPFER, and BER displayed on a DEC are presented in Figure 1.

1.3. Related Works

The literature in the field of benchmarking can be divided into four categories including (1) benchmarking methods and data assessment, (2) underlining the discrepancy between the energy benchmarks and actual consumption, (3) energy performance over time, and (4) reviewing the policy and presenting new recommendations. This study falls into the first and second categories.
Pasichnyi et al. [23] recommended the display energy certificate system as a new opportunity for data-enabled urban energy policy instruments. However, the certificate systems are mostly limited to annual scale rather than monthly. Burman et al. [24] compared the annual fossil–thermal performance of five new educational buildings in the UK against the operational benchmarks at the annual scale and discovered a significant discrepancy between the heating energy use and the design expectations. Papadopoulos et al. [25] assessed the energy use intensity between 2011 and 2016 and used approximately 15,000 energy consumption data of New York City properties based on an annual period.
To address the role of mixed activities on energy consumption, a study was conducted based on quantile regression model. The authors analyzed the electricity consumption of nearly 1000 buildings and found that cooling degree days and the presence of gyms, spas, and elevators were significant factors affecting the energy use. Moreover, the number of employees per unit area had a great effect on the total electricity consumption in poorly performing buildings [26].
Liu et al. [27] developed a systematic methodology as well as an energy consumption rating (ECR) system to create dynamic energy benchmarks for an individual office building with very limited information. Based on outdoor temperature, relative humidity, and daily energy consumption, the authors, at an hourly scale analysis, presented four typical energy benchmarks, including 272, 427, 497, and 592 kWh, which represent the momentary operation of the studied building. Another study identified three fundamental energy consumption periods, i.e., morning, noon, and evening peak energy consumption patterns using K-means clustering and load shape profile [28]. The authors discovered how energy consumption is changed during the daytime and consequently, they plotted the typical consumption patterns of four groups of buildings. Those patterns are the basis for modeling higher resolution profiles from monthly bills [29] or to evaluate flexibility potential of the built environment [30].
Papadopoulos and Kontokosta [31] developed a building GREEN energy grading methodology by adopting machine learning and city-specific energy use and building data to enable more precise, reasonable, and contextualized individual building energy profiles [31]. They indicated how different factors such property value (cost/square ft), unit density, bedroom density, built year, etc. affected the energy use intensity. Finally, they proposed a graded (alphabetical) annual benchmark instead of the 0–100 rating system of Energy Star. A large number of studies have frequently adopted statistical benchmarking models using machine-learning algorithms that can illustrate multifaceted relationships between energy uses and building characteristics, such as floor area and functions [32,33,34].
Khoshbakht et al. [35] adopted stochastic frontier analysis (SFA) to determine benchmark values for various activities and disciplines in higher educational buildings. They classified the educational buildings into different activities (e.g., research, academic offices, administration, library, teaching spaces) but did not look into the monthly or seasonal consumption patterns. In another work conducted in 81 residential buildings in Singapore [36], the authors proposed a framework to categorize the buildings by their operational similarities using data mining obtained from smart meters. They highlighted the impact of the mixed-use operation on energy demand and discovered that the activity plays a key role in energy consumption. For instance, the residential buildings had fewer facilities and lower energy load density compared to the buildings with research centers. Therefore, the EUI (Energy Use Intensity) was much smaller than the mixed-use buildings due to the galleries and laboratories that require energy in 24 h. However, the impact of each activity on energy consumption and their weight were not addressed.
Arjunan et al. [37] developed a method based on both linear and nonlinear models to increase the accuracy of energy benchmarking of office buildings in the US. They applied several building attributes such as gross floor area, cooling gross floor area, number of employees, computers, and cooling degree days, and determined the features affecting energy consumption.

1.4. The Novelty of the Proposed Method

Based on the reviewed literature, there are still unexplored particular areas, even not addressed by the renowned benchmarking systems such as CIBSE (worldwide approved benchmarking system) and Energy Star (US benchmarking system). Most of the research reviewed focused on analyzing static snapshots of buildings, i.e., annual fixed energy benchmark rather than dynamic performance trends over time, and considered buildings as a single activity [38]. Applying an annual-fixed benchmark and considering the buildings as single-use are the major research gaps in the field. This paper moves beyond the current state-of-art by proposing a new generation of thermal energy benchmarks, monthly thermal energy benchmarks (MTEBs), instead of a fixed-annual benchmark. The MTEBs benchmarking method improves the CIBSE TM46 UC benchmark of 240 kWh/m2/yr by incorporating monthly variables, which are sensitive to ambient temperature and environmental conditions. Moreover, this study considers the impacts of various activities such as computer rooms, offices, library, laboratory, seminar and research rooms, workshop, stores, and restaurant and coffee shops on the energy consumption in typical college buildings using a revised benchmark (UCrb) model. Readers are referred to an earlier study by the authors [8] for more information about the UCrb benchmark.
Moreover, five fundamental parameters were applied in the mixed-use and converter models, including conditioned area of buildings, heating degree days (HDD), mixed-use, a recently revised benchmark (UCrb), and typical operation hours of heating systems. Finally, this study aims to fill the discrepancy between the TM46 UC benchmark and actual heat consumption highlighted in the literature, which is a step beyond the model introduced by Vaisi et al. [8] in 2018. For the first time, a definition of typical college buildings based on their mixed activities is presented.
Figure 2 is a schematic ideogram that shows the gap between CIBSE TM46 benchmark and the actual consumptions during a year, and it illustrates how a curved line benchmark can be better adapted to reality. The CIBSE TM46 UC benchmark is a horizontal line, an index for a whole year, while the methodology of MTEBs has focused on transforming the horizontal TM46 UC into a monthly dynamic benchmark (a curved line) that delivers valuable information.

2. Methodology

To create the monthly thermal energy benchmarks (MTEBs), the actual thermal consumption data and the operational hours of the heating systems of 52 buildings in four university campuses (Trinity College Dublin, University College Dublin, Dublin City University, Dublin Institute of Technology) were analyzed. The actual energy consumption data were obtained from the Cylon Active Energy Management online dataset [39]. The heating degree day data were collected from Degree Days.net [40]. To discover the mixed activities in the case study buildings, a survey was conducted at the floor scale. According to the assessment of energy consumption of 52 UC buildings, five key parameters that affect the thermal energy demand were found to be:
  • Area (m2)—building useful area and activities area;
  • Mixed-use activities—this factor considers all activities in a building and calculates the value of each activity based on its area—the composite benchmark is one of the results of the mixed-use method;
  • UCrb (university campus revised benchmark)—the revised benchmark of 130 kWh/m2/yr [8] was used instead of 240 kWh/m2/yr as suggested by CIBSE TM46;
  • Heating degree days (HDD);
  • Typical operation hours of heating systems—usually influenced by the college’s energy policy, not occupants’ behavior.
The area of all activities in the surveyed buildings was calculated based on the architectural plans of the buildings. The impact of various activities on thermal energy consumption in the college buildings was determined based on the percentage area of activities. Based on the actual thermal consumption data recorded at the quarter-hour scale [39], the typical operating hours of the heating systems were calculated and the results presented in Table 1.
Two models were developed to generate the MTEBs: (1) mixed-use model and (2) converter model. The mixed-use model relies upon the impact of all activities in a building on thermal consumption. Accordingly, a composite benchmark that considers the role of mixed activities in terms of thermal energy demand was progressed. The converter model, developed based on the annual thermal consumption, presenting on DECs. The accuracy of both models was validated against the actual thermal consumption.
To assess the impact of various activities on thermal demand, the area of all the activities of the case study buildings was surveyed, and then the area of each activity calculated in AutoCAD precisely. Ten activities were identified in 52 analyzed college buildings, while among them, 7 activities were common in all cases. Based on the analysis, a typical college building in terms of mixed activities is defined for the first time: a typical college building is a type of educational building, comprising seven typical mixed activities, including computer rooms and laboratories (31%), offices (29%), seminar and research rooms (18%), library (14%), workshop (4%), stores (3%), and restaurant or coffee shop (1%).
The energy demand estimation based on TM46 UC benchmark against the actual consumption data of ”Aras An Phiarsaigh” building at the Trinity College Dublin (TCD) campus was analyzed as a sample and the results, as well as the estimation of the mixed-use model, are presented in Figure 3. Both estimations were assessed against the actual data. Lines (a) and (M) show the mean annual estimations of TM46 UC benchmark (240 kWh/m2/yr) and the mixed-use model, respectively, while line (b) presents the mean of annual actual data.
Considering the Aras An Phiarsaigh building as an example, the differences between thermal demand estimations of TM46 (mean annual) and the mixed-use model with the actual consumption were 68% and 45%, respectively (Figure 3). The result shows the mixed-use model improved the thermal demand estimation, approximately 42% compared with TM46. Coefficient (n) was defined to improve the accuracy of the mixed-use model as the ratio of the composite benchmark to the TM46 UC benchmark (240 kWh/m2/yr). Coefficient (n) reduced the errors of the mixed-use model to 6%. At this stage, the mixed-use model presents an annual-fixed estimation (line M); however, the aim is to convert this horizontal line into monthly figures. To generate the monthly thermal benchmarks, two models were improved using further drivers. Additional information about the generation of the models is presented in Section 2.1 and Section 2.2.

2.1. Mixed-Use Model

The mixed-use methodology is applicable to existing buildings and buildings at the construction stage. The method relies on CIBSE TM46 benchmarks, including 29 building categories, especially those categories found mostly in a typical college building such as “general office”, “restaurant”, “cultural activities”, “classrooms”, and “general retail”. Based on the analysis, most of the college buildings comprise seven typical activities, i.e., mixed-use functions. In fact, activity plays a key role in thermal demand; for example, a general office needs 120 kWh/m2/yr of thermal energy while a restaurant needs 370 kWh/m2/yr [4,14].
Using Equation (1) and the architectural maps, the quantity of thermal demand of a mixed-use college building can be calculated. By dividing the annual thermal demand by 12 (Equation (2)) the mean monthly thermal demand can also be calculated. To calculate the composite benchmark, Equation (1) is divided by the total useful floors area (TUFA) of the buildings; therefore, Equation (3) indicates how to calculate a composite benchmark. The mixed-use method to estimate the annual thermal demand follows:
[   f 1 × A 1 + f 2 × A 2 + f 3 × A 3 + f n × A n   ]   =   i = 1 n ( A i × f i )
Mixed Use   ( mean   monthly   heat   demand )   = i = 1 n ( A i × f i ) 12 =   E q u a t i o n   ( 1 ) 12
Composite   benchmark   =   i = 1 n ( A i × f i ) A ( T U F A )   = E q u a t i o n   ( 1 ) A   ( T U F A )
Coefficient   ( n )   = E q u a t i o n   ( 3 ) T M 46   U C   b e n c h m a r k
where (fi) is the CIBSE TM46 benchmark of activity (i), (Ai) is the relevant area of activity (i), and A (m2) is the total useful floor area of the building.
To indicate how the mixed-use method was developed, further discussion is presented in the following sections. As a sample, the model was applied in the Aras An Phiarsaigh building. The energy benchmarks of various activities are presented in Table 2. For example, the energy benchmark of a library is 200 kWh/m2/yr while the benchmark of a laboratory is 160 kWh/m2/yr. The weight of each benchmark is normalized based on its area in the building. The other necessary data to run the model are presented in Table 2.
The annual thermal demand estimation using the mixed-use model equals:
[160 × 1014 +130 × 817+ 120 × 1651+ 370 × 47 + 180 × 48 + 200 × 70] = 506600 kWh/yr
Mixed Use   estimation   ( mean   monthly )   =   506600   ÷   12   =   42217   kWh / yr
Composite   benchmark   =   506600 ÷ 3647 =   139   kWh / m 2 / yr
Coefficient   ( n )   =   139 240
The assessments demonstrated that by considering the role of mixed activities (Equation (4)) in a building, the accuracy of thermal demand estimation can be improved. Comparing the results of estimations with the actual records proved this progress.
To develop the annual model into a monthly model, a series of other drivers were taken into account. One of the important factors is the heating degree days (HDD). The HDD is sensitive to the outdoor conditions. The weather data of Dublin Airport, IE (6.30° W, 53.42° N) was applied in the calculations and the base temperature of 15.5 °C chosen to determine the HDDs. In Table 3, the HDD data of 2014 are reported.
Through multiplying Equations (1) and (2) by the result obtained from the division of the monthly HDD by annual HDD ( H D D   m o n t h   H D D   a n n u a l   ), Equation (5) was created. Then, using Equation (5), the primary version of the monthly thermal models was generated. The primary model was applied in 10 buildings and its accuracy was calibrated using the actual thermal measurements; nevertheless, the Aras An Phiarsaigh building is discussed in detail.
Equation   ( 5 )   =     [ i = 1 n ( A i × f i ) ] 2 × H D D   m o n t h 240 × A ×   H D D ( a n n u a l )
where (fi) is the CIBSE TM46 benchmark of activity (i), (Ai) is the relevant area of activity (i), A (m2) is the total useful floor area of a building, and the HDD is the heating degree days at both annual and monthly scale.
The analysis showed there were significant differences between the estimations of the primary version (Equation (5)) of the model and the actual monthly consumption data. The differences, especially in the summer season, were notable. The reason for the lower accuracy of the primary version of the model refers to the local energy efficiency policies in universities. For example, it was found that despite heating degree days, which shows the thermal demand even during summer in Dublin (Table 3), the Estates and Facilities Office at TCD turns off the heating systems during summer. This policy drastically reduced the actual thermal consumption during the summer at TCD. Therefore, another factor, i.e., typical operation hours of heating systems, was taken into account and multiplied by Equation (5) to create Equation (6). In public buildings such as colleges, the operation hours of heating systems are not affected by occupant behavior, but controlled by energy managers at universities.
Equation   ( 6 )   = [   [ i = 1 n ( A i × f i ) ] 2 × H D D   m o n t h 240 × A × H D D ( a n n u a l )   ]   × M o n t h l y   t y p i c a l   o p e r a t i o n   ( h o u r s ) S t a n d a r d   m o n t h l y   o p r a t i o n   ( C I B S E ,       h o u r s )
where (fi) is the CIBSE TM46 benchmark of activity (i), (Ai) is the relevant area of activity (i), A (m2) is the total useful floor area of a building, and HDD is heating degree day at both annual and monthly scale.
The mean absolute percentage error (MAPE) on a monthly scale evaluated the accuracy of the final mixed-use model (Equation (6)). Besides, the accuracy of the model was calibrated by R-squared value, which indicates the error between the modeled values and the recorded values. The model applied to the other case study buildings. In all of the analyzed buildings, the maximum MAPE at the monthly level was under 21%, whereas it was 18% at the annual level. Compared with the best result (22%) of other annual estimation models [14], the result is acceptable.

2.2. Converter Model

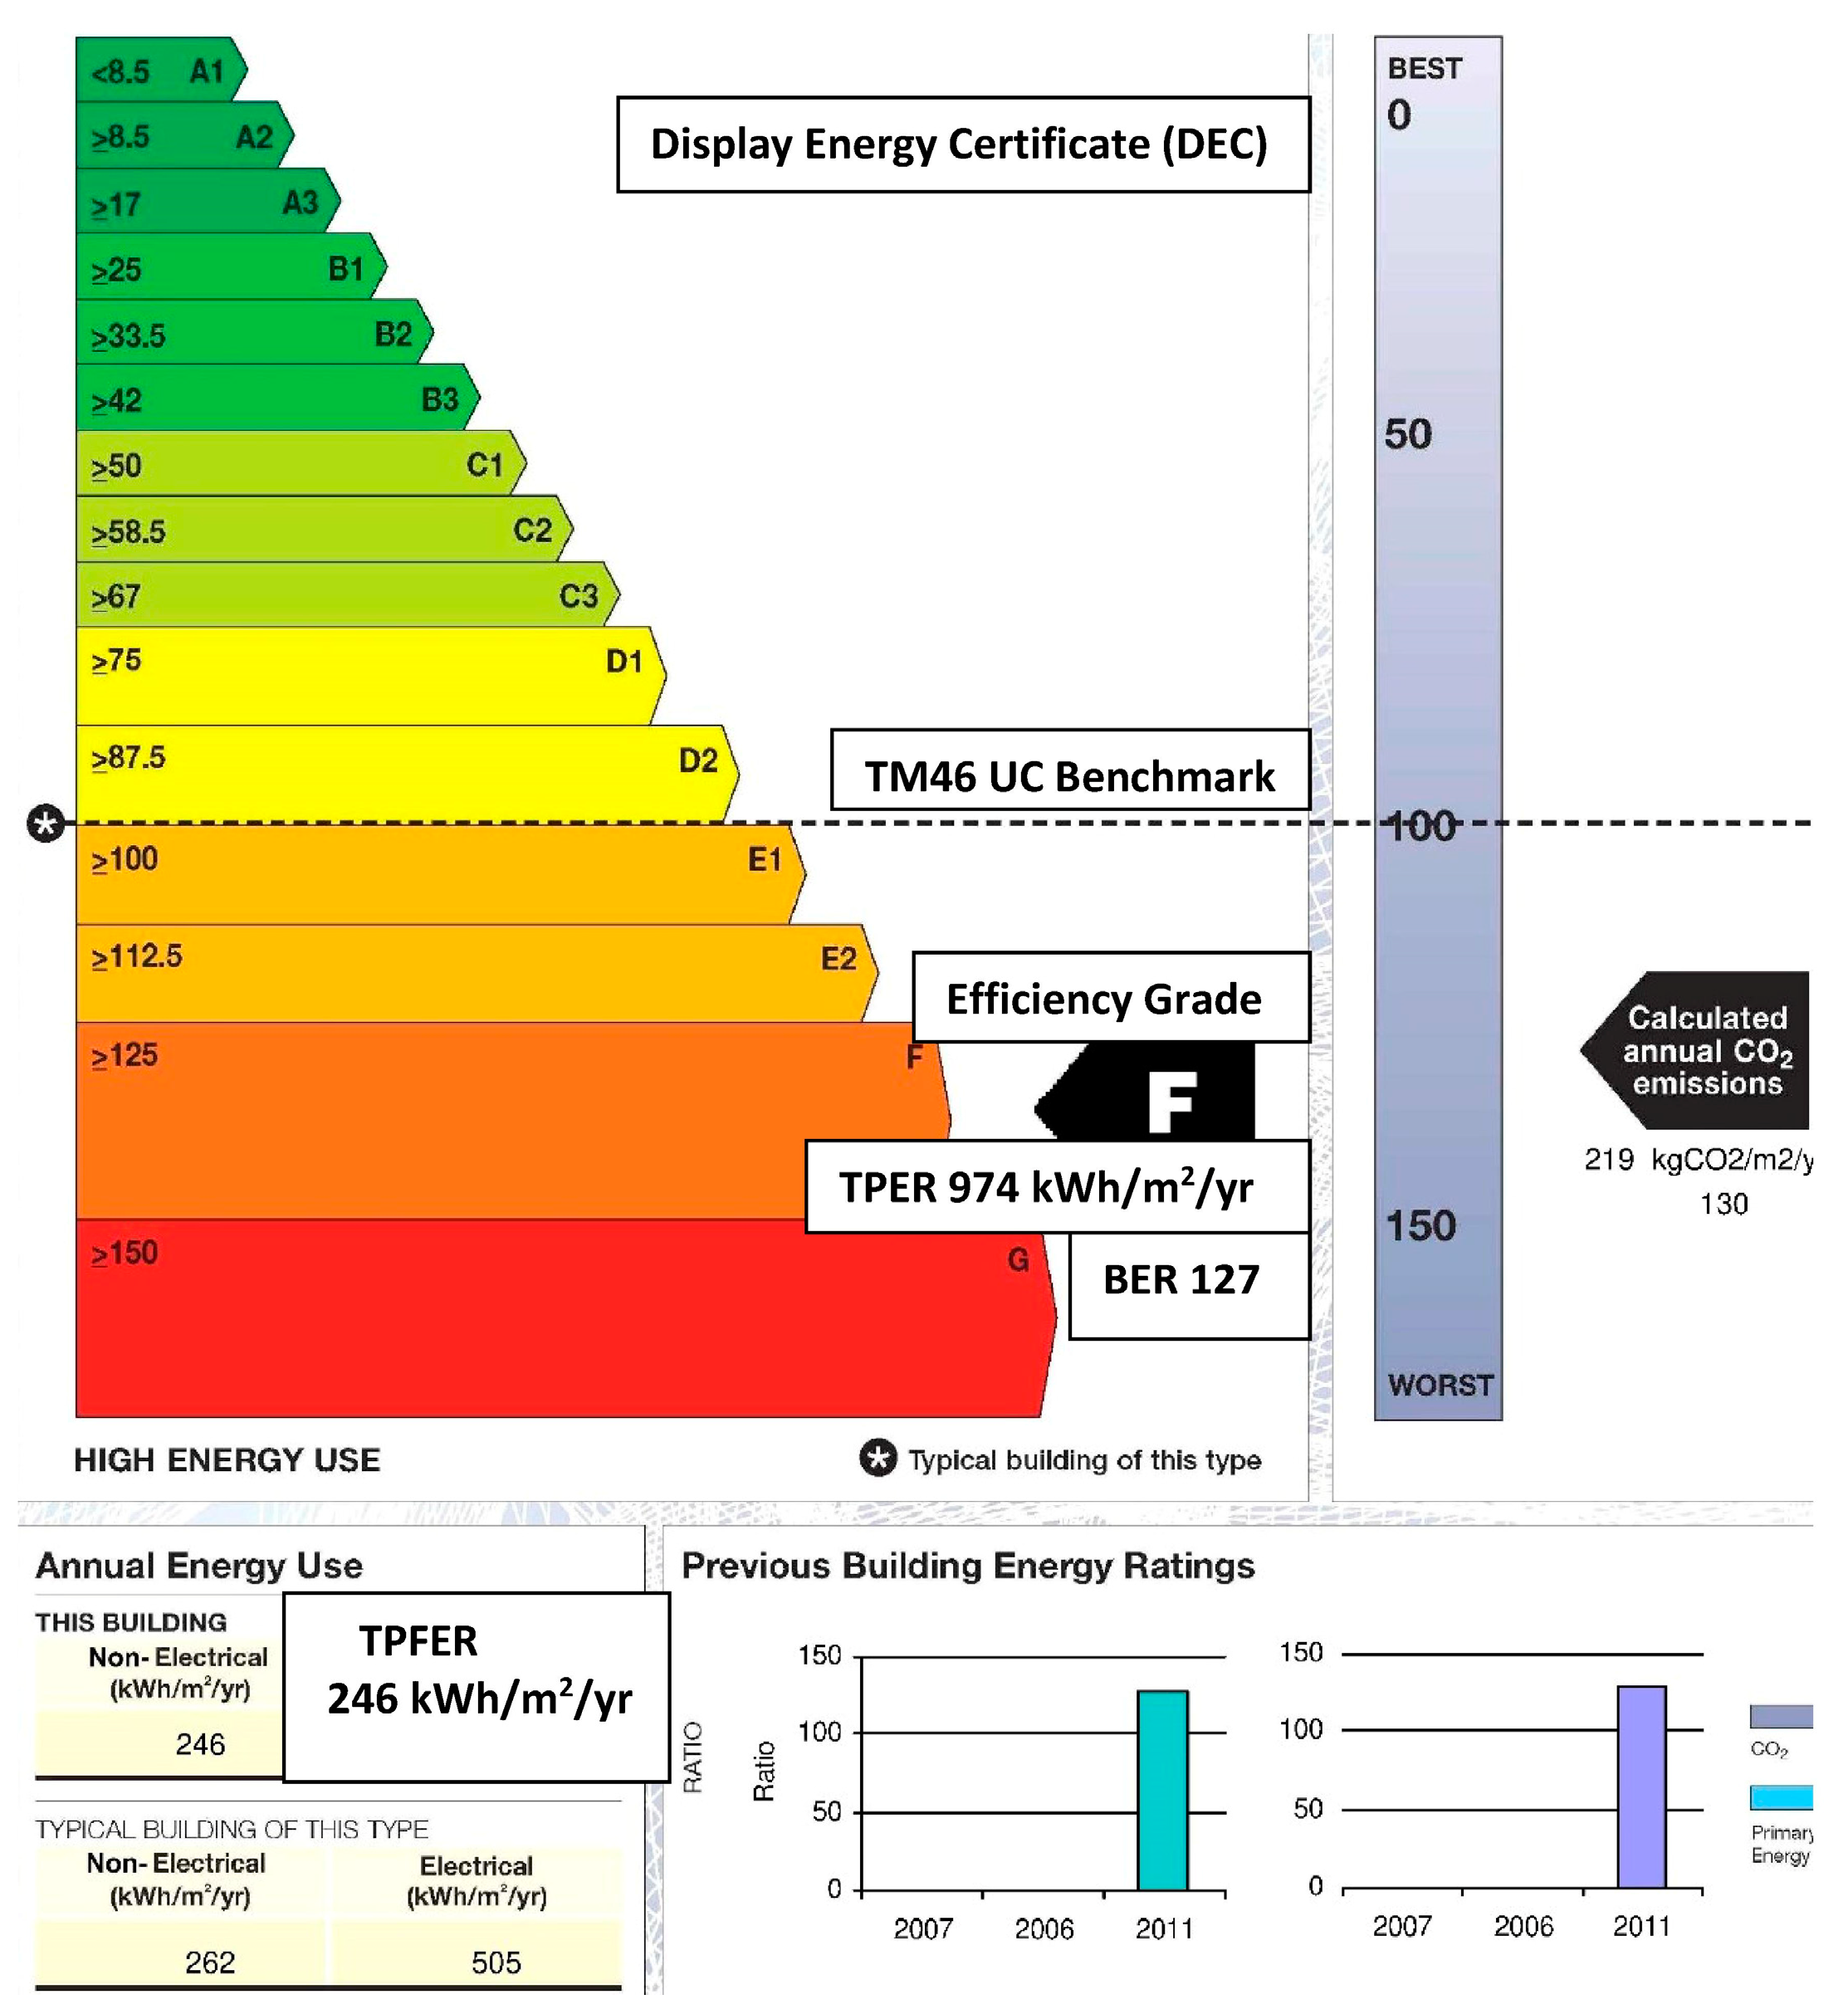
Display energy certificates (DECs) present annual thermal consumption. If DEC documents are available, the converter model is more user-friendly compared to the mixed-use method to convert the annual heat demand into the monthly profiles. Normally the TPFER (Figure 1) is presented on DECs in kWh/m2yr. To create a monthly thermal energy model using TPFER, HDD and the operation hours of heating systems play a key role. Equation (7) shows the final version of the converter model:
Equation   ( 7 )   =   [ TPFER × m × A × H D D   m o n t h   T o t a l   H D D ( a n n u a l ) ]   ×   M o n t h l y   t y p i c a l   o p e r a t i o n   ( h o u r s ) S t a n d a r d   m o n t h l y   o p r a t i o n   ( C I B S E ,   h o u r s )
where A (m2) is the total useful floor area of the building and HDD is heating degree day at both annual and monthly scale.
The maximum unit interval of 20%, presented by the coefficient (m) in which m ∈ [0.80, 1] was considered in the model and refers to the difference between TPFER and TFC. This difference was also shown by other scholars [22]. To increase the accuracy of simulations this difference was considered. Using the converter model, the annual thermal demand of a typical college building can be converted into the monthly figures. To understand how both mixed-use and converter models can be applied in practice, a flowchart is presented in Appendix A.

3. Application of the Mixed-Use Model

The Museum Building on the TCD campus is located on the south of the New Square, just beside the Berkeley Library. The building is a mixed-use, typical college building where the Geology and Engineering Departments are housed. TM46 predicts that the building needs 240 kWh/m2 of thermal energy per year. The actual consumption, HDD, and the mean of monthly thermal demand based on TM46 and the mixed-use model are presented in Figure 4. Compared with TM46, the mixed-use model improved the accuracy of estimation by 42%. The data were used to run the mixed-use model for the Museum Building, as presented in Table 4.
Based on the data presented in Table 4 and using Equation (6), the monthly thermal demand of the Museum Building was generated (Table 5). The MAPE (mean absolute percentage error) of the mixed-use model and TM46 (mean monthly) compared with the actual consumption and the results are presented in Table 5.
The overall difference in thermal demand using the mixed-use model with actual annual consumption was 7%, while the error of TM46 was 125% (Table 5). The greatest error of the mixed-use model was 20% in October, while the lowest error of 2% was observed in May. In April, August, and September, the model shows 14% overestimation. However, the greatest monthly MAPE of TM46 was 9607%. The high estimation errors of TM46 in summer months means that this benchmarking system cannot reliably predict the thermal demand at smaller temporal resolutions.
Adopting linear regression model [41], the energy demand prediction results of the model were assessed versus the actual energy demand (Figure 5). R-squared (R2) is a statistical measure that represents the proportion of the variance for a dependent variable that is explained by the independent variables in a regression model. It is the percentage of the response variable variation that is explained by a linear model. In our models, the R-squared of 0.971 shows a strong relationship between the actual data and the predicted figures. Therefore, it proves the high level of accuracy of the mixed-use model.

4. Application of the Converter Model

The converter model is applicable when DECs are available. In fact, this approach relies upon the total primary fossil (nonelectrical) energy required (TPFER) displaying on DECs. In the converter model, the TPFER number, an annual index, was converted into monthly thermal figures, which are more informative for the energy efficiency planning and management. Using Equation (7), the TPFER number on DECs can be converted into the monthly thermal demand values.
As an example, using five key parameters, a monthly thermal demand profile was generated for the Nova Building at the UCD (University College Dublin) campus (Figure 6). According to the Nova’s DEC certificate, the building requires 122 kWh/m2/yr of total primary fossil energy and the building’s total useful area is 4066 m2. Both approaches, mixed-use model and converter model, were applied to the Nova Building and the results compared with the actual records (Figure 6). It can be seen that the actual consumption is located between the estimated values generated by the both models.
Table 6 shows the results of monthly thermal demand prediction generated by both models in the Nova Building. Furthermore, the MAPE of the two models was compared with TM46 estimations. The accuracy of TM46 and the monthly models was assessed against the actual figures. The differences of errors between TM46 and the predictions of the two models were significant. The maximum monthly MAPE of the mixed-use model and converter model was under 22%, while the maximum MAPE of TM46 in August was 7187% (Table 6). This huge error of TM46 in August means that the CIBSE benchmarking system overestimates the energy demand 71 times more than the actual energy consumption, which indicates the weakness and inability of the CIBSE TM46 benchmarking system. The minimum error of the mixed-use model was 5% and that of the converter model was only 1%, while the minimum error of TM46 was 13%. The annual errors of the monthly models were 11% and 14%, respectively. In contrast, the annual error of TM46 was 116%. The comparison methodology indicates a substantial development of the accuracy for both the mixed-use and converter models.

5. Monthly Thermal Energy Benchmarks (MTEBs)

Using the mixed-use and converter models, the monthly thermal energy benchmarks (MTEBs) for typical college buildings were generated. This new generation of thermal energy benchmarks varies during a year, following the outdoor conditions. The MTEBs methodology can extrapolate into other weather conditions as well as building types. If in Equations (6) and (7) the total useful area of buildings is assumed to be 1 m2 (the definition of benchmark), then the monthly benchmarks per unit area can be determined accordingly. The annual-fixed benchmark was proposed by TM46 in 2008; i.e., 240 kWh/m2/yr was developed through the models into 12 monthly thermal energy benchmarks.
The MTEBs (Figure 7) show various thermal demand in each month. For example, in January, a typical college building needs 24 kWh/m2/month, and the demand was reduced regularly when the outdoor temperature was decreased; therefore in June, the benchmark is 1 kWh/m2/month. Likewise, the benchmark from nearly 0 kWh/m2/month in July increased to 19 kWh/m2/month in December.
Table 7 shows the MTEBs indexes which were validated against the mean of monthly actual consumption (kWh/m2/month) of 10 college buildings obtained from the AEM (Active Energy Management dataset) [39]. Using the mean of actual thermal consumption of the buildings belonging to the four case study universities, the accuracy of MTEBs was assessed and the results are presented in Figure 7.
In addition, the values of MTEBs were compared with the TM46 annual benchmark. According to the analysis, the predictions of MTEBs were very close to the actual measurements. The mean annual actual thermal consumption was 128 kWh/m2/yr and the developed MTEBs predicted 130 kWh/m2/yr, while the TM46 method predicted 240 kWh/m2/yr. The overall MTEB was 130 kWh/m2/yr. The R-squared of 0.995 shows the high level of accuracy for MTEBs, as presented in Figure 8.

6. Conclusions

Due to the excessive dependence of heat consumption on the ambient temperature, the annual-fixed thermal benchmark (240 kWh/m2/yr) suggested by CIBSE TM6 for the category of UC is not very effective. Instead, the concept of monthly thermal energy benchmarks (MTEBs) for typical college buildings was developed, which are more informative, especially for managing the thermal consumption/efficiency at the community scale. Unlike other benchmarking methodologies that consider buildings as having a single function, in this study the mixed activities in buildings were taken into account. Two methods, including mixed-use model and converter model, were adopted to generate the MTEBs. MTEBs present information that is more detailed and therefore more applicable compared to the annual benchmarks such as TM46. This detailed information from the viewpoint of heat efficiency and planning, as well as the energy supplying and financial policy, is vital.
The accuracy of the developed models at a monthly scale was validated against the actual thermal consumption using the mean absolute percentage error (MAPE). In addition, the truthfulness of the new generation of the developed benchmarks was examined by linear regressions.
While the discrepancy of the CIBSE TM46 benchmark with the actual consumption was radically significant (e.g., 7187%), the maximum monthly error of the progressed models was lower than 22%. The MTEBs show that a typical college building needs 24 kWh/m2/month in January and the demand reduces regularly in summer months. In June, only 1 kWh/m2/month of heat is needed while in July it is nearly zero. The monthly benchmarks from July increased gradually to 19 kWh/m2/month in December. The overall annual MTEBs is 130 kWh/m2/yr, which shows a significant improvement compared with 240 kWh/m2/yr suggested by TM46. The benchmarking methodology developed presents a curved line instead of an annual-fixed horizontal line as proposed by TM46. In this paper, 12 thermal energy benchmarks at the monthly level were presented instead of a TM46 annual benchmark. Finally, the R-squared of 0.995 indicated the high level of reliability of MTEBs. Planners, energy suppliers, and professionals for detailed heat planning at the community scale can use MTEBs. Since the benchmarks play a key role in energy action plans at the national scale, the new generation of proposed benchmarks can improve the accuracy of national action plans by sharing more information at the monthly level.

Author Contributions

Conceptualization, S.V.; formal analysis S.V., S.M., and K.J.; investigation, B.N. and S.V.; methodology, S.V., B.N., and S.M.; writing, S.M., K.J., and B.N.; supervision, S.V. and B.N. All authors have read and agreed to the published version of the manuscript.

Funding

This research received no external funding.

Acknowledgments

The authors acknowledge the State Office of four universities in Dublin for sharing DECs and data provided, which facilitated this research. The authors acknowledge in particular Kieron McGovern, Mark Argue, Stephen Folan, and Kieran Brassil for their kind help and providing data. We also acknowledge the Degree Days.net website for sharing the data for free.

Conflicts of Interest

The authors declare no conflict of interest.

Nomenclature

BER: building energy ratio; CIBSE: Chartered Institution of Building Services Engineers; DEC: display energy certificate; HDD: heating degree days; MAPE: mean absolute percentage error; MTEBs: monthly thermal energy benchmarks; TFC: total final consumption or actual consumption is the amount of energy consumed in the buildings measured by meters and displayed on energy bills; TPER: total primary energy required in a building including thermal and electricity; TPFER: total primary fossil energy required in a building; UC: university campus, refers to the category number 18 of CIBSE TM46:2008 benchmark

Appendix A. The Flowchart of Developed Models

The following flowchart shows how both mixed-use model and converter model can be applied in practice step-by-step, given available energy data.
Figure A1. The flowchart of model application.
Energies 13 06606 g0a1

References

  1. Evangelinos, K.I.; Jones, N.; Panoriou, E.M. Challenges and opportunities for sustainability in regional universities: A case study in Mytilene, Greece. J. Clean. Prod. 2009, 17, 1154–1161. [Google Scholar] [CrossRef]
  2. Locmelis, K.; Blumberga, D.; Blumberga, A.; Kubule, A. Benchmarking of industrial energy efficiency. outcomes of an energy audit policy program. Energies 2020, 13, 2210. [Google Scholar] [CrossRef]
  3. Kim, H.G.; Kim, S.S. Development of energy benchmarks for office buildings using the national energy consumption database. Energies 2020, 13, 950. [Google Scholar] [CrossRef] [Green Version]
  4. Chartered Institution of Building Services Engineers; CIBSE TM46; Energy Institue, University College, CIBSE: London, UK, 2008.
  5. Hong, S.-M.; Steadman, P. An Analysis of Display Energy Certificates for Public Buildings, 2008 to 2012, a Report to Chartered Institution of Building Services Engineering; Energy Institue, University College, CIBSE: London, UK, 2013. [Google Scholar]
  6. Hawkins, D.; Hong, S.M.; Raslan, R.; Mumovic, D.; Hanna, S. Determinants of energy use in UK higher education buildings using statistical and artificial neural network methods. Int. J. Sustain. Built Environ. 2012, 1, 50–63. [Google Scholar] [CrossRef] [Green Version]
  7. Bruhns, H.; Jones, P.; Cohen, R. CIBSE review of energy benchmarks for display energy certificates. In Proceedings of the CIBSE Technical Symposium, Leicester, UK, 6–7 September 2011. [Google Scholar]
  8. Vaisi, S.; Pilla, F.; McCormack, S.J. Recommending a thermal energy benchmark based on CIBSE TM46 for typical college buildings and creating monthly energy models. Energy Build. 2018, 176, 296–309. [Google Scholar] [CrossRef]
  9. Javanroodi, K.; Mahdavinejad, M.; Nik, V.M. Impacts of urban morphology on reducing cooling load and increasing ventilation potential in hot-arid climate. Appl. Energy 2018, 231, 714–746. [Google Scholar] [CrossRef]
  10. Pérez-Lombard, L.; Ortiz, J.; González, R.; Maestre, I.R. A review of benchmarking, rating and labelling concepts within the framework of building energy certification schemes. Energy Build. 2009, 41, 272–278. [Google Scholar] [CrossRef]
  11. International Energy Agency. Energy Performance Certification of Building, a Policy Tool to Improve Energy Efficiency; International Energy Agency: Paris, France, 2010. [Google Scholar]
  12. The Council of the European Commuities. European Council Directive 93/76/EEC, 13 September 1993; European Commuities, Ed.; The Council of the European Commuities: Brussels, Belgium, 1993. [Google Scholar]
  13. Sustainable Energy Authority Ireland (Seai). What is the Total Primary Energy Requirement (TPER)? Available online: http://www.seai.ie/Your_Business/Public_Sector/FAQ/Calculating_Savings_Tracking_Progress/What_is_the_Total_Primary_Energy_Requirement.html (accessed on 28 December 2015).
  14. Chartered Institution of Building Services Engineers; CIBSE TM47; CIBSE: London, UK, 2009.
  15. Carbon Trust. The Carbon Trust Annual Report 2012/2013, Accelerating the Move to a Sustainable, Low Carbon Economy; Carbon Trust: London, UK, 2013. [Google Scholar]
  16. Hong, S.-M.; Paterson, G.; Burman, E.; Steadman, P.; Mumovic, D. A comparative study of benchmarking approaches for non-domestic buildings: Part 1—Top-down approach. Int. J. Sustain. Built Environ. 2013, 2, 119–130. [Google Scholar] [CrossRef] [Green Version]
  17. Burman, E.; Hong, S.-M.; Paterson, G.; Kimpian, J.; Mumovic, D. A comparative study of benchmarking approaches for non-domestic buildings: Part 2—Bottom-up approach. Int. J. Sustain. Built Environ. 2014, 3, 247–261. [Google Scholar] [CrossRef] [Green Version]
  18. Burman, E.; Mumovic, D.; Kimpian, J. Towards measurement and verification of energy performance under the framework of the European directive for energy performance of buildings. Energy 2014, 77, 153–163. [Google Scholar] [CrossRef] [Green Version]
  19. Salah, V.; Mark, D.; Francesco, P. Energy requirement mapping for university campus using CIBSE benchmarks and comparing CIBSE to display energy certificate (DEC) to extract a new criterion. In Proceedings of the Energy Systems Conference, London, UK, 24–25 June 2014. [Google Scholar]
  20. EPBD Energy Performance of Building Directive. Directive 2002/91/CE of the European Parliament and Council from 16 of December 2002. Off. J. Eur. Communities 2003. Available online: https://eur-lex.europa.eu/legal-content/EN/TXT/PDF/?uri=CELEX:32002L0091&from=IT (accessed on 12 September 2020).
  21. Borgstein, E.H.; Lamberts, R.; Hensen, J.L.M. Evaluating energy performance in non-domestic buildings: A review. Energy Build. 2016, 128, 734–755. [Google Scholar] [CrossRef]
  22. Lee, W.-S.; Lee, K.-P. Benchmarking the performance of building energy management using data envelopment analysis. Appl. Therm. Eng. 2009, 29, 3269–3273. [Google Scholar] [CrossRef]
  23. Pasichnyi, O.; Wallin, J.; Levihn, F.; Shahrokni, H.; Kordas, O. Energy performance certificates—New opportunities for data-enabled urban energy policy instruments? Energy Policy 2019, 127, 486–499. [Google Scholar] [CrossRef]
  24. Burman, E.; Kimpian, J.; Mumovic, D. Building schools for the future: Lessons learned from performance evaluations of five secondary schools and academies in England. Front. Built Environ. 2018, 4. [Google Scholar] [CrossRef] [Green Version]
  25. Papadopoulos, S.; Bonczak, B.; Kontokosta, C.E. Pattern recognition in building energy performance over time using energy benchmarking data. Appl. Energy 2018, 221, 576–586. [Google Scholar] [CrossRef] [Green Version]
  26. Roth, J.; Rajagopal, R. Benchmarking building energy efficiency using quantile regression. Energy 2018, 152, 866–876. [Google Scholar] [CrossRef]
  27. Liu, J.; Chen, H.; Liu, J.; Li, Z.; Huang, R.; Xing, L.; Wang, J.; Li, G. An energy performance evaluation methodology for individual office building with dynamic energy benchmarks using limited information. Appl. Energy 2017, 206, 193–205. [Google Scholar] [CrossRef]
  28. Park, J.Y.; Yang, X.; Miller, C.; Arjunan, P.; Nagy, Z. Apples or oranges? Identification of fundamental load shape profiles for benchmarking buildings using a large and diverse dataset. Appl. Energy 2019, 236, 1280–1295. [Google Scholar] [CrossRef]
  29. Lamagna, M.; Nastasi, B.; Groppi, D.; Nezhad, M.M.; Garcia, D.A. Hourly energy profile determination technique from monthly energy bills. Build. Simul. 2020, 13, 1235–1248. [Google Scholar] [CrossRef]
  30. Mancini, F.; Nastasi, B. Energy retrofitting effects on the energy flexibility of dwellings. Energies 2019, 12, 2788. [Google Scholar] [CrossRef] [Green Version]
  31. Papadopoulos, S.; Kontokosta, C.E. Grading buildings on energy performance using city benchmarking data. Appl. Energy 2019, 233–234, 244–253. [Google Scholar] [CrossRef]
  32. Seyedzadeh, S.; Rahimian, F.P.; Glesk, I.; Roper, M. Machine learning for estimation of building energy consumption and performance: A review. Vis. Eng. 2018, 6, 5. [Google Scholar] [CrossRef]
  33. Koo, C.; Hong, T. Development of a dynamic operational rating system in energy performance certificates for existing buildings: Geostatistical approach and data-mining technique. Appl. Energy 2015, 154, 254–270. [Google Scholar] [CrossRef]
  34. Yan, C.; Wang, S.; Xiao, F.; Gao, D.-C. A multi-level energy performance diagnosis method for energy information poor buildings. Energy 2015, 83, 189–203. [Google Scholar] [CrossRef]
  35. Khoshbakht, M.; Gou, Z.; Dupre, K. Energy use characteristics and benchmarking for higher education buildings. Energy Build. 2018, 164, 61–76. [Google Scholar] [CrossRef] [Green Version]
  36. Zhan, S.; Liu, Z.; Chong, A.; Yan, D. Building categorization revisited: A clustering-based approach to using smart meter data for building energy benchmarking. Appl. Energy 2020, 269, 114920. [Google Scholar] [CrossRef]
  37. Arjunan, P.; Poolla, K.; Miller, C. EnergyStar++: Towards more accurate and explanatory building energy benchmarking. Appl. Energy 2020, 276, 115413. [Google Scholar] [CrossRef]
  38. Wei, Z.; Xu, W.; Wang, D.; Li, L.; Niu, L.; Wang, W.; Wang, B.; Song, Y. A study of city-level building energy efficiency benchmarking system for China. Energy Build. 2018, 179, 1–14. [Google Scholar] [CrossRef]
  39. Cylon. Cylon Active Energy Management. Available online: https://cylonaem.com/energy/#v=1&t=9&c=0 (accessed on 10 March 2015).
  40. Heating Degree Days. BizEE Software, Degree Days.Net—Custom Degree Day Data. Available online: http://www.degreedays.net/ (accessed on 2 January 2016).
  41. Manfren, M.; Nastasi, B.; Tronchin, L. Linking design and operation phase energy performance analysis through regression-based approaches. Front. Energy Res. 2020, 8, 557649. [Google Scholar] [CrossRef]
Figure 1. The main data presented on a display energy certificate (DEC).
Energies 13 06606 g001
Figure 2. Monthly thermal energy benchmarks (MTEBs) ideogram.
Energies 13 06606 g002
Figure 3. CIBSE TM46 UC and mixed-use model for thermal estimation against the actual data, Aras An Phiarsaigh building, Trinity College Dublin (TCD) campus 2014.
Energies 13 06606 g003
Figure 4. Comparison of actual heat consumption with CIBSE and mixed-use model.
Energies 13 06606 g004
Figure 5. R-squared assessment to control the accuracy of the model.
Energies 13 06606 g005
Figure 6. Monthly thermal demand profiles, mixed-use model and converter model, Nova Building, University College Dublin (UCD).
Energies 13 06606 g006
Figure 7. Monthly thermal energy benchmarks (MTEBs) for typical college buildings.
Energies 13 06606 g007
Figure 8. Accuracy assessment of the MTEBs.
Energies 13 06606 g008
Table 1. Typical operation hours of heating systems.
MonthsJanFebMarAprMayJunJulAugSepOctNovDecTotal Year
Mean operation of 10 buildings300280260250240854535802232492292276
Table 2. Mixed activities value in the Aras An Phiarsaigh building.
ActivityArea (m2)% of Total Useful Floor AreaCategory NameCategory NoTM46 Benchmarks
Seminar and research room81722UC18UCrb:130
Office165145General office1120
Computer rooms and Laboratory101429Laboratory24160
workshops481Workshop27180
Coffee shop471Restaurant7370
Library702Cultural activities10200
Total3647100----------
Table 3. Heating degree days (HDD) for 2014.
MonthsJanFebMarAprMayJunJulAugSepOctNovDec
HDD30327426718213363327072132225316
Annual2069
Table 4. Museum Building data.
ActivitiesArea (m2)% Area of Activities (m2)
Computer rooms and Laboratory68319
Office155343
Seminar, class, and Research room96526
Library3249
Stores1203
Total3645100
Table 5. Monthly heat demand and the percent of errors.
MonthsActual Gas Consumption, Museum Building 2012 (kWh/yr)HDD 2012Typical Operation of Heating Systems (Hours)Mixed-Use Model (kWh/yr)TM46 Mean Monthly (kWh/yr)MAPE of the Mixed-Use ModelMAPE of TM46 (Mean Monthly)
January64,20028130057,41472,9001114
February51,37425328048,24772,900642
March47,60722426039,66672,9001753
April39,53426425044,95172,9001484
May28,43317124027,95172,9002156
June09385538372,900**
July06645202372,900**
August751363585872,900149607
September527611080599372,900141282
October40,69721422332,50272,9002079
November53,48427224946,12872,9001436
December56,75831022948,34972,9001528
Total388,11422942276359,466874,8007125
Table 6. Recorded data and monthly profiles and percent of errors compared with mean annual of CIBSE for the Nova Building, UCD.
MonthsActual Gas Consumption (kWh)Mixed Use Model (kWh)Converter Model (kWh)TM46 Estimation(Mean Annual) (kWh)MAPE of Mixed Use ModelMAPE of Converter ModelMAPE of TM46
January71,90764,55082,40781,320101513
February63,69654,24469,24981,32015928
March47,26844,53856,85981,32062072
April55,45150,53864,51881,32091647
May34,11331,42540,11881,320818138
June67396053772781,32010151107
July27842274290381,3201842821
August1116965123281,32014107187
September85446738860281,320211852
October39,01536,56946,68581,320620108
November54,48951,89566,25281,32052249
December66,87654,43869,49781,32019422
Total451,998404,227516,051975,8401114116
Table 7. MTEBs against TM46 UC benchmark and actual thermal consumptions.
MonthsMTEBs Based on Mixed-Use Model (kWh/m2/month)MTEBs based on Converter Model (kWh/m2/month)MTEBs
Mean of Both Models (kWh/m2/month)
Mean of Actual Thermal Consumption of 10 Buildings (kWh/m2/month)TM46 Benchmark (kWh/m2/yr)
January21282424-
February17232020-
March16211918-
April10141213-
May71097-
June1212-
July0001-
August1111-
September1222-
October7988-
November13171515-
December17221918-
Total111149130128240
Publisher’s Note: MDPI stays neutral with regard to jurisdictional claims in published maps and institutional affiliations.

