Article

Process Configuration Studies of Methanol Production via Carbon Dioxide Hydrogenation: Process Simulation-Based Optimization Using Artificial Neural Networks

by
Prapatsorn Borisut
and
Aroonsri Nuchitprasittichai
*
School of Chemical Engineering, Suranaree University of Technology, Nakhon Ratchasima 30000, Thailand
*
Author to whom correspondence should be addressed.
Energies 2020, 13(24), 6608; https://doi.org/10.3390/en13246608
Submission received: 20 October 2020 / Revised: 25 November 2020 / Accepted: 30 November 2020 / Published: 14 December 2020
(This article belongs to the Special Issue Carbon Dioxide (CO2) Utilization)

Abstract

:
Methanol production via carbon dioxide (CO2) hydrogenation is a green chemical process, which can reduce CO2 emission. The operating conditions for minimum methanol production cost of three configurations were investigated in this work. An artificial neural network with Latin hypercube sampling technique was applied to construct model-represented methanol production. Price sensitivity was performed to study the impacts of the raw materials price on methanol production cost. Price sensitivity results showed that the hydrogen price has a large impact on the methanol production cost. In mathematical modeling using feedforward artificial neural networks, four different numbers of nodes were used to train artificial neural networks. The artificial neural network with eight numbers of nodes showed the most suitable configuration, which yielded the lowest percent error between the actual and predicted methanol production cost. The optimization results showed that the recommended process design among the three studied configurations was the process of methanol production with two reactors in series. The minimum methanol production cost obtained from this configuration was $888.85 per ton produced methanol, which was the lowest methanol production cost among all configurations.

1. Introduction

Many greenhouse gases (GHGs) are naturally present in the atmosphere. Carbon dioxide, which causes global warming, is one of the most emitted by anthropogenic. Nowadays, carbon dioxide presents 76% of the total sources of greenhouse gas [1]. An increase in the amount of carbon dioxide in the air leads to the challenge of carbon dioxide capture and utilization. Carbon dioxide could be used as a reactant to produce sustainable energy, like methanol and dimethyl ether [2]. Methanol synthesis is considered as the second largest production from carbon dioxide conversion, after urea production [3]. Methanol is a very valuable chemical, giving products such as dimethyl ether, methyl tertiary-butyl ether, formaldehyde, and acetic acid, and has direct use as fuel [4].
Methanol or methyl alcohol is an environmentally-friendly fuel due to its combustion not producing toxic byproducts like SOx or NOx [5]. The advantages of using methanol as a fuel are that it has lower risks, lower emissions, and higher performances than gasoline [6]. The methanol production scale was reported in Market Analytics: Methanol and Derivatives2018 [7], showing that the world scale has been constantly increasing. From all of methanol demands, 28% of the demand is used in the methanol to olefin (MTO) industry and 23% of the demand is used in the formaldehyde production process.
Conventionally, methanol was produced by syngas. The first commercial methanol synthesis plant was established in 1923 by BASF with operating conditions of 300 bar and temperature above 300 °C. Due to the high pressure and temperature of methanol synthesis, copper-based catalyst was introduced to reduce that limitations. The Cu-ZnO/Al2O3 catalyst was performed in the reaction of methanol synthesis with operating conditions of 50–100 bar and 200–300 °C. The improvement of catalysts to higher performances and methanol yield were studied [8,9,10]: for example, an increase in methanol production rate by doping Mn to Cu/ZnZr catalyst or coding Pd/ZnO over multi-walled carbon nanotubes [8]. Furthermore, methanol could be manufactured using carbon dioxide and hydrogen, called carbon dioxide hydrogenation.
In the past decade, methanol production from pure carbon dioxide and hydrogen (carbon dioxide hydrogenation) feeds was proposed as a green chemical process that supports carbon dioxide mitigation. Bowker [4] suggested not only that sustainable methanol synthesis should be produced from green sources of carbon but also that hydrogen must not be derived from fossil fuels. The cost of methanol production via carbon dioxide hydrogenation is higher than the cost of methanol production via natural gas, due to the price of hydrogen used in hydrogenation. The hydrogenation process also consumes more energy than the methanol production process from syngas. Tidona et al. [11] reported that energy consumption of the conversion of carbon dioxide and hydrogen is 26% higher than syngas-to-methanol production. Other researches also reported that carbon dioxide hydrogenation required a 2 to 2.5 times higher cost than conventional process and consumed more utilities [12,13].
Several processes of modification and optimization were studied to reduce the cost and energy consumption of the carbon dioxide hydrogenation process, and to achieve mitigation of carbon dioxide emission to the atmosphere [12,14,15,16,17]. Pellegrini et al. [14] modified the methanol production plant configuration; the gases recycled were used to feed a combined-cycle energy plant. The two stages of reforming and carbon dioxide hydrogenation of the sustainable carbon dioxide conversion process were compared to the conventional methanol production plant. The development of these process could reduce net carbon dioxide emissions, especially in the case of carbon dioxide hydrogenation. The cost of direct conversion via carbon dioxide hydrogenation is considered to be high due to the large amount of hydrogen consumption and high hydrogen price [15].
For studies of operating conditions of the reactor for methanol production via carbon dioxide hydrogenation, the temperature range of 200–250 °C [18,19] and the pressure range of 15–55 bar were studied [19]. Leonzio et al. reported that high operating pressure and low operating temperature can increase carbon dioxide conversion [19]. The operating conditions of reactor 210 °C and 78 bar resulted in 94% carbon dioxide conversion [20].
Many researches on process modeling and optimization of methanol production via CO2 hydrogenation were studied to increase methanol production capacity. Leonzio [16] used ANOVA to perform the methanol reactor model using a central composite design to investigate the significance of each parameter on the reactor performance. If the temperature is increased, the carbon dioxide/hydrogen feed ratio is decreased, and the recycle ratio is increased, higher methanol productivity could be obtained. After that, methanol production was studied with different three novel reactor configurations: once-through reactor, equilibrium reactor with recycling, and membrane reactor with separator, using Aspen Plus. The reactor with recycling showed that a higher methanol product occurs when the recycle ratio is increased and ensures higher efficiency when compared with other reactor schemes [19]. The study of process modeling and simulation in [17] was performed with different model configurations. The results indicated that methanol production with two reactors in series have the advantage of low production cost at maximum capacity. The optimization of temperature before entering the first reactor of 160 °C with the recycle ratio of 1.197 could help in the minimization of heat integration and production cost. Borisut and Nuchitprasittichai [21] performed simulation–based optimization to minimize the cost of methanol production via CO2 hydrogenation. Response surface methodology (RSM) was used to represent methanol production and optimized the methanol production cost.
In simulation-based optimization, an optimization algorithm uses mathematical functions as the objective functions and solves the problems via minimization or maximization of a function. The mathematical functions can be nonlinear regression models or metamodels such as an Artificial Neural Networks (ANNs). An artificial neural network works by surrogate modeling, a powerful tool for many applications, and can fit complex nonlinear function [22]. Artificial neural networks are widely used in many processes in chemical engineering to model functions, e.g., carbon dioxide absorption or a ethylene cracking furnace [22,23,24,25]. In the case of methanol production, an artificial neural network was used to model and optimize the process. The modification and optimization of the carbon dioxide hydrogenation unit to maximize the amount of produced methanol was investigated using an artificial neural network and verified with industrial plant data [26]. The input of the model were the inlet pressure and inlet temperature of the reactor. The multilayer perceptron (MLP) network was determined to select the number of nodes by trial and error. The results indicated that higher methanol production was produced with an increase of the reactor inlet pressure and decrease in reactor inlet temperature. Ye [25] used an artificial neural network with three layers to investigate the influences of decision parameters on methanol concentration and carbon monoxide conversion. The results showed that a simple artificial neural network has a fair consistence with experimental results and the data of the outputs indicated that methanol concentration and carbon monoxide conversion were increased with an increase in pressure from 10 to 30 bar.
However, modelling and optimization of the methanol production process via carbon dioxide hydrogenation, which compares process configurations and optimizes process parameters for a minimum production cost, has not been studied. This work studied methanol production with three different configurations and an applied artificial neural network as an objective function in the optimization problem. For artificial neural networks training, a different number of nodes was considered. The model representation with an artificial neural network was solved to obtain the minimum methanol production cost in a unit per ton of produced methanol and optimal operating conditions. The optimization problem was solved using an optimizer.
This paper is organized as follows: Section 2 gives detail of process configuration and economic evaluation. Section 3 gives detail of sampling techniques, artificial neural network, and optimization formulation. Section 4 discusses the suitable configuration and results of optimization. Section 5 gives the conclusion.

2. Process Simulation and Economic Evaluation

In this section, three different configurations of the methanol production process—configuration I: once-through reactor methanol production; configuration II: methanol production with recycling; and configuration III: two reactors in series—were compared in terms of their methanol production costs.

2.1. Process Simulation

Methanol Production via a carbon dioxide hydrogenation process was simulated using ASPEN HYSYS V10.1 process simulator with a Peng–Robinson fluid package. Feeds of 1000 kmoles per hour of carbon dioxide at 40 °C, and 3000 kmoles per hour of hydrogen at 25 °C, were fed to a mixer at a pressure of 20 bar. After that, the feed stream was compressed to a design reaction pressure and heated to a design reaction temperature. The methanol production process contains two sections. The first section is methanol production in which the methanol product was produced from reactants in an equilibrium reactor. The second section is methanol purification. In the methanol purification process, liquid methanol product was sent to the first distillation column to separate light components (carbon dioxide, carbon monoxide, and hydrogen) from a mixture of methanol and water. The bottom stream of the first distillation, which contains only methanol and water, was sent to the second distillation column to separate water from the methanol product. The purity of the methanol product is 99.5% by mole.
For the study of three different process configurations, the compositions, conditions, and flow rate of hydrogen and carbon dioxide feeds were the same for all configurations. In what follows, the configuration details of each process are described.

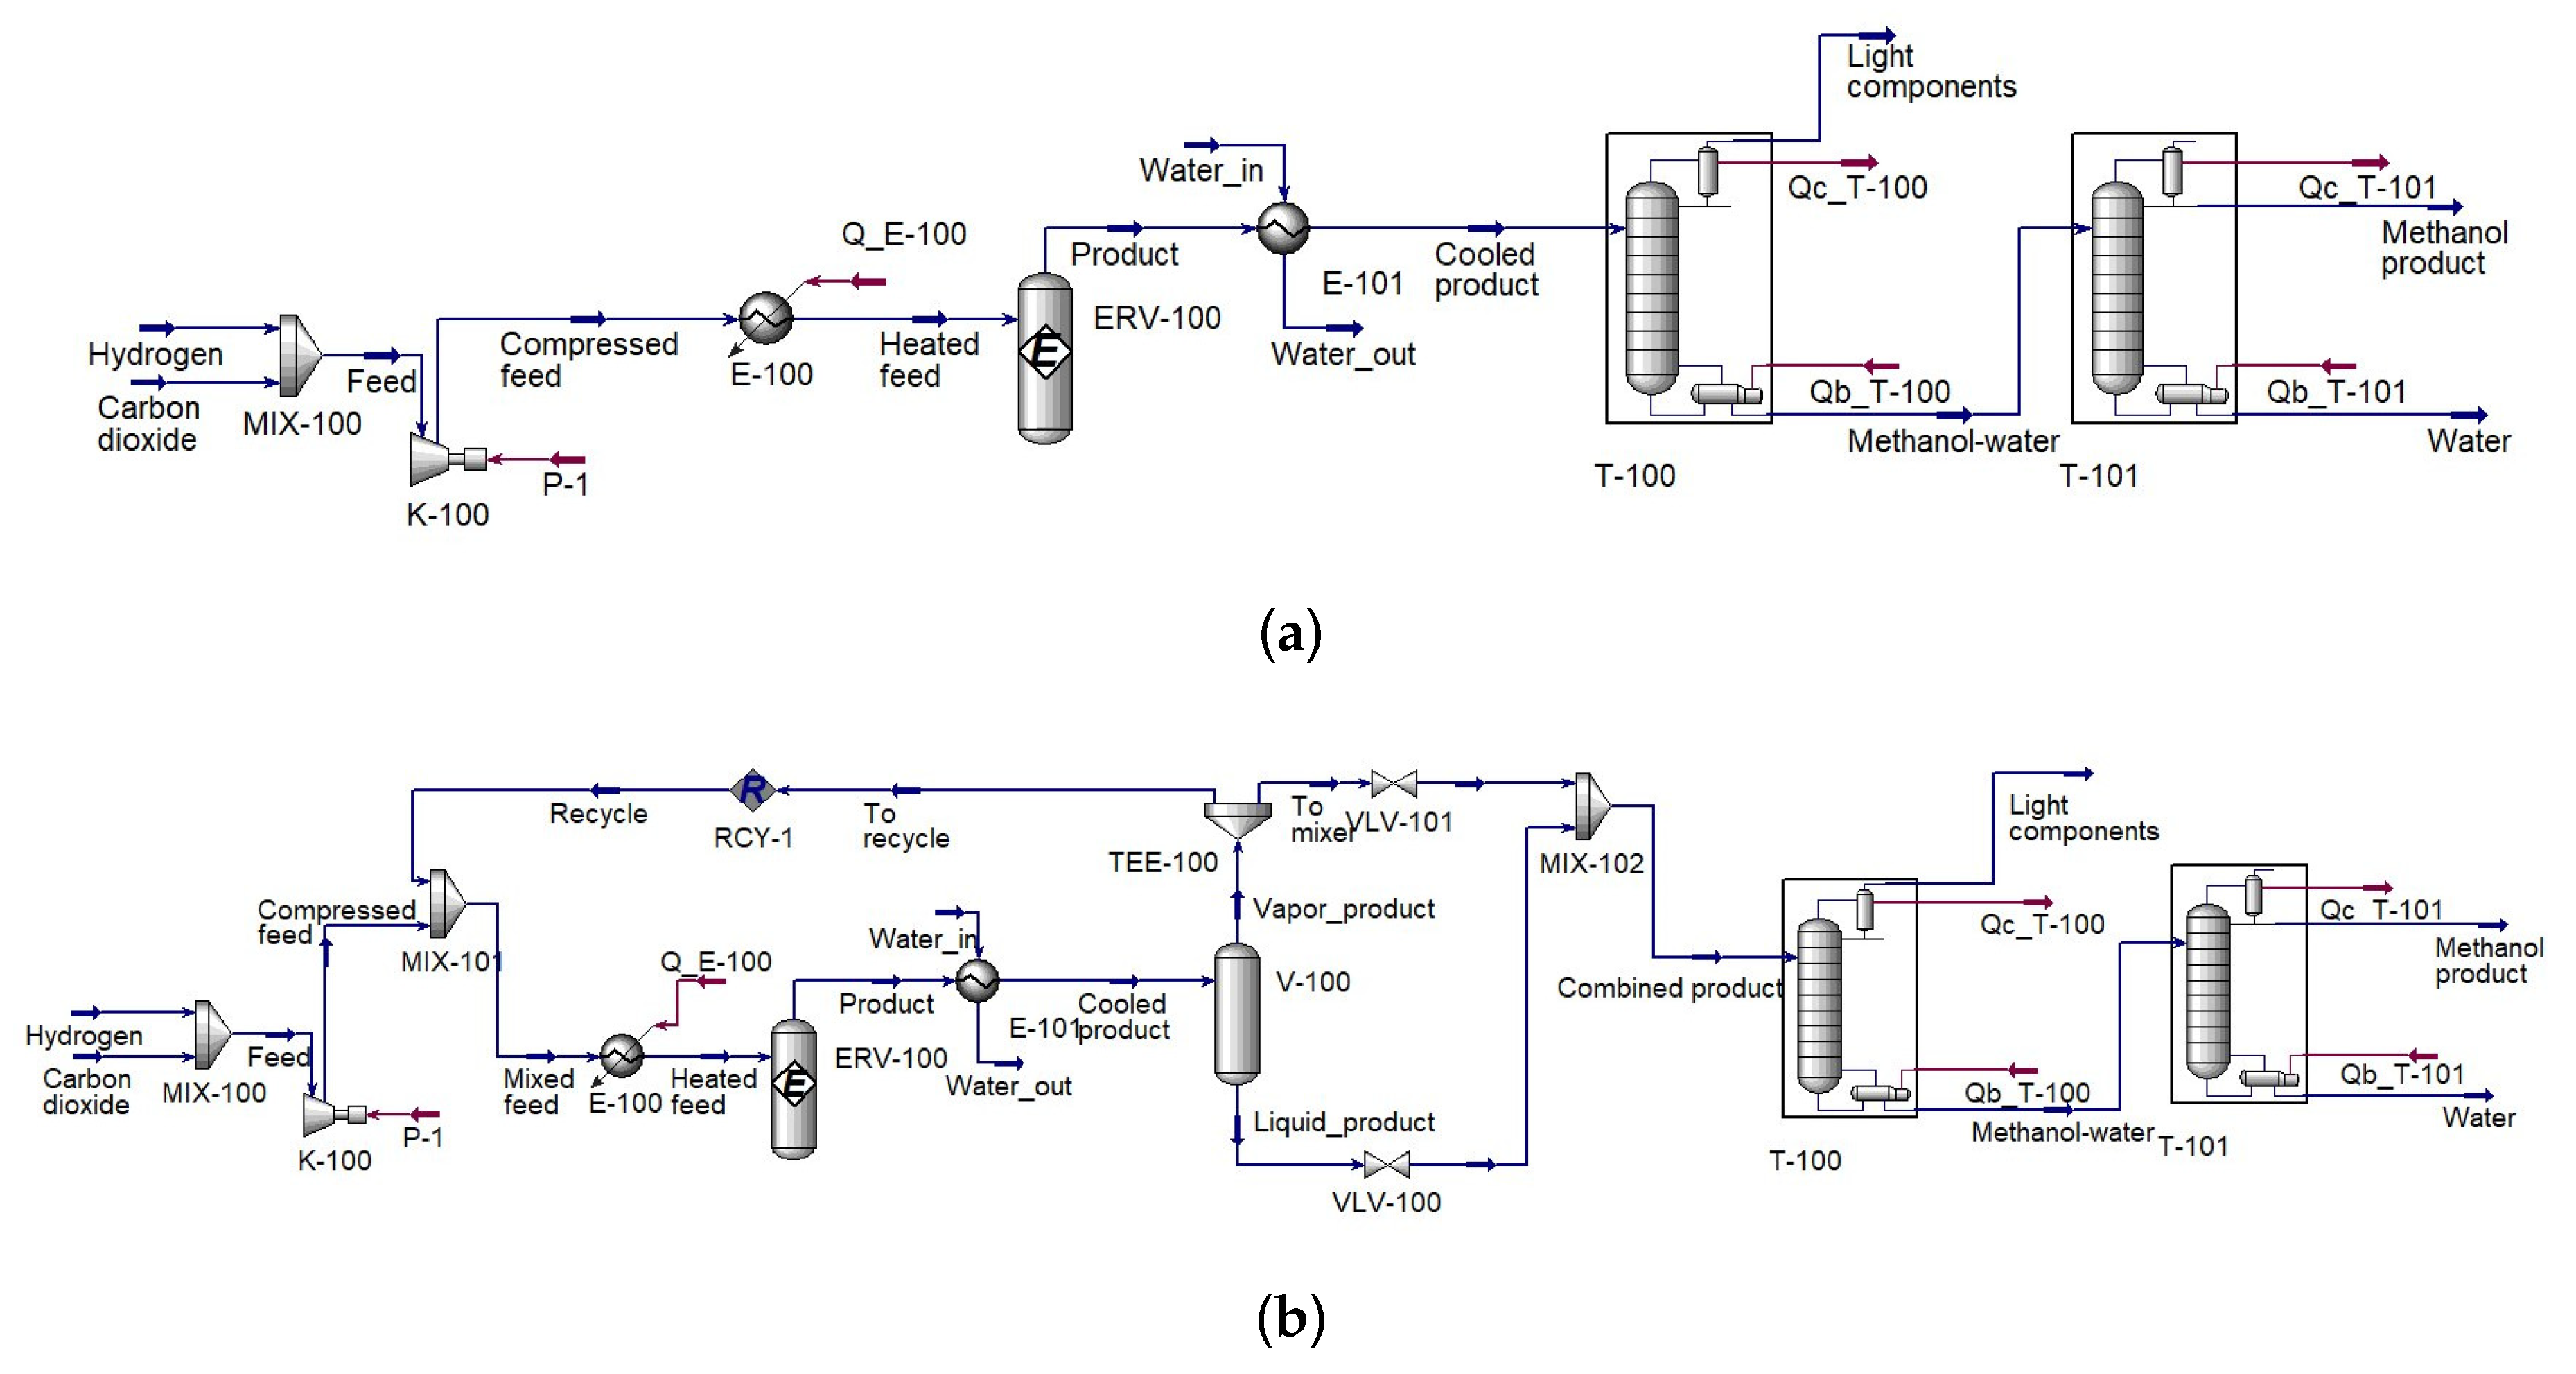
2.1.1. Configuration I: Once-Through Reactor Methanol Production

Feed of reactants (hydrogen and carbon dioxide) were sent to an equilibrium reactor at design conditions to produce methanol with reactions as shown in Equations (1)–(3) [11]. After the product stream left the equilibrium reactor, the steam temperature was decreased. The product stream was sent to the purification process. The process simulation of this configuration is shown in Figure 1a.
CO 2   +   H 2     CO   +   H 2 O   Δ H 300 K   = 41.2   kJ   per   mole   CO 2
CO   +   2 H 2     CH 3 OH   Δ H 300 K   =   90.4   kJ   per   mole   CO 2
CO 2   +   3 H 2     CH 3 OH   +   H 2 O   Δ H 300 K   =   49.2   kJ   per   mole   CO 2

2.1.2. Configuration II: Methanol Production with a Recycle

In this configuration, after the product stream left an equilibrium reactor, the methanol product was separated as liquid by decreasing the temperature. The vapor phase of the separator was fed back (recycled) to a mixer to combine with the feed stream of reactants. The recycle ratio was adjusted to separate the vapor phase of the product into two streams (recycle stream and vapor product stream, which combined with liquid product stream). After that, the product streams were combined and sent to a purification process. The process simulation of this case is shown in Figure 1b.

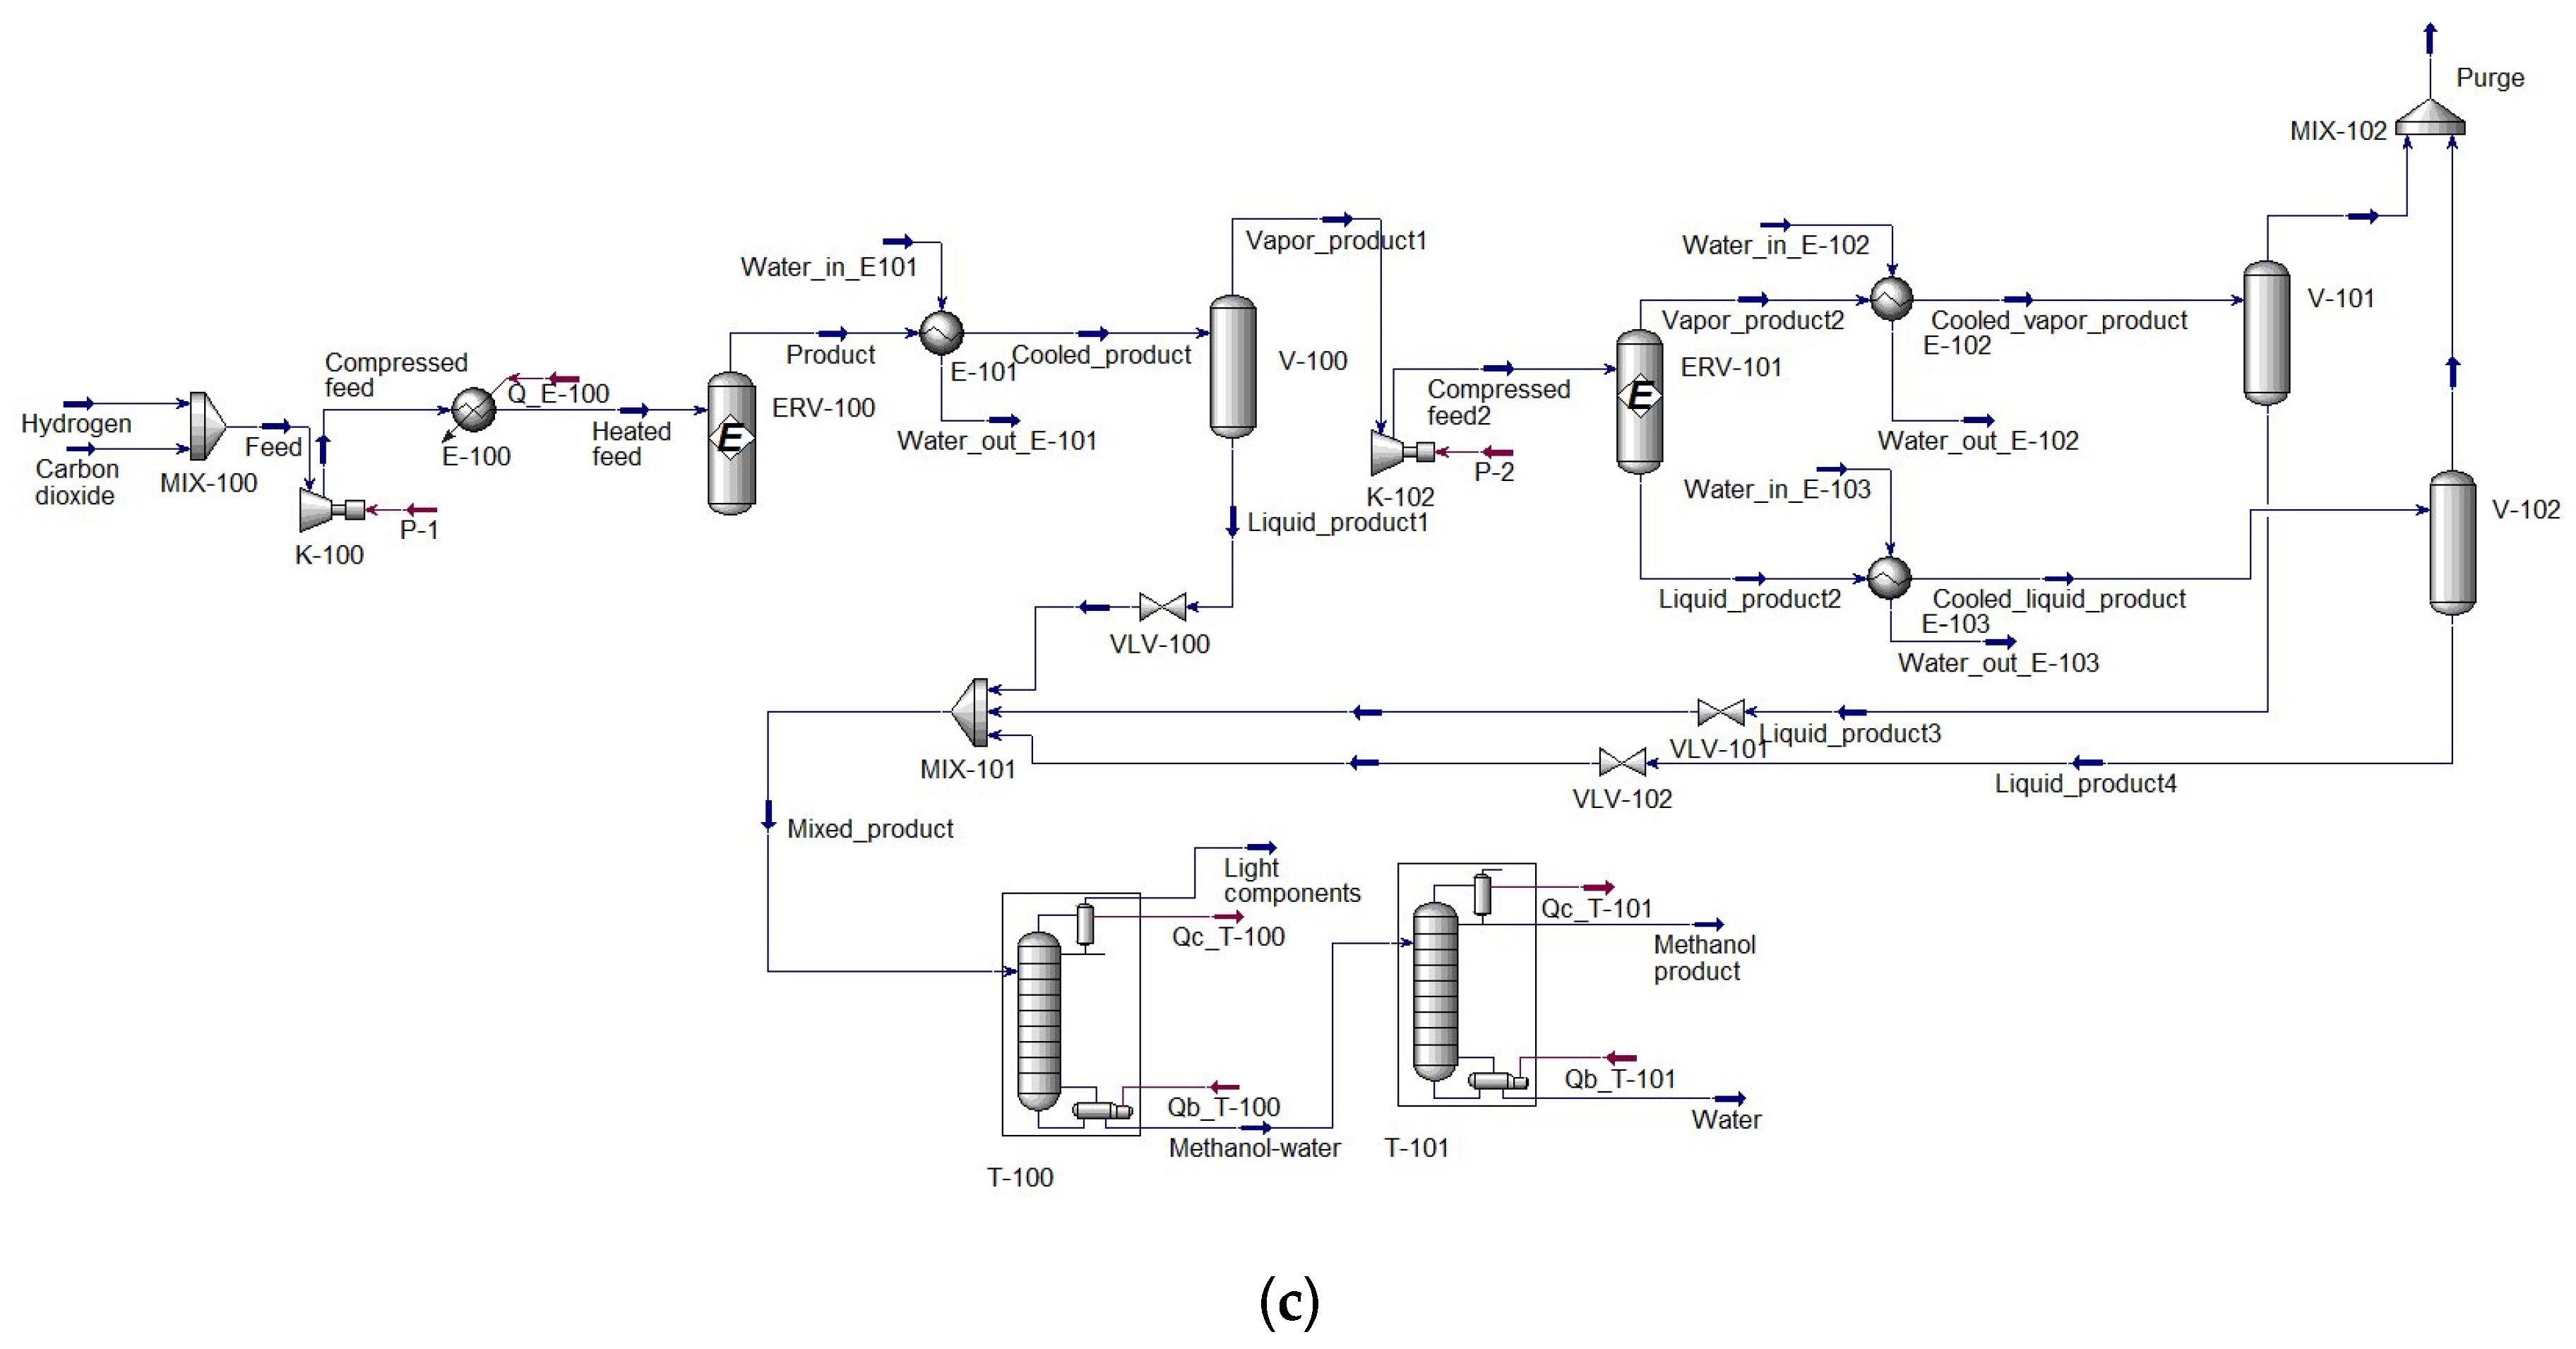
2.1.3. Configuration III: Methanol Production with Two Reactors in Series

In this configuration, in the first equilibrium reactor, reactants were partially converted to methanol product. The temperature of the product stream was decreased to separate the methanol product as a liquid. The remaining reactants (vapor phase) were fed to the second equilibrium reactor by increasing the pressure. The second equilibrium reactor was used to produce more methanol product. All of the liquid methanol products were combined and sent to the purification process. The process simulation of this case is shown in Figure 1c.
In the simulation, reactors with equilibrium model used reaction sets following Equations (1)–(3). Compressors efficiencies were assumed to be adiabatic at 75%. Reflux ratio of column T-100 was specified at 0.6, and condenser temperature was specified at 25 °C. For specifications of column T-10, the reflux ratio was specified at 30, and methanol purity was specified at 99.5% by mole. Details of the parameters of the process simulation for each process configuration can be found in the Supplementary Materials.

2.2. Economic Evaluation
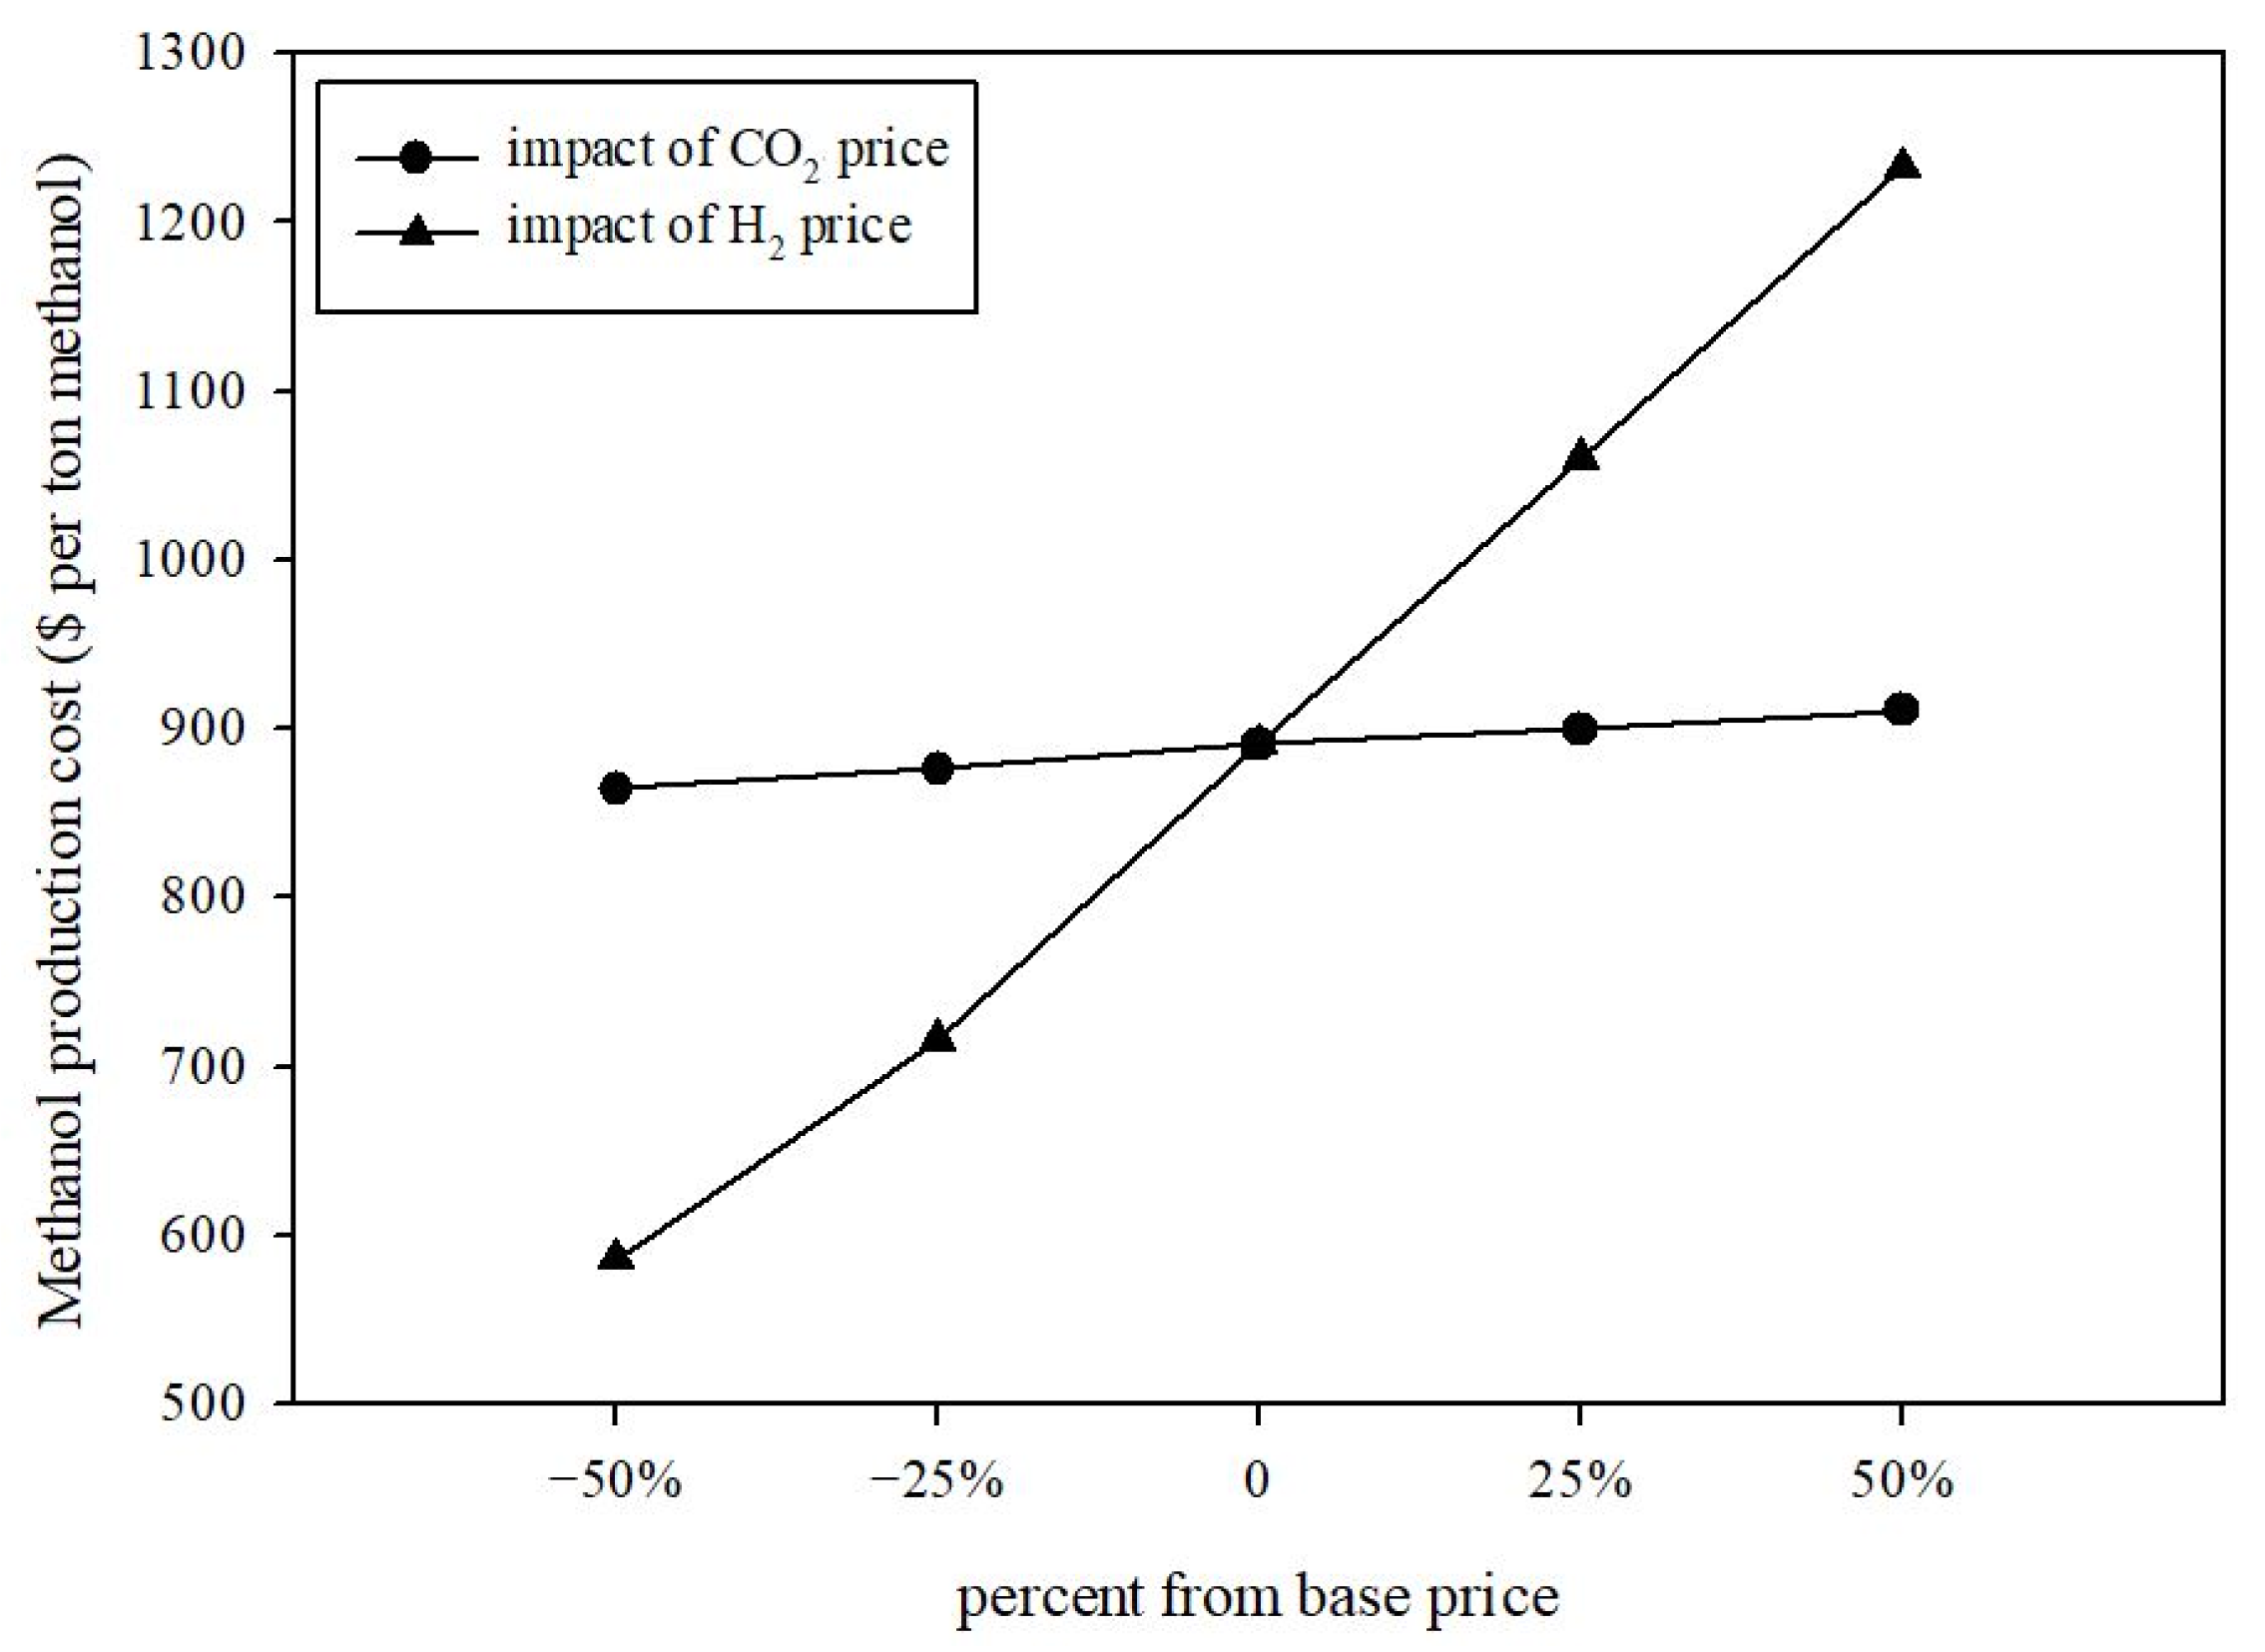
The analysis of economics for the methanol production cost includes capital and operating costs. The capital cost was estimated by using data from the capital equipment-costing program [27]. Cost of piping was not included in the analysis of economics. The value of the Chemical Engineering Plant Cost Index (CEPCI) in 2017 was used to adjust for inflation from 2001 to 2017. The CEPCI value in 2017 was 541.7 [28]. Assumptions used in the economic analysis were followed [21]. The price of a pure carbon dioxide feed was $30 per ton, and the price of hydrogen from electrolysis was $3230 per ton, as obtained from CarbonBrief [29].

Price Sensitivity

The methanol production cost not only depends on its operating conditions but also on the prices of raw materials. Therefore, this section studies impacts of raw material prices on methanol production cost. Configuration III: methanol production with two reactors in series was used as a case study. This is due to this configuration requiring the lowest methanol production cost compared to the other cases. Sensitivity analysis of prices of carbon dioxide and hydrogen were studied by varying the price of each one of the reactants within the range of ±25 and ±50 percent from its base price, and fixing another price parameter at its base value. In this study, the base price of carbon dioxide was $30 per ton, and the base price of hydrogen was $3230 per ton.

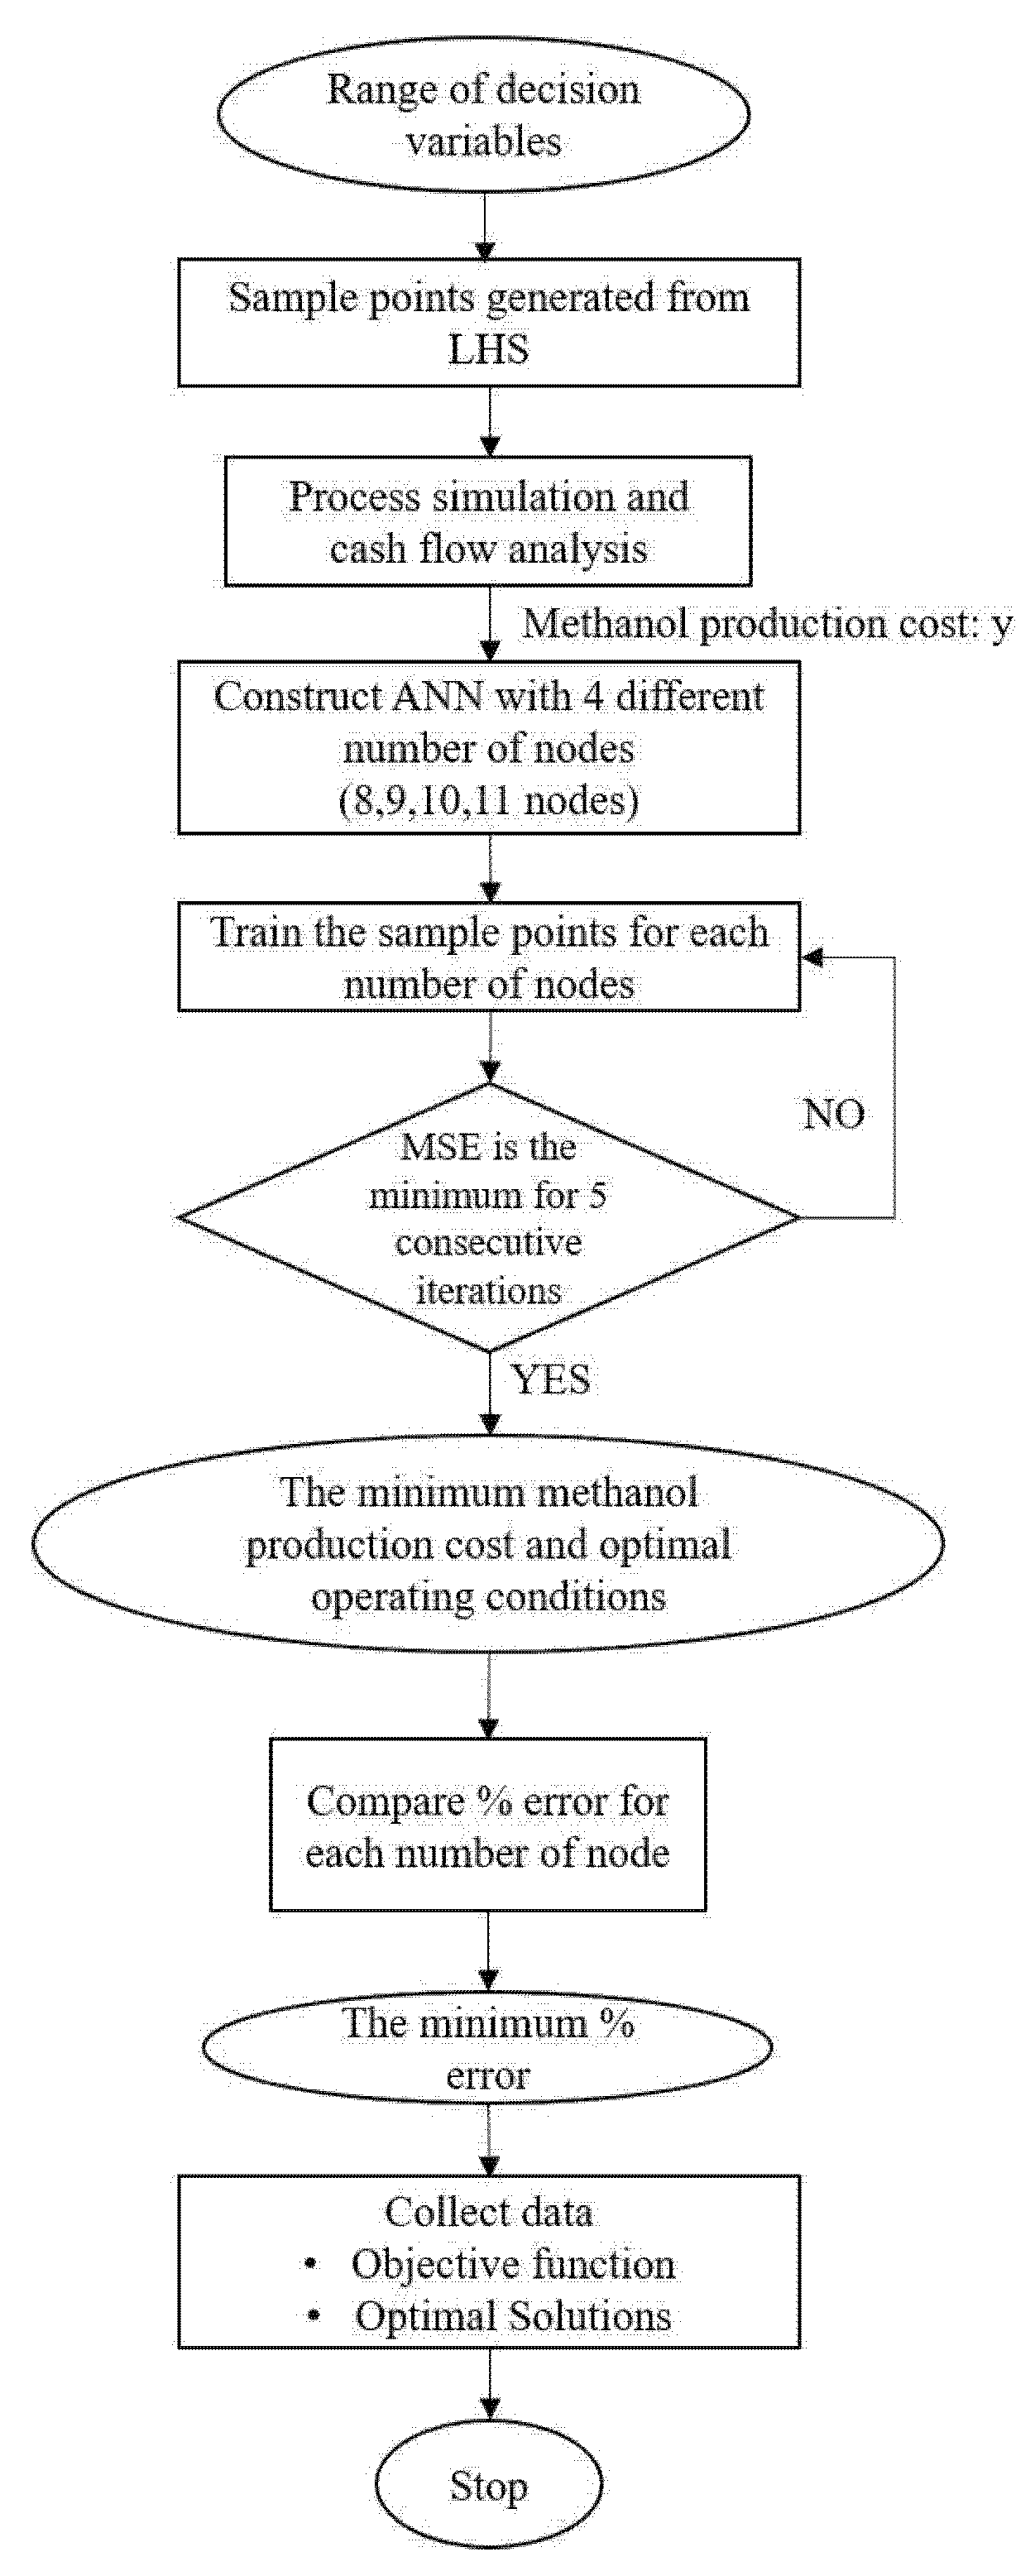
3. Simulation-Optimization Methodology

The simulation-optimization methodology of this work is shown in Figure 2. There are three decision variables for configuration I: once-through reactor methanol production; four decision variables for configuration II: methanol production with a recycle; and five decision variables for configuration III: the methanol production with two reactors in series. The list of decision variables and range of each variable for each process configuration are shown in Table 1a–c.
Figure 2 shows the optimization algorithm which uses ANN as the objective function. In the algorithm, a suitable ANN configuration was first determined, and then the function was optimized. The algorithm started with the range of each decision variable. Based on previous researches [18,19,20,21], the range of each decision variable was selected as shown in Table 1. Then, a data set of decision variables was selected using Latin hypercube sampling (Section 3.1) with an amount of ten times n sample points, where n is the number of decision variables. The corresponding methanol production costs were obtained using process simulation and cash flow analysis.
Artificial neural networks (Section 3.2) with four different nodes (8, 9, 10, and 11 nodes) were constructed. For each number of nodes, the sample points were trained. The mean square error (MSE) of a test set was used as a criterion to determine the suitable ANN configuration (number of nodes). The ANN network was trained until MSE values kept decreasing for five consecutive iterations. Then, ANN parameters (weight and bias) were collected and used as an objective function in the optimization problem. The objective of the optimization problem was to minimize the methanol production cost (Section 3.3).

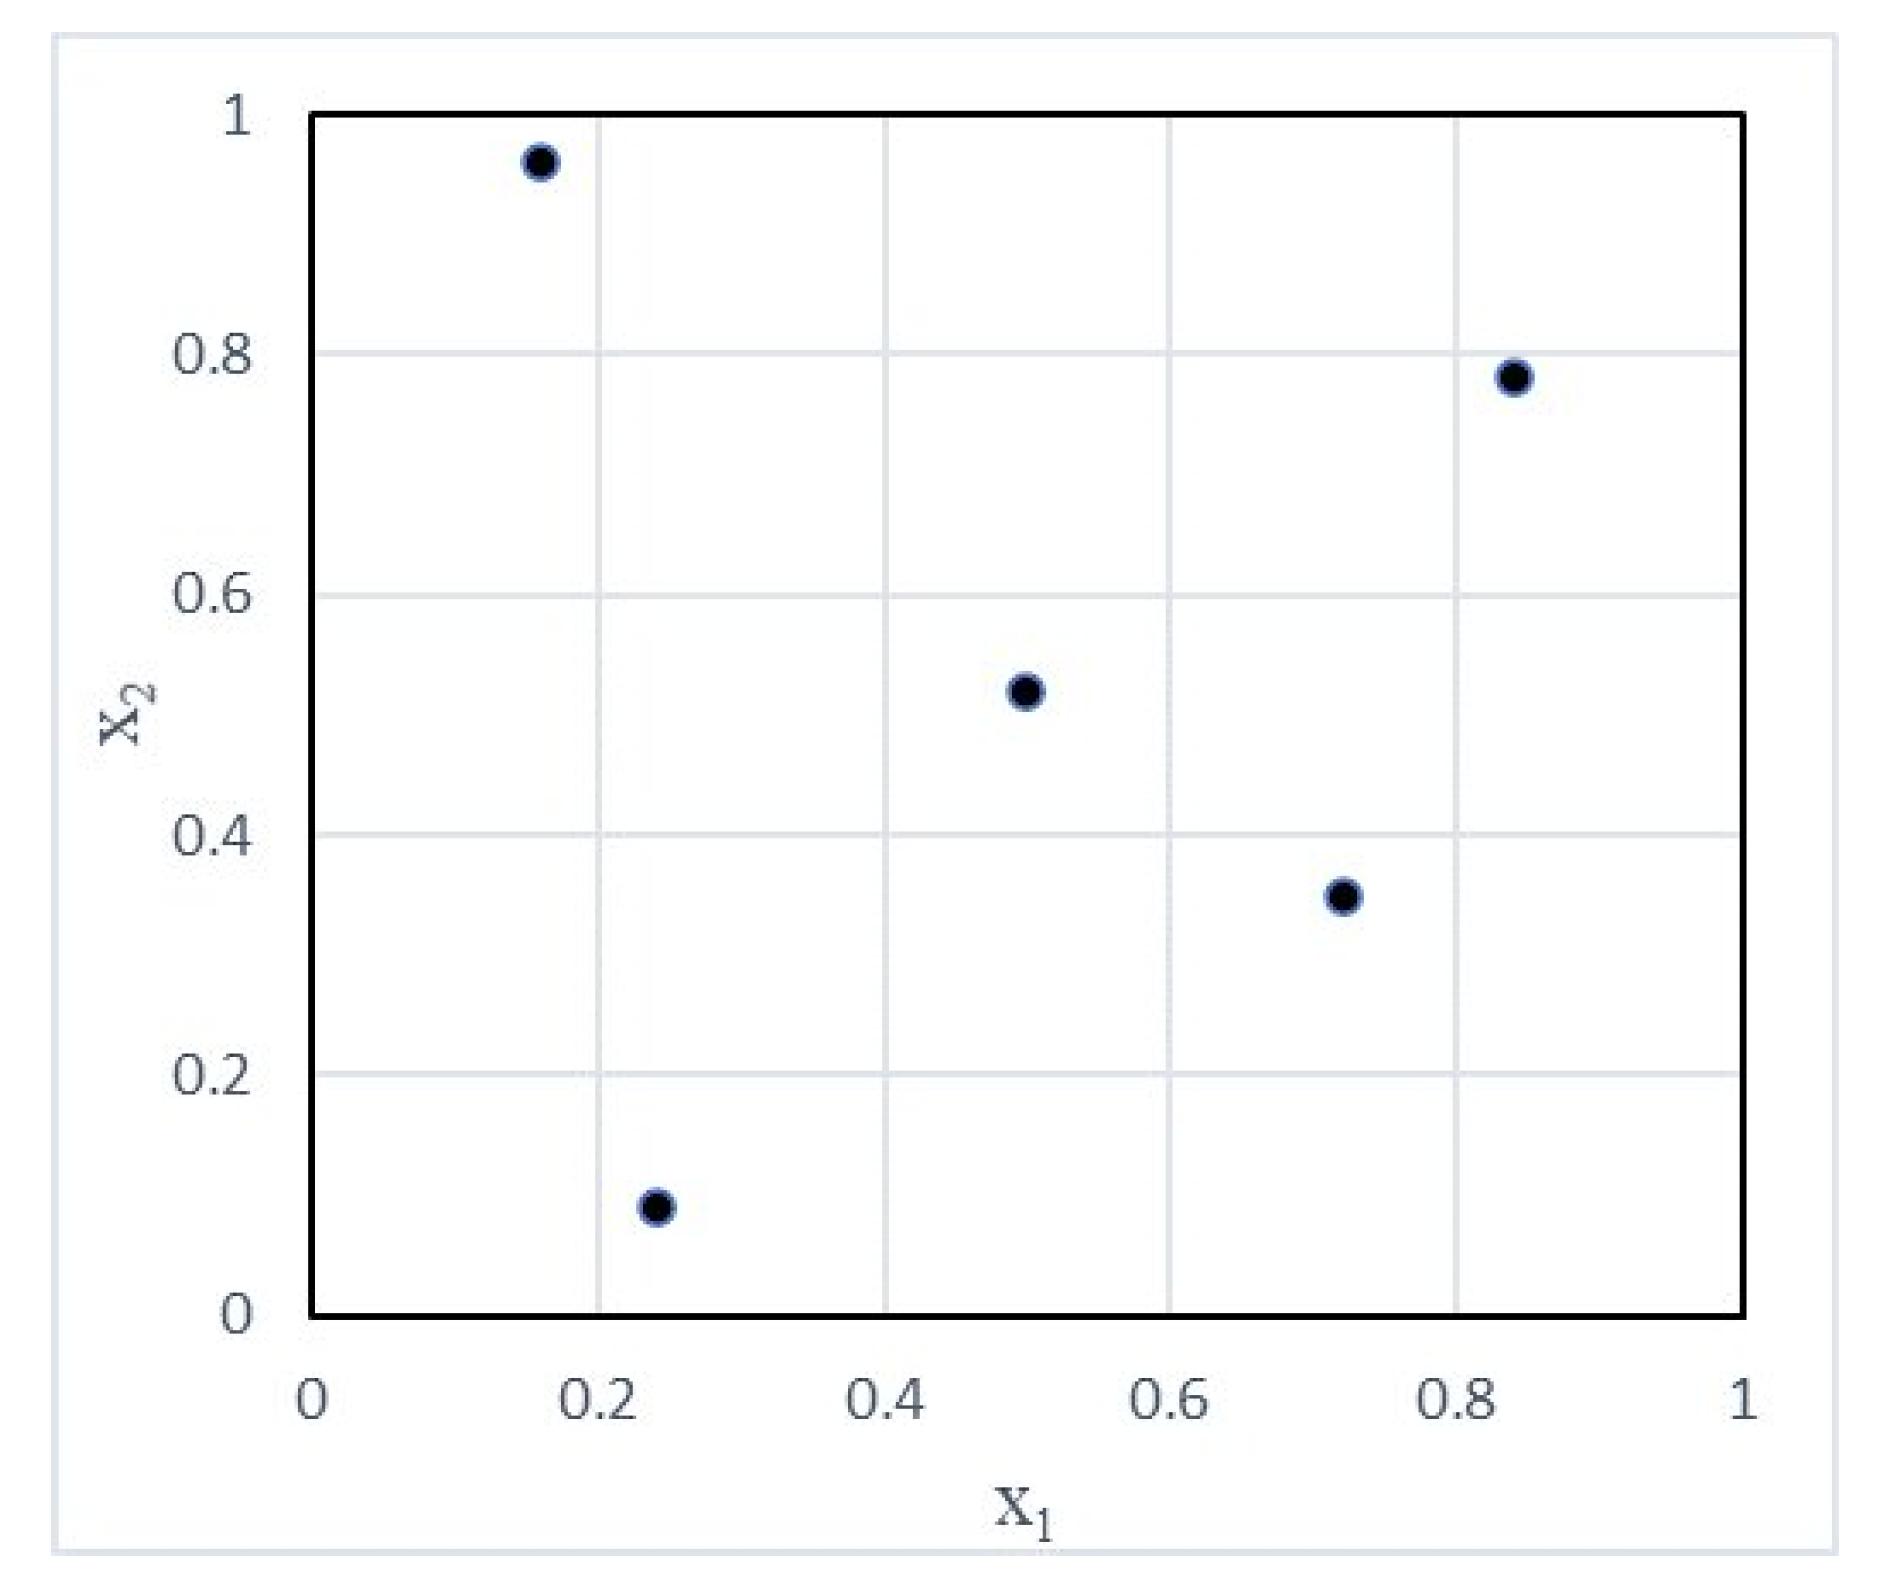
3.1. Latin Hypercube Sampling (LHS)

Latin hypercube sampling was used in this work for data collection to build the ANNs. For this sampling technique, the number of sample points (N) has to be specified in advance. Sample points from LHS are generated by dividing equally the range of each independent variable into N ranges. Sample points are then randomly chosen from each range of each variable. An example of five sample points generated from LHS with two decision variables is represented in Figure 3.

3.2. Artificial Neural Networks

An artificial neural network (ANN) is a mathematical expression consisting of interconnected processing units known as neurons [30]. The parameters of the network contain weight and bias and at each neuron operate using a transfer function. In this work, the feed-forward neural network with three layers (input layer, hidden layer, and output layer) was used to train the data sets. The hidden layer consists of nodes which connect the flow information between input layer and output layer. The number of nodes is based on a complex relationship between input and output signals. Four different numbers of nodes in the hidden layer were studied in this work. Figure 4 represents the schematic of the feed-forward neural network with a single hidden layer used in this work. The training algorithm is Levenberg–Marquardt, which automatically stops when the generalization stops improving. The data was separated as 70% of the training set, 15% of the validation set, and 15% of the testing set.

3.3. Optimization Formulation

The objective functions in this work were obtained by training the data set with an artificial neural network. The objective function represents the methanol production costs. In this work, the artificial neural network was used an objective function, as shown in Equations (4) and (5). This ANN’s three layers design, which consists of input, hidden and output layers, was trained using the function nnstart in MATLAB. The sigmoid function and linear function were used to represent the data in the hidden layer and output layer, respectively, with the Levenberg–Marquardt algorithm.
The optimization formation of an artificial neural network follows:
MIN :   y =   ( r W 2 r × L 1 r ) + B 2
Subject   to :   L 1 r = 2 1 + e 2 ( r ( W 1 r n × x r ) + B 1 r ) 1
with x r ϵ   [ 1 , 1 ] ; decision variables corresponding to each configuration. where n is the number of decision variables, r is the number of neurons in the hidden layer, W1 and W2 are input weights of the hidden layer and output layer, respectively, and B1 and B2 are biases of the input and output layer, respectively.

4. Results and Discussion

4.1. Price Sensitivity

Figure 5 shows the impacts of hydrogen and carbon dioxide prices on methanol production costs. Each methanol production cost shown in Figure 5 was the minimum cost obtained from process optimization. In the case of an impact of hydrogen price, the results showed that hydrogen price has significant impacted on methanol production costs. An increase of hydrogen price from its base value by 50 percent resulted in an increase of the minimum methanol production cost of 38 percent. If the hydrogen price decreases 50 percent from its base price, the minimum methanol production cost (per ton produced methanol) can be decreased from $890.75 to $585.58.
In the case of the impact of the carbon dioxide price, the minimum methanol production cost slightly increases as the price increases. Hence, the carbon dioxide price has slightly impacted on the minimum methanol production cost. This is because the amount of the hydrogen feed was consumed three times higher than the carbon dioxide feed. The optimization of the operating conditions can offset an increase of carbon dioxide price, but the optimization problem cannot offset the increase of hydrogen price. In order to make methanol production via carbon dioxide hydrogenation a sustainable process, the price of hydrogen has to be considered.

4.2. Comparison of Different Process Configurations

Table 2 shows the optimization results for each number of nodes of each process configuration. The ANNs were trained with four different numbers of nodes (8, 9, 10, 11). From Table 2a: for configuration I (once–through reactor methanol production), the obtained minimum methanol production cost was $2353.56 per ton produced methanol. The ANN structure with eight nodes yielded the lowest percent error, 0.563. From Table 2b: for configuration II (methanol production with a recycle), the obtained minimum methanol production cost was $928.04 per ton produced methanol. This lowest cost and percent error were obtained from the model of an ANN structure with eight nodes (percent error, 0.077). From Table 2c: for configuration III (methanol production with two reactors in series), the obtained minimum methanol production cost was $888.85 per ton produced methanol. The ANN structure was the same as for the two other process configurations, the structure with eight nodes (percent error, 0.104). When comparing these three configurations, the results showed that the configuration III (methanol production with two reactors in series) process required the lowest methanol production cost. The ANN with eight nodes was the most suitable configuration to represent the relation between operating conditions and methanol production cost for this case study (with all percent errors less than one). The ANN parameters (weight and bias) of each process configuration are included in Supplementary Materials.

4.3. The Optimal Solutions

In this section, Table 3 shows the optimal operating conditions and the minimum methanol production cost of each process configuration. Table 4 shows energy consumption and energy cost for each equipment for the three process configurations.
For configuration I (once-through reactor methanol production), the minimum methanol production cost was $2353.56 per ton produced methanol. The corresponding optimal operating conditions were as follows: pressure at the equilibrium reactor of 71.95 bar, temperature at the equilibrium reactor of 192 °C, and the temperature of the cooler of 71.14 °C. The minimum methanol production cost of this configuration was considered high because there was only one reactor, and carbon dioxide conversion was around 50 percent. The total energy consumption of this configuration was 5847.6 kW. However, the methanol production cost per ton was high due to a low amount of methanol product (12,358 kg/h).
For process configuration II (methanol production cost with a recycle), the minimum methanol production cost was $928.04 per ton produced methanol. The optimal operating conditions were as follows: pressure of an equilibrium reactor of 70 bar, temperature of an equilibrium reactor of 192.10 °C, temperature of the stream entering a separator of 61.24 °C, and recycle ratio of one (full recycle). The results of this process configuration agreed with the work of Leonzio et al. [19] that a higher recycle ratio resulted in higher methanol yield. However, the power consumption of a heater was increased with an increase in the recycle ratio, which results in high methanol production cost for this process configuration. The power consumption of the heater in this process configuration was ten times higher than the process configuration without recycle. The total energy consumption of this configuration was 12,241.8 kW.
For process configuration III: methanol production with two reactors in series, the minimum methanol production cost per ton produced methanol was $888.85, which is the lowest cost among the three configurations. The optimal operating conditions were as follows: pressure of the first equilibrium reactor of 70 bar, temperature of the first equilibrium reactor of 199.04 °C, temperature of the stream entering a separator of 80 °C, pressure of the second equilibrium reactor of 100 bar, and outlet temperature of the liquid stream cooler after the second equilibrium reactor of 80 °C. This configuration resulted in the lowest methanol production cost due to a higher methanol yield than the other two configurations. The amount of methanol product in the process configuration was 31,036 kg/h. Moreover, the total energy consumption of this configuration was comparable to configuration I, being 7036.2 kW.

5. Conclusions

This article compared three different process configurations of methanol production via carbon dioxide hydrogenation. Latin hypercube sampling was used as a sampling technique to generate a data set of decision variables. An artificial neural network with four different numbers of nodes was constructed to represent the relationship between operating conditions and methanol production cost. Three configurations featured once-through reactor methanol production, methanol production with a recycle, and methanol production with two reactors in series. Each process configuration was optimized for the minimum methanol production cost. The minimum methanol production costs were compared among these process configurations. The results showed that methanol production with two reactors in series required the lowest methanol production cost. The optimal operating conditions were as follows: pressure of the first equilibrium reactor of 70 bar, temperature of the first equilibrium reactor of 199.04 °C, temperature of the stream entering a separator of 80 °C, pressure of the second equilibrium reactor of 100 bar, and outlet temperature of the liquid stream cooler after the second equilibrium reactor of 80 °C.

Supplementary Materials

The following are available online at https://www.mdpi.com/1996-1073/13/24/6608/s1, A1: The detailed simulation of the once-through reactor methanol production, A2: The detailed simulation of the methanol production with a recycle, A3: The detailed simulation of the methanol production with two reactors in series, B1: An artificial neural network with eight nodes for the once-through methanol production, B2: An artificial neural network with eight nodes for the methanol production with a recycle, B3: An artificial neural network with eight nodes for the methanol production with two reactors in series.

Author Contributions

Methodology, P.B.; analysis, P.B. and A.N.; writing—original draft preparation, P.B.; writing—review and editing, A.N. All authors have read and agreed to the published version of the manuscript.

Funding

This research was funded by the National Research Council of Thailand (NRCT) through the Royal Golden Jubilee Ph.D. Program (Grant no. Grant No. PHD/0214/2561) and Suranaree University of Technology funding on Aspen Hysys simulator.

Conflicts of Interest

The authors declare that they have no know competing financial interests or personal relationships that could have appeared to influence the work reported in this paper.

References

  1. Mukherjee, A.; Okolie, J.A.; Abdelrasoul, A.; Niu, C.H.; Dalai, A.K. Review of post-combustion carbon dioxide capture technologies using activated carbon. J. Environ. Sci. 2019, 83, 46–63. [Google Scholar] [CrossRef] [PubMed]
  2. Arena, F.; Mezzatesta, G.; Spadaro, L.; Trunfio, G. Latest Advances in the Catalytic Hydrogenation of Carbon Dioxide to Methanol/Dimethylether; Springer Science and Business Media LLC: Berlin/Heidelberg, Germany, 2014; pp. 103–130. [Google Scholar]
  3. Naims, H. Economics of carbon dioxide capture and utilization—A supply and demand perspective. Environ. Sci. Pollut. Res. 2016, 23, 22226–22241. [Google Scholar] [CrossRef] [PubMed] [Green Version]
  4. Bowker, M. Methanol Synthesis from CO2 Hydrogenation. Chem. Cat Chem. 2019, 11, 4238–4246. [Google Scholar] [PubMed] [Green Version]
  5. Zander, S.; Kunkes, E.L.; Schuster, M.E.; Schumann, J.; Weinberg, G.; Teschner, D.; Jacobsen, N.; Schlögl, R.; Behrens, M. The Role of the Oxide Component in the Development of Copper Composite Catalysts for Methanol Synthesis. Angew. Chem. Int. Ed. 2013, 52, 6536–6540. [Google Scholar] [CrossRef] [PubMed]
  6. Bill, A. Carbon Dioxide Hydrogenation to Methanol at Low Pressure and Temperature. Ph.D. Thesis, EPFL, Lausanne, Switzerland, 1998. Available online: https://www.semanticscholar.org/paper/Carbon-dioxide-hydrogenation-to-methanol-at-low-and-Bill/c1a6edf6b9b6f79aadd29b095b9a3ab0d44f45ab#citing-papers (accessed on 20 October 2020).
  7. Nexant. Market Analytics: Methanol and Derivatives—2018. 2018. Available online: https://www.google.com/url?sa=t&rct=j&q=&esrc=s&source=web&cd=&ved=2ahUKEwjluLX_la_tAhVC73MBHaAACc8QFjAAegQIARAC&url=https%3A%2F%2Fwww.nexantsubscriptions.com%2Ffile%2F125740%2Fdownload%3Ftoken%3DZov46cz-&usg=AOvVaw0dmSgIX1sVUAq5zSR7rFAh (accessed on 20 October 2020).
  8. Liang, X.-L.; Dong, X.; Lin, G.-D.; Zhang, H.-B. Carbon nanotube-supported—ZnO catalyst for hydrogenation of CO2 to methanol. Appl. Catal. B Environ. 2009, 88, 315–322. [Google Scholar] [CrossRef]
  9. Liu, C.; Guo, X.; Guo, Q.; Mao, D.; Yu, J.; Lu, G. Methanol synthesis from CO2 hydrogenation over copper catalysts supported on MgO-modified TiO2. J. Mol. Catal. A Chem. 2016, 425, 86–93. [Google Scholar] [CrossRef]
  10. Jadhav, S.G.; Vaidya, P.D.; Bhanage, B.M.; Joshi, J.B. Catalytic carbon dioxide hydrogenation to methanol: A review of recent studies. Chem. Eng. Res. Des. 2014, 92, 2557–2567. [Google Scholar] [CrossRef]
  11. Tidona, B.; Koppold, C.; Bansode, A.; Urakawa, A.; Von Rohr, P.R. CO2 hydrogenation to methanol at pressures up to 950bar. J. Supercrit. Fluids 2013, 78, 70–77. [Google Scholar] [CrossRef]
  12. Machado, F.R.C.; Medeiros, J.L.D.; Araújo, O.F.Q. Comparative analysis of methanol production routes: Synthesis gas versus CO2 hydrogenation. In Proceedings of the International Conference on Industrial Engineering and Operations Management, Bali, Indonesia, 7–9 January 2014; Available online: http://iieom.org/ieom2014/pdfs/294.pdf (accessed on 20 October 2020).
  13. Atsonios, K.; Panopoulos, K.D.; Kakaras, E. Thermocatalytic CO 2 hydrogenation for methanol and ethanol production: Process improvements. Int. J. Hydrogen Energy 2016, 41, 792–806. [Google Scholar] [CrossRef]
  14. Pellegrini, L.A.; Soave, G.; Gamba, S.; Langè, S. Economic analysis of a combined—Methanol production plant. Appl. Energy 2011, 88, 4891–4897. [Google Scholar] [CrossRef]
  15. Roh, K.; Nguyen, T.B.; Suriyapraphadilok, U.; Lee, J.H.; Gani, R. Development of sustainable CO2 conversion processes for the methanol production. In Computer Aided Chemical Engineering; Gernaey, K.V., Huusom, J.K., Gani, R., Eds.; Elsevier: Amsterdam, The Netherlands, 2015; pp. 1145–1150. [Google Scholar]
  16. Leonzio, G. Optimization through Response Surface Methodology of a Reactor Producing Methanol by the Hydrogenation of Carbon Dioxide. Processes 2017, 5, 62. [Google Scholar] [CrossRef] [Green Version]
  17. Matr, D.L. Process Modelling and Simulation of a Methanol Synthesis Plant Using Syngas Streams Obtained from Biomass; Politecnico di Milano: Milan, Italy, 2018. [Google Scholar]
  18. Ullmann’s Encyclopedia of Industrial Chemistry, VCH. Available online: https://onlinelibrary.wiley.com/doi/book/10.1002/14356007 (accessed on 20 October 2020).
  19. Leonzio, G.; Zondervan, E.; Foscolo, P.U. Methanol production by CO2 hydrogenation: Analysis and simulation of reactor performance. Int. J. Hydrogen Energy 2019, 44, 7915–7933. [Google Scholar] [CrossRef]
  20. Pérez-Fortes, M.; Schöneberger, J.C.; Boulamanti, A.; Tzimas, E. Methanol synthesis using captured CO2 as raw material: Techno-economic and environmental assessment. Appl. Energy 2016, 161, 718–732. [Google Scholar] [CrossRef]
  21. Borisut, P.; Nuchitprasittichai, A. Methanol Production via CO2 Hydrogenation: Sensitivity Analysis and Simulation—Based Optimization. Front. Energy Res. 2019, 7. [Google Scholar] [CrossRef] [Green Version]
  22. Jin, Y.; Li, J.; Du, W.; Qian, F. Adaptive Sampling for Surrogate Modelling with Artificial Neural Network and its Application in an Industrial Cracking Furnace. Can. J. Chem. Eng. 2016, 94, 262–272. [Google Scholar] [CrossRef]
  23. Eason, J.; Cremaschi, S. Adaptive sequential sampling for surrogate model generation with artificial neural networks. Comput. Chem. Eng. 2014, 68, 220–232. [Google Scholar] [CrossRef]
  24. Sudakov, O.; Koroteev, D.; Belozerov, B.; Burnaev, E. Artificial Neural Network Surrogate Modeling of Oil Reservoir: A Case Study. In Public-Key Cryptography—PKC 2018; Springer: Berlin/Heidelberg, Germany, 2019; pp. 232–241. [Google Scholar]
  25. Ye, J. Artificial neural network modeling of methanol production from syngas. Pet. Sci. Technol. 2019, 37, 629–632. [Google Scholar] [CrossRef]
  26. Vaferi, B.; Bahmani, M.; Babakhani, S.M.; Khademi, M.A. Modification and optimization of the industrial methanol production process. Indian J. Chem. Technol. 2014, 10, 51–59. [Google Scholar]
  27. Turton, R.; Bailie, R.C.; Whiting, W.B.; Shaeiwitz, J.A. Analysis, Synthesis and Design of Chemical Processes, 2nd ed.; Prentice Hall: Upper Saddle River, NJ, USA, 2003. [Google Scholar]
  28. Jenkins, S. CEPCI Updates: January 2018 (Prelim.) and December 2017 (Final), in January 2017. 2018. Available online: https://www.chemengonline.com/cepci-updates-january-2018-prelim-and-december-2017-final/?printmode=1 (accessed on 20 October 2020).
  29. Timperley, J. Renewable Hydrogen ‘Already Cost Competitive’, Say Researchers. November 2019. Available online: https://www.carbonbrief.org/renewable-hydrogen-already-cost-competative-say-researchers (accessed on 20 October 2020).
  30. Basheer, I.A.; Hajmeer, M. Artificial neural networks: Fundamentals, computing, design, and application. J. Microbiol. Methods 2000, 43, 3–31. [Google Scholar] [CrossRef]
Figure 1. Process simulation of the methanol production via carbon dioxide hydrogenation: (a) configuration I; (b) configuration II; and (c) configuration III.
Energies 13 06608 g001aEnergies 13 06608 g001b
Figure 2. Algorithm for Latin hypercube design for artificial neural network training.
Energies 13 06608 g002
Figure 3. Experimental design: Latin hypercube sampling.
Energies 13 06608 g003
Figure 4. The schematic of the feed-forward neural network with a single hidden layer.
Energies 13 06608 g004
Figure 5. The impact of carbon dioxide and hydrogen prices on methanol production cost.
Energies 13 06608 g005
Table 1. (a) Range of the decision variables of configuration I; (b) range of the decision variables of configuration II; (c) range of the decision variables of configuration III.
(a)
Decision VariablesRange
UpperLower
Pressure of the equilibrium reactor6973
Temperature of the equilibrium reactor189193
Temperature of the stream entering a separator6575
(b)
Decision VariablesRange
UpperLower
Pressure of the equilibrium reactor5070
Temperature of the equilibrium reactor190210
Temperature of the stream entering a separator6080
Recycle ratio01
(c)
Decision VariablesRange
UpperLower
Pressure of the first equilibrium reactor5070
Temperature of the first equilibrium reactor190210
Temperature of the stream entering a separator6080
Pressure of the second equilibrium reactor100140
Outlet temperature of the liquid stream cooler after the second equilibrium reactor6080
Table 2. (a) Results of fitting data with artificial neural networks for configuration I: once-through reactor methanol production; (b) Results of fitting data with artificial neural networks for configuration II: methanol production with a recycle; (c) Results of fitting data with artificial neural networks for configuration III: methanol production with two reactors in series.
(a)
Number of nodes (N)891011
R-squared0.99870.98910.97170.9925
Mean square error (MSE)1.01 × 10−33.63 × 10−35.46 × 10−35.74 × 10−3
Predicted cost ($/ton)2340.312284.502291.882280.82
Actual cost ($/ton)2353.562330.032334.022337.94
Error (%)0.5631.9541.8052.443
(b)
Number of nodes (N)891011
R-squared0.99810.99720.99660.9983
MSE1.42 × 10−33.02 × 10−31.38 × 10−31.15 × 10⁻³
Predicted cost ($/ton)928.76973.41770.24724.95
Actual cost ($/ton)928.04964.83949.68942.38
Error (%)0.0770.88918.89523.072
(c)
Number of nodes (N)891011
R-squared0.96690.99100.99220.9884
MSE7.21 × 10−33.02 × 10−32.01 × 10−32.91 × 10⁻³
Predicted cost ($/ton)887.93886.95889.81889.14
Actual cost ($/ton)888.85888.70968.31968.31
Error (%)0.1040.1978.1068.177
Table 3. Optimal operating conditions and minimum methanol production cost of the three configurations.
Decision VariablesOptimal Conditions
Configuration IConfiguration IIConfiguration III
Pressure of the first equilibrium reactor71.957070
Temperature of the first equilibrium reactor191.99192.10199.04
Temperature of the stream entering a separator-61.2480
Temperature of cooler71.14--
Recycle ratio-1-
Pressure of the second equilibrium reactor--100
Outlet temperature of the liquid stream cooler after the second equilibrium reactor--80
Predicted cost ($/ton)2340.31928.76887.93
Actual cost ($/ton)2353.56928.04888.85
Error (%)0.5630.0770.104
Table 4. Energy consumption and energy cost for each equipment for three configurations.
ConfigurationEnergy Consumption/ Energy Cost
EquipmentEnergy (kW)Cost ($/year)
IK-100 5645.86,022,885.6
E-100 201.8215,234.6
IIK-100 5502.05,869,491.4
E-100 6739.87,189,968.1
IIIK-100 5502.05,869,491.4
E-100 607.6648,201.5
K-102 926.6988,473.4
Publisher’s Note: MDPI stays neutral with regard to jurisdictional claims in published maps and institutional affiliations.

