Macromolecular Structure Controlling Micro Mechanical Properties of Vitrinite and Inertinite in Tectonically Deformed Coals—A Case Study in Fengfeng Coal Mine of Taihangshan Fault Zone (North China)


Abstract
:
1. Introduction
2. Geological Background
3. Samples and Methods
3.1. Sample Preparation
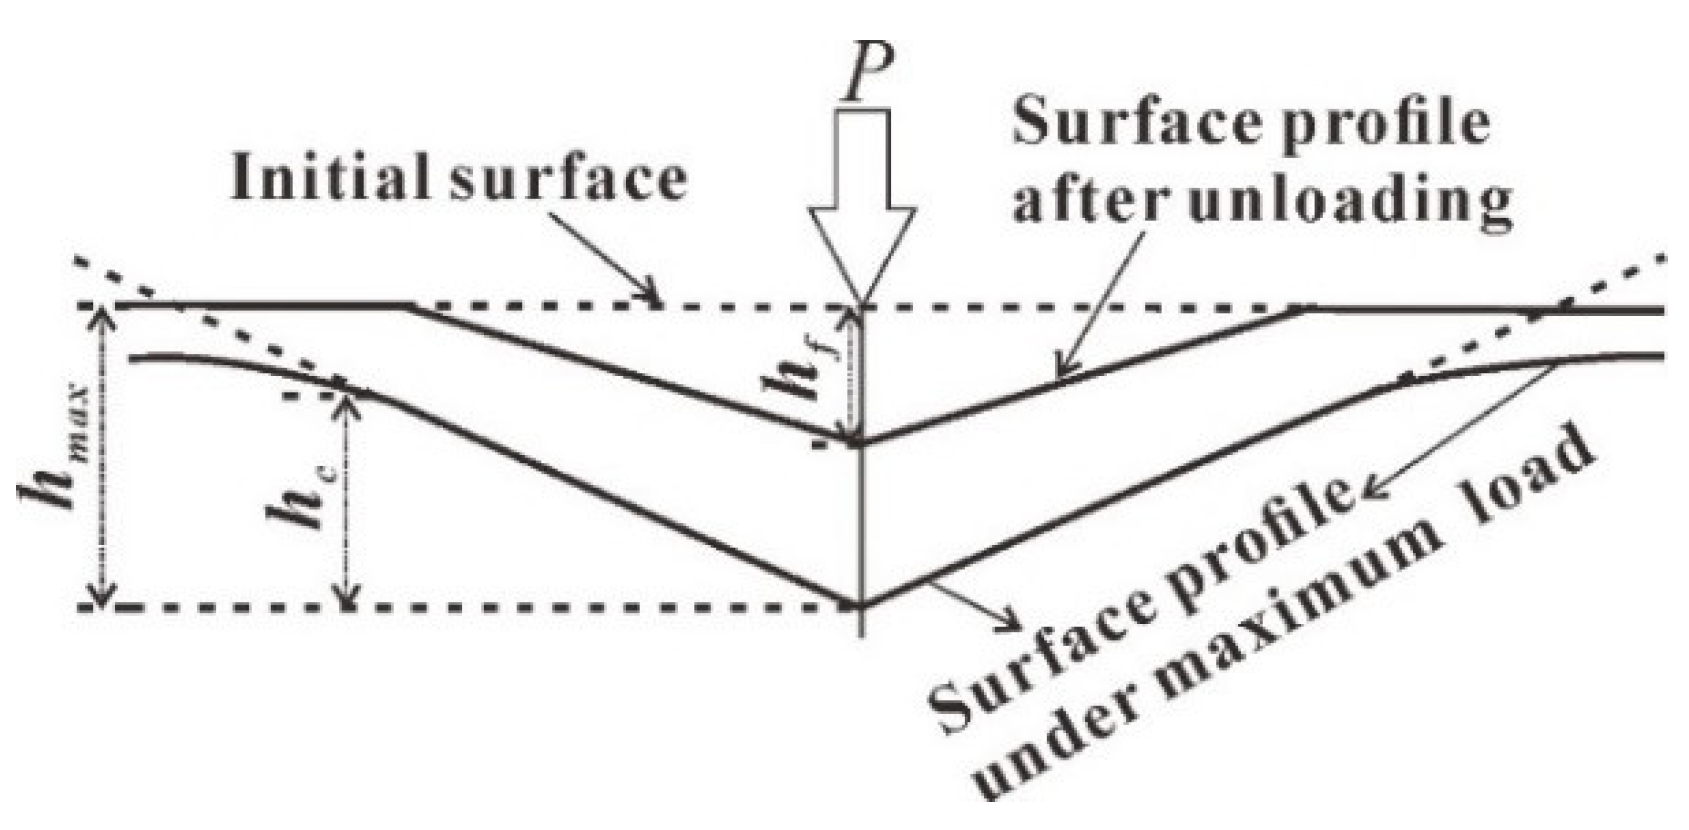
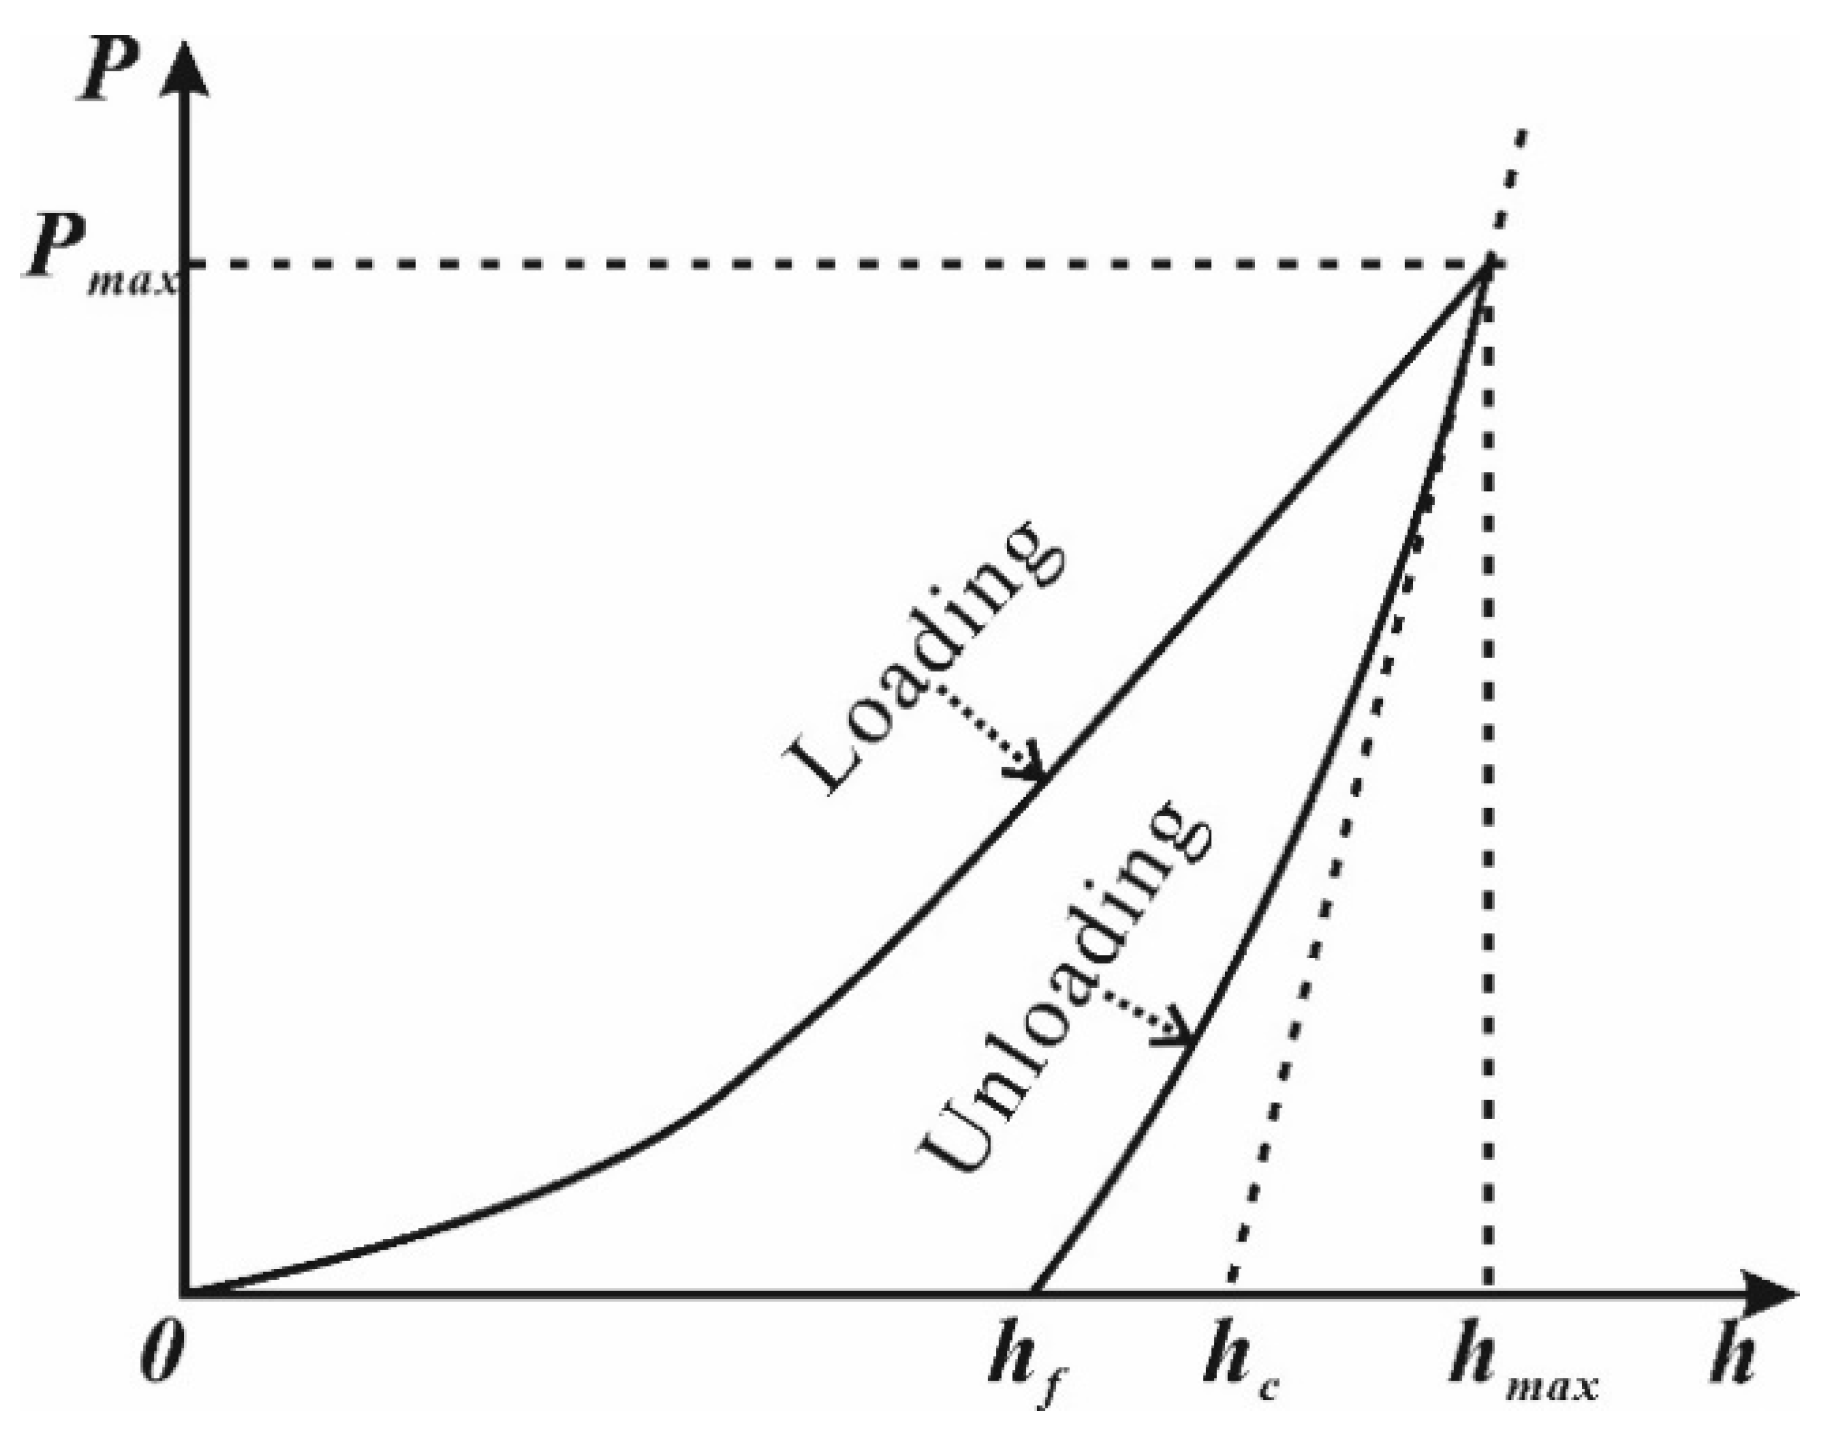
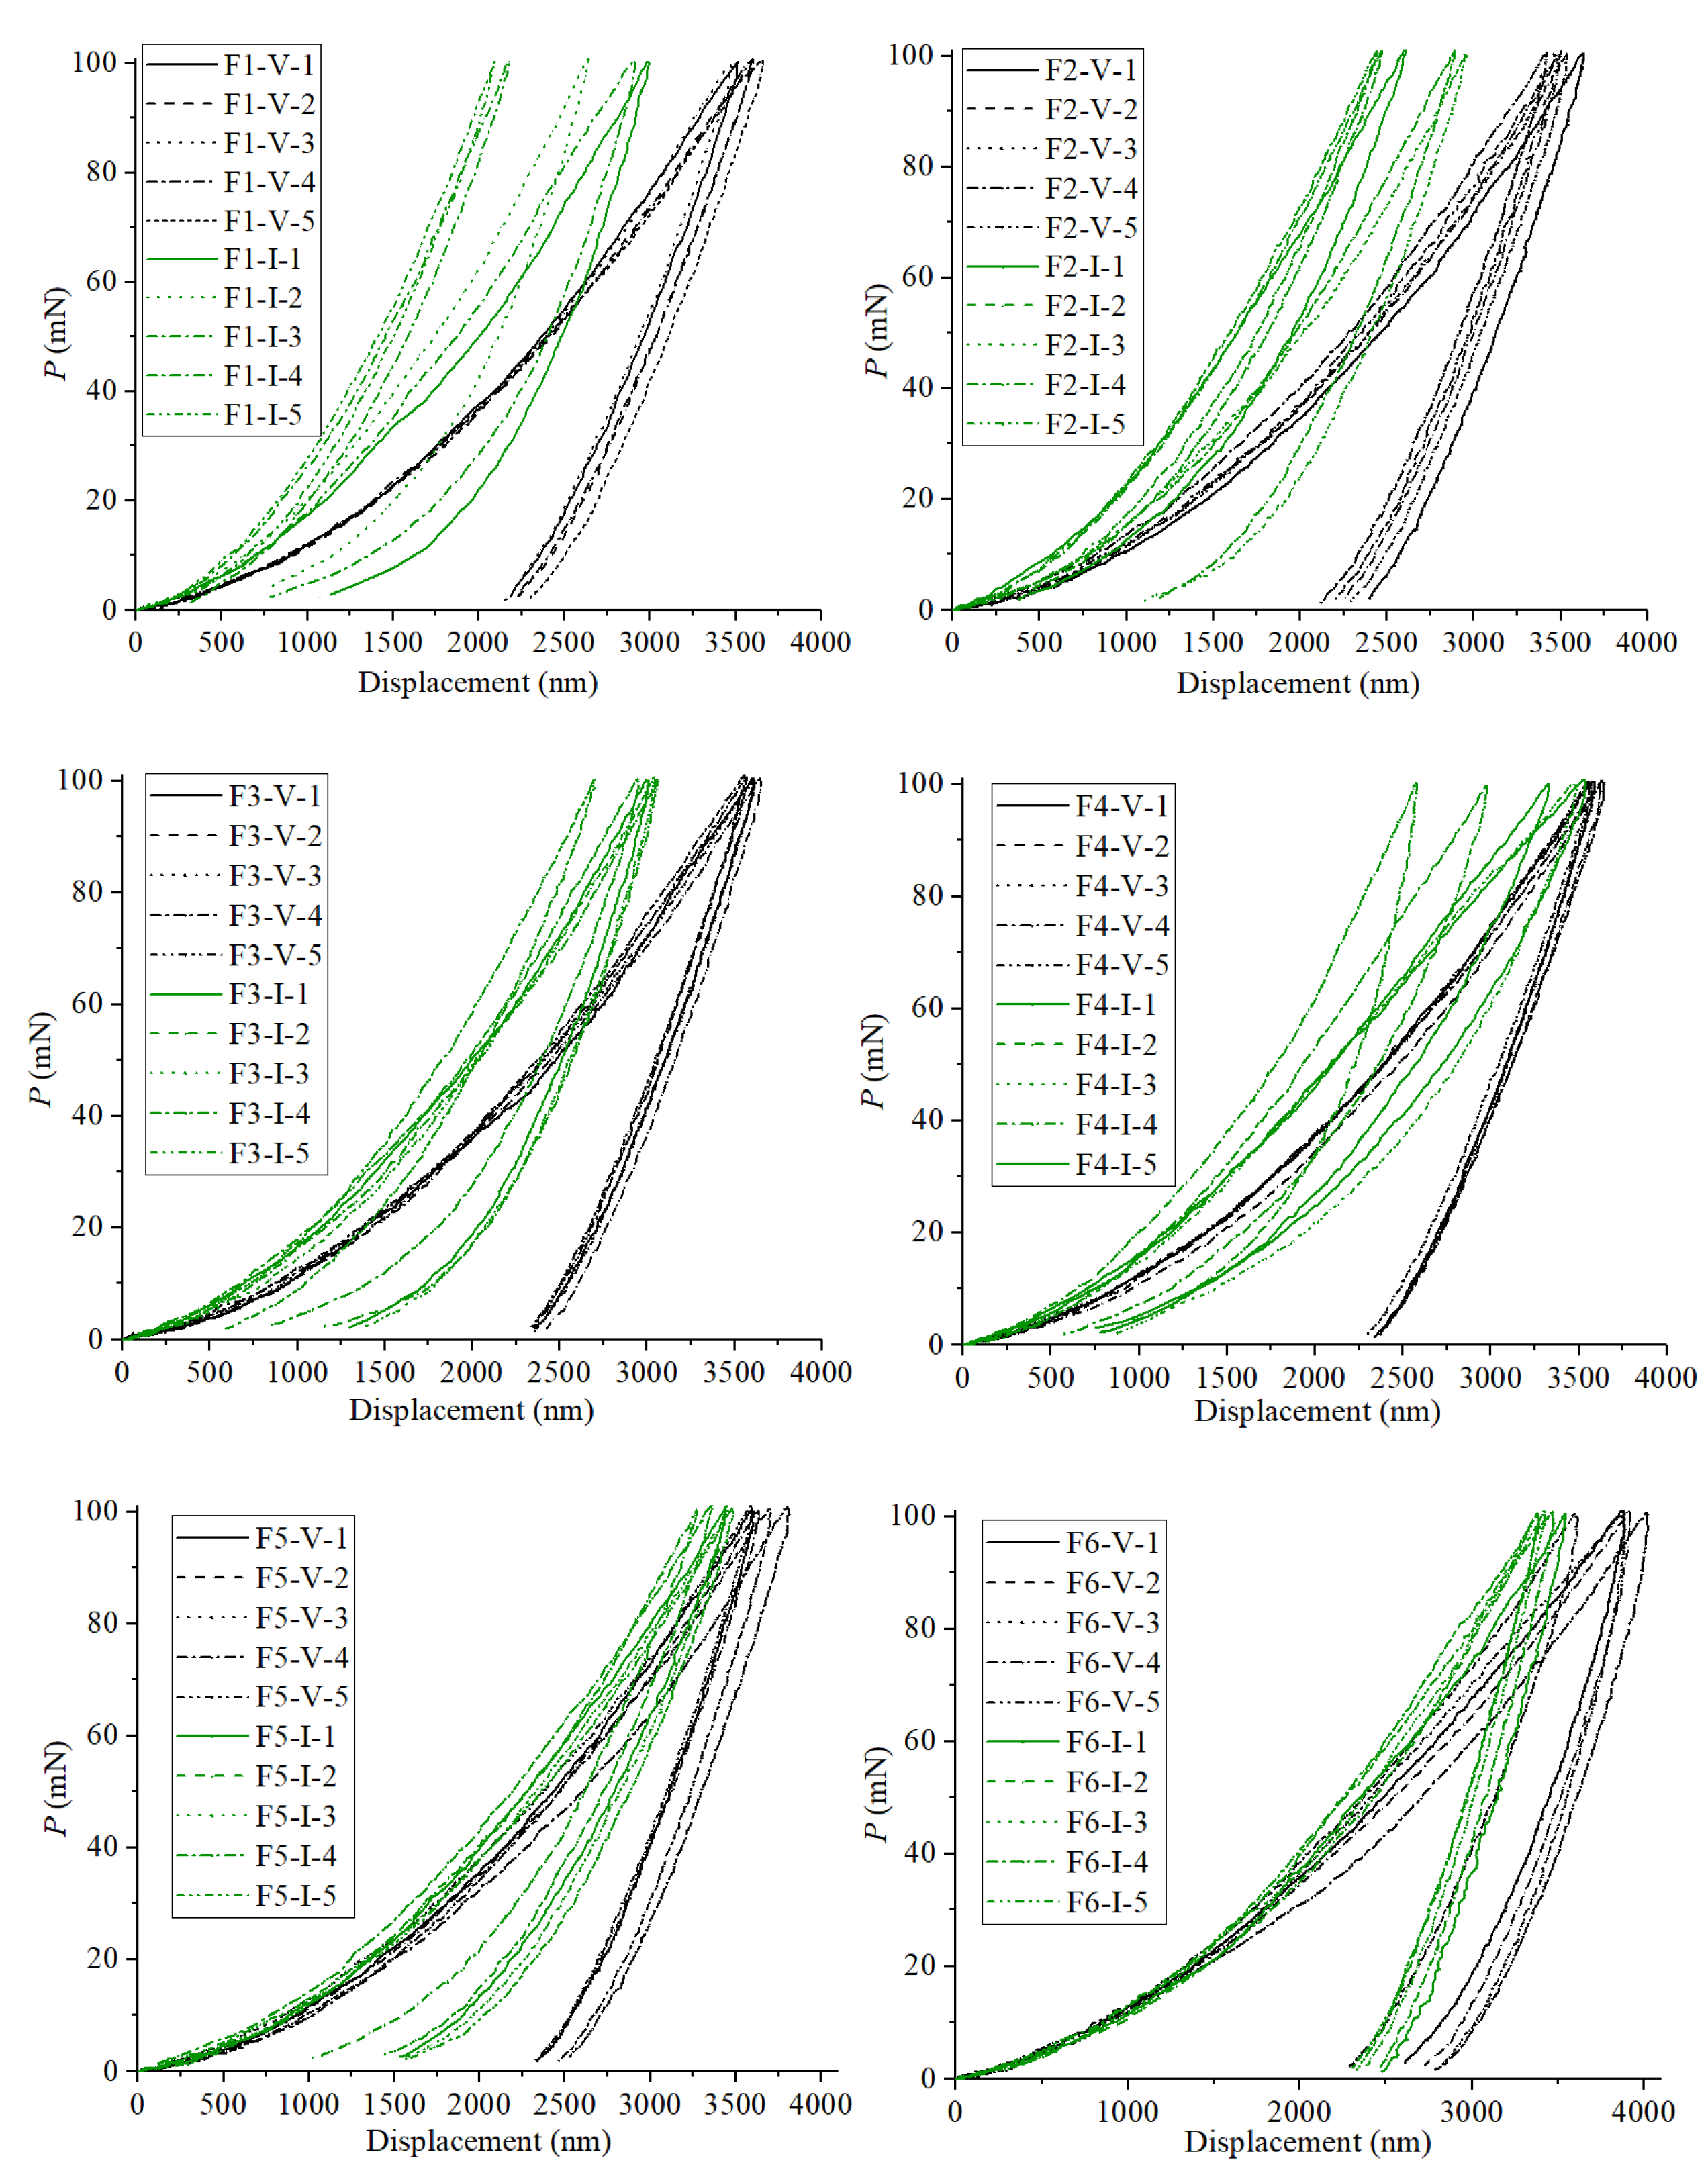
3.2. Nanoindentation Experiment
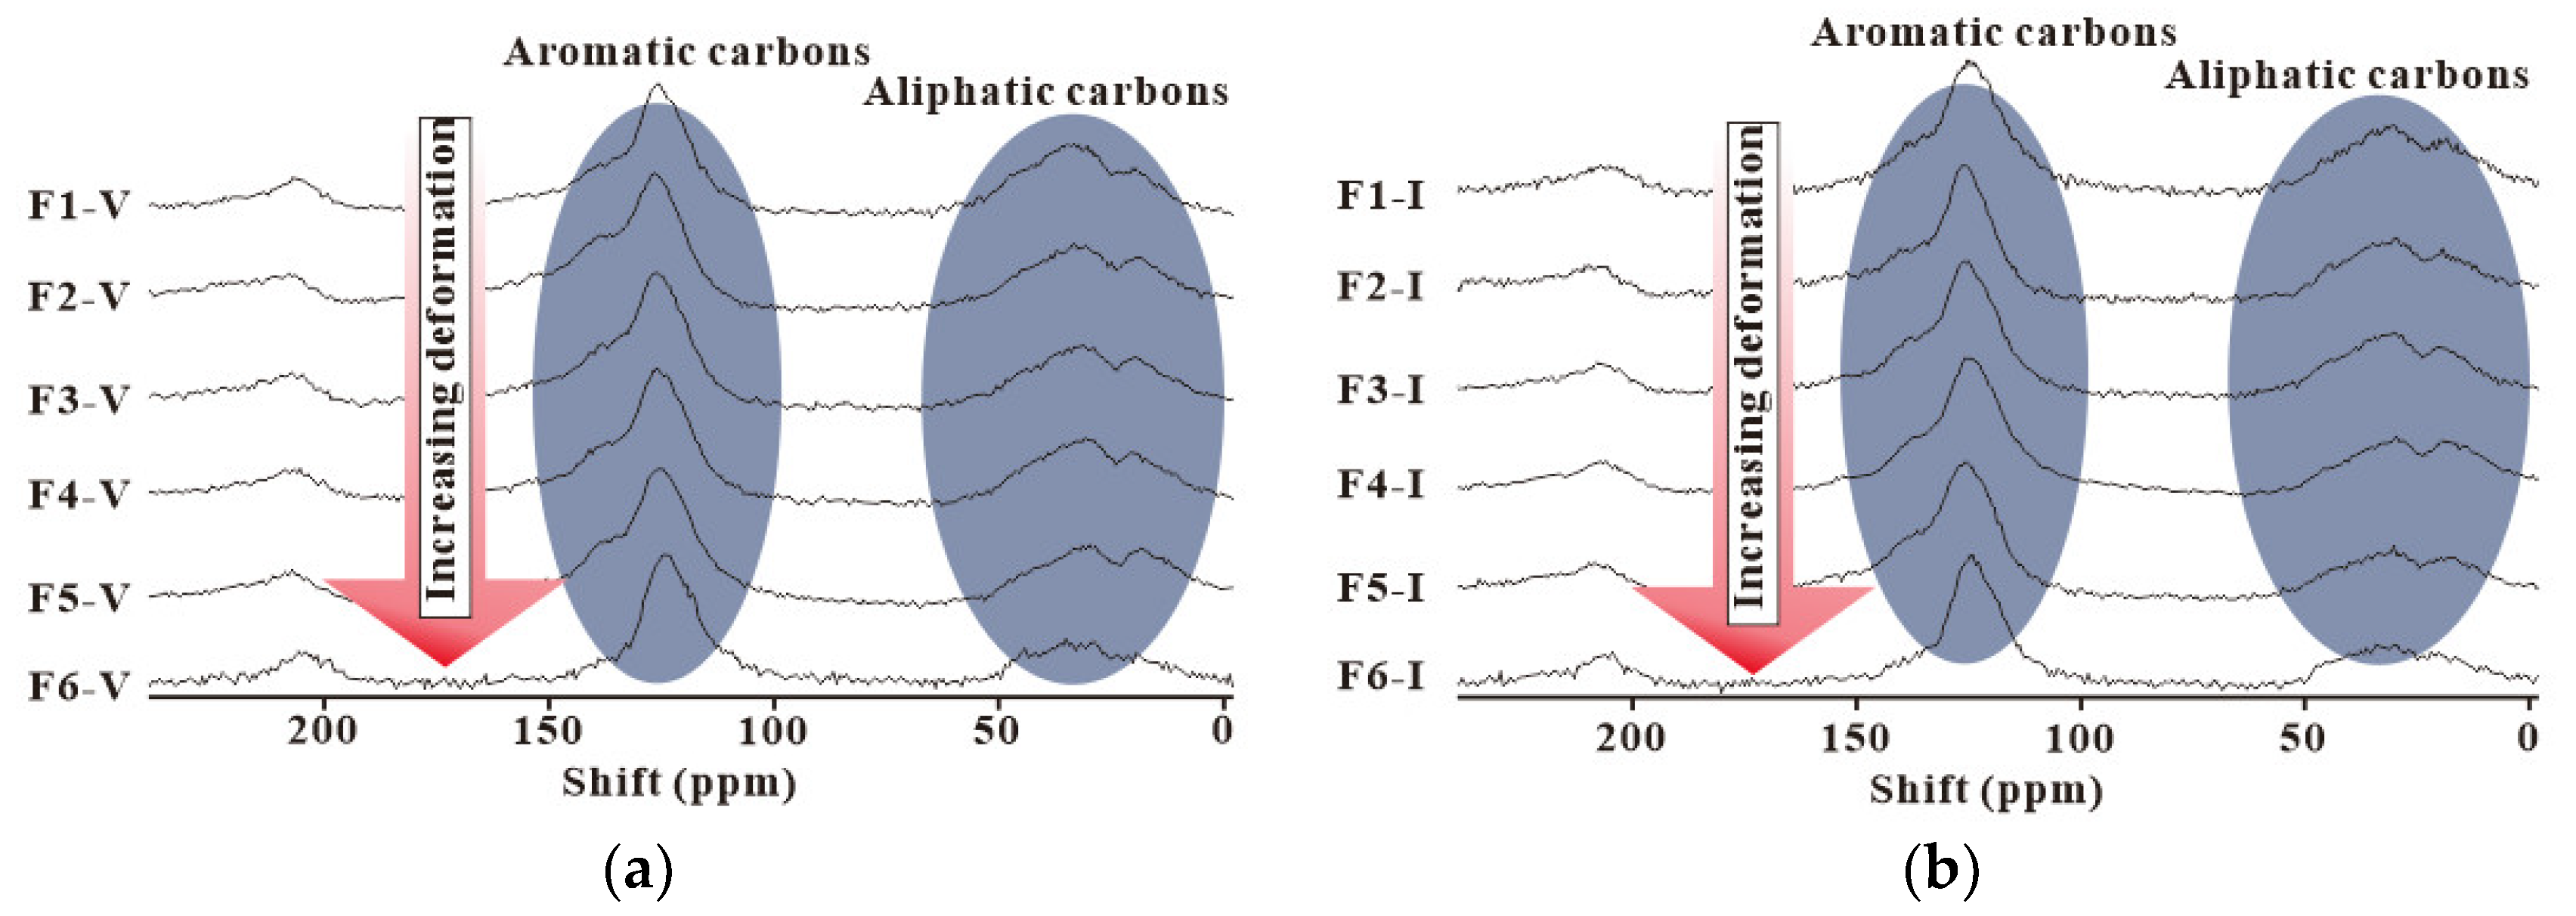
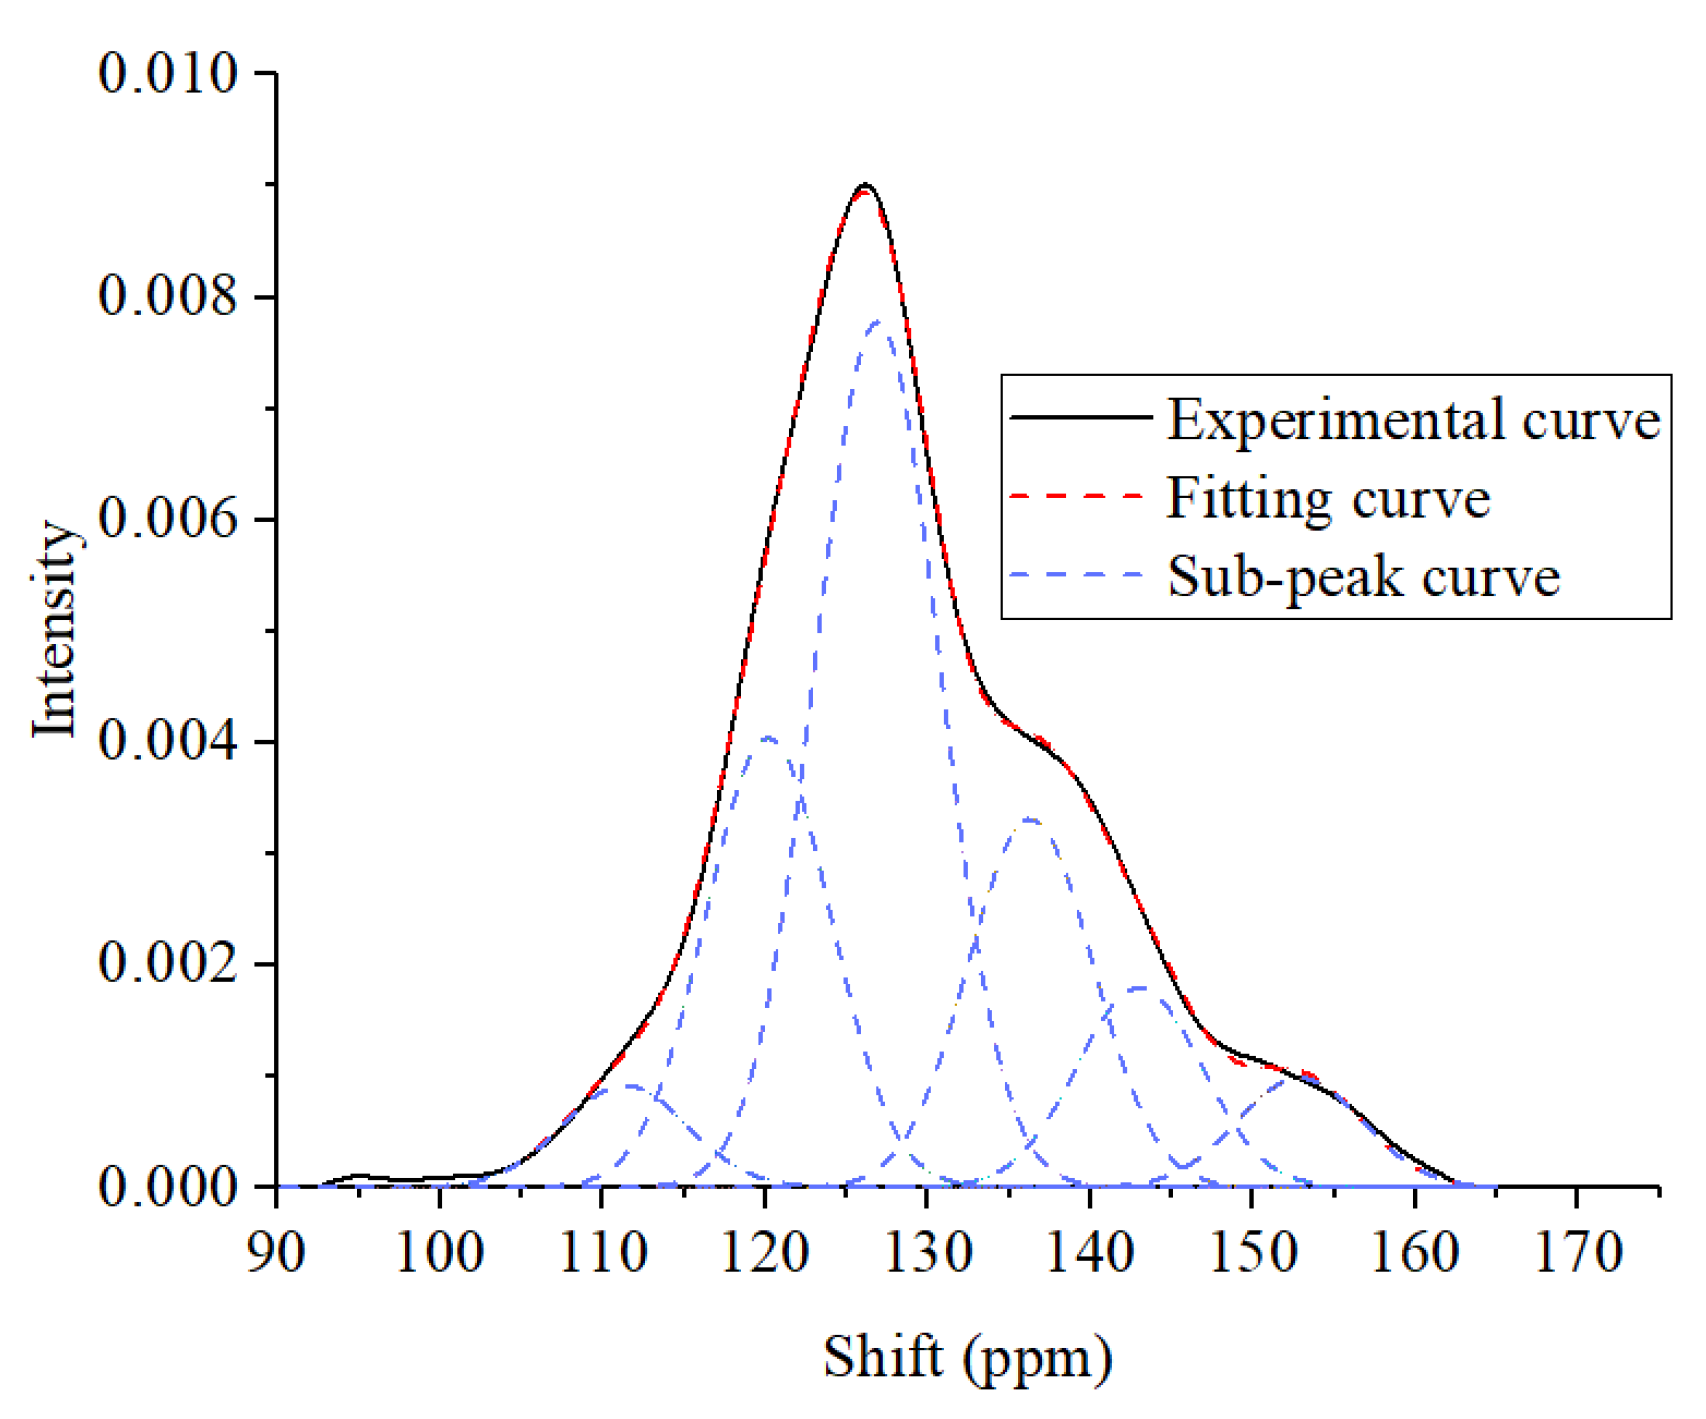
3.3. 13C NMR Experiment
3.4. FTIR Experiment
- CH2/CH3 = A (2940–2900 cm−1)/A (2940–3000 cm−1), representing the length of aliphatic side-chains;
- I = A (900–700 cm−1)/A (3000–2800 cm−1), representing the aromatic degree;
- DOC = A (900–700 cm−1)/A (1600 cm−1), representing the polycondensation degree of the aromatic rings;
- Har/Hal = A (1650–1520 cm−1/A (3000–2800 cm−1), representing the relative abundance of aromatic to aliphatic hydrogen.
4. Results
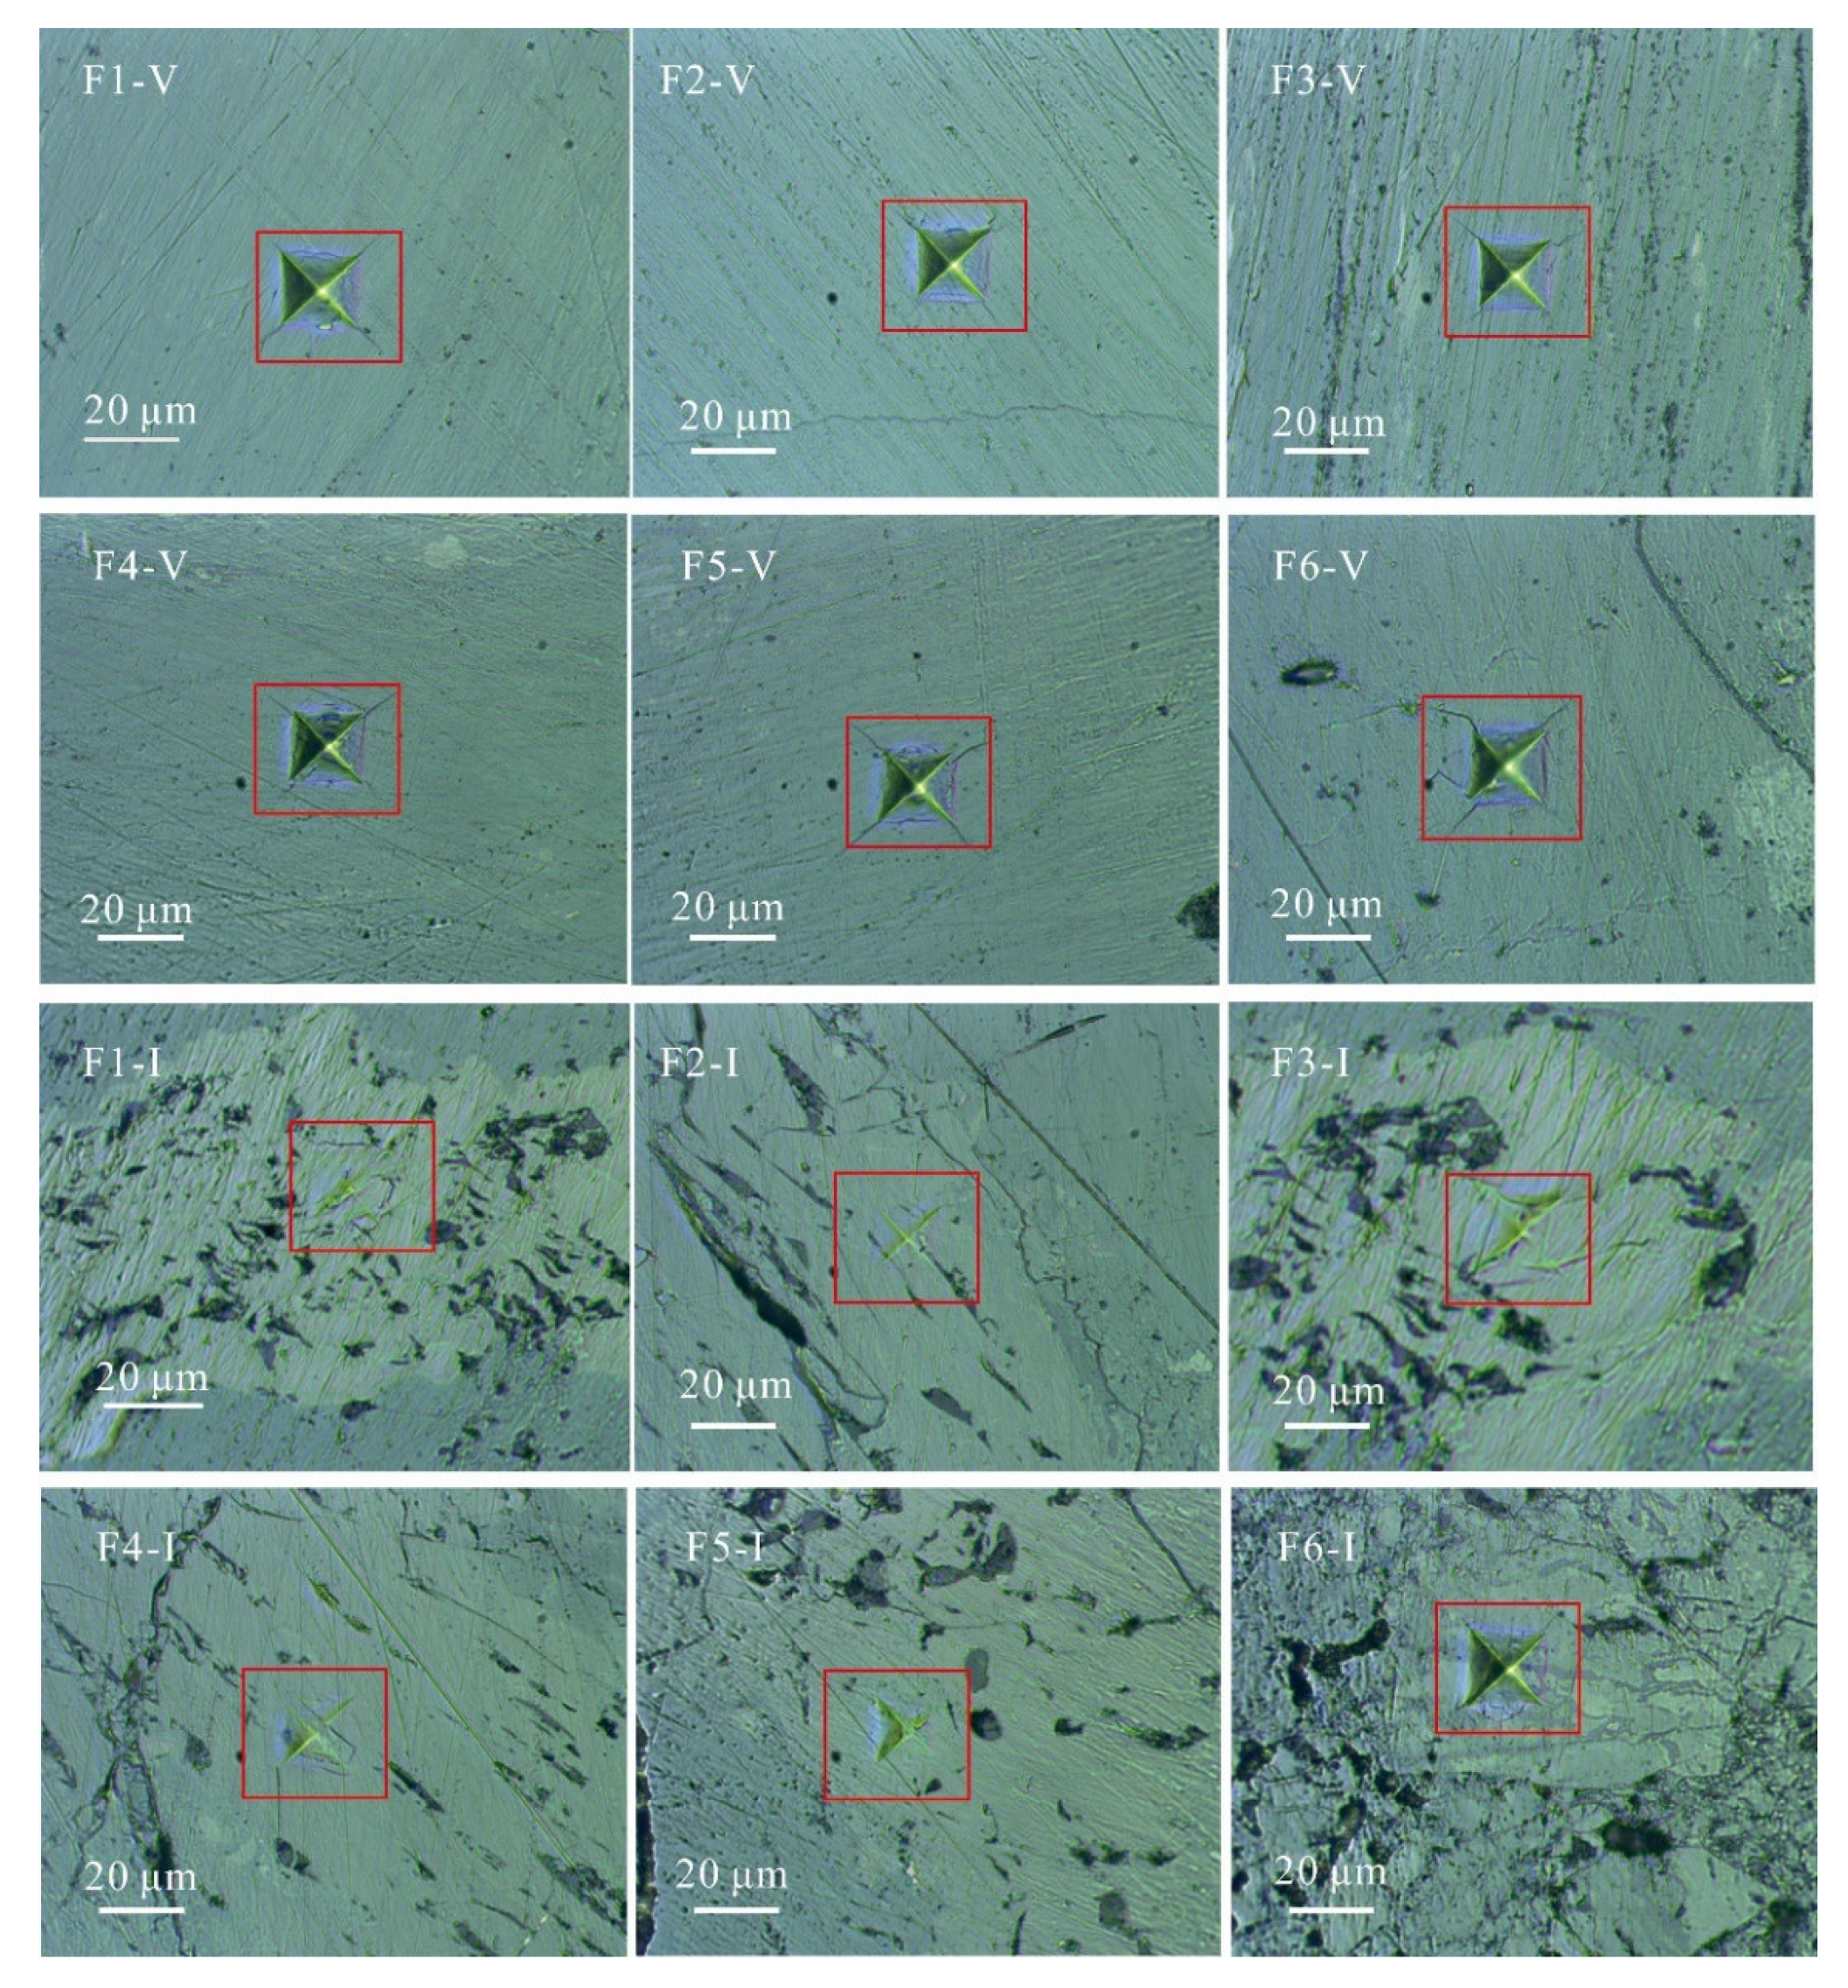
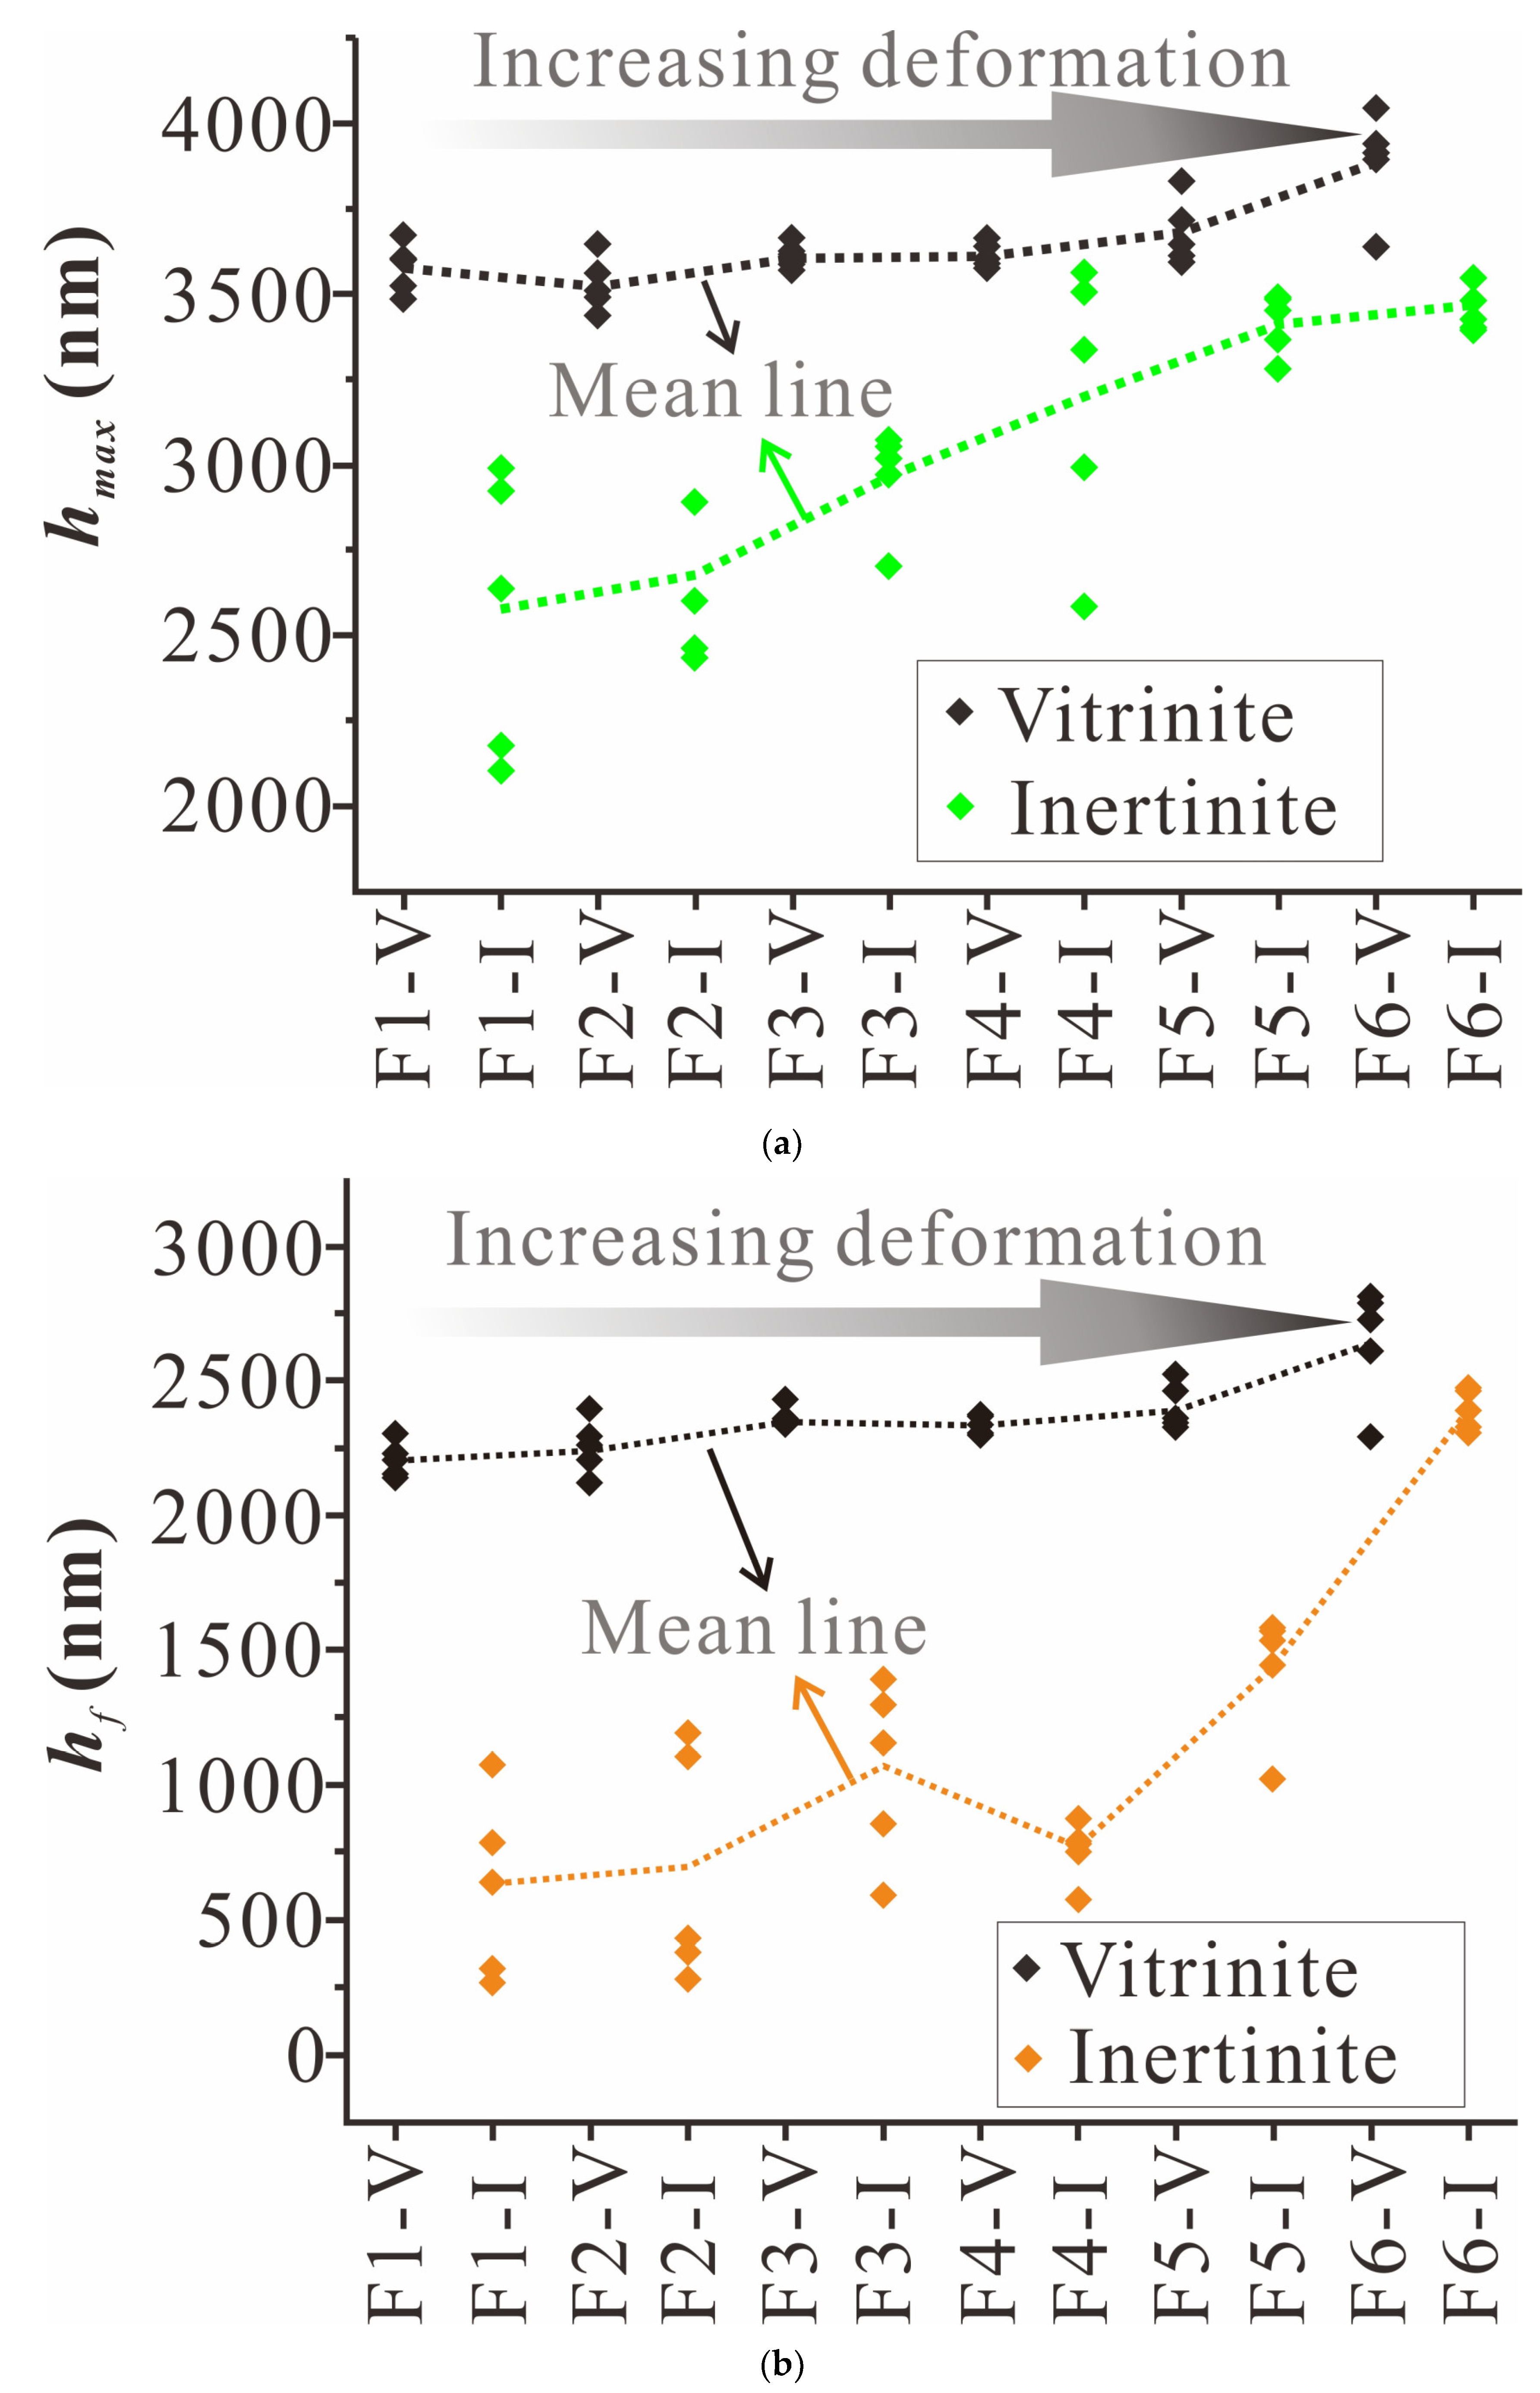
4.1. Nanoindentation Experiment Results
4.2. NMR Experiment Results
4.3. FTIR Experiment Results
5. Discussion
5.1. Macromolecular Structure Controlling Effect on Mechanical Property of TDCs
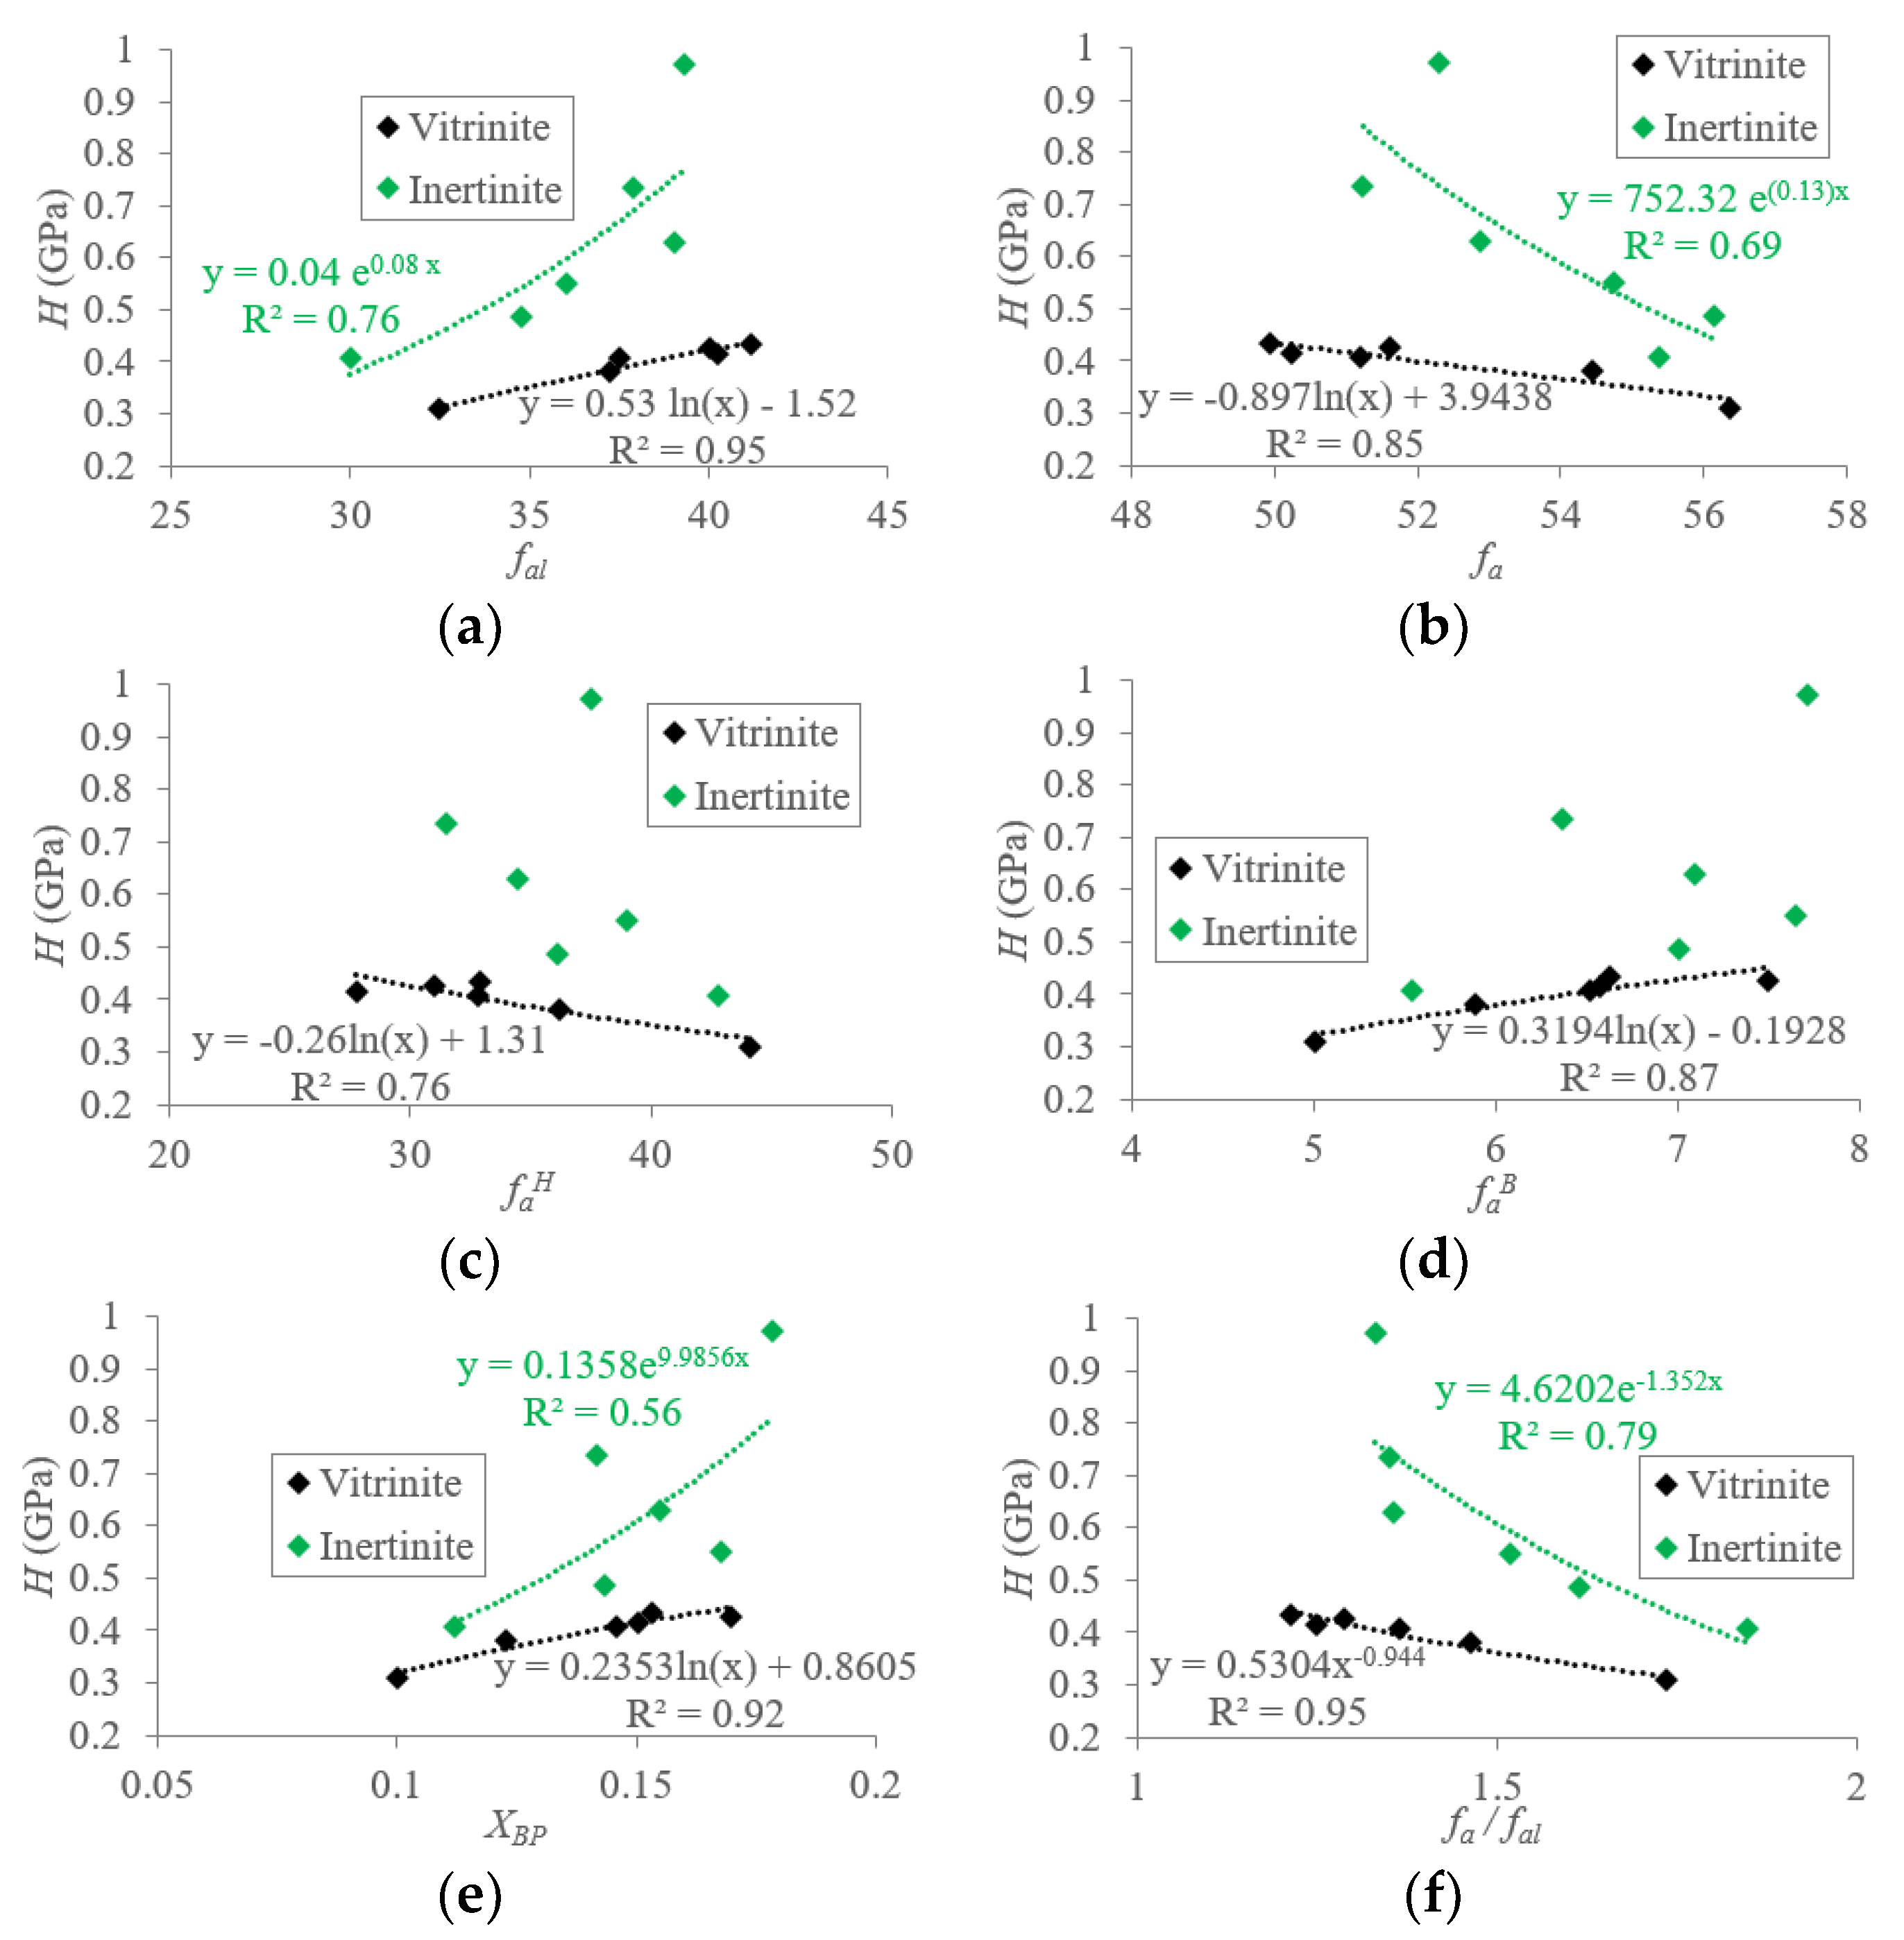
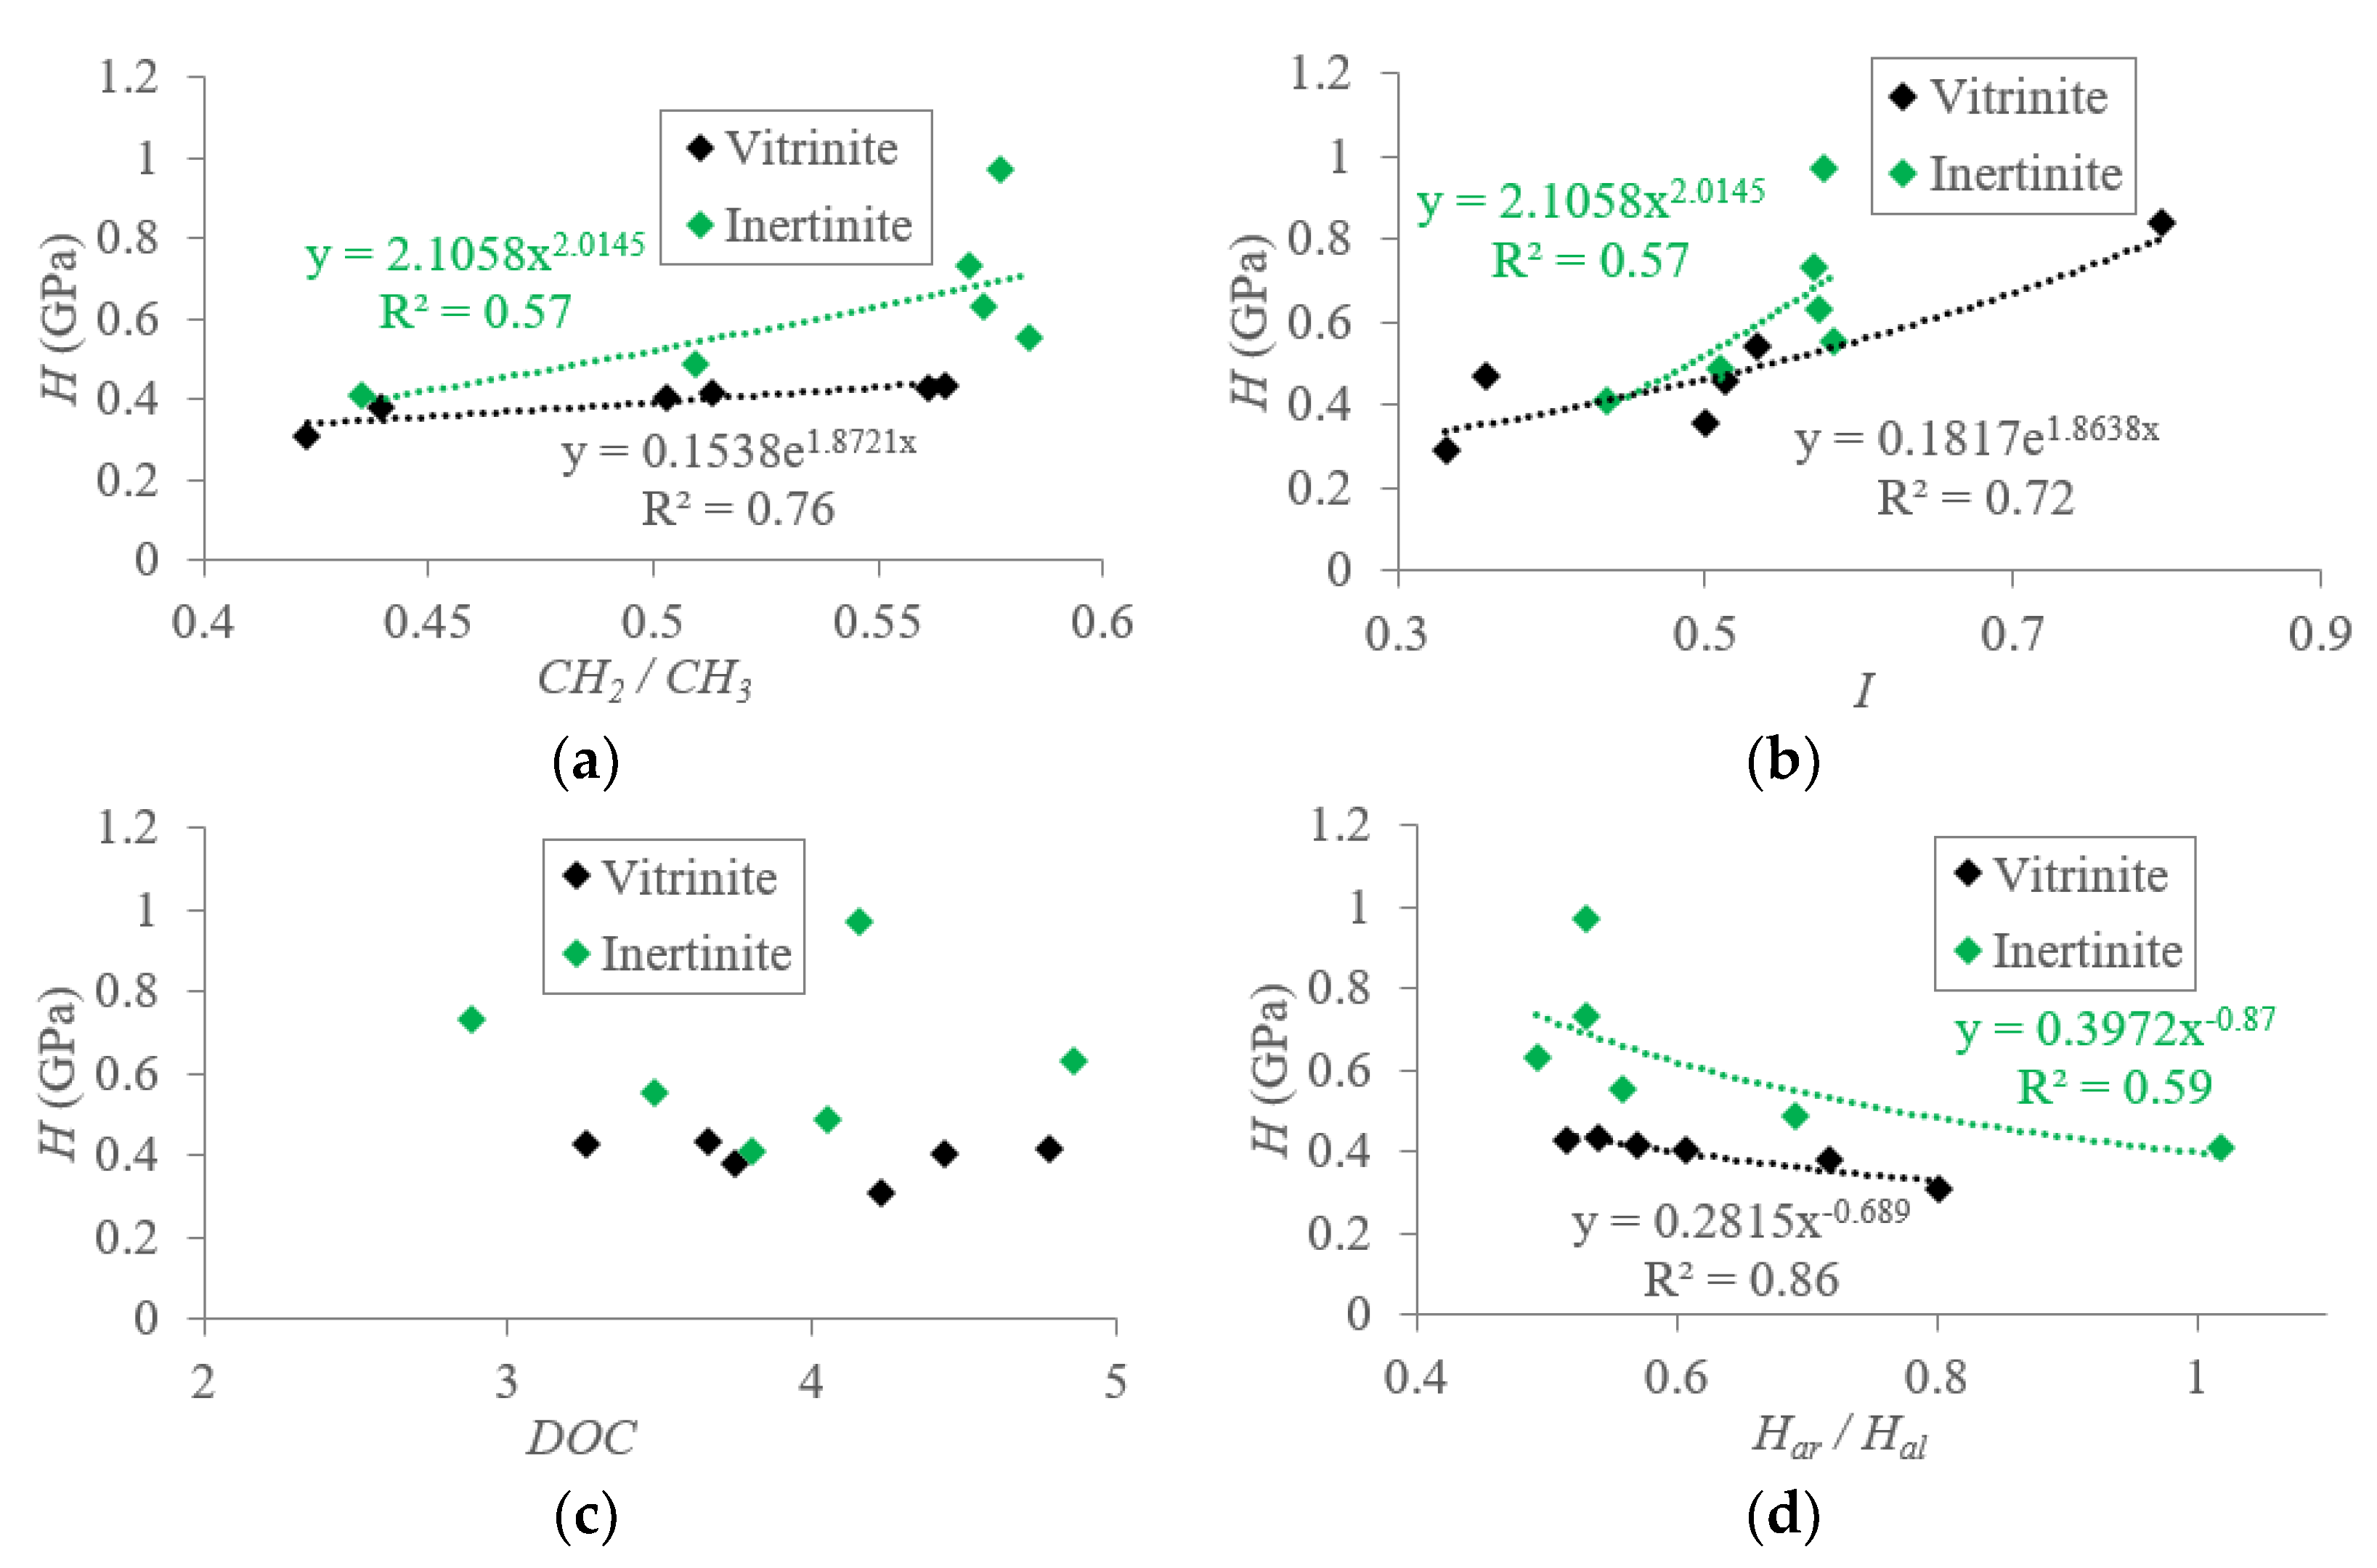
5.1.1. Macromolecular Structure Effect on the Hardness (H) of TDC
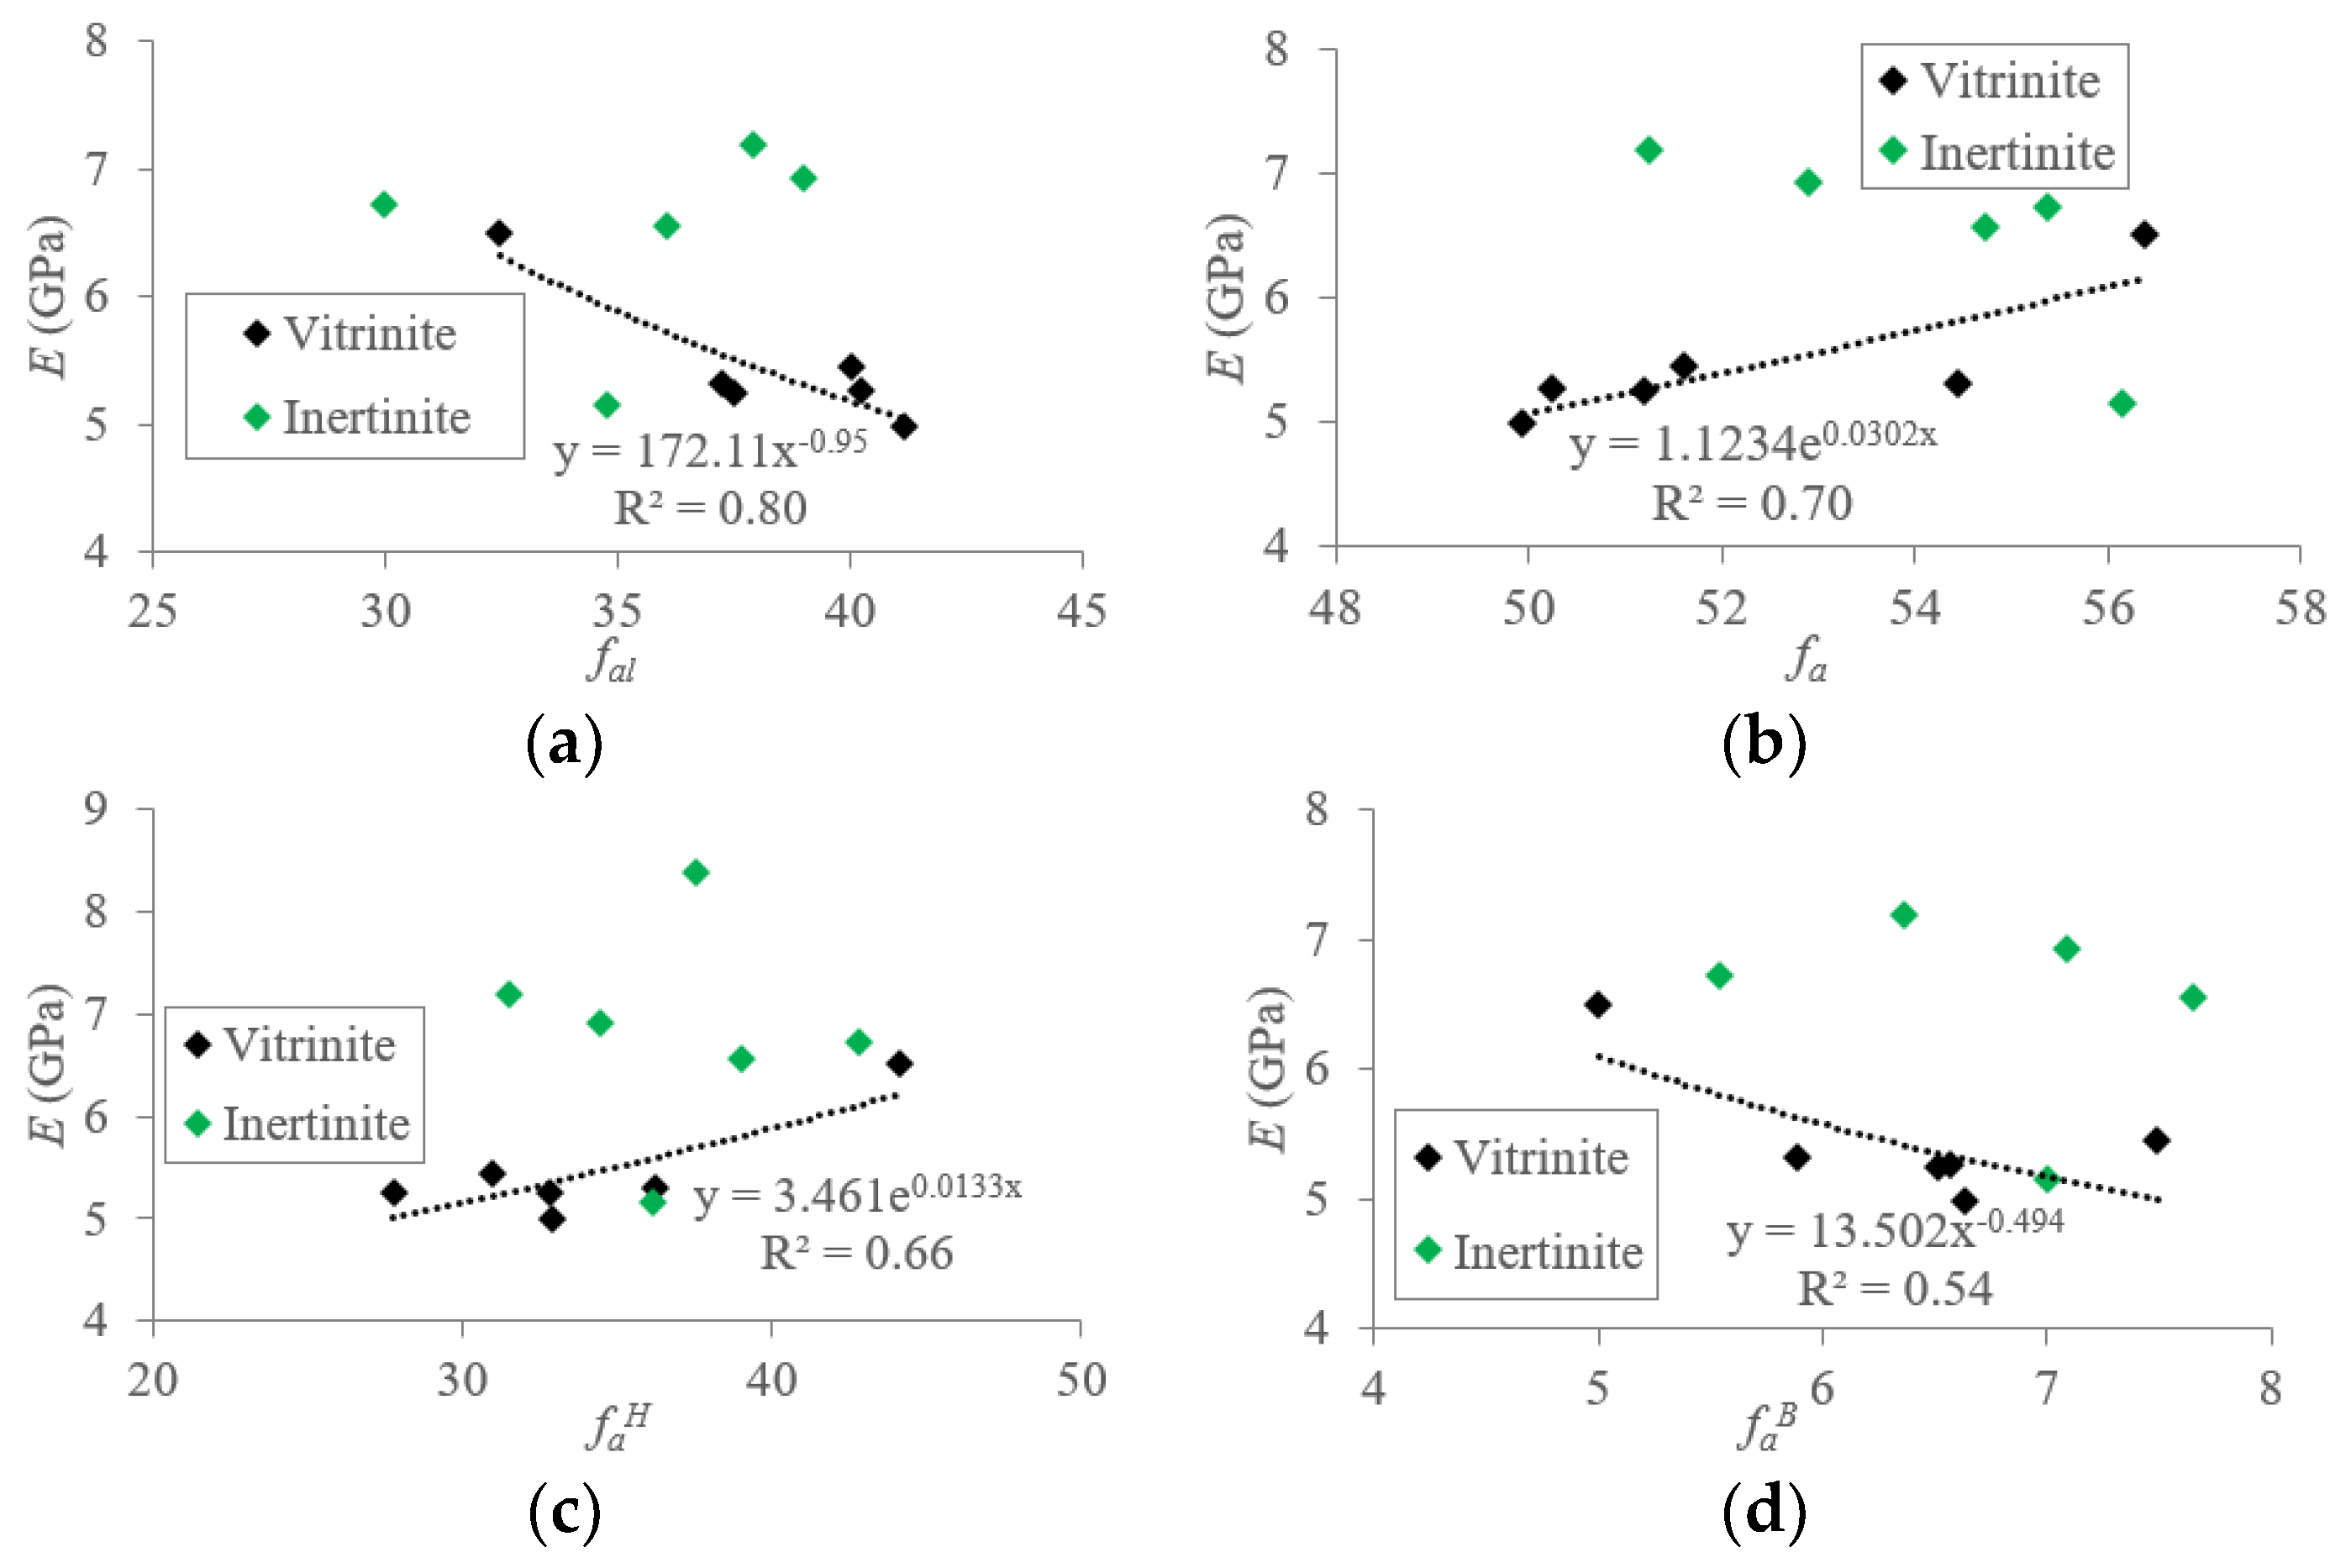
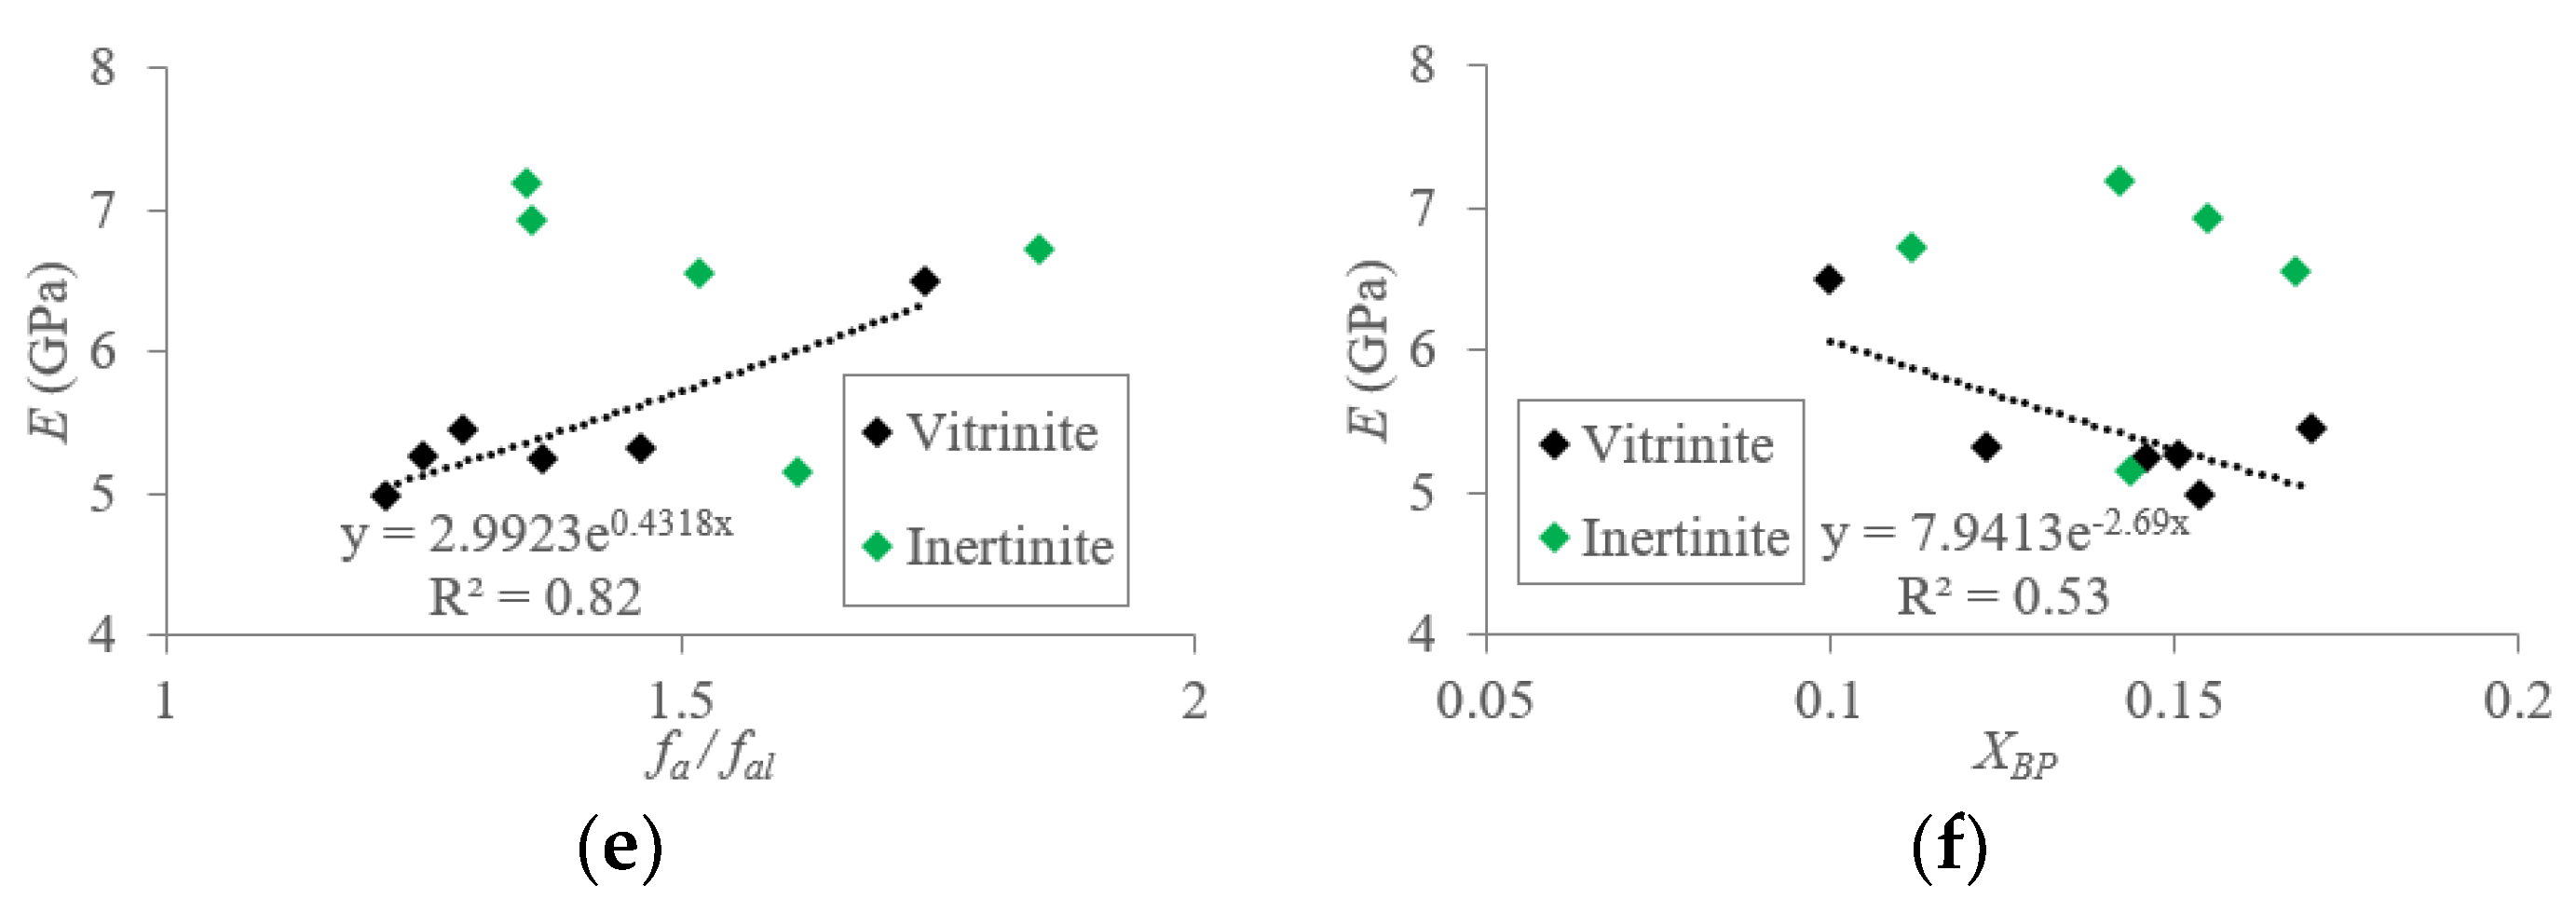
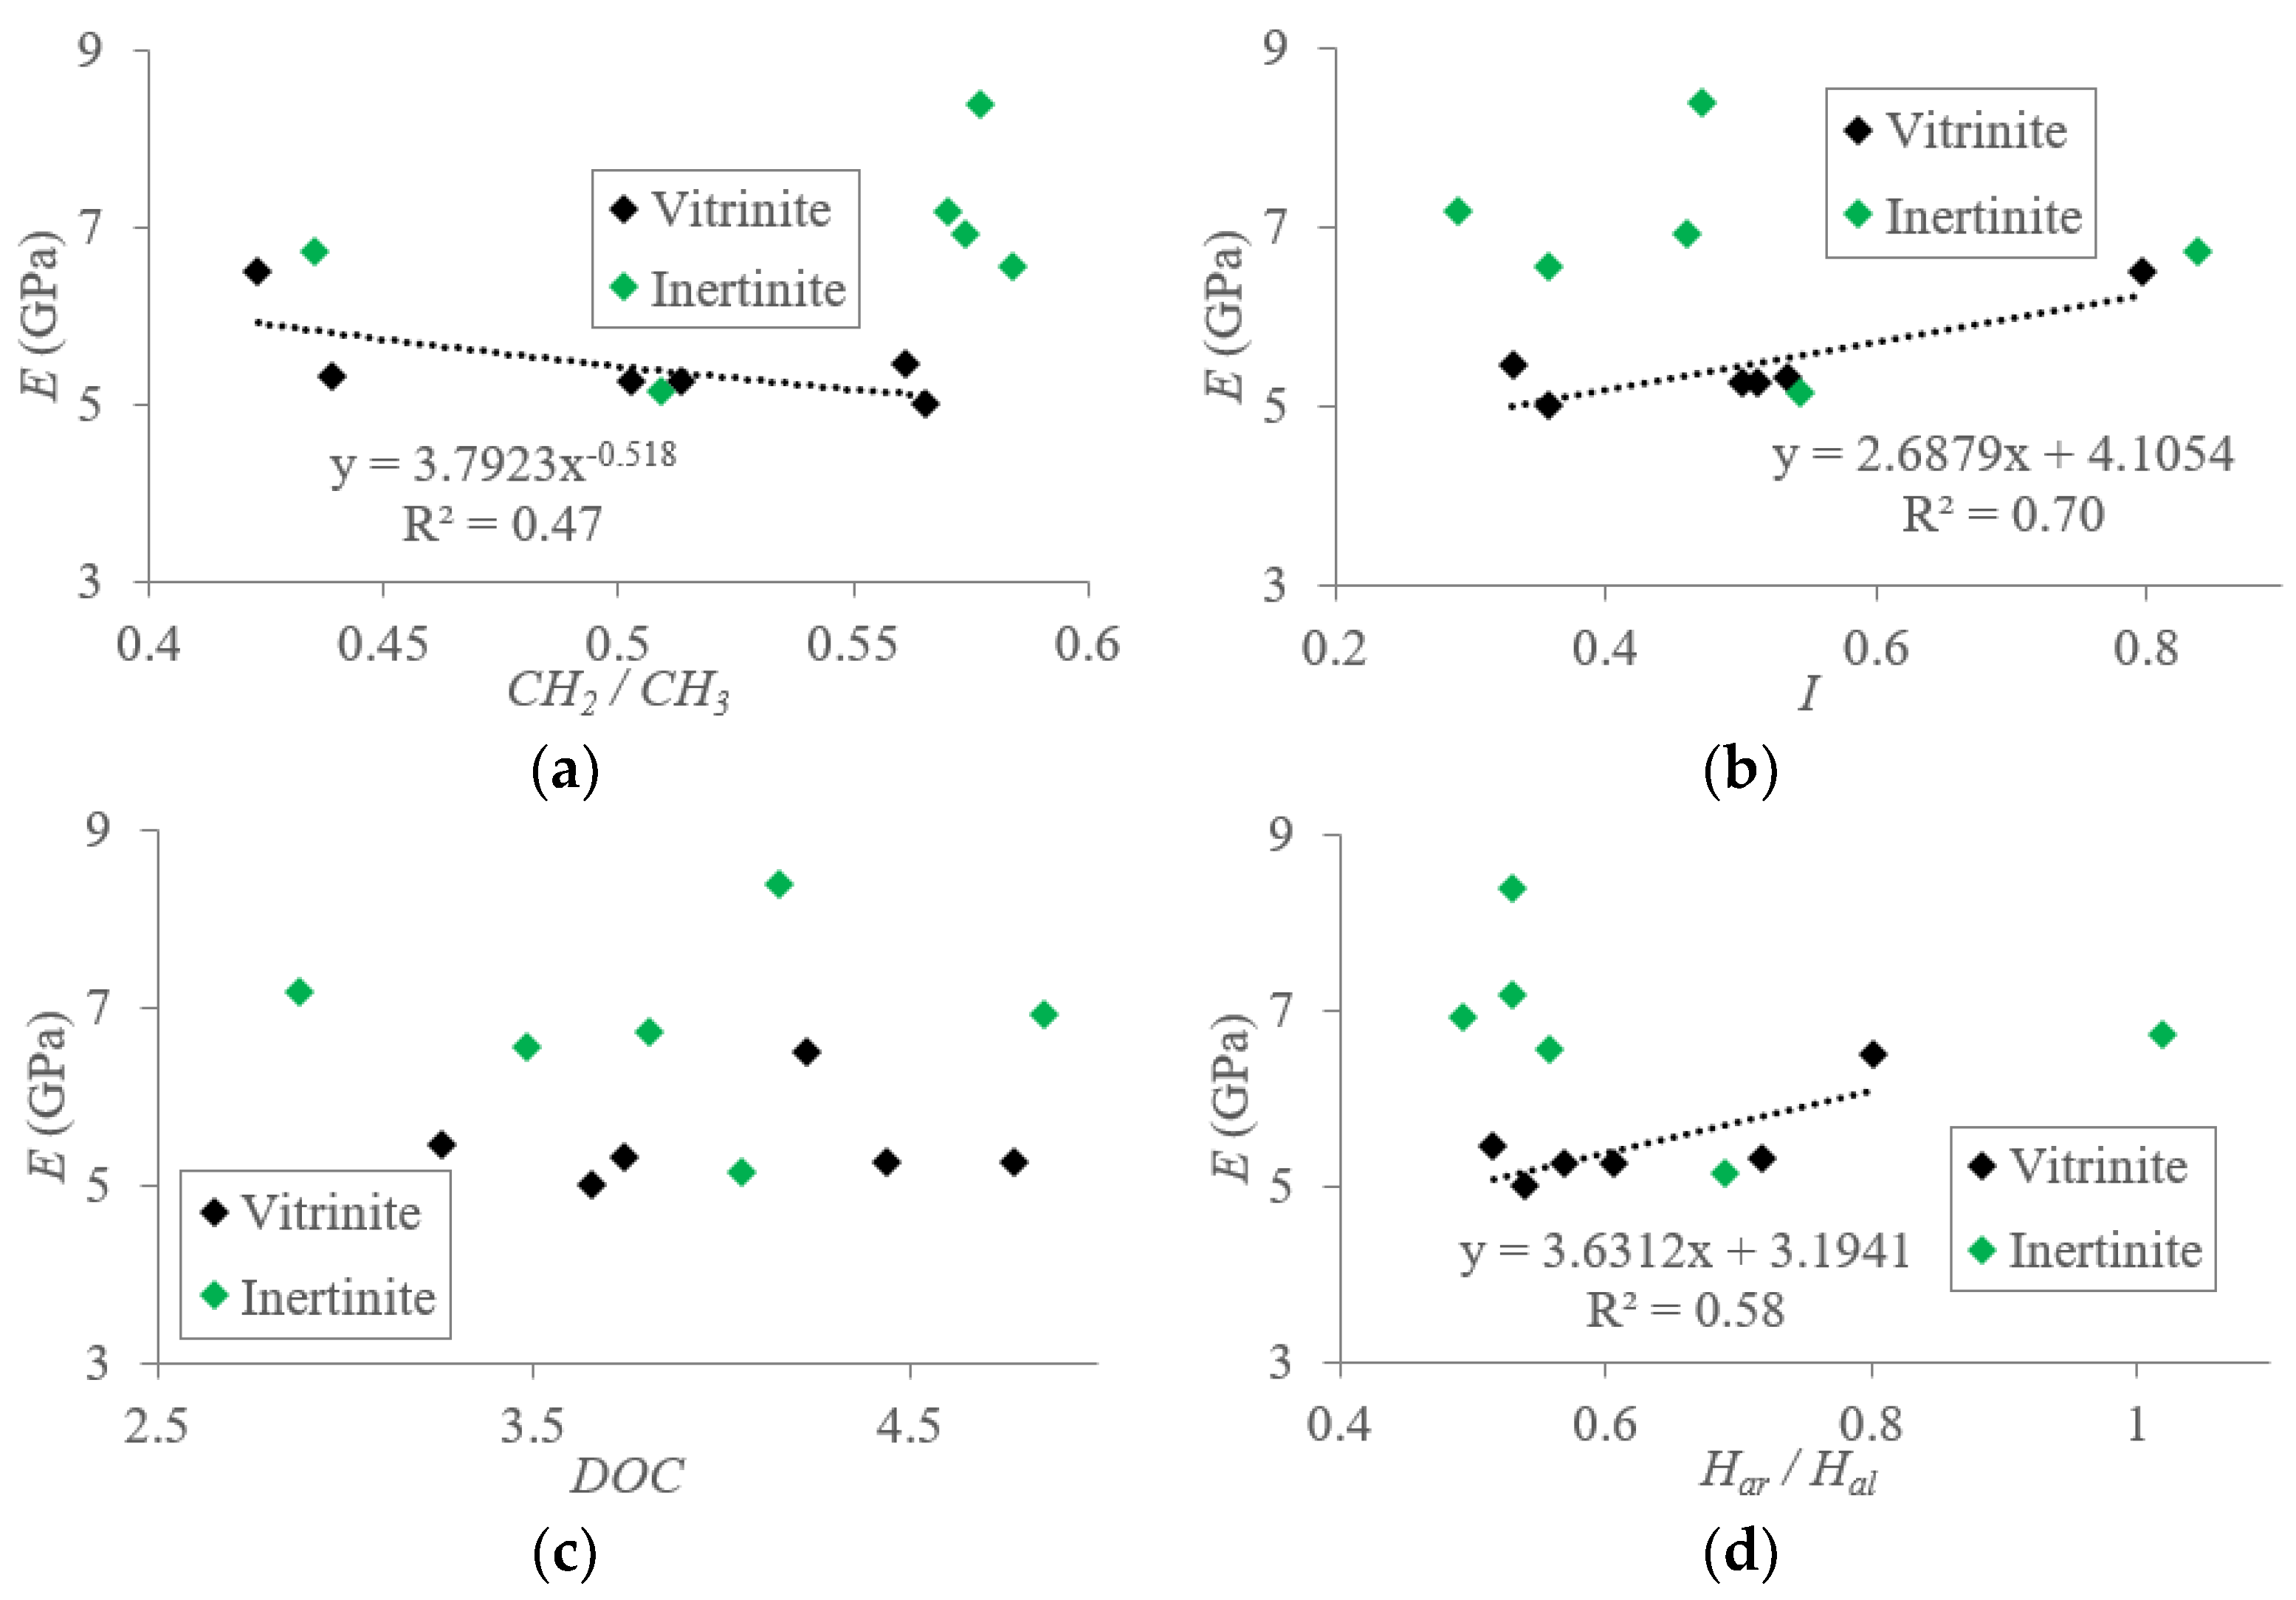
5.1.2. Macromolecular Structure Effect on the Elastic Modulus (E) of TDC
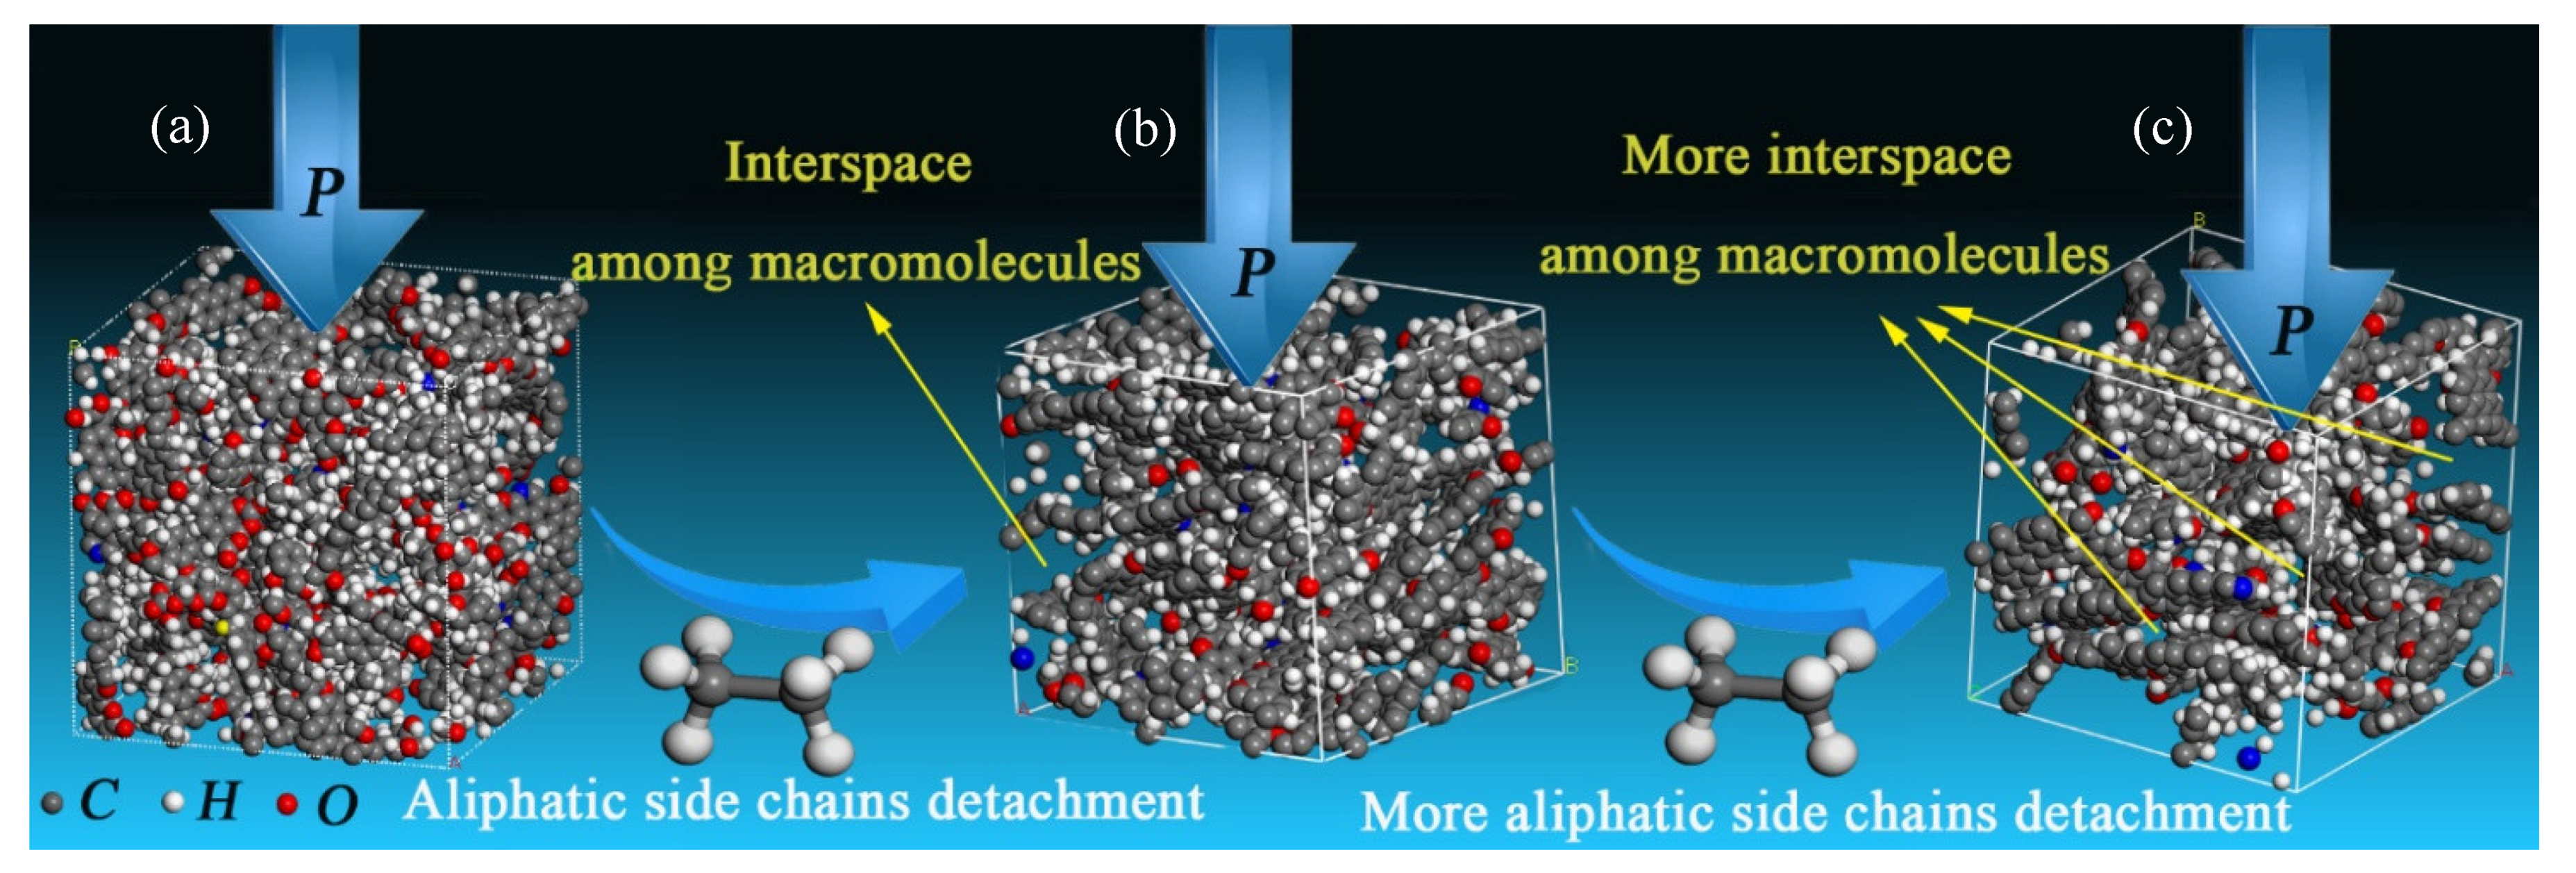
5.2. Mechanisms of Mechanical Property Evolution Controlled by Macromolecular Structure
5.3. Recommendations
6. Conclusions
Author Contributions
Funding
Conflicts of Interest
References
- Ju, Y.; Li, X. New research progress on the ultrastructure of tectonically deformed coals. Prog. Nat. Sci. 2009, 19, 1455–1466. [Google Scholar] [CrossRef]
- Wang, A.; Cao, D.; Li, J.; Jiang, A.; Yang, C. A New Discovery on the Deformation Behavior of Shale Gas Reservoirs Affecting Pore Morphology in the Juhugeng Coal Mining Area of Qinghai Province, Northwest China. Acta Geol. Sin. 2017, 91, 1932–1933. [Google Scholar] [CrossRef]
- Cao, D.; Wang, A.; Ning, S.; Li, H.; Guo, A.; Chen, L.; Liu, K.; Tan, J.; Zheng, Z. Coalfield structure and structural controls on coal in China. Int. J. Coal Sci. Technol. 2020, 7, 220–239. [Google Scholar] [CrossRef]
- Wei, Y.; Cao, D.; Yuan, Y.; Zhu, X.; Zhang, X.; Yao, Z.; Zhou, J. Characteristics of Pulverized Coal during Coalbed Methane Drainage in Hancheng Block, Shaanxi Province, China. Energy Explor. Exploit. 2013, 31, 745–757. [Google Scholar] [CrossRef]
- Wei, Y.; Li, C.; Cao, D.; Wang, A.; Zhang, A.; Yao, Z. The effects of particle size and inorganic mineral content on fines migration in fracturing proppant during coalbed methane production. J. Pet. Sci. Eng. 2019, 182, 106355. [Google Scholar] [CrossRef]
- Wang, A.; Wei, Y.; Yuan, Y.; Li, C.; Li, Y.; Cao, D. Coalbed methane reservoirs’ pore-structure characterization of different macrolithotypes in the southern Junggar Basin of Northwest China. Mar. Pet. Geol. 2017, 86, 675–688. [Google Scholar] [CrossRef]
- Wang, A.; Li, J.; Wei, Y.; Yang, C.; Nie, J.; Cao, D. Gas migration for terrestrial gas hydrates in the Juhugeng mining area of Muli basin, Qilian Mountains, Northwest China. Energy Explor. Exploit. 2020, 38, 989–1013. [Google Scholar] [CrossRef]
- Cao, D.; Li, X.; Zhang, S. Influence of tectonic stress on coalification: Stress degradation mechanism and stress polycondensation mechanism. Sci. China Ser. D: Earth Sci. 2007, 50, 43–54. [Google Scholar] [CrossRef]
- Wang, X.; Chen, T.; Xu, H. Thickness Distribution Prediction for Tectonically Deformed Coal with a Deep Belief Network: A Case Study. Energies 2020, 13, 1169. [Google Scholar] [CrossRef] [Green Version]
- Lu, J.; Wang, Y.; Chen, J. Detection of Tectonically Deformed Coal Using Model-Based Joint Inversion of Multi-Component Seismic Data. Energies 2018, 11, 829. [Google Scholar] [CrossRef]
- Pan, J.; Zhu, H.; Hou, Q.; Wang, H.; Wang, S. Macromolecular and pore structures of Chinese tectonically deformed coal studied by atomic force microscopy. Fuel 2015, 139, 94–101. [Google Scholar] [CrossRef]
- Chen, Q.; Jing, J.; Liu, J.; Long, J.; Zhang, S. Productivity Evaluation of Coalbed Methane Well with Geophysical Logging-Derived Tectonically Deformed Coal. Energies 2019, 12, 3459. [Google Scholar] [CrossRef] [Green Version]
- Liu, H.; Jiang, B. Stress response of noncovalent bonds in molecular networks of tectonically deformed coals. Fuel 2019, 255, 115785. [Google Scholar] [CrossRef]
- Cao, D.Y.; Zhang, S.R.; Ren, D.Y. The influence of structural deformation on coalification: A case study of carboniferous coal measures in the northern foothills of the Dabie orogenic belt. Geological Review 2002, 48, 313–317. [Google Scholar]
- Godyń, K.; Kožušníková, A. Microhardness of Coal from Near-Fault Zones in Coal Seams Threatened with Gas-Geodynamic Phenomena, Upper Silesian Coal Basin, Poland. Energies 2019, 12, 1756. [Google Scholar] [CrossRef] [Green Version]
- Li, W.; Liu, H.; Song, X. Multifractal analysis of Hg pore size distributions of tectonically deformed coals. Int. J. Coal Geol. 2015, 138–152. [Google Scholar] [CrossRef]
- Stach, E.; Mackowsky, M.-T.H.; Techmuller, M. Stach’s textbook of coal petrology, 3rd ed.; Gebrüder Borntraeger: Berlin, Germany, 1982; pp. 66–107. [Google Scholar]
- Wang, A.; Cao, D.; Wei, Y.; Nie, J.; Qin, R. Comparison of nanopore evolution in vitrinite and inertinite in coalbed methane reservoirs during coalification. J. Nat. Gas Sci. Eng. 2020, 78, 103289. [Google Scholar] [CrossRef]
- Qin, R.; Wang, A.; Cao, D.; Wei, Y.; Ding, L.; Li, J. Effect of peat mire evolution on pore structure characteristics in thick coal seam: Examples from Xishanyao Formation (Middle Jurassic), Yili Basin, China. Energy Explor. Exploit. 2020, 38, 1484–1514. [Google Scholar] [CrossRef]
- Pan, J.; Meng, Z.; Hou, Q.; Ju, Y.; Cao, Y. Coal strength and Young’s modulus related to coal rank, compressional velocity and maceral composition. J. Struct. Geol. 2013, 54, 129–135. [Google Scholar] [CrossRef]
- Hou, C.; Jiang, B.; Liu, H.; Song, Y.; Xu, S. The differences of nanoscale mechanical properties among coal maceral groups. J. Nat. Gas Sci. Eng. 2020, 80, 103394. [Google Scholar] [CrossRef]
- Kožušníková, A. Determination of microhardness and elastic modulus of coal components by using indentation method. Geolines 2009, 22, 40–43. [Google Scholar]
- Godyń, K.; Dutka, B.; Chuchro, M.; Młynarczuk, M. Synergy of Parameters Determining the Optimal Properties of Coal as a Natural Sorbent. Energies 2020, 13, 1967. [Google Scholar] [CrossRef]
- Fender, T.; Rouainia, M.; Van Der Land, C.; Jones, D.M.; Mastalerz, M.; Hennissen, J.A.; Graham, S.P.; Wagner, T. Geomechanical properties of coal macerals; measurements applicable to modelling swelling of coal seams during CO2 sequestration. Int. J. Coal Geol. 2020, 228, 103528. [Google Scholar] [CrossRef]
- Ju, Y.; Jiang, B.; Hou, Q.-L.; Wang, G.-L. [FTIR spectroscopic study on the stress effect of compositions of macromolecular structure in tectonically deformed coals]. Guang Pu Xue Yu Guang Pu Fen Xi 2005, 25, 1216–1220. [Google Scholar]
- Song, Y.; Jiang, B.; Qu, M. Macromolecular evolution and structural defects in tectonically deformed coals. Fuel 2019, 236, 1432–1445. [Google Scholar] [CrossRef]
- Cao, D.Y.; Zhan, W.F.; Zhang, J.; Yang, S.C.; Zhang, L.S.; Fan, H.P.; Huang, P.; Qiao, J.; Liu, D.M.; Chang, M.H. Neotectonic character of Handan-Fengfeng mining area and its significance for coal resource exploitation. J. China Coal Soc. 2007, 32, 141–145. [Google Scholar]
- Lv, D.W.; Lu, C.; Wen, Z.; Song, H.; Yin, S. Coal-bed methane geology of the No. 2 coal seam in Fengfeng Coalfield, North China. Arab. J. Geosci. 2019, 12, 529. [Google Scholar] [CrossRef]
- Bao, Y.; Wang, W.; Zhou, Y. Investigation of the relationship between elastic modulus and hardness based on depth-sensing indentation measurements. Acta Mater. 2004, 52, 5397–5404. [Google Scholar] [CrossRef]
- Sun, C.L.; Li, G.C.; Elgharib, G.M.; Xu, J.H.; Rong, H.Y. Experimental investigation on the mechanical properties of crushed coal samples based on the nanoindentation technique. J. China Coal Soc. 2020. [Google Scholar] [CrossRef]
- Oliver, W.; Pharr, G. An improved technique for determining hardness and elastic modulus using load and displacement sensing indentation experiments. J. Mater. Res. 1992, 7, 1564–1583. [Google Scholar] [CrossRef]
- Painter, P.; Starsinic, M.; Coleman, M. Determination of functional groups in coal by Fourier transform interferometry. Fourier Transform. Infrared Spectra 1985, 169–241. [Google Scholar] [CrossRef]
- Ibarra, J.; Muñoz, E.; Moliner, R. FTIR study of the evolution of coal structure during the coalification process. Org. Geochem. 1996, 24, 725–735. [Google Scholar] [CrossRef]
- Ibarra, J.V.; Munoz, E.R.; Bonet, A.J. FT-IR investigation on char formation during the early stages of coal pyrolysis. Fuel 1994, 73, 918–924. [Google Scholar] [CrossRef]
- Guo, Y.; Bustin, R. Micro-FTIR spectroscopy of liptinite macerals in coal. Int. J. Coal Geol. 1998, 36, 259–275. [Google Scholar] [CrossRef]
- Dutta, S.; Hartkopf-Fröder, C.; Witte, K.; Brocke, R.; Mann, U. Molecular characterization of fossil palynomorphs by transmission micro-FTIR spectroscopy: Implications for hydrocarbon source evaluation. Int. J. Coal Geol. 2013, 115, 13–23. [Google Scholar] [CrossRef]
- Song, Y.; Jiang, B.; Mathews, J.P.; Yan, G.; Li, F. Structural transformations and hydrocarbon generation of low-rank coal (vitrinite) during slow heating pyrolysis. Fuel Process. Technol. 2017, 167, 535–544. [Google Scholar] [CrossRef]
- Li, W.; Zhu, Y. Structural Characteristics of Coal Vitrinite during Pyrolysis. Energy Fuels 2014, 28, 3645–3654. [Google Scholar] [CrossRef]
- Liu, Y.; Zhu, Y.; Chen, S. Effects of chemical composition, disorder degree and crystallite structure of coal macromolecule on nanopores (0.4–150 nm) in different rank naturally-matured coals. Fuel 2019, 242, 553–561. [Google Scholar] [CrossRef]
- Suggate, R.; Dickinson, W. Carbon NMR of coals: The effects of coal type and rank. Int. J. Coal Geol. 2004, 57, 1–22. [Google Scholar] [CrossRef]
- Erdenetsogt, B.-O.; Lee, I.; Lee, S.K.; Ko, Y.-J.; Bat-Erdene, D. Solid-state C-13 CP/MAS NMR study of Baganuur coal, Mongolia: Oxygen-loss during coalification from lignite to subbituminous rank. Int. J. Coal Geol. 2010, 82, 37–44. [Google Scholar] [CrossRef]
- Malumbazo, N.; Wagner, N.; Bunt, J.; Van Niekerk, D.; Assumption, H. Structural analysis of chars generated from South African inertinite coals in a pipe-reactor combustion unit. Fuel Process. Technol. 2011, 92, 743–749. [Google Scholar] [CrossRef]
- Dong, J.; Cheng, Y.; Hu, B.; Hao, C.; Tu, Q.; Liu, Z.-D. Experimental study of the mechanical properties of intact and tectonic coal via compression of a single particle. Powder Technol. 2018, 325, 412–419. [Google Scholar] [CrossRef]
- Liu, F.; Yang, H.; Yang, M.; Wu, J.; Yang, S.; Yu, D.; Wu, X.; Wang, J.; Gates, I.D.; Wang, J. Effects of molecular polarity on the adsorption and desorption behavior of asphaltene model compounds on silica surfaces. Fuel 2021, 284, 118990. [Google Scholar] [CrossRef]
- Al-Malah, K.I. Aqueous solubility of a simple (single-carbon) organic molecule as a function of its size & dipole moment. J. Mol. Model. 2011, 17, 1029–1034. [Google Scholar] [CrossRef] [PubMed]
- Ge, T.; Zhang, M.X. Dielectric properties of the model compounds of thiophene sulfur in coals and its relation to molecular polarity. J. China Univ. Min. Technol. 2016, 45, 1245–1250. [Google Scholar]
- Dean, J.A. Hand Book of Organic Chemistry; McGraw-Hill: New York, NY, USA, 1987; pp. 450–500. [Google Scholar]
- Nishioka, M.; Larsen, J.W. Association of aromatic structures in coals. Energy Fuels 1990, 4, 100–106. [Google Scholar] [CrossRef]
- You, C.-Y.; Fan, X.; Zheng, A.-L.; Wei, X.-Y.; Zhao, Y.-P.; Cao, J.-P.; Zhao, W.; Zhou, C.-C.; Zhu, J.-L.; Chen, L.; et al. Molecular characteristics of a Chinese coal analyzed using mass spectrometry with various ionization modes. Fuel 2015, 155, 122–127. [Google Scholar] [CrossRef]
- Iino, M. Network structure of coals and association behavior of coal-derived materials. Fuel Process. Technol. 2000, 62, 89–101. [Google Scholar] [CrossRef]


| Sample | Coal Type | Petrographic Analysis (%) | |||
|---|---|---|---|---|---|
| Vitrinite | Inertinite | Other Groups | |||
| F1 | F1-V (Vitrinite) | Unaltered | 93.50 | 2.10 | 4.40 |
| F1-I (Inertinite) | 1.80 | 91.60 | 6.60 | ||
| F2 | F2-V (Vitrinite) | Cataclastic | 95.10 | 2.30 | 2.60 |
| F2-I (Inertinite) | 4.60 | 90.60 | 4.80 | ||
| F3 | F3-V (Vitrinite) | Porphyroclast | 94.80 | 3.30 | 1.90 |
| F3-I (Inertinite) | 3.40 | 92.60 | 4.00 | ||
| F4 | F4-V (Vitrinite) | Porphyroclast | 93.80 | 5.10 | 1.10 |
| F4-I (Inertinite) | 3.20 | 94.70 | 2.10 | ||
| F5 | F5-V (Vitrinite) | Scaly | 96.60 | 1.20 | 2.20 |
| F5-I (Inertinite) | 2.40 | 94.90 | 2.70 | ||
| F6 | F6-V (Vitrinite) | Powdery | 94.30 | 2.80 | 2.90 |
| F6-I (Inertinite) | 3.50 | 95.30 | 1.20 | ||
| Band Position (cm−1) | Assignments |
|---|---|
| 3600–3200 | -OH stretching |
| 3000–2800 | Aliphatic CH stretching |
| 1650–1520 | Aromatic C=C ring stretching |
| 1460–1350 | Aliphatic CH2 and CH3 deformation |
| 1200–1000 | C-O-C stretching |
| 900–700 | Aromatic C-H (out-plane bending modes) |
| Sample | Vitrinite | Inertinite | |||||||||||
|---|---|---|---|---|---|---|---|---|---|---|---|---|---|
| F1-V | F2-V | F3-V | F4-V | F5-V | F6-V | F1-I | F2-I | F3-I | F4-I | F5-I | F6-I | ||
| H (GPa) | Data: 1 | 0.443 | 0.402 | 0.404 | 0.414 | 0.390 | 0.308 | 0.572 | 0.695 | 0.574 | 0.542 | 0.486 | 0.373 |
| Data: 2 | 0.441 | 0.426 | 0.390 | 0.400 | 0.387 | 0.291 | 0.780 | 0.830 | 0.543 | 0.673 | 0.555 | 0.400 | |
| Data: 3 | 0.456 | 0.417 | 0.402 | 0.414 | 0.399 | 0.283 | 0.612 | 0.623 | 0.544 | 0.450 | 0.454 | 0.413 | |
| Data: 4 | 0.428 | 0.443 | 0.450 | 0.404 | 0.361 | 0.278 | 1.378 | 0.679 | 0.617 | 0.615 | 0.494 | 0.426 | |
| Data: 5 | 0.409 | 0.446 | 0.422 | 0.402 | 0.367 | 0.378 | 1.517 | 0.841 | 0.871 | 0.481 | 0.446 | 0.429 | |
| Mean | 0.435 | 0.427 | 0.414 | 0.407 | 0.381 | 0.308 | 0.972 | 0.734 | 0.630 | 0.552 | 0.487 | 0.408 | |
| Standard deviation | 0.016 | 0.016 | 0.021 | 0.006 | 0.014 | 0.037 | 0.397 | 0.087 | 0.124 | 0.083 | 0.039 | 0.020 | |
| E (GPa) | Data: 1 | 5.108 | 5.227 | 5.261 | 5.261 | 5.494 | 6.124 | 7.347 | 7.588 | 6.932 | 4.839 | 4.830 | 6.794 |
| Data: 2 | 4.857 | 5.552 | 5.291 | 5.152 | 5.325 | 6.731 | 8.215 | 7.771 | 7.053 | 12.158 | 5.100 | 6.686 | |
| Data: 3 | 5.180 | 5.383 | 5.267 | 5.309 | 5.520 | 7.810 | 7.384 | 6.770 | 7.252 | 5.021 | 5.295 | 6.845 | |
| Data: 4 | 4.935 | 5.721 | 5.155 | 5.007 | 4.891 | 6.191 | 9.309 | 6.735 | 6.819 | 6.443 | 5.372 | 6.643 | |
| Data: 5 | 4.884 | 5.383 | 5.340 | 5.529 | 5.337 | 5.674 | 9.707 | 7.070 | 6.570 | 4.339 | 5.160 | 6.619 | |
| Mean | 4.993 | 5.453 | 5.263 | 5.252 | 5.313 | 6.506 | 8.392 | 7.187 | 6.925 | 6.560 | 5.151 | 6.717 | |
| Standard deviation | 0.128 | 0.169 | 0.061 | 0.173 | 0.226 | 0.733 | 0.971 | 0.423 | 0.228 | 2.885 | 0.187 | 0.088 | |
| Name | Molecular Formula | Molecular Structure | Calculated Dipole Moment (unit: debey, D) | Experimental Dipole Moment from Dean (1987) [47] (unit: debey, D) | |
|---|---|---|---|---|---|
| Isobutylbenzene | C10H14 | 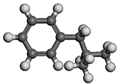 |  | 0.33 | 0.31 |
| Sec-butylbenzene | C10H14 |  | 0.31 | 0.37 | |
| Ethylbenzene | C8H10 | 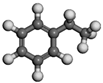 | 0.37 | / | |
| Methylbenzene | C7H8 |  | 0.41 | 0.45 | |
| Naphthalene | C10H8 | 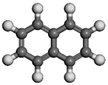 |  | 0.00 | / |
| Phenanthrene | C14H10 |  | 0.05 | / | |
| 1-Methyl naphthalene | C11H10 | 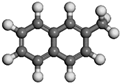 |  | 0.53 | |
| 1-Methyl phenanthrene | C15H12 |  | 0.60 | ||
| 2-Ethylnaphthalene | C12H12 | 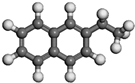 |  | 0.69 | |
| 2-Ethylphenanthrene | C16H14 | 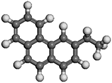 | 2.41 | ||
Publisher’s Note: MDPI stays neutral with regard to jurisdictional claims in published maps and institutional affiliations. |
© 2020 by the authors. Licensee MDPI, Basel, Switzerland. This article is an open access article distributed under the terms and conditions of the Creative Commons Attribution (CC BY) license (http://creativecommons.org/licenses/by/4.0/).
Share and Cite
Wang, A.; Cao, D.; Wei, Y.; Liu, Z. Macromolecular Structure Controlling Micro Mechanical Properties of Vitrinite and Inertinite in Tectonically Deformed Coals—A Case Study in Fengfeng Coal Mine of Taihangshan Fault Zone (North China). Energies 2020, 13, 6618. https://doi.org/10.3390/en13246618
Wang A, Cao D, Wei Y, Liu Z. Macromolecular Structure Controlling Micro Mechanical Properties of Vitrinite and Inertinite in Tectonically Deformed Coals—A Case Study in Fengfeng Coal Mine of Taihangshan Fault Zone (North China). Energies. 2020; 13(24):6618. https://doi.org/10.3390/en13246618
Chicago/Turabian StyleWang, Anmin, Daiyong Cao, Yingchun Wei, and Zhifei Liu. 2020. "Macromolecular Structure Controlling Micro Mechanical Properties of Vitrinite and Inertinite in Tectonically Deformed Coals—A Case Study in Fengfeng Coal Mine of Taihangshan Fault Zone (North China)" Energies 13, no. 24: 6618. https://doi.org/10.3390/en13246618