Article

Real-Time Monitoring of the Thermal Effect for the Redox Flow Battery by an Infrared Thermal Imaging Technology

1
Program in Materials and Chemical Engineering, National United University, Miaoli 36063, Taiwan
2
Department of Chemical Engineering, National United University, Miaoli 36063, Taiwan
3
Department of Electrical Engineering, National United University, Miaoli 36063, Taiwan
*
Author to whom correspondence should be addressed.
Energies 2020, 13(24), 6717; https://doi.org/10.3390/en13246717
Submission received: 14 October 2020 / Revised: 29 November 2020 / Accepted: 15 December 2020 / Published: 19 December 2020
(This article belongs to the Section D: Energy Storage and Application)

Abstract

:
In this study, a new monitoring method was developed, titled infrared thermal imaging technology, which can effectively evaluate the thermal effect of the charge-discharge test in the vanadium/iodine redox flow battery (V/I RFB). The results show that the all-vanadium redox flow battery (all-V RFB) has a greater molar reaction Gibbs free energy change than that of the V/I RFB, representing a large thermal effect of the all-V RFB than the V/I RFB. The charge-discharge parameters, flow rate and current density, are important factors for inducing the thermal effect, because of the concentration polarization and the ohmic resistor. The new membrane (HS-SO3H) shows a high ion exchange capacity and a good ions crossover inhibitory for the V/I RFB system, and has a high coulomb efficiency that reaches 96%. The voltage efficiency was enhanced from 61% to 86% using the C-TiO2-Pd composite electrode as a cathode with the serpentine-type flow field for the V/I RFB. By adopting the high-resolution images of an infrared thermal imaging technology with the function of the temperature profile data, it is useful to evaluate the key components’ performance of the V/I RFB, and is a favorable candidate in the developing of the redox flow battery system.

Graphical Abstract

1. Introduction

The redox flow battery (RFB) generates heat when consuming the electric power in its working state, and that will transfer into a thermal form emitted from the normal or abnormal state. Therefore, it is important to control the thermal effect for the battery’s performance and safety improvement. Specifically, the RFB will bring a big thermal effect when the cell is charged-discharged by the higher electric current. Due to the different battery’s components and stack designs, the problems of the RFB system can be identified by looking at the uneven heat distribution, the reduction of the battery’s performance and life cycle.
Consequently, it is important to understand the battery’s thermal effect in high-rate discharge or its thermal effect in overcharge cases for the state of the battery’s health. The all vanadium redox flow battery (all-V RFB) is the most prospective RFB energy storage system [1]. The key materials of an all-V RFB comprised of a separation membrane, an electrode, an electrolyte, and a flow channel [2,3,4,5,6,7] these which can induce a different thermal effect. The key factors, which affect the temperature evolution of an all-V RFB during the charge-discharge operations, include the reversible and irreversible enthalpy and entropy change of the electrochemical reactions, and the self-discharge circumstances due to the ion cross-contamination [8,9,10]. Moreover, in a kW-class RFB at high current operations occurs the shunt currents, hydraulic pressure drops and pumping, and species crossover losses [11]. More recently, Guarnieri et al. [12] provided a key electrolyte flow factor modulation to quite sustain the stack current at every state of charge (SOC) for a 9 kW-class all-V RFB. M. Pugach et al. [13] developed the real-time control-monitoring software to control the output feedback of the flow rate for the VRFB. A. Trovò et al. [14] established the standby thermal management system for a kW-class VRFB by using a cell-resolved dynamic thermal model through the experimental and numerical investigation to decide the stack voltage, self-discharge, and temperature evolution.
Some thermal analyses of the VRFB have been established by two and three-dimensional numerical models, which can obtain the temperature’s detailed distribution information [15,16]. The full nonlinear computational fluid dynamics model (CFD) was suitable for the dynamics simulation of the electrolyte temperature, which reduced the computational simulation time and solved the high computational complexity [17]. In addition, the pumping energies loss was included in the influencing factors for the dynamic thermal simulation model by studying some of the literature [8,17,18]. However, there are still some problems that need to be improved. The heat source is simplified in the thermal model to the entropy change of the electrode reaction in the chemical reaction, which will reduce its accuracy, and the temperature is often considered an ideal uniform distribution. The above assumptions will affect the thermal model. According to the chemical thermodynamics, macroscopic changes at constant pressure and temperature, the condition for spontaneity is Δ G r o < 0 and the relationship of the molar Gibbs free energy change ( Δ G r o ), molar reaction enthalpy change ( Δ H r o ) and molar reaction entropy change ( Δ S r o ) are expressed in Equation (1).
Δ G r o   =   Δ H r o     T Δ S r o
In electrolyte solutions, the cell potential under reversible conditions is directly concerning to the Gibbs free energy, entropy, and enthalpy. If this reaction is performed reversibly, the electrical work done is equal to the product of the charge and the potential difference ( Δ E r o ) by mean of which the charge is moved. Thus, the electric work done is equal to Gibbs free energy difference ( Δ G r o ), but the sign is converse, as shown in Equation (2).
Δ G r o   =   n F Δ E r   o
The reaction entropy ( Δ S r o ) is related to Δ G r o by Equation (3), therefore, a measurement of the temperature (T) dependence of E r o can be applied to determine the entropic heat ( Δ S r o ) [15], where n, E r o , and F are the molar number of electrons involved in the oxidation and reduction reactions, the standard potential of a cell reaction and Faraday constant. In thermoelectrochemical models, the ( Δ S r o ) of the cell can be calculated, which quantity represents the heat output or consumption of the cell. The Δ S r o is proportional to the (∂ E r o /∂T) (also called the ‘‘temperature coefficient’’), which is the partial derivative of the cell potential with temperature, as shown in Equation (3) [19,20].
Δ S r o   =   ( Δ G r o T )   =   n F ( E r o T )
Infrared thermal imaging (ITI) technology is a non-contact measurement. The measuring devices take infrared radiation emitted by an object and convert it into an electronic signal [21]. Infrared radiation is the energy radiated by the surface of an object whose temperature exceeds absolute zero [22]. The radiation emitted is a function of the material temperature; the higher the temperature, the greater the intensity of the infrared energy emitted. According to the Stefan–Boltzmann formula, the total radiation intensity (W) of the opaque radiators can be expressed as Equation (4), where T is the measured temperature, and Te is the room temperature. σ is the Stefan–Boltzmann constant, the ε and ρ represent the emissivity and reflectivity of the material surface, which can be considered a constant [23].
W   =   ε   × σ   × T 4 + ρ   × σ   × T e 4
Temperature is one of the significant factors affecting battery performance and lifetime; ITI can provide particular advantages in this field. Therefore, there are many previous studies that apply ITI to monitor the battery temperature behavior. Some investigators used the ITI technology to detect and analyze the thermal effect of the lithium batteries, because the ITI has many advantages, such as the non-destructive detection, non-contact measurement, rapid temperature measurement, and high sensitivity [24,25]. For example, by the ITI monitoring investigated to detect defective electrical equipment, such as power transformers, current transformers, uninterruptible power supply (UPS), lightning arresters and many others [26,27,28]. However, there is no literature that utilizes the ITI technology to real-time monitor the thermal effect of the RFB system in the charge-discharge cycle. ITI can detect a certain area of the temperature change, whereby the analysis can effectively identify the real hot spots and make further improvements for the RFB system’s design.
A single cell for a vanadium/iodine redox flow battery (V/I RFB) with a Naftion-117 membrane as separator and a C-TiO2-Pd composite electrode as a cathode was designed by our laboratory [29,30], which showed that the amount of vanadium salt can be decreased by combining the large stack modules of the system. The TiO2 particles between a carbon matrix and Pd metal layers enhance the active surface area of an electrode and can improve the electrocatalytic effect, so as to demonstrate a higher VE%. In addition, adding ascorbic acid can effectively improve the redox reversibility for the I2 active species electrolyte. In the low concentration of sulfuric acid, the V/I RFB can efficiently improve the corrosion problem of the flow channel and the electrode for a longer working period. Therefore, this V/I RFB has not only low costs, but also exhibits good potential for applications in the energy storage systems. Apart from this, some semi-vanadium RFBs with excellent energy efficiency, such as V/Fe, V/Ce, and V/Br have been fabricated [31,32,33]. The V/I RFB ( Δ G r o = −45 KJ/mole) and all-V RFB ( Δ G r o = −129.9 KJ/mole) show a large difference for the Δ G r o to transfer the electrical work ( Δ E r o ), so that the thermal effect is obvious by monitoring the ITI. The cell’s standard electrode potentials ( Δ E r o ) of the Fe/V, V/Fe, and V/Br are 1.02 V, 1.61 V, and 1.18 V, respectively, and Gibbs free energies are −98.4 KJ/mole, −155.3 KJ/mole, and −113.9 KJ/mole by Equation (2), respectively. The thermal difference effect is similar to the all-V RFB for the chemical energy transfers to electric energy.
In this study, a novel real-time monitoring by the ITI technology is used to monitor the thermal effects, and to measure thermodynamic quantities for the RFB reactions in the charge-discharge cycles by modifying the key materials and parameters for this V/I RFB. The modified key materials included a new low-cost separation membrane (HS-SO3H), and the C-TiO2-Pd electrode was synthesized through a sol-gel process and an electroless plating to deposit the Pd metal on the carbon paper/titanium dioxide electrode (C-TiO2) [29]. The ITI with high-resolution images and the function of the temperature profile data can detect a certain area of the temperature change, whereby the analysis can effectively identify the real hot spots, and make further improvements for the RFB system’s design.

2. Experimental

Each single cell of the all-V RFB and V/I RFB was designed, which included of a pair of electrodes, two half-cell electrolytes, an ion exchange membrane as a separator, a pair of flow channels, and a pair of current collectors, as illustrated in Figure 1. We modified the ion exchange membrane and graphite carbon paper electrode by the free-radical photo-polymerization, sol-gel process, and electroless plating.

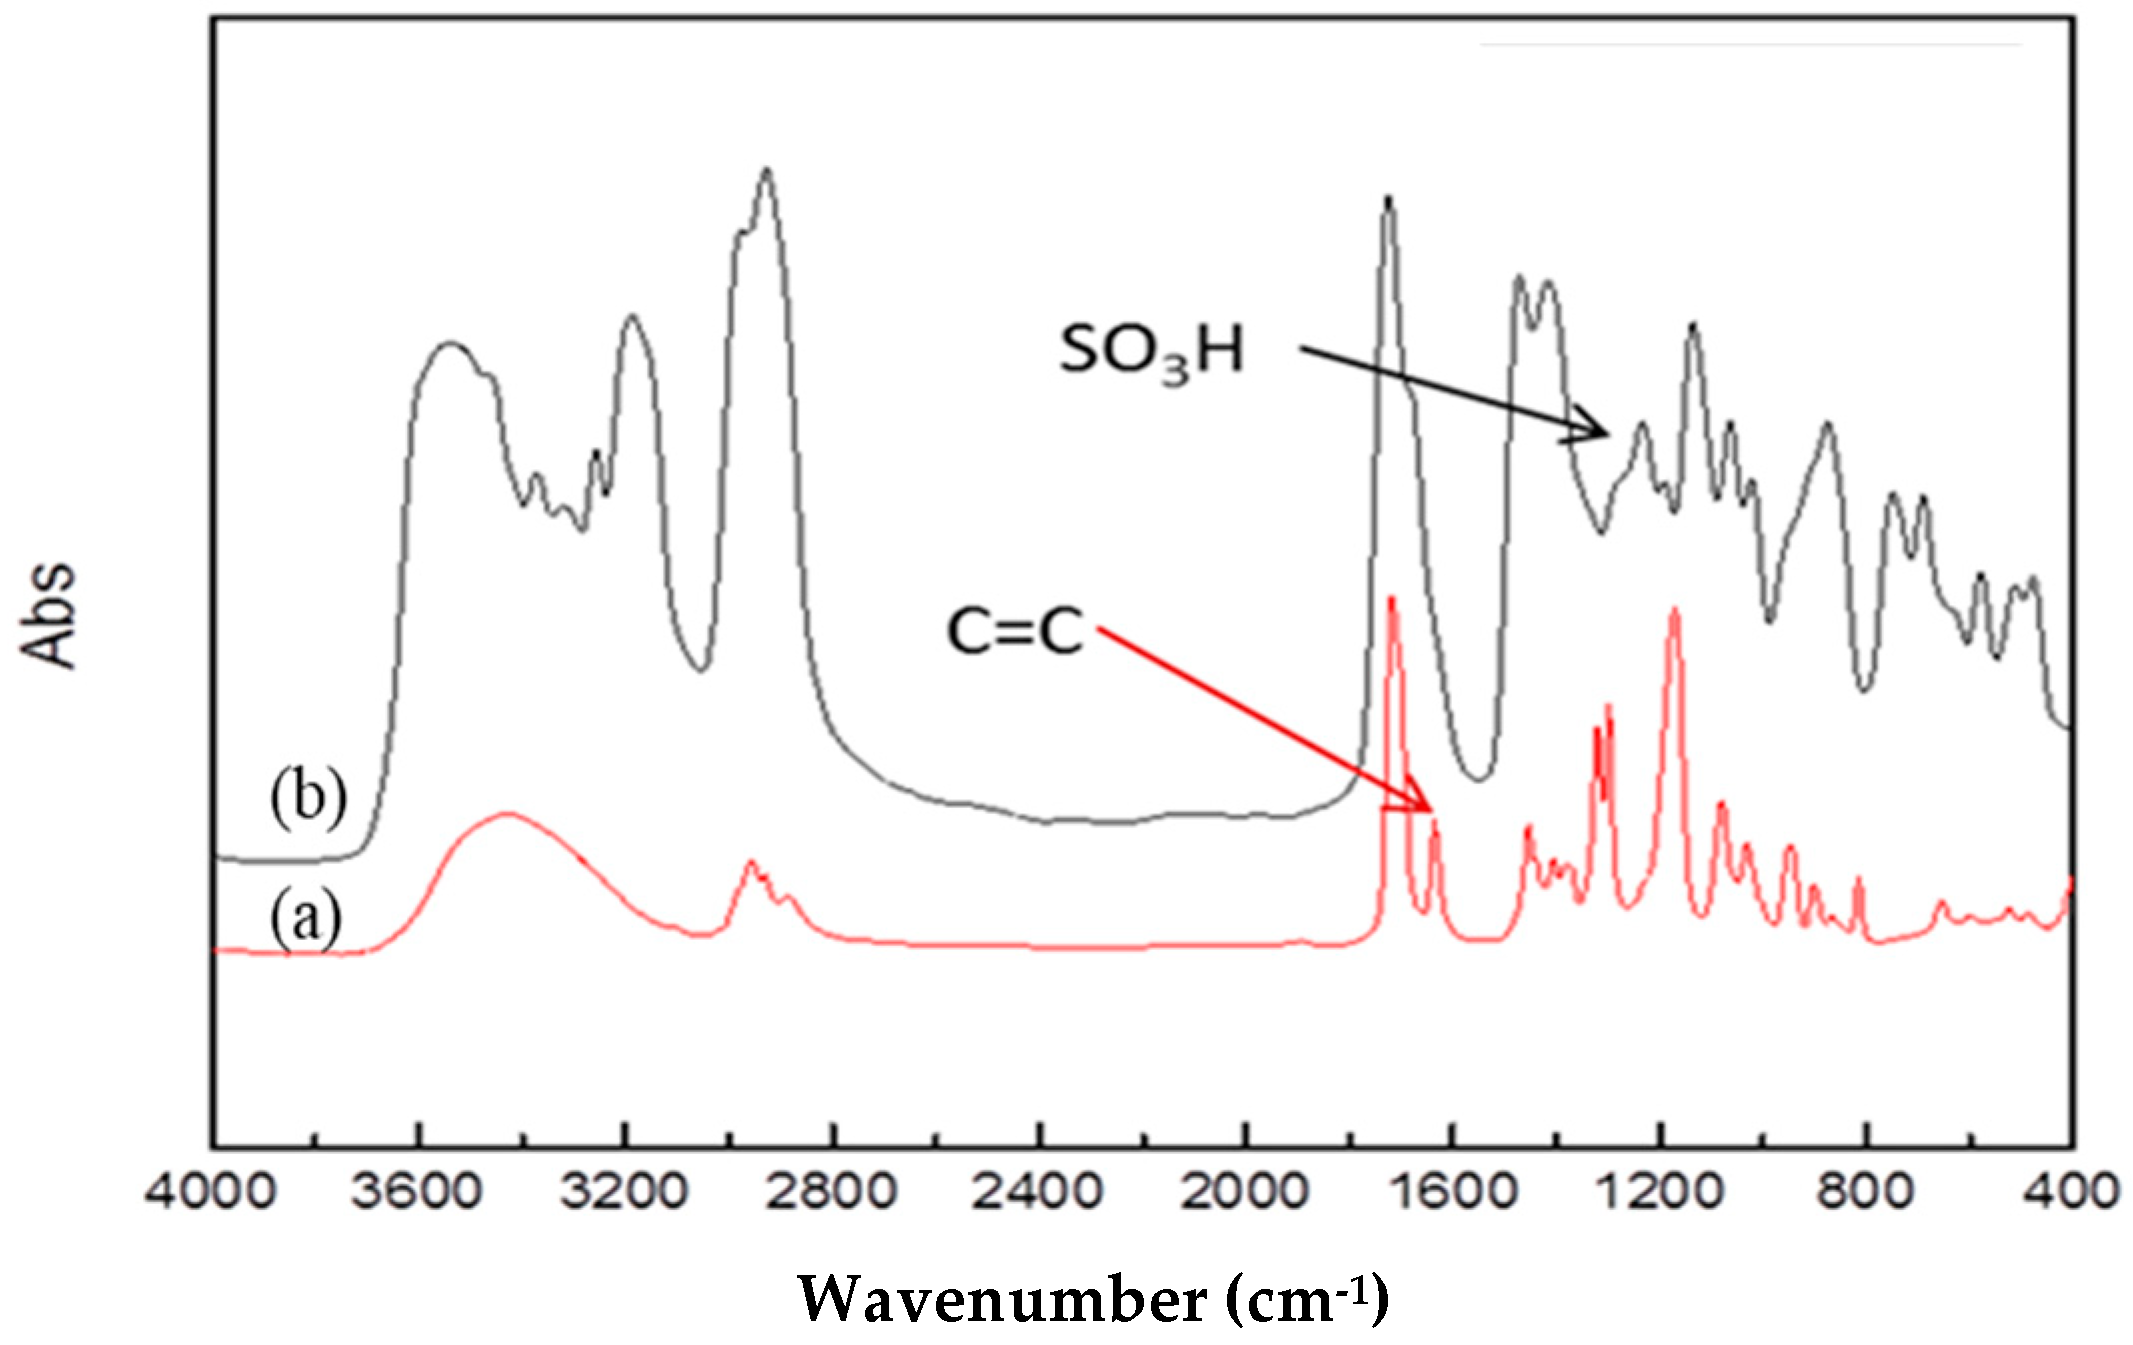
2.1. Synthesis and Basic Property Measurement of HS-SO3H Membrane

Photo-polymerization of a fixed amount of hydroxyethylmethacrylate (HEMA) mixed with sodium vinyl sulfonate (SVS) monomers, using triethylene glycol dimethacrylate (TEGDMA) as a cross-linking agent and UV-184 as a photo-initiator, were carried out with the power of 5Watt UV-light in a 5 × 5 cm2 dich to obtain the primeval membrane. Then, this membrane was washed by ethanol to remove the un-reactant and was soaked in HCl aqueous solution for 24 h to form the HS-SO3H membrane. The structural characteristics of the HS-SO3H ion exchange membrane was identified by a Fourier transform infrared spectrometer FT-IR (U-2001, HITACHI, Tokyo, Japan) in absorption mode, and looking at the wavelength ranging from 400 to 4000 cm−1 with a resolution of 4 cm−1.

2.1.1. Ion Exchange Capacity

The ion exchange capacity (IEC) was carried out by an acid-base titration method. First of all, the HS-SO3H ion exchange membrane with sulfonic acid groups was soaked in excessive 0.1 M NaOH solution for 24 h to exchange the fixed H+ ions by Na+ ions [30,34]. The unreacted NaOH solution was inverse titrated by 0.1 M HCl solution, and the IEC could be expressed by Equation (5):
IEC   =   N NaOH V NaOH     N HCl V HCl W sample
where NNaOH × VNaOH is the total micromoles of NaOH solution and NHCl × VHCl is the consumed moles by HCl solution inverse-titrated, and the Wsample is the weight of the HS-SO3H ion exchange membrane.

2.1.2. Water Uptake

Water uptake is expressed by Equation (6), where Ww is the weight of the wetted membrane after this membrane has been soaked in pure water for 24 h and Wd is the weight of the dry membrane [30,34].
Water   uptake   =   W w     W d W d   ×   100 %

2.1.3. Dynamic Permeability

The previous literature has discussed the ion permeability focused on the positive V4+ ion by a pseudo-steady-state condition for an all-V RFB, however, the change in others vanadium ions concentrations in the negative reservoir were always negligible [35,36]. In the V/I RFB, we measured the permeability of total ions in the charge-discharge cycle by the electrolyte tank with a precise scale, which can truly obtain the dynamic permeability between the vanadium electrolyte and the negative iodine electrolyte. The dynamic permeability (mL/s) corresponds to as the volume difference dividing the charge-discharge cycle time. We set the charge-discharge cycle to 10 h.

2.2. Fabrication of C-TiO2-Pd Electrode

Graphite carbon paper electrode (C-electrodes; Shenhe Carbon Fiber Materials Co. Ltd., Liaoning, China) was modified by a sol-gel technique and an electroless plating process to obtain the C-TiO2-Pd composite electrode through our previous study [29]. First of all, the C-TiO2 electrode was prepared by the tetrabutyric acid mixed with EtOH/HCl (pH = 1) aqueous solution at a tetrabutyric acid: ethanol: hydrochloric acid molar ratio of 1:8:4 in a flask and stirred to perform the hydrolysis reaction at room temperature for one hour. The compositions of the electroless plating solution were 19 g/L Na2C4H4O4·6H2O, 10 g/L PdCl2, 8.5 g/L HCl, and 25.6 g/L C2H4 (NH2)2. The effective area of the electrode was 5 × 5 cm2; then, the C-TiO2-Pd composite electrode was prepared by an electroless plating process and sintering at 400 °C of an oven for one hour.

2.3. The Preparation of Iodine/Ascorbic Acid Electrolyte Solution

Two electrolytic solutions, 1.0 M VOSO4/2.0 M H2SO4 solution and 1.0 M I2 solution, were employed as positive and negative electrolytes, respectively. These electrolyte solutions were prepared by dissolving the VOSO4 (Sigma-Aldrich, Merck, St. Louis, Missouri, US) in a 2.0 M H2SO4 solution, and the iodine solutions were acquired by dissolving the potassium iodate (KIO3) and potassium iodide (KI) in a 2.0 M H2SO4 solution reaction. Moreover, the 1 wt% of ascorbic acid solution was added to the iodine solutions to promote the redox reaction on the electrodes [29]. All chemical reagents were of analytical reagent grade.

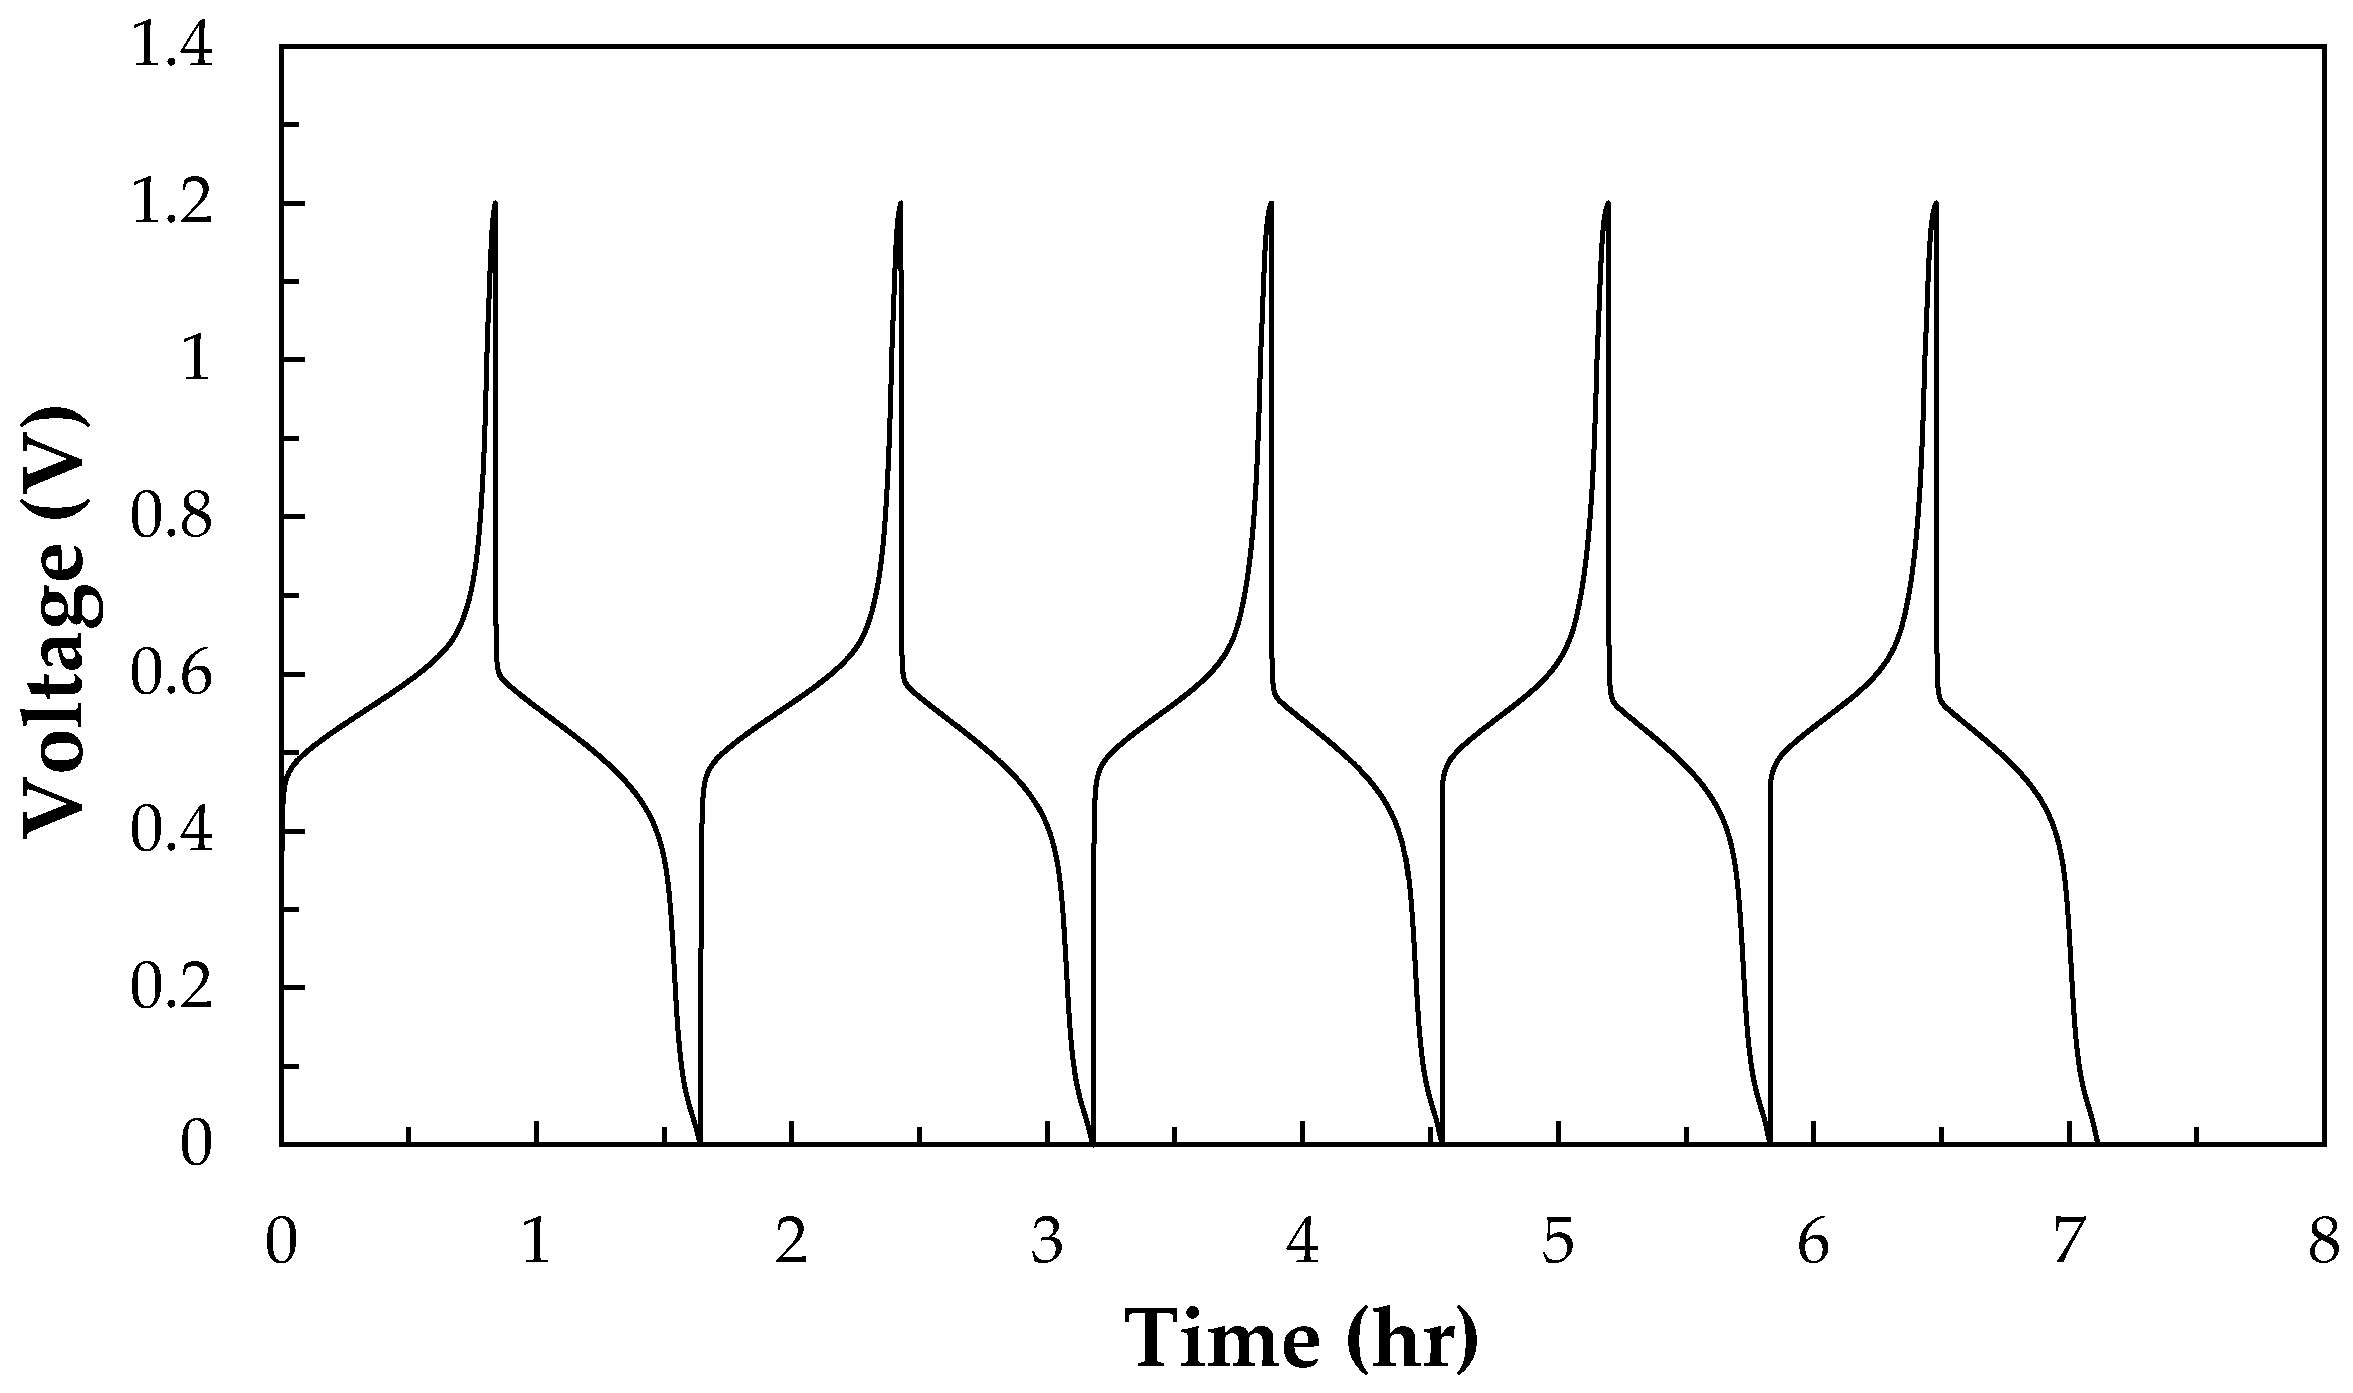
2.4. Charge-discharge Test Apparatus

The volume of the electrolyte solutions in each half-cell tank was 20 mL, which were cyclically pumped into the corresponding half-cell tank. A charge-discharge test was carried out by a battery cycler system WBCS3000 (WonATech, Seoul, Korea) and CT2001C-10 V/2A (Wuhan Land Co., Wuhan, China). Thermal effects of the all-V RFB and the V/I RFB were monitored by the ITI in the charge-discharge cycle with different electrolyte, charge-discharge parameters, membrane, electrode, and channel model. Thermal effect analysis of the parameter conditions for charge-discharge test include current density and flowing rate. The coulombic efficiency (CE%), voltage efficiency (VE%), and energy efficiency (EE%) are expressed by Equations (7)–(9) [37]:
CE = I d d t I c d t   ×   100 %
VE = V d I d d t V d I c d t   ×   100 %
EE = CE   ×   VE
where Ic and Id are the capacity of charge-discharge test, and Vc and Vd are the voltage of charge-discharge test, respectively.
The ITI used a G100EXD model (Nippon Avionics Co., Ltd., Yokohama, Japan), which has a temperature range of −40 °C to 1500 °C, and the resolution of temperature is 0.04 °C. The G100EXD also has a greater instantaneous field of view (IFOV) up to 1.78 milliradian (mrad), which allowed us to accurately measure an object with a size of 0.534 cm at a distance of 1 M.

3. Results and Discussion

3.1. Charge-discharge Test and Thermal Effect of All-V RFB and V/I RFB Systems

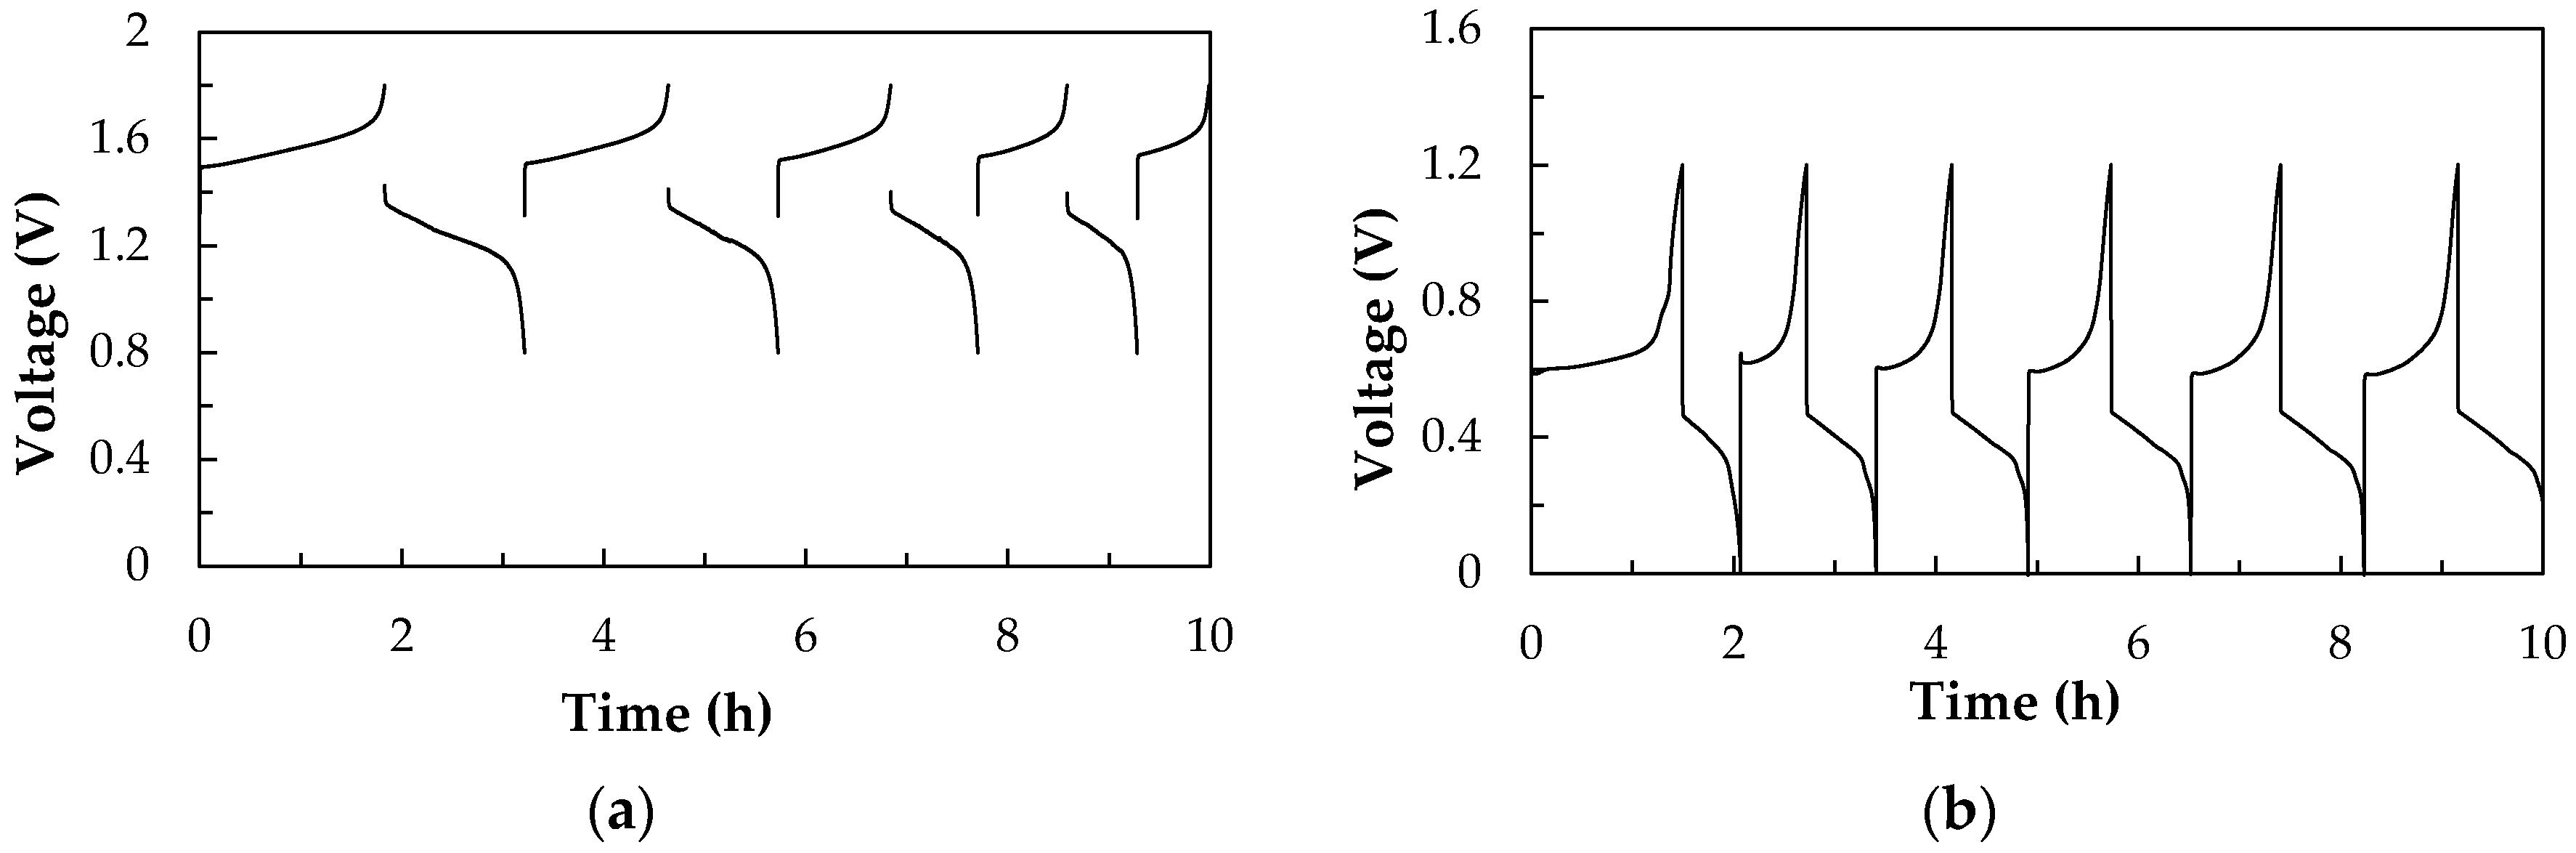
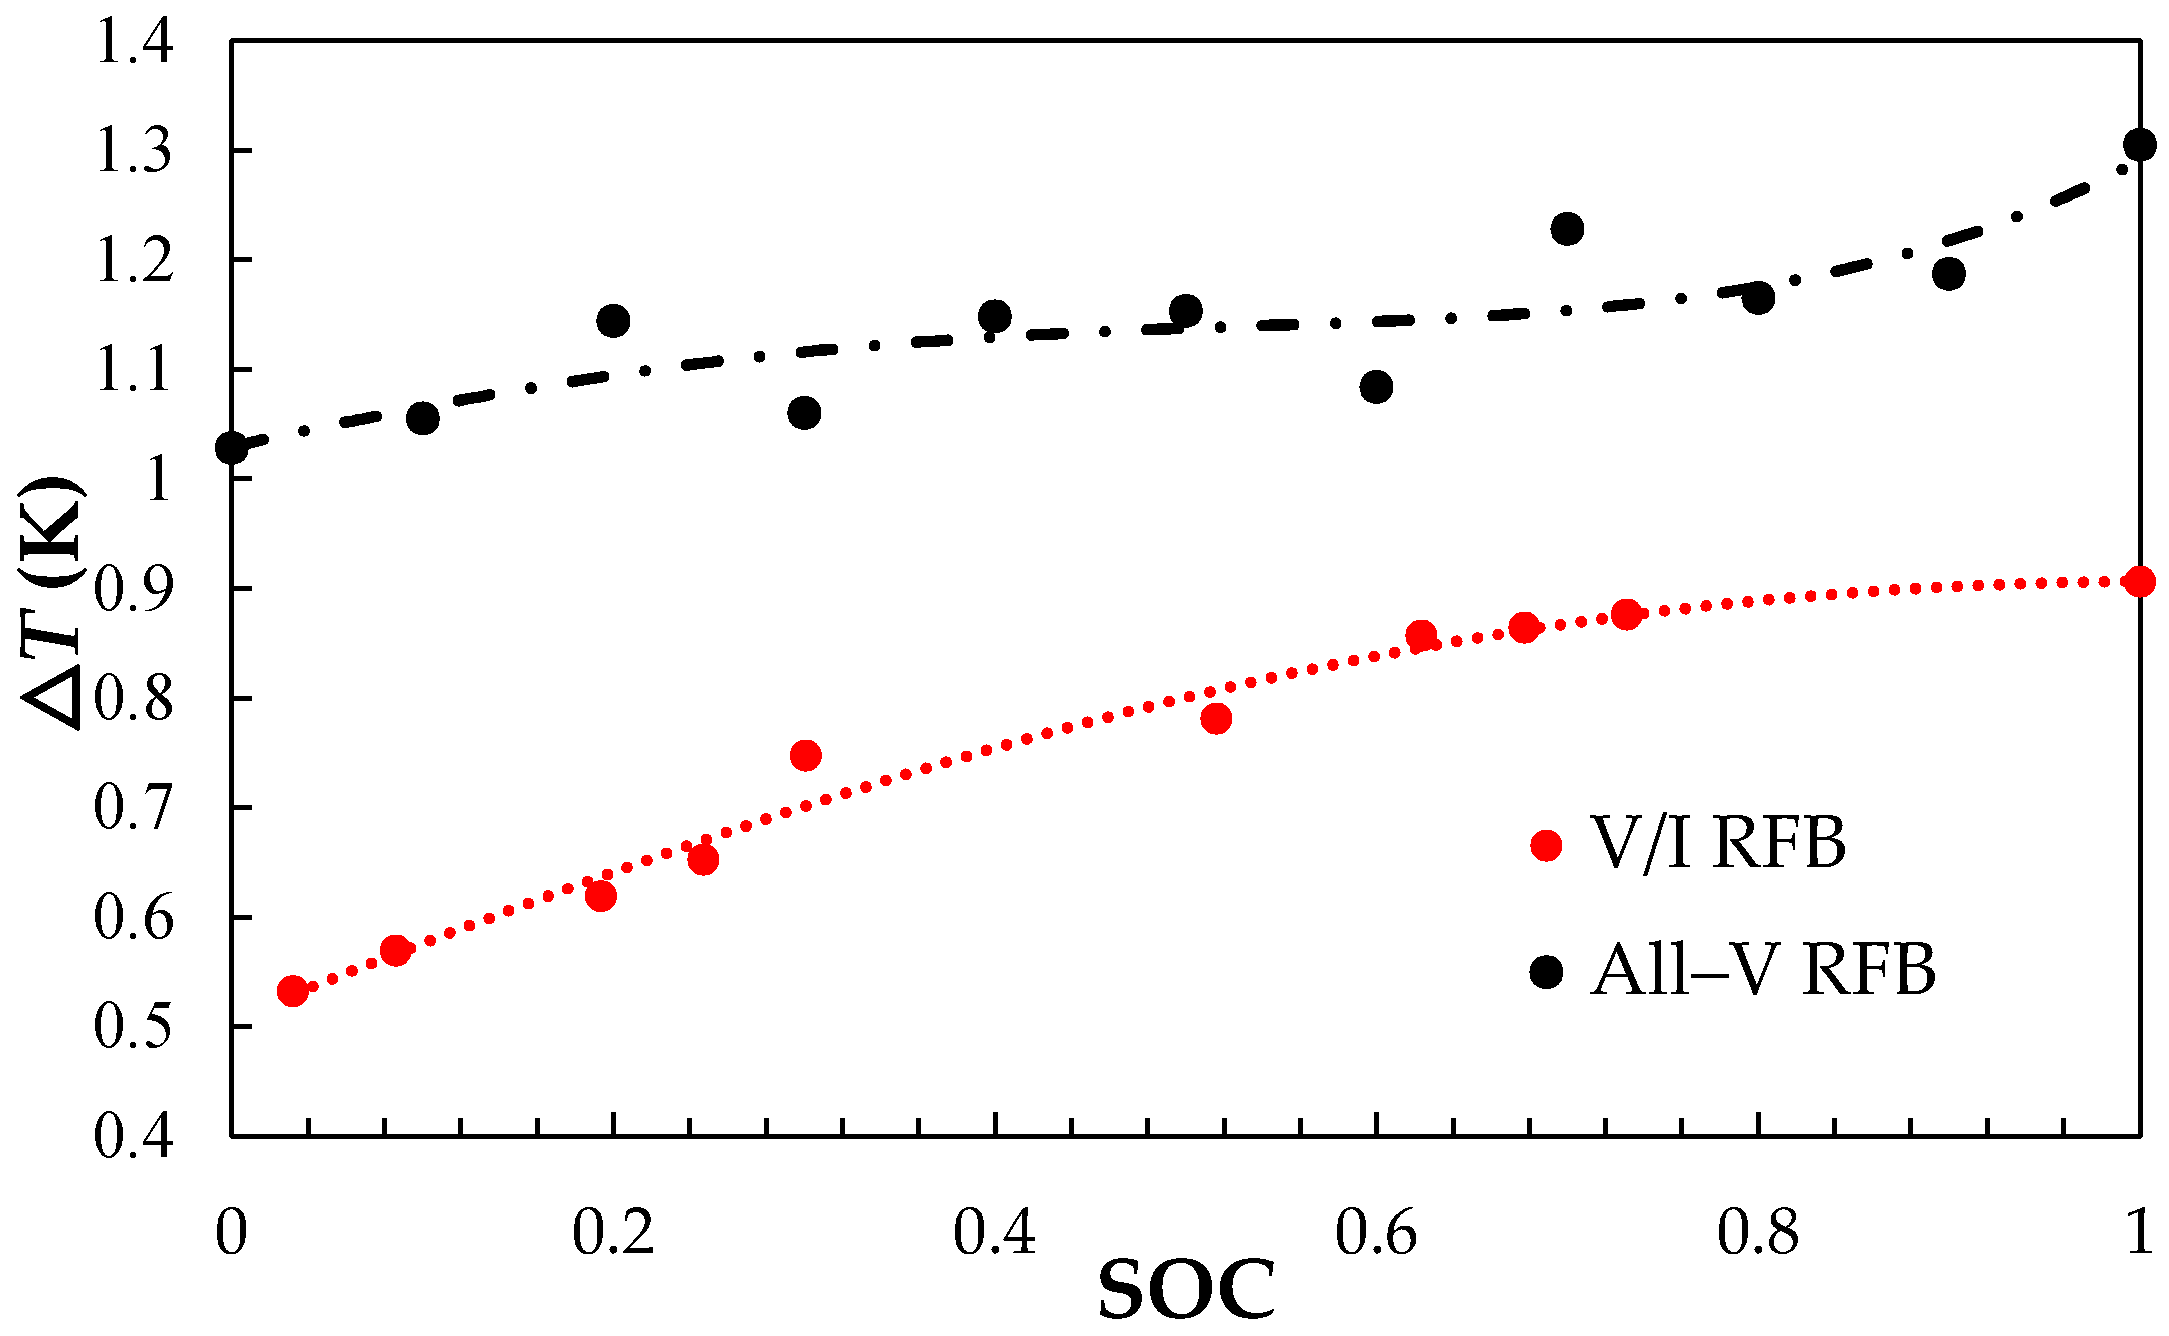
3.1.1. Charge-discharge Performances and Thermal Effect of All-V RFB and V/I RFB Systems

Both the all-V RFB and V/I RFB are redox flow batteries where the electrolytes circulate between two half-cell electrolytic cells and the storage tanks. During the charge-discharge cycle, (10)–(15) equations are the reactions that take place on the electrodes.

For All-V RFB System

  • Positive reaction
    VO 2 +   +   2 H + +   e charge discharge   VO 2 +   +   H 2 O E o   =   + 1.00   V   vs .   SHE
  • Negative reaction
    V 2 + charge discharge   V 3 +   +   e E o   =   0.26   V   vs .   SHE
  • Overall reaction
    VO 2 +   +   2 H +   + V 2 + charge discharge   VO 2 +   +   V 3 + +   H 2 O E r o   =   + 1.26   V
    Δ H r o = 155.6 KJ/mole.

For V/I RFB System

  • Positive reaction
    VO 2 +   +   2 H + +   e charge discharge   VO 2 +   +   H 2 O E o   =   + 1.00   V   vs .   SHE
  • Negative reaction
      I charge discharge 1 / 2   I 2   +   e E o   =   0.54   V   vs .   SHE
  • Overall reaction
    VO 2 +   +   2 H +   +   I charge discharge   VO 2 +   + 1 / 2   I 2   +   H 2 O E r o   =   + 0.46   V  
    Δ H r o = 67.4 KJ/mole.
Figure 2 shows the performances of the all-V RFB and V/I RFB without the modified key materials during the charge-discharge tests for 10 h. The Nafion 117 (N-117) membrane is as a separator and carbon paper electrodes as the anode and cathode with a serpentine-type flow channel. The cell’s average performances of four cycles, CE%, VE%, and EE% were calculated by Equations (7) to (9), as shown in Table 1. The all-V RFB system presents a higher EE% (62%) than that of the V/I RFB (57%), because the V/I RFB shows a lower VE% (61%); however, it shows a higher CE% (93%) and a discharge capacity (495 mAh) than of that of the all-V RFB (79%) and (416 mAh). This means that all-V RFBs experience crossover and no cross contamination, however, less are shown for the V/I RFB. In addition, the carbon paper electrode may be unapplicable in the cathode of the V/I RFB because it presents a lower VE%.
The thermodynamic data of Table 2 shows that the standard formation enthalpy ( Δ H r o ) of the all-V RFB electrolyte was reported from the literature [19,20], the estimated values of the Δ H r o , Δ G r o and Δ S r o of the all-V RFB during discharging were −155.6 kJ mol−1, −129.9 kJ mol−1 and −121.7 J K−1 mol−1, respectively. It can be found from Table 2 that the Δ H r o , Δ G r o and Δ S r o of V/I RFB during discharging was −67.4 kJ mol−1, −45.0 kJ mol−1, and −75.0 J mol−1 K−1 mol−1, respectively. From the reactions of Equations (1)–(3) at 298.15 K, the all-V RFB has a greater Δ G r o than that of the V/I RFB, so that the high standard potential, E r o was close to 1.26 V, and can be obtained from the former system; the latter system was about 0.46 V. These values agree with the theoretical standard potential of Equations (12) and (15) for the all-V RFB and V/I RFB electrochemical reactions. Figure 3 shows the temperature change (ΔT) of the charge-discharge of the all-V RFB and V/I RFB as a function of the SOC. The all-V RFB has a greater Gibbs free energy ( Δ G r o ) than the V/I RFB, and shows a larger ΔT than that of the V/I RFB, the ΔT > 1.0 °C for all SOC and the highest ΔTmax was about 1.31 °C at 100% SOC, as shown in Figure 3 Therefore, the V/I RFB can not only reduce the amount of vanadium salt and keep the cost down, but can also decrease the thermal effect, ΔT < 1.0 °C at all SOC, the highest ΔTmax was about 0.90 °C at 100% SOC, as shown in Table 1. The key materials, such as electrodes, separation membrane, and flow channel were further improved, and the overall efficiency can be enhanced for the V/I RFB.

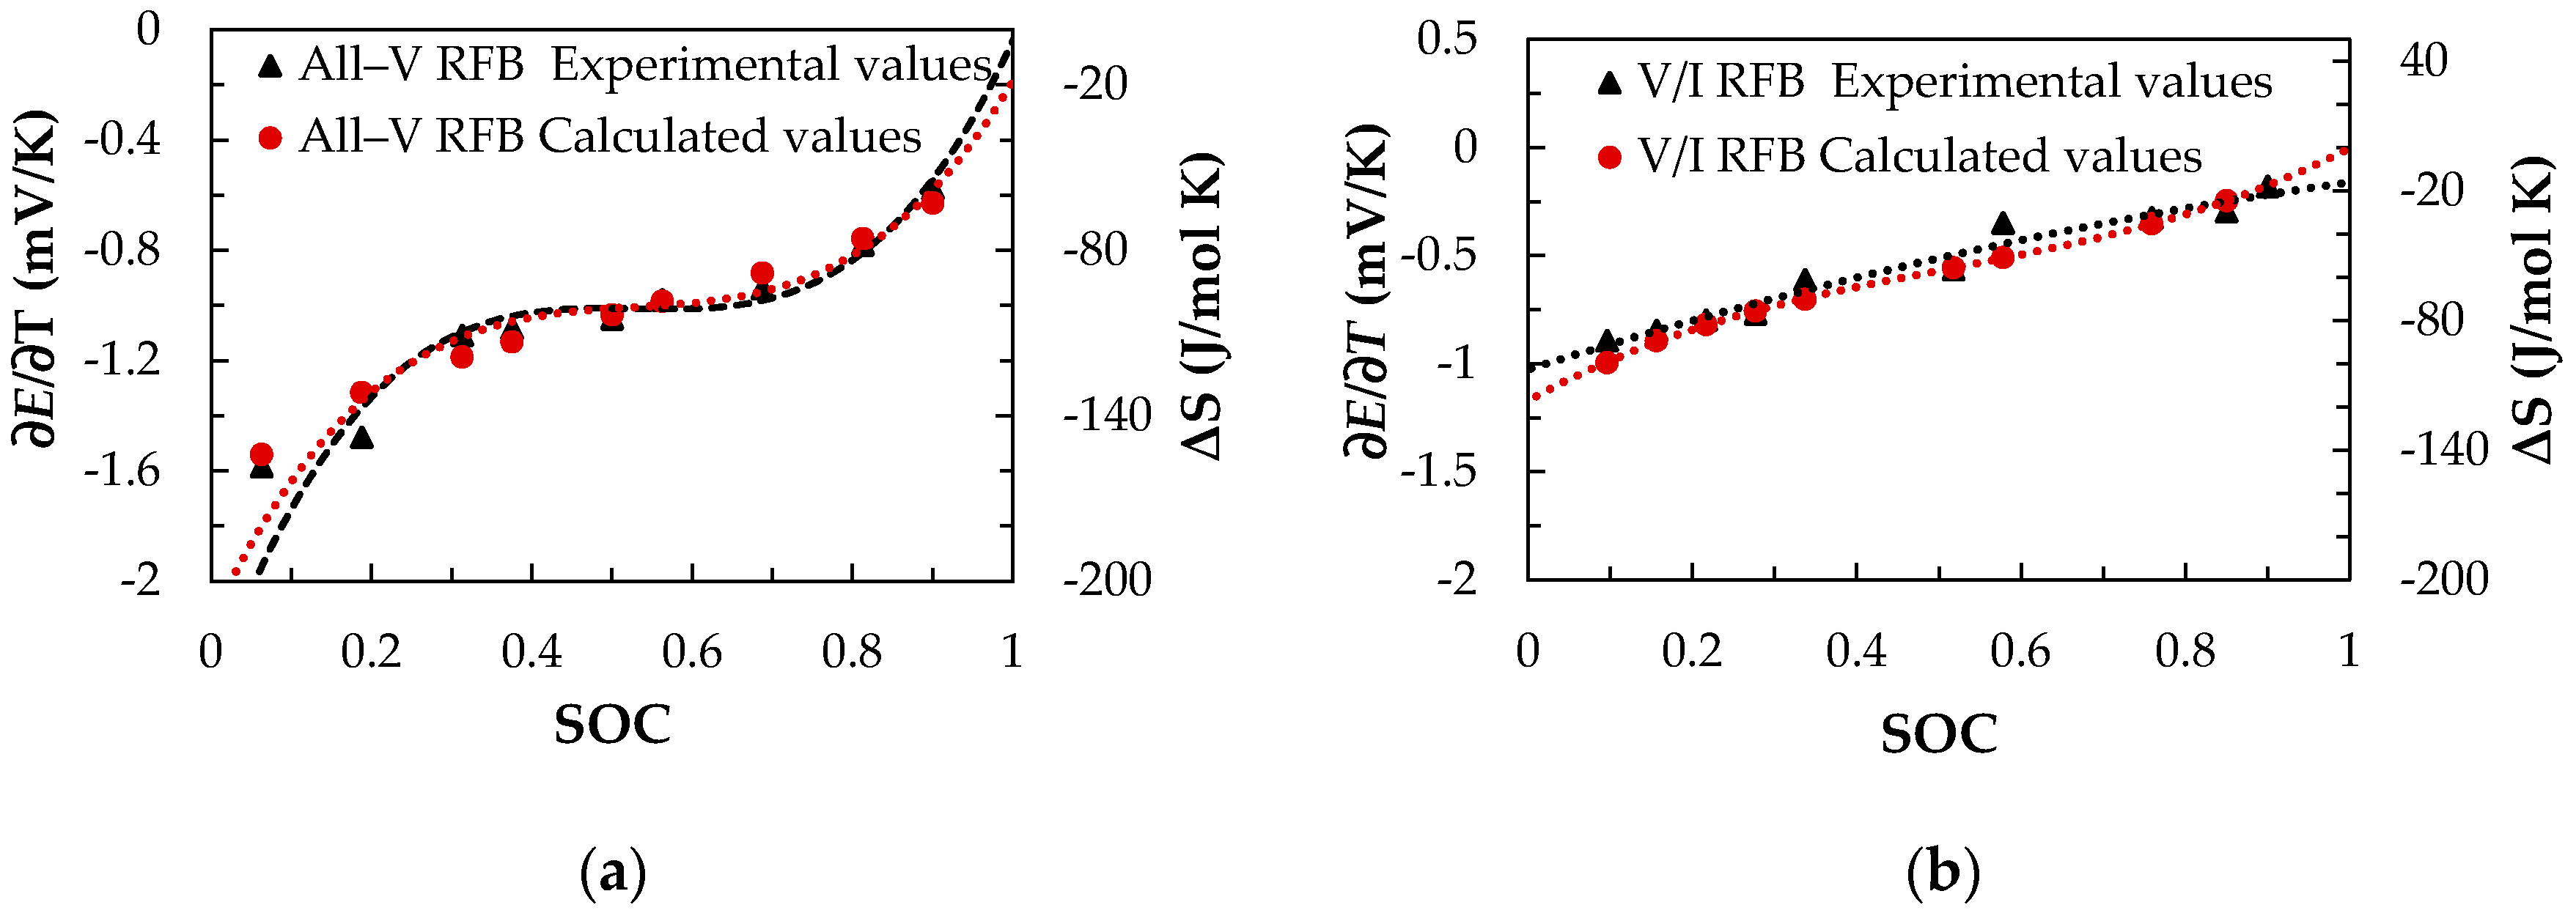
3.1.2. Measurement of the Temperature Coefficient (∂E/∂T) and Entropy Values

Figure 4 shows that the (∂E/∂T) measured by monitoring of the ITI compared to the calculated (∂E/∂T) as a function of the SOC for (a) the all-V RFB and (b) the V/I RFB, and the thermodynamic quantities are listed in Table 3. Acoording to the literature [19,38,39], the calculated value of the (∂E/∂T) can be obtained by taking the derivative of Equation (16), where the ( E o /∂T) is the standard temperature coefficient, R is the gas constant, F is the Faraday constant (96485 C/mol), CH+ is the proton concentration, and Ce is the electroyte concentration [19].
( E T ) = ( E o T ) + 2 R F l n ( C H + × SOC + 2 C e × SOC 2 1 SOC )
The rationship of the (∂E/∂T) vs. SOC is calculated by Equation (16), where the CH+ and Ce concentrations of a fully discharged cell were 2.0 M H2SO4 and 1.0 M V2+ solution, respectively. The experimental values based on the real-time monitoring of the ITI and (∂E/∂T) measurement. The comparison of the all-V RFB is illustrated in Figure 4a, in which there is good corresponding between measured and calculated values. In addition, the (∂E/∂T) was −1.15 mV/K by the ITI mearsured at 28.08% SOC, this value is closed to some published standard values, as listed in Table 3. The potential of the measured charge-discharge curve was 1.31 V, which is close to the E = 1.32 V calculated value by the Equation (17) [19], where E o is the standard potential (at 25 °C). The results were ΔS= −113 J/mol. K and ΔG= −126 KJ/mol from Figure 4 at 28.08% SOC, which are near to the published standard values, as listed in Table 3.
E = E o + 2 R T F l n ( C H + × SOC + 2 C e × SOC 2 1 SOC )
For the V/I RFB, the Ce concentration was 1.0 M I2 solution, the comparison is demonstrated in Figure 4b. The experimental value based on the real-time monitoring of the ITI and (∂E/∂T) measurement, there is good corresponding between measured and calculated value. In addition, the temperature coefficient (∂E/∂T) was −0.78 mV/K by the ITI mearsured at 28.08% SOC, this value is close to the literature [20]. The potential of the measured charge-discharge curves was 0.51 V, which is close to the value E = 0.52 V calculated value by the Equation (17) [19]. The results were ΔS = −75.3 J/mol. K and ΔG = −49 KJ/mol from Figure 4 at 28.08% SOC, which are close to the literature [20]. These results confirm that the formal temperature coefficients can be measured by the ITI method, and used with a modified Nernst equation to quantify the thermodynamics of the RFB reactions as a function of SOC.

3.2. Thermal Effect of Charge-discharge Parameters for V/I RFB System

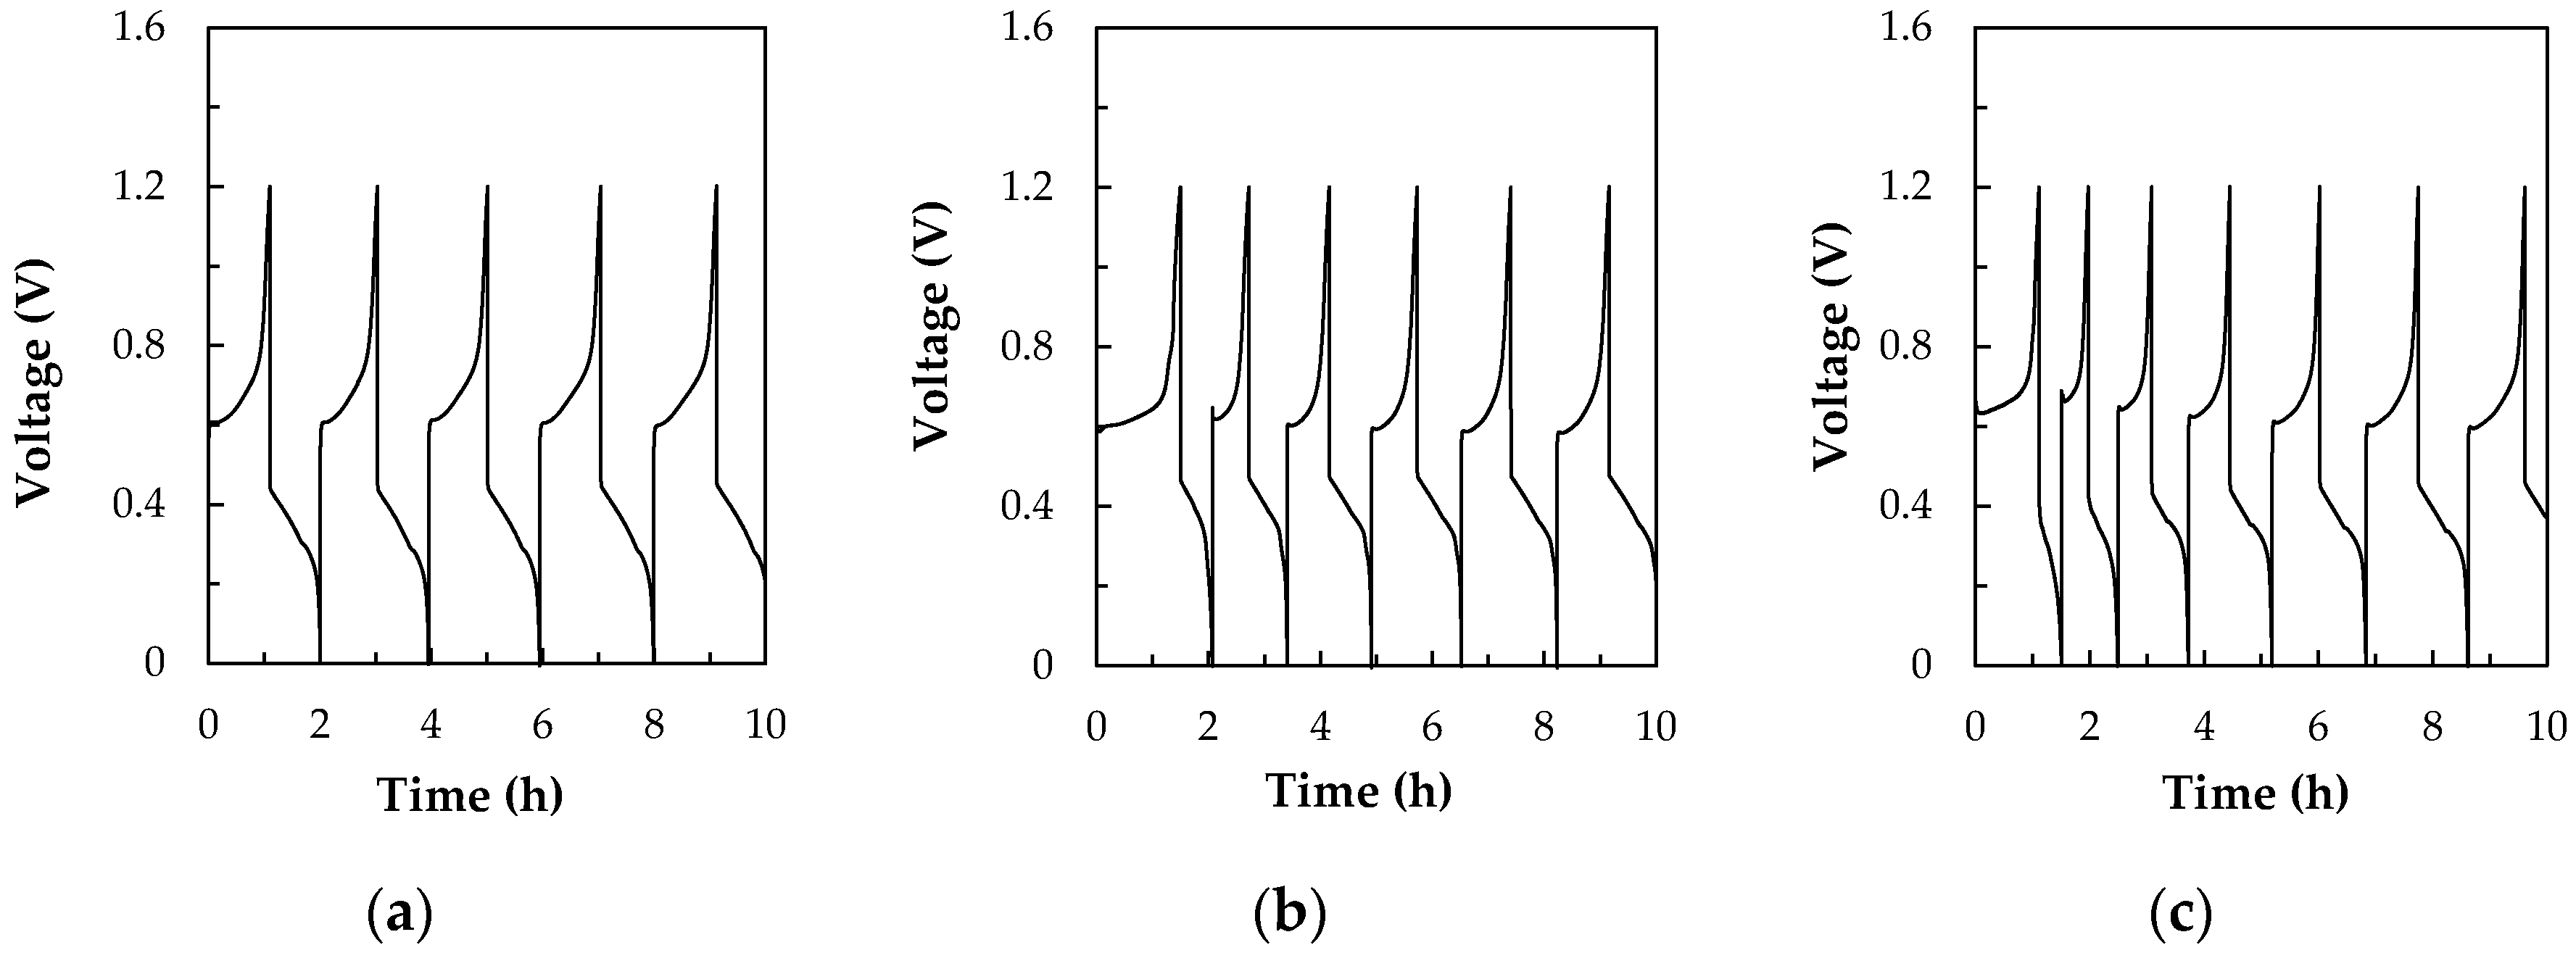
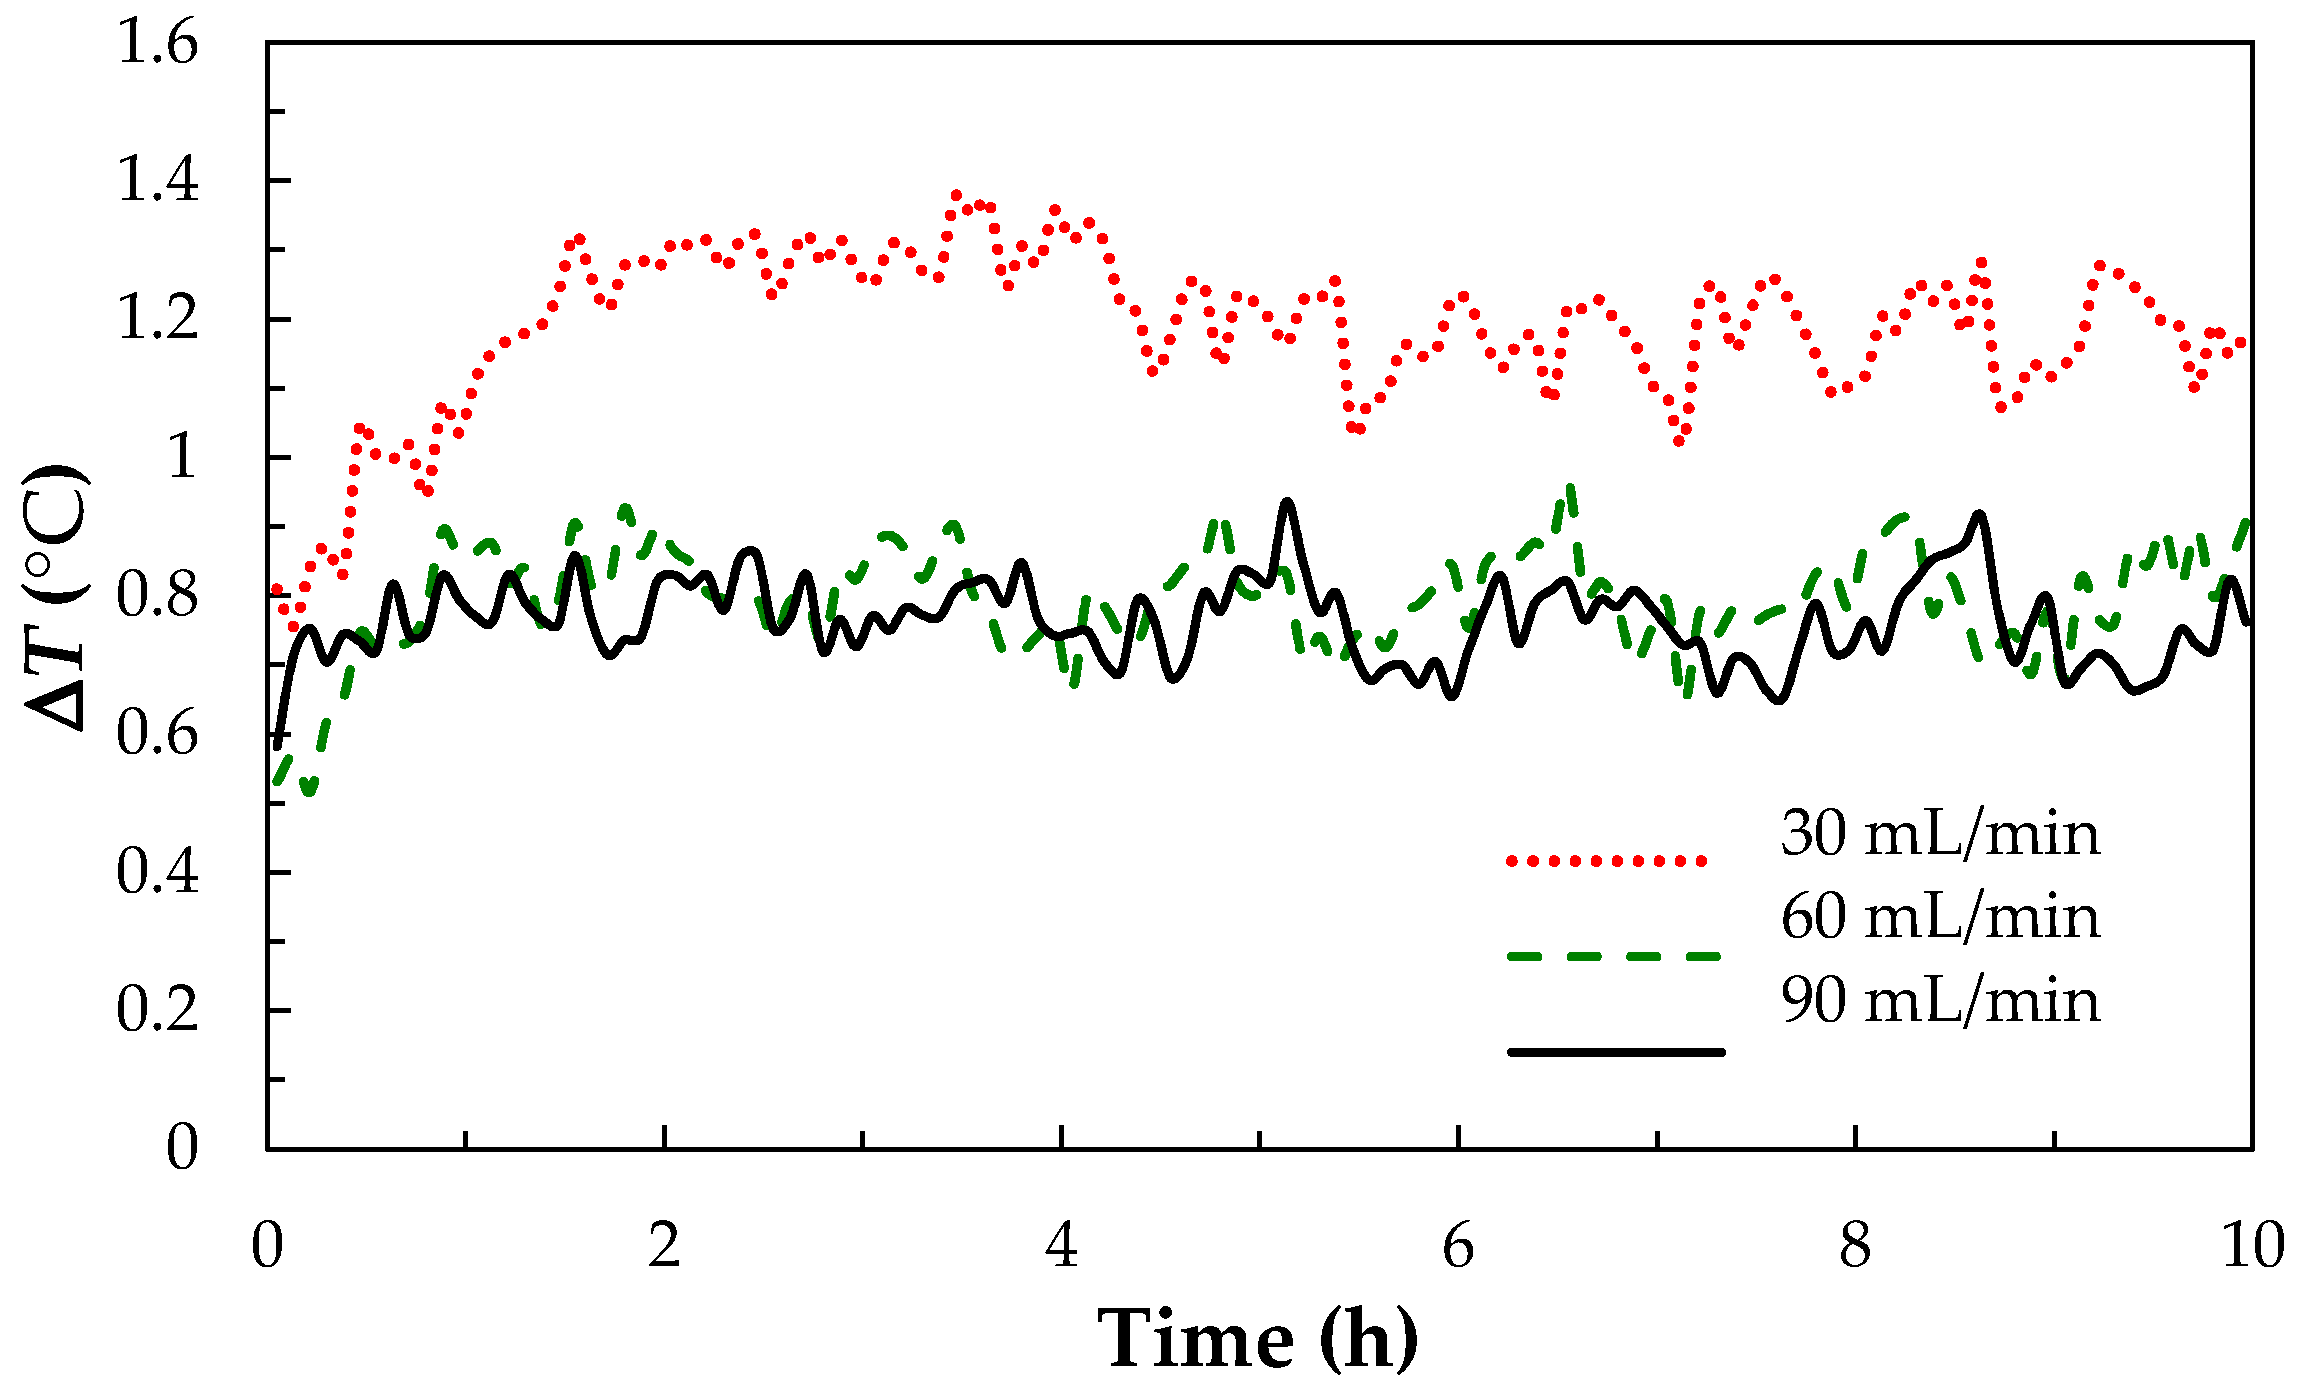
3.2.1. The Flow Rate Optimization

For the V/I RFB, the charge-discharge parameters include the flow rate and current density. An optimal flow rate design is to achieve a high overall efficiency by reducing the concentration polarization and pumping costs. Some works have been carried out in the area of increasing the RFB system level efficiency and reducing the power consumption [8,17,44]. Figure 5 shows the charge-discharge diagrams at different flow rate, and the thermal effect is as shown in Figure 6. For the thermal effect of Figure 6, after one hour, at a flow rate of 30 mL/min, it shows a large temperature amplitude change, ΔTaverage > 1.2 °C, ΔTmax is 1.387 °C, as compared to 60 mL/min (ΔTmax = 0.936 °C) and 90 mL/min (ΔTmax = 0.967 °C). The VE% (51%) was the lowest at a flow rate of 30 mL/min than the other operating rates, indicating that the residence time of electrolyte solution was too long on the electrode’s surface, so the concentration polarization was worse. The thermal effect was small (ΔT < 1.0 °C) at 60 mL/min and 90 mL/min, but the VE% (55%) of 90 mL/min was lower than 60 mL/min (61%), meaning that the electrolytes flowing through the electrodes surface was too fast and the oxidation-reduction reaction did not complete. Therefore, the optimum flow rate was 60 mL/min for a V/I RFB.

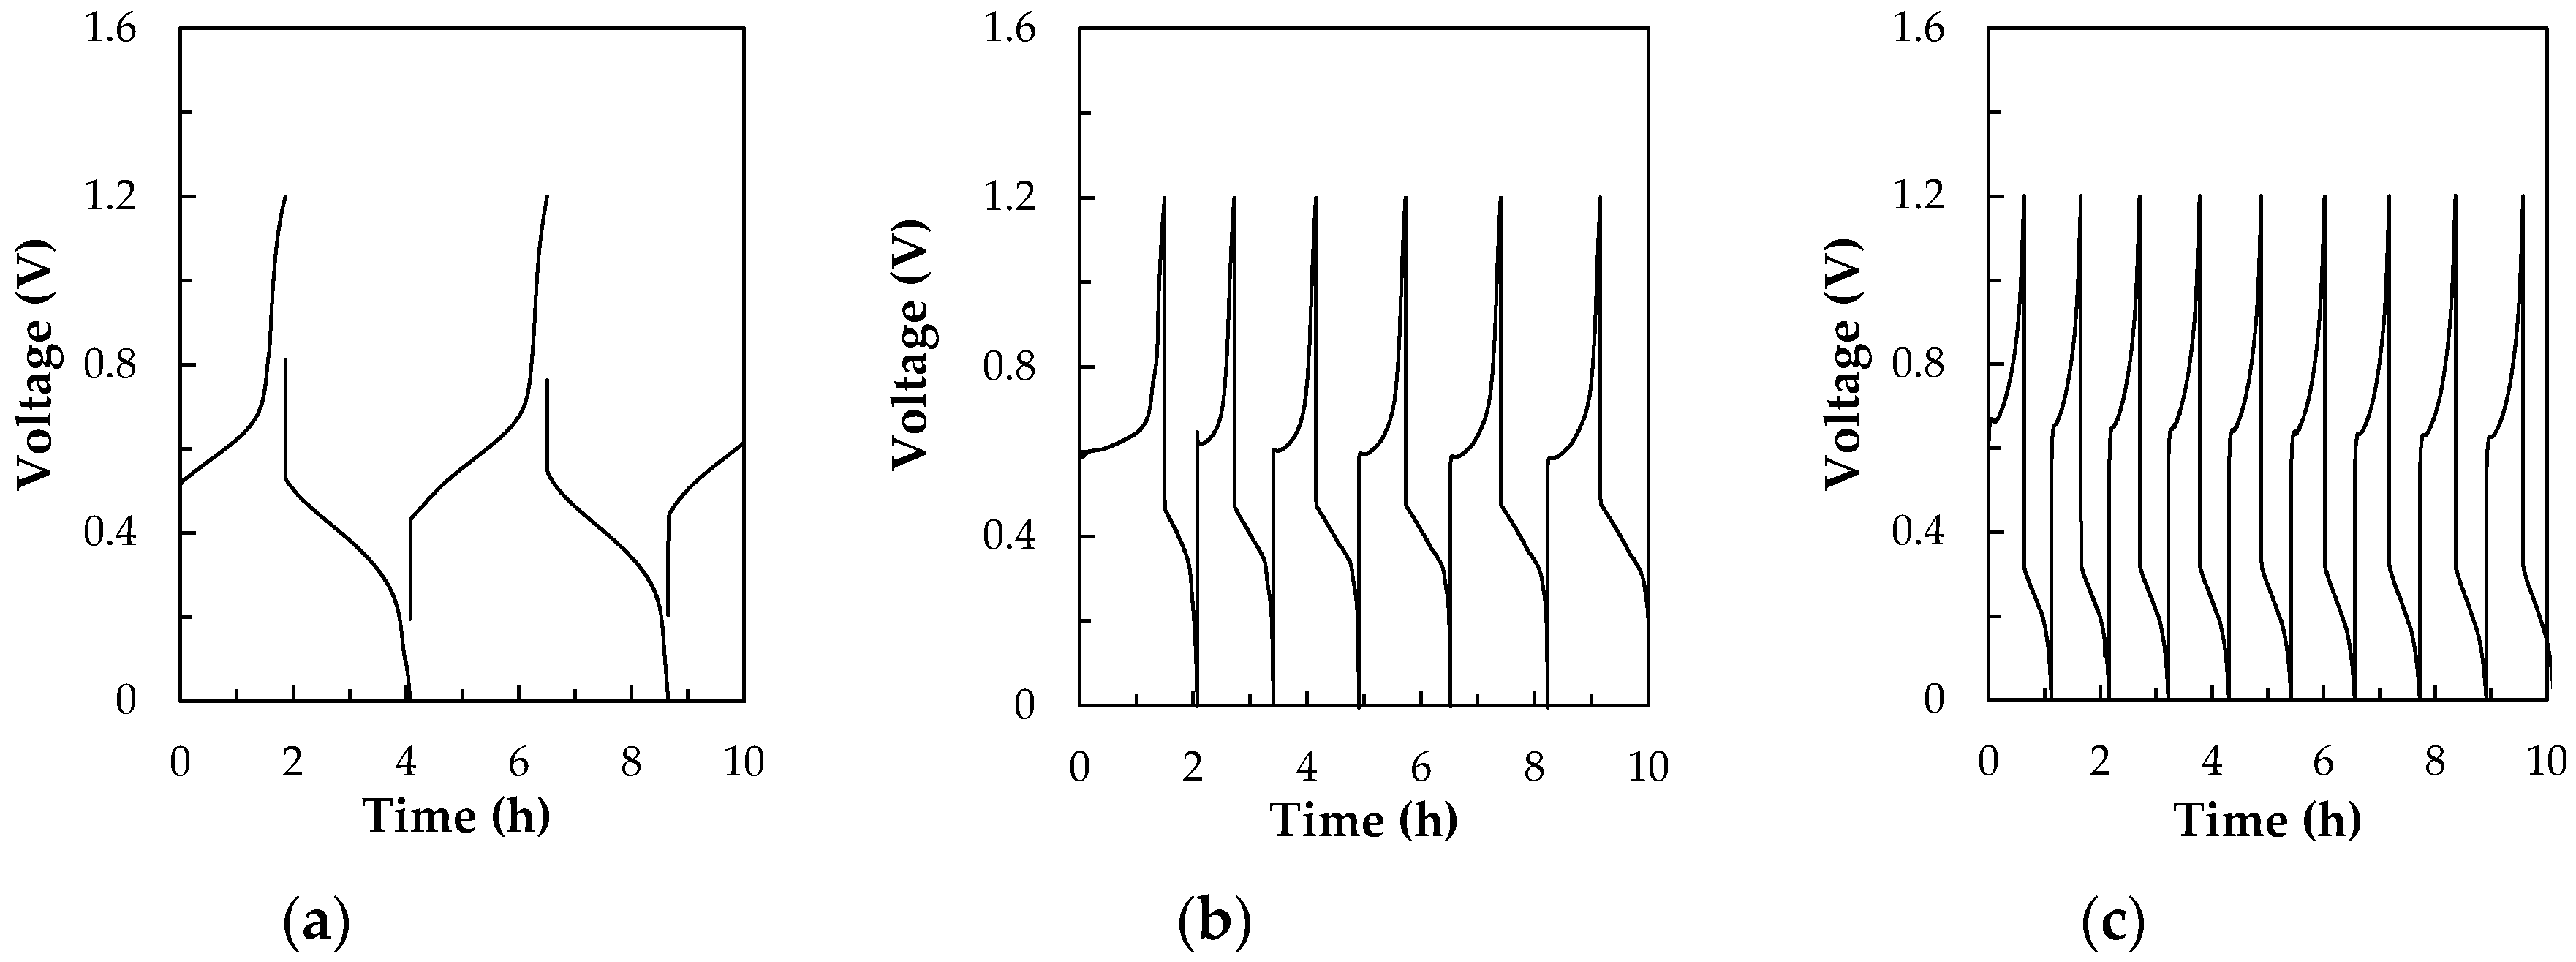
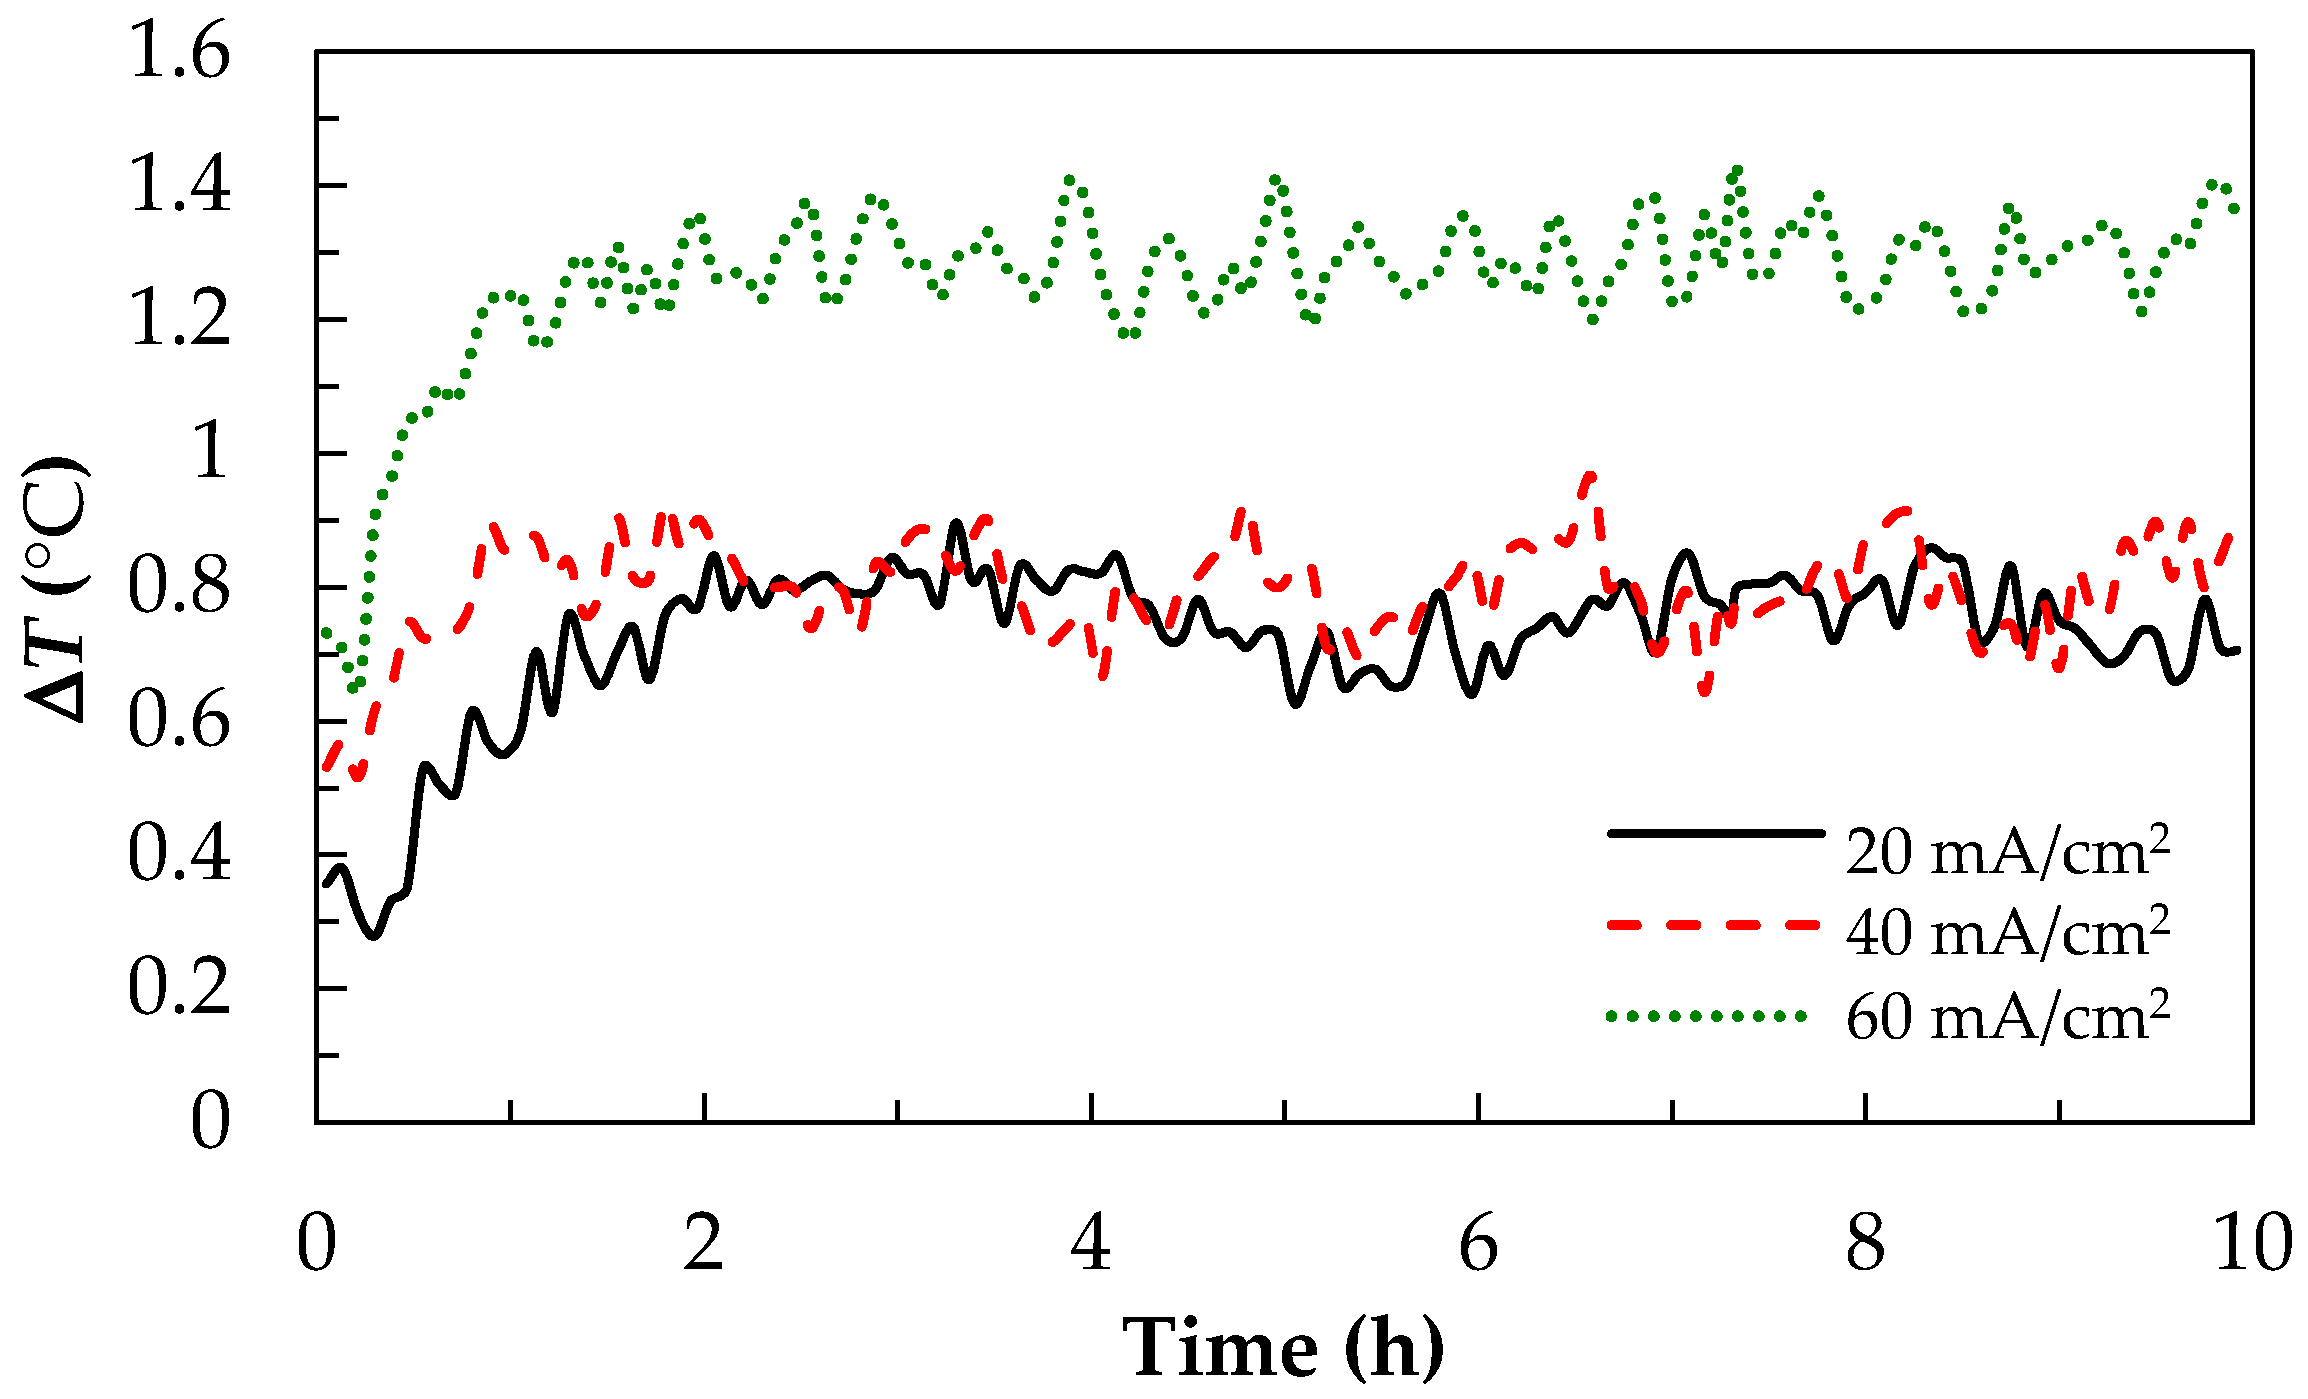
3.2.2. The Current Density Effect of the Charge-Discharge Test

Figure 7 reveals the charge-discharge diagrams at different current density, and the thermal effect is as shown in Figure 8. Furthermore, with the enhancment of the current density, the CE% can reach more than 90%, but the VE% shows a downward trend, as presented in Figure 7 and Table 4. Using a large current density to charge, the concentration change was remarkable, causing an overvoltage phenomenon of concentration polarization, which caused the lower efficiency [44]. When the current density was larger (60 mA/cm2), the thermal released effect by the ohmic resistor was greatly increased, and the VE% (17%) rapidly dropped, so that the ΔT was significantly greater than 20 mA/cm2 and 40 mA/cm2, ΔTmax = 1.387 °C, as shown in Table 4.

3.2.3. The Reynold’s Number Effect

In fluid mechanics, the Reynolds number (Re) is a specific value of inertial force to viscous force of a fluid. According to the literature [8,45], the enhancing Re reveals faster reactant transport, however, increasing Re was also found to induce a decrease in the peak power in the region of transition between the laminar and turbulent flow regimes. Moreover, the flow rate will be subjected to the flow channel fields. The Reynold’s number was calculated by Equation (18) [46].
Reynold s   number   ( Re ) =   ρ   u   L μ
where ρ is the density of the fluid in kg/m3, L is the characteristic length in meters, u is the fluid velocity in m/s and μ is the dynamic viscosity in Pa/s. To comfirm these comprehensive analyses of the thermal effect of the charge-discharge experimental parameters, the volumetric flow rate, flow velocity, Reynold’s number effect, cell’s performances, and thermal effect for the V/I RFB are summarized in Table 4. There are both the serpentine flow and parallel flow fields with channel width and channel depth differences, and were similar to the literature [45], and were applied in the V/I RFB. The results can be seen that the serpentine type with two-channels shows a larger Re value than that of the parallel-type with 25-channels. The Re < 1000 for both serpentine and parallel types indicated that the flow field belonged to the laminar regimes. Thus, the serpentine-type with 2-channel was suitable to the V/I RFB because the Re value was higher, and more than 10 times that of the parallel-type, as shown in Table 4. The cell’s performance of the experimental test also verified that the serpentine-type presented a higher EE% value (57%) than that of the parallel-type (32%). However, despite the higher flow rate with high Re value, it also increases the pumping energies loss and the incomplete reaction of the electrolyte. Consequently, the optimal flow rate was 60 mL/min at 40 mA/cm2 of current density and showed a higher cell’s performance and lower thermal effect than the other charge-discharge parameters.

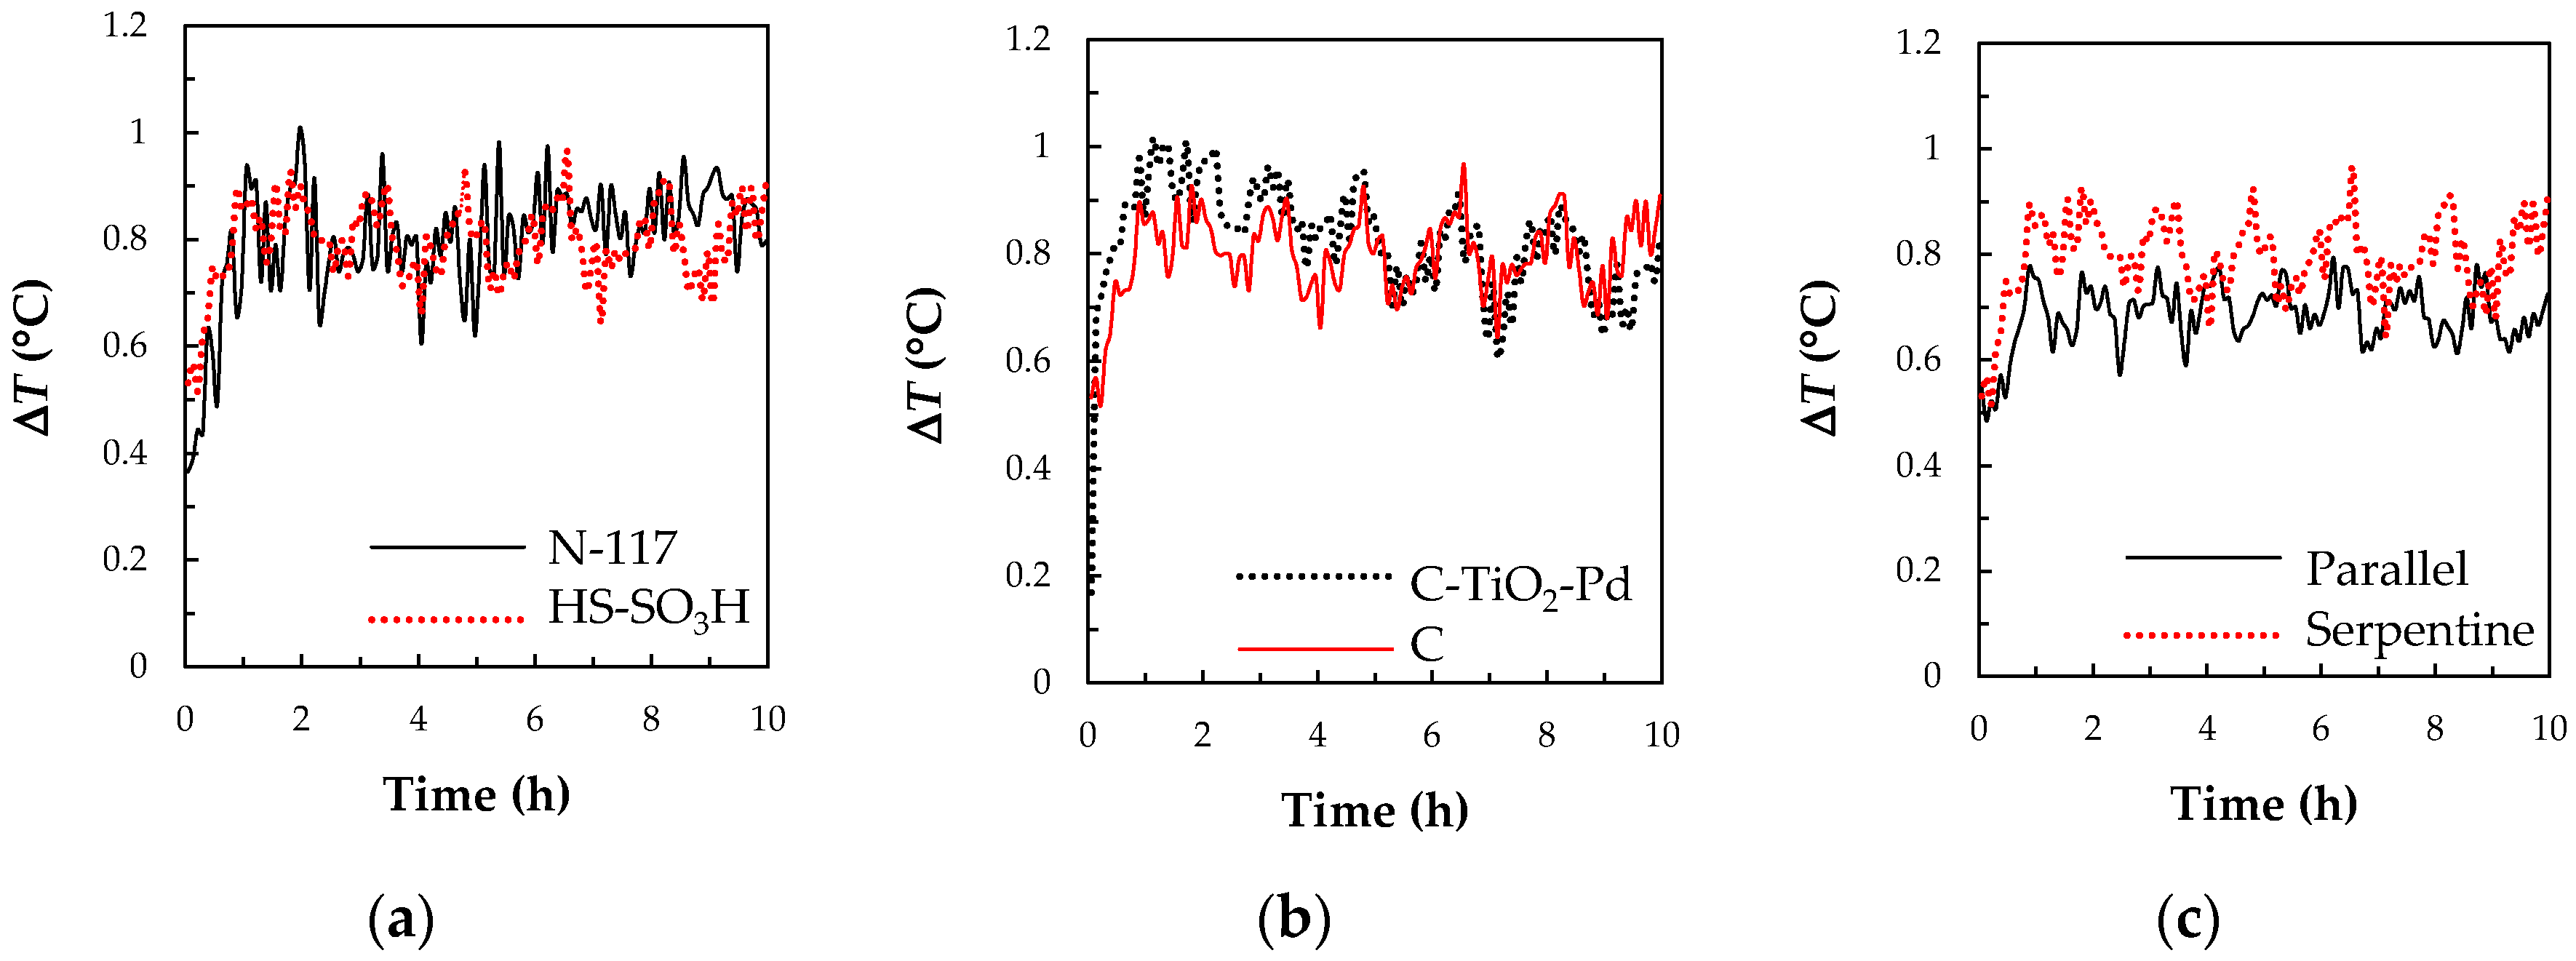
3.3. The Charge-Discharge Test of a V/I RFB by Modified Key Materials

From the aforementioned thermal effect and flow field analyses for the V/I RFB, we found the optimal charge-discharge parameters at 40 mA/cm2 and 60 mL/min flow rate. Then, we modified the key materials including the separation membrane, electrode, and flow field to carry out the charge-discharge test.

3.3.1. The Separation Membrane

The reaction scheme of the HS-SO3H cross-linked membrane and the functional structures of the HS-SO3H membrane were confirmed by the FT-IR spectra, as shown in Figure 9 and Figure 10. In the reaction scheme, the reaction center is focused on the complete reaction degree of the vinyl (C=C) groups, as well as the formation of the sulfonic acid (-SO3H) groups. The FT-IR spectra can see that the C=C functional groups of the HEMA, TEGDMA, and SVS monomers disappeared (1667–1640 cm−1) for the HS-SO3H cross-linked membrane. At 3200 cm−1 and 1300–1400 cm−1, these absorption peak regions correspond to the -OH group stretching vibration of the -SO3H groups, as well as the S=O group antisymmetric and symmetric stretching vibration of the -SO3H groups. At 3600 cm−1, the absorption peak corresponds to the -OH group stretching vibration of the poly (HEMA) [47]. From the above FTIR information, the HS-SO3H membrane should be successfully synthesized by the photo-polymerization.
As shown in Table 5, the IEC values of an unmodified N-117 and HS-SO3H membrane, were 0.99 mmol/g and 1.93 mmol/g, respectively, implying that the HS-SO3H membrane improved its IEC by using the -SO3H groups. The dynamical permeability of the HS-SO3H membrane (3.48 × 10⁻⁶ mL/s) was lower than that of the N-117 (7.00 × 10⁻⁶ mL/s). Figure 11a shows the thermal effect analysis of the N-117 and HS-SO3H membranes for the V/I RFB for 10 h charge-discharge test at a flow rate of 60 mL/min and a current density of 40 mA/cm2. The results show that the ΔT of both the N-117 and HS-SO3H membranes had similar trends and were smaller (ΔT < 1.0 °C). Some of the literature showed that the N-117 film causing the vanadium ions cross contamination for the all-V RFB, during the battery working, the water was transported between two half-cell tanks by the osmosis dragging and diffusion [35,36,48]. However, Table 5 found that the N-117 and HS-SO3H membranes can all be used in the V/I RFB from our previous study [29], but the cost of the HS-SO3H membrane was far below the N-117 membrane. In addition, other electrolyte solutions, ex. V/Ce, V/Fe, and V/Br RFBs have been extensively investigated by various separation membranes, such as anion exchange membrane (AEM), Nafion-117/SiO2-SO3H membrane, Nafion-112, amphoteric ion exchange membrane (sulfonated PEEK) and sulfonated polyether ether ketone (SPEEK)/titanium oxide (TiO2) [5,32,48,49,50].

3.3.2. The C-TiO2-Pd Composite Electrode

The carbon paper electrode (C) and C-TiO2-Pd composite electrode were applied in a V/I RFB for 10 h charge-discharge test. The results show that the driving voltage of the C-TiO2-Pd composite electrode was larger than the C electrode, causing a larger activation heat [29], so that the ΔT was larger before five hours. However, after five hours, the subsequent reaction proceeds, and the ΔT approaches agreement with the C electrode, as shown in Figure 11b. After 10 h of the charge-discharge cycle, the parallel channel can still maintain a high coulombic efficiency (CE) of 93%, as summarized in Table 6.

3.3.3. The Flow Channel Types

Figure 11c shows the thermal effect analysis of the parallel and the serpentine channel models. The results present that the ΔT of the serpentine channel was greater than that of the parallel channel. From the result, a speculated reason was that the electrolyte undergoes an oxidation-reduction reaction on the electrode surface in a meandering flow path, which can increase the contact area, thus, the large amount of the reaction heat was generated. These results agree with the literature in the dynamic thermal hydraulic model [8], which showed that the serpentine-type flow field provides the uniform distribution of flow rates.

3.4. The Cell Performances of a V/I RFB System with the Key Materials

Figure 12 shows the charge-discharge cyclic diagrams of a V/I RFB with the modified key materials. The 1.0 M VOSO4/2.0 M H2SO4 was as the positive electrolyte, iodine/ascorbic acid solutions as the negative electrolyte, and the C electrode as an anode, HS-SO3H membrane as a separator. In addition, the C-TiO2-Pd was as a cathode with a serpentine-type flow field at a current density of 20 mA/cm2 and a flow rate of 60 mL/min. An HS-SO3H ion exchange membrane increased the CE value from 93% to 96%, meaning that the HS-SO3H membrane prevents the cross-contamination of the vanadium and iodine ions, and thereby promoted the transfer of the H+ protons because of a high IEC value. With the C-TiO2-Pd composite electrode as a cathode with the serpentine-type flow field for the V/I RFB, the VE% was enhanced from 61% to 86%, as shown in Table 6. The key materials were modified by various methods to effectively raise the performance of a V/I RFB, and the whole EE% was improved from 57% to 83%.

4. Conclusions

Through combining the experimental design and the monitoring of the infrared thermal imaging technology, thermal analysis at the charge-discharge test, the performance of key materials can be evaluated efficiently for the developing of the vanadium/iodine redox flow battery system. From the thermal effect analyses confirm that the formal temperature coefficient (∂E/∂T) can be measured by the infrared thermal imaging (ITI) method and applied with modified Nernst equation to quantify the thermodynamics of redox flow cell reactions as a function of state of charge (SOC). In addition, the parameters (flow rate and current density) of the charge-discharge tests affect the thermal effect of a vanadium/iodine redox flow battery system. High current density causes a phenomenon of concentration overvoltage and the thermal release was more serious. A near-to optimal flow rate design is to achieve a high overall efficiency by reducing the concentration polarization and pumping costs. When the flow rate was too slow, causing the concentration gradient and a higher ohmic resistor heat release which was the factor of reducing the performance. The optimum flow rate was 60 mL/min by the serpentine-type with a higher Reynolds number (Re) than the flow field, and obtained the highest energy efficiency than others. The EE% was improved from 57% to 83% for a vanadium/iodine redox flow battery system through the modified key materials (separation membrane, electrode, and flow channel), and the revised optimum charge-discharge parameters. The thermal effect was an important index for the modifying key material. Thus, to establish the battery’s temperature distribution model by the infrared thermal imaging technology real-time monitoring, the cycle charge-discharge was beneficial to develop a new redox flow battery system.

Author Contributions

Conceptualization, M.-L.C. and S.-L.H.; methodology, S.-L.H. and C.-C.C.; formal analysis, S.-L.H., C.-C.C. and M.-L.C.; data curation, S.-L.H., C.-C.C., M.-W.W. and C.-C.T.; writing—original draft preparation, S.-L.H.; writing—review and editing, C.-P.L., S.-L.H. and M.-L.C. All authors have read and agreed to the published version of the manuscript.

Funding

This research was funded by the Ministry of Science and Technology, Taiwan (MOST 108-2221-E-239-008, MOST 108-2622-E-239-003-CC3).

Acknowledgments

The authors are grateful for the financial support by the Ministry of Science and Technology, Taiwan.

Conflicts of Interest

The authors declare no conflict of interest.

References

  1. Lucas, A.; Chondrogiannis, S. Smart grid energy storage controller for frequency regulation and peak shaving, using a vanadium redox flow battery. Int. J. Electr. Power Energy Syst. 2016, 80, 26–36. [Google Scholar] [CrossRef]
  2. Kazacos, M.; Cheng, M.; Skyllas-Kazacos, M. Vanadium redox cell electrolyte optimization studies. J. Appl. Electrochem. 1990, 20, 463–467. [Google Scholar] [CrossRef]
  3. Sha’rani, S.S.; Abouzari-Lotf, E.; Nasef, M.M.; Ahmad, A.; Ting, T.M.; Ali, R.R. Improving the redox flow battery performance of low-cost thin polyelectrolyte membranes by layer-by-layer surface assembly. J. Power Sources 2019, 413, 182–190. [Google Scholar] [CrossRef]
  4. Holland-Cunz, M.V.; Friedl, J.; Stimming, U. Anion effects on the redox kinetics of positive electrolyte of the all-vanadium redox flow battery. J. Electroanal. Chem. 2018, 819, 306–311. [Google Scholar] [CrossRef] [Green Version]
  5. Zhang, J.; Chen, X.; Long, R.; Si, J.; Liu, C.; Ma, S. Preparation and properties of amphoteric ion exchange membrane for all vanadium redox flow batteries. Results Phys. 2019, 14, 102373. [Google Scholar] [CrossRef]
  6. Wang, G.; Zhang, J.; Zhang, J.; Chen, J.; Zhu, S.; Liu, X.; Wang, R. Effect of different additives with -NH2 or -NH4+ functional groups on V(V) electrolytes for a vanadium redox flow battery. J. Electroanal. Chem. 2016, 768, 62–71. [Google Scholar] [CrossRef] [Green Version]
  7. Maharjan, M.; Wai, N.; Veksha, A.; Giannis, A.; Lim, T.M.; Lisak, G. Sal wood sawdust derived highly mesoporous carbon as prospective electrode material for vanadium redox flow batteries. J. Electroanal. Chem. 2019, 834, 94–100. [Google Scholar] [CrossRef]
  8. Wei, Z.; Zhao, J.; Skyllas-Kazacos, M.; Xiong, B. Dynamic thermal-hydraulic modeling and stack flow pattern analysis for all-vanadium redox flow battery. J. Power Sources 2014, 260, 89–99. [Google Scholar] [CrossRef]
  9. Trovò, A.; Saccardo, A.; Giomo, M.; Guarnieri, M. Thermal modeling of industrial-scale vanadium redox flow batteries in high-current operations. J. Power Sources 2019, 424, 204–214. [Google Scholar] [CrossRef] [Green Version]
  10. Xiong, B.; Yang, Y.; Tang, J.; Li, Y.; Wei, Z.; Su, Y.; Zhang, Q. An enhanced equivalent circuit model of vanadium redox flow battery energy storage systems considering thermal effects. IEEE Access 2019, 7, 162297–162308. [Google Scholar] [CrossRef]
  11. Trovò, A.; Picano, F.; Guarnieri, M. Comparison of energy losses in a 9 kW vanadium redox flow battery. J. Power Sources 2019, 440, 227144. [Google Scholar] [CrossRef]
  12. Guarnieri, M.; Trovò, A.; Picano, F. Enhancing the efficiency of kW-class vanadium redox flow batteries by flow factor modulation: An experimental method. Appl. Energy 2020, 262, 114532. [Google Scholar] [CrossRef]
  13. Pugach, M.; Parsegov, S.; Gryazina, E.; Bischi, A. Output feedback control of electrolyte flow rate for vanadium redox flow batteries. J. Power Sources 2020, 455, 227916. [Google Scholar] [CrossRef]
  14. Trovò, A.; Guarnieri, M. Standby thermal management system for a kW-class vanadium redox flow battery. Energy Convers. Manag. 2020, 226, 113510. [Google Scholar] [CrossRef]
  15. Al-Fetlawi, H.; Shah, A.A.; Walsh, F.C. Non-isothermal modelling of the all-vanadium redox flow battery. Electrochim. Acta 2009, 55, 78–89. [Google Scholar] [CrossRef] [Green Version]
  16. Zheng, Q.; Zhang, H.; Xing, F.; Ma, X.; Li, X.; Ning, G. A three-dimensional model for thermal analysis in a vanadium flow battery. J. Appl. Energy 2014, 113, 1675–1685. [Google Scholar] [CrossRef]
  17. Wei, Z.B.; Zhao, J.Y.; Xiong, B.Y. Dynamic electro-thermal modeling of all-vanadium redox flow battery with forced cooling strategies. Appl. Energy 2014, 135, 1–10. [Google Scholar] [CrossRef]
  18. Xiong, B.; Zhao, J.; Tseng, K.J.; Skyllas-Kazacos, M.; Lim, T.M.; Zhang, Y. Thermal hydraulic behavior and efficiency analysis of an all-vanadium redox flow battery. J. Power Sources 2013, 242, 314–324. [Google Scholar] [CrossRef]
  19. Hudak, N.S. Practical thermodynamic quantities for aqueous vanadium-and iron-based flow batteries. J. Power Sources 2014, 269, 962–974. [Google Scholar] [CrossRef]
  20. Bard, A.J.; Parsons, J.; Jordan, J. Standard Potentials in Aqueous Solution, 1st ed.; CRC Press: Boca Raton, FL, USA, 1985. [Google Scholar]
  21. Driggers, R.G.; Friedman, M.H.; Nichols, J.M. Introduction to Infrared and Electro-Optical Systems, 2nd ed.; Artech House: Norwood, MA, USA, 2012. [Google Scholar]
  22. Meola, C. Infrared Thermography Recent Advances and Future Trends; Bentham Science Publishers: Sharjah, UAE, 2012. [Google Scholar]
  23. Usamentiaga, R.; Venegas, P.; Guerediaga, J.; Vega, L.; Molleda, J.; Bulnes, F.G. Infrared thermography for temperature measurement and non-destructive testing. Sensors 2014, 14, 12305–12348. [Google Scholar] [CrossRef] [Green Version]
  24. Vollmer, M.; Möllmann, K.P. Infrared Thermal Imaging: Fundamentals, Research and Applications, 2nd ed.; John Wiley & Sons: Hoboken, NJ, USA, 2018. [Google Scholar]
  25. Jadin, M.S.; Taib, S. Recent progress in diagnosing the reliability of electrical equipment by using infrared thermography. Infrared Phys. Technol. 2012, 55, 236–245. [Google Scholar] [CrossRef] [Green Version]
  26. Zou, H.; Huang, F.Z. A novel intelligent fault diagnosis method for electrical equipment using infrared thermography. Infrared Phys. Technol. 2015, 73, 29–35. [Google Scholar] [CrossRef]
  27. Huda, A.S.N.; Taib, S. Application of infrared thermography for predictive/preventive maintenance of thermal defect in electrical equipment. Appl. Therm. Eng. 2013, 61, 220–227. [Google Scholar] [CrossRef]
  28. Kateb, B.; Yamamoto, V.; Yu, C.; Grundfest, W.; Gruen, J.P. Infrared thermal imaging: A review of the literature and case report. NeuroImage 2009, 47, T154–T162. [Google Scholar] [CrossRef]
  29. Chen, T.S.; Huang, S.L.; Chen, M.L.; Tsai, T.J.; Lin, Y.S. Improving electrochemical activity in a semi-V-I redox flow battery by using a C-TiO2-Pd composite electrode. J. Nanomater. 2019, 2019, 7460856. [Google Scholar] [CrossRef] [Green Version]
  30. Huang, S.L.; Yu, H.F.; Lin, Y.S. Modification of Nafion® membrane via a sol-gel route for vanadium redox flow energy storage battery applications. J. Chem. 2017, 2017, 4590952. [Google Scholar] [CrossRef]
  31. Wang, W.; Kim, S.; Chen, B.; Nie, Z.; Zhang, J.; Xia, G.-G.; Li, L.; Yang, Z. A new redox flow battery using Fe/V redox couples in chloride supporting electrolyte. Energy Environ. Sci. 2011, 4, 4068–4073. [Google Scholar] [CrossRef]
  32. Sankarasubramanian, S.; Zhang, Y.; Ramani, V. Methanesulfonic acid-based electrode-decoupled vanadium-cerium redox flow battery exhibits significantly improved capacity and cycle life. Sustain. Energy Fuels 2019, 3, 2417–2425. [Google Scholar] [CrossRef]
  33. Skyllas-Kazacos, M. Novel vanadium chloride/polyhalide redox flow battery. J. Power Sources 2003, 124, 299–302. [Google Scholar] [CrossRef]
  34. Huang, S.L.; Chen, M.L.; Lin, Y.S. Chitosan-silica anion exchange membrane for the vanadium redox flow energy storage battery applications. React. Funct. Polym. 2017, 119, 1–8. [Google Scholar] [CrossRef]
  35. Lin, C.H.; Yang, M.C.; Wei, H.J. Amino-silica modified Nafion membrane for vanadium redox flow battery. J. Power Sources 2015, 282, 562–571. [Google Scholar] [CrossRef]
  36. Vijayakumar, M.; Burton, S.D.; Huang, C.; Li, L.; Yang, Z.; Graff, G.L.; Liu, J.; Hu, J.; Skyllas-Kazacos, M. Nuclear magnetic resonance studies on vanadium(IV) electrolyte solutions for vanadium redox flow battery. J. Power Sources 2010, 195, 7709–7717. [Google Scholar] [CrossRef]
  37. Manohar, A.K.; Kim, K.M.; Plichta, E.; Hendrickson, M.; Rawlings, S.; Narayanan, S.R. A high efficiency iron-chloride redox flow battery for large-scale energy storage. J. Electrochem. Soc. 2016, 163, A5118–A5125. [Google Scholar] [CrossRef]
  38. Lu, W.; Yang, H.; Prakash, J. Determination of the reversible and irreversible heats of LiNi0.8Co0.2O2/mesocarbon microbead Li-ion cell reactions using isothermal microcalorimetery. Electrochim. Acta 2006, 51, 1322–1329. [Google Scholar] [CrossRef]
  39. Thomas, K.E.; Newman, J. Thermal modeling of porous insertion electrodes. J. Electrochem. Soc. 2003, 150, A176–A192. [Google Scholar] [CrossRef]
  40. Pourbaix, M. Atlas of Electrochemical Equilibria in Aqueous Solutions, 1st English ed.; Pergamon Press: Oxford, UK, 1966. [Google Scholar]
  41. Hill, J.O.; Worsley, I.G.; Hepler, L.G. Thermochemistry and oxidation potentials of vanadium, niobium, and tantalum. Chem. Rev. 1971, 71, 127–137. [Google Scholar]
  42. Bratsch, S.G. Standard electrode potentials and temperature coefficients in water at 298.15 K. J. Phys. Chem. Ref. Data 1989, 18, 1–21. [Google Scholar] [CrossRef] [Green Version]
  43. Heintz, A.; Illenberger, C. Thermodynamics of vanadium redox flow batteries-electrochemical and calorimetric investigations. Berichte der Bunsengesellschaft für phyikalische Chemie 1998, 102, 1401–1409. [Google Scholar] [CrossRef]
  44. Ling, C.Y.; Cao, H.; Chng, M.L.; Han, M.; Birgersson, E. Pulsating electrolyte flow in a full vanadium redox battery. J. Power Sources 2015, 294, 305–311. [Google Scholar] [CrossRef]
  45. Wang, Z.; Sankarasubramanian, S.; Ramani, V. Reactant-transport engineering approach to high-power direct borohydride fuel cells. Cell Rep. Phys. Sci. 2020, 1, 100084. [Google Scholar] [CrossRef]
  46. Bird, R.B.; Stewart, W.E.; Lightfoot, E.N. Shell momentum balances and velocity distributions in laminar flow. In Transport Phenomena, revised 2nd ed.; Anderson, W., Kulek, P., Eds.; John Wiley & Sons, Inc.: New York, NY, USA, 2007; p. 46. [Google Scholar]
  47. Vargün, E.; Usanmaz, A. Degradation of poly(2-hydroxyethyl methacrylate) obtained by radiation in aqueous solution. J. Macromol. Sci. Part A 2016, 47, 882–891. [Google Scholar] [CrossRef]
  48. Chen, T.S.; Huang, S.L.; Ye, Z.Y.; Lin, Y.S.; Li, C.P. A novel Fe (II/0) redox couple with key components for the V/Fe redox flow battery. J. Electroanal. Chem. 2019, 850, 113396. [Google Scholar] [CrossRef]
  49. Quan, Y.; Wang, G.; Li, A.; Wei, X.; Li, F.; Zhang, J.; Chen, J.; Wang, R. Novel sulfonated poly(ether ether ketone)/triphenylamine hybrid membrane for vanadium redox flow battery applications. RSC Adv. 2019, 9, 3838–3846. [Google Scholar] [CrossRef] [Green Version]
  50. Ji, Y.; Tay, Z.Y.; Li, S.F.Y. Highly selective sulfonated poly(ether ether ketone)/titanium oxide composite membranes for vanadium redox flow batteries. J. Membr. Sci. 2017, 539, 197–205. [Google Scholar] [CrossRef]
Figure 1. Component schematic of an all-vanadium redox flow battery (all-V RFB).
Energies 13 06717 g001
Figure 2. Charge-discharge diagrams of (a) all-V RFB, a 1.0 M VOSO4/2.0 M H2SO4 mixing solution was using as negative and positive electrolytes. (b) V/I RFB, a 1.0 M VOSO4/2.0 M H2SO4 mixing solution was as the positive electrolyte, iodine/ascorbic acid (1.0 M I2/1 wt% of ascorbic acid/2.0 M H2SO4 solutions as the negative electrolyte. Both all-V RFB and V/I RFB without modified key components, that is, by carbon paper as the electrode, N-117 membrane as a separator with a serpentine-type flow field at a current density of 40 mA/cm2 and a flow rate of 60 mL/min.
Energies 13 06717 g002
Figure 3. The temperature change (ΔT) of charge-discharge by monitoring of an infrared thermal imaging (ITI) of all-V RFB and V/I RFB as a function of the state of charge (SOC).
Energies 13 06717 g003
Figure 4. Measured (∂E/∂T) by monitoring of the ITI compared to calculate ∂E/∂T as a function of the SOC for (a) an all-V RFB and (b) a V/I RFB.
Energies 13 06717 g004
Figure 5. Charge-discharge cyclic diagrams of for V/I RFB. The 1.0 M VOSO4/2.0 M H2SO4 was as the positive electrolyte, and iodine/ascorbic acid solutions as the negative electrolyte by carbon paper electrode as the anode and cathode, respectively, N-117 membrane as a separator with a serpentine-type flow field at a current density of 40 mA cm−2 with different flow rate by monitoring of the ITI (a) 30 mL/min, (b) 60 mL/min, (c) 90 mL/min.
Energies 13 06717 g005
Figure 6. The temperature change (ΔT) vs. the charge-discharge cycle time for V/I RFB by Figure 5 charge/discharge conditions with different flow rate by monitoring of the ITI in: 30 mL/min, 60 mL/min and 90 mL/min without modified key components.
Energies 13 06717 g006
Figure 7. Charge-discharge diagrams of for V/I RFB. The 1.0 M VOSO4/2.0 M H2SO4 was as the positive electrolyte, iodine/ascorbic acid solutions as the negative electrolyte by carbon paper electrode as the anode and cathode, respectively, N-117 membrane as a separator with a serpentine-type flow field at a flow rate of 60 mL/min with different current density by monitoring of the ITI (a) 20 mA/cm2, (b) 40 mA/cm2, (c) 60 mA/cm2.
Energies 13 06717 g007
Figure 8. The temperature change (ΔT) vs. the charge-discharge cycle time for V/I RFB by Figure 7 charge-discharge conditions with different current density by monitoring of the ITI in: 20 mA/cm2, 40 mA/cm2 and 60 mA/cm2.
Energies 13 06717 g008
Figure 9. Reaction scheme of the HS-SO3H cross-linked membrane.
Energies 13 06717 g009
Figure 10. FT-IR spectra of (a) hydroxyethylmethacrylate (HEMA) monomer (b) HS-SO3H membrane.
Energies 13 06717 g010
Figure 11. Show the temperature change (ΔT) vs. the charge/discharge cycle time for V/I RFB with different key materials: (a) separation membranes, (b) electrodes and (c) flow fields. The charge-discharge conditions: the 1.0 M VOSO4/2.0 M H2SO4 was as the positive electrolyte, iodine/ascorbic acid solutions as the negative electrolyte at a flow rate of 60 mL/min and a current density of 40 mA/cm2.
Energies 13 06717 g011
Figure 12. Charge-discharge diagrams of a V/I RFB with modified key materials. The 1.0 M VOSO4/2.0 M H2SO4 was as the positive electrolyte, iodine/ascorbic acid solution as the negative electrolyte, and the C electrode as an anode, the HS-SO3H membrane as a separator, the C-TiO2-Pd composite electrode as a cathode and using the serpentine-type flow fields at a current density of 20 mA cm−2 and a flow rate of 60 mL/min.
Energies 13 06717 g012
Table 1. The performances of all-V RFB and V/I RFB without modified key components after 10 h charge-discharge test.
9RFBCE
(%)
VE
(%)
EE
(%)
Discharge Capacity
(mAh)
ΔTmax
(°C)
all-V RFB7979624161.31
V/I RFB9361574950.90
Table 2. Thermodynamic data for vanadium and iodine compounds at 298.15 K.
FormulaState Δ H f o (kJ/mol) Δ G f o
(kJ/mol)
S f o (J/mol.K)
V 2 + aq−226.0−218.0−130.0
V 3 + aq−259.0−251.3−230.0
VO 2 + aq−486.6−446.4−133.9
VO 2 + aq−649.8−587.0−42.3
I aq−55.2−51.6111.3
  I 2 s00116.1
  H 2 O aq−285.8−237.269.9
H + aq000
Δ H ° r e a c t i o n Δ G ° r e a c t i o n Δ S ° r e a c t i o n
All-V RFB −155.6−129.9−121.7
V/I RFB −67.4−45.0−75.0
Note : Δ H r e a c t i o n o = i ν i Δ H f o ;   Δ G r e a c t i o n o = i ν i Δ G f o ;   Δ S r e a c t i o n o = i ν i S f o .
Table 3. Thermodynamic quantities for the cell reactions of the all-V RFB and V/I RFB by the real-time monitoring of the ITI measurement.
SourceYearΔG of Cell Reaction
(kJ/mol)
E of Cell
(V)
ΔS of Cell Reaction
(J/mol.K)
E/∂T of Cell
(mV/K)
Remarks
All-V RFB
Pourbaix book [40]1966−1211.26N/AN/AStandard values
Hill et al. review [41]1971−1201.25−120−1.2Standard values
Bard et al. book [20]1985−1301.34−120−1.2Standard values
Bratsch tables [42]1989−1211.26−230−2.4Standard values
Heintz and
Illenberger [43]
1998−119.81.242−156−1.62Experimental results based on calorimetry and ∂E/∂T measurement
Nicholas S. Hudak [19]2013−1381.32−83.3−1.22Formal potential (22 °C) and dE/dT (22–80 °C) measured at 13.3% SOC
This work *2020−1261.31−113−1.15
V/I RFB
Bard et al. book [29]1985−450.47−75N/AStandard values
This work *2020−490.51−75.3−0.78
* Experimental results based on the real-time monitoring of the ITI and the (∂E/∂T) measured at 28.08% SOC, standard potential (25 °C).
Table 4. The performance and thermal effect of the V/I RFB with various charge-discharge parameters and flow fields for the charge-discharge test.
Flow FieldVolumetric Flow Rate (mL/min)Flow Velocity
(m/s)
ReCurrent Density
(20 mA/cm2)
Current Density
(40 mA/cm2)
Current Density
(60 mA/cm2)
CE
(%)
VE
(%)
EE
(%)
ΔTmaxCE
(%)
VE
(%)
EE
(%)
ΔTmaxCE
(%)
VE
(%)
EE
(%)
ΔTmax
Type A300.25250----8551431.378----
600.505009360560.8329361570.9369117161.387
900.75750----9155500.967----
Type B300.0220------------
600.0440----9434320.779----
900.0660------------
Type A: 2-channel serpentine (area c/s = 2 mm2). Type B: 25-channel parallel (area c/s = 25 mm2).
Table 5. Comparison of basic properties both Nafion-117 (N-117) and HS- HS-SO3H ion exchange membranes.
SamplesWater Uptake (wt%)IEC
(mmol/g)
Dynamic
Permeability
(×106 mL/s)
N-117210.997.00
HS-SO3H381.933.87
Table 6. The performance of charge-discharge test for the V/I RFB with various key materials.
Key materialsTypesCE
(%)
VE
(%)
EE
(%)
Separation membraneN-117936056
HS-SO3H946057
Negative electrodeCarbon paper (C)946057
C-TiO2-Pd938175
Type of flow fieldserpentine968683
Publisher’s Note: MDPI stays neutral with regard to jurisdictional claims in published maps and institutional affiliations.

