Abstract
The thermal sensations of people differ from each other, even if they are in the same thermal conditions. The research was carried out in a didactic teaching room located in the building of the Faculty of Civil and Environmental Engineering in Poland. Tests on the temperature were carried out simultaneously with questionnaire surveys. The purpose of the survey was to define sensations regarding the thermal comfort of people in the same room, in different conditions of internal and external temperatures. In total 333 questionnaires were analyzed. After the discriminant and neural analyses it was found that it is not possible to forecast the thermal comfort assessment in the room based on the analyzed variables: gender, indoor air temperature, external wall radiant temperature, and outdoor air temperature. The thermal comfort assessments of men and women were similar and overlapped. The results of this study confirm that under the same thermal conditions about 85% of respondents assess thermal comfort as good, and about 15% of respondents assess thermal comfort as bad. The test results presented in this article are similar to the results of tests carried out by other authors in other climatic conditions.
1. Introduction
The thermal sensations of people differ from each other, even if they are in the same environment and under the same thermal conditions. Although temperature sensors indicate the same results regardless of the geographical location in which the measurement took place, people perceive thermal comfort differently [1,2]. Also individuals in very similar rooms, in the same climate, belonging to a common culture, give very different opinions about the sensible thermal comfort.
Thermal comfort is a condition in which a person feels that his or her body is in a state of thermal balance, i.e., it does not feel either warmth or cold. The feeling of thermal comfort of people is caused by the combination of many factors affecting the perception of comfort [3,4,5,6]. Usually, thermal comfort or discomfort is treated as a subjective feeling.
There are currently two different approaches to the definition of thermal comfort, each of which has its own possibilities and limitations:
- (1)
- A rational approach to heat balance [7];
- (2)
- Adaptive approach [8].
A rational approach using data from research in an climatic chamber is characterized in Fanger’s [9,10,11] works.
An adaptive approach was developed on the basis of field studies [1], aimed at analyzing the real acceptability of the thermal environment, which strongly depends on the behavior of residents and their expectations. Adaptations were summarized by De Dear and Brager [7] in three categories: adaptation to behavior, physiological adaptation, and psychological adaptation. In recent years, various authors have encouraged field studies, in addition to laboratory experiments, in order to obtain more reliable information on real thermal comfort [12].
Wang’s research [12] on thermal conditions and thermal comfort in residential buildings in Harbin, north-east of China, showed that men are less sensitive to changes in air temperature than women, and the neutral temperature in men’s room was lower by 1.1 °C than for women.
In their studies, the authors of [13] also noticed differences in the perception of thermal comfort between the sexes. As the reason they indicated different metabolism in men and women. They justified to use actual metabolic rates. Their approach builds up predictions from the physical and physiological constraints, rather than statistical association to thermal comfort. Presented method designed of thermal demand of all occupants leads to actual energy consumption predictions and real energy savings of buildings.
The purpose of the study [14] is to investigate and determine the relationship between occupants’ thermal satisfaction and physiological responses, and to estimate their thermal satisfaction level via human physiological signals. This study also determined priority of local skin temperatures (as well as gender and BMI) by their impact on thermal satisfaction. Considering human physiological factors and gender demonstrated 88.52% accuracy model for estimating thermal satisfaction.
There is also a view that women feel thermal comfort conditions differently than men [12], so in this article it was decided to check the validity of this view for people in a temperate climate zone. The analysis included the influence of only the basic objective temperature parameters in the room on the perception of comfort by women and men. By selecting a uniform group of respondents, other factors were eliminated, often subjective and rather variable, e.g., different clothes, age, physical, and mental condition, health and individual properties of the organism or variability of thermal conditions in the room.
Many authors rely on thermal sensations analyzing thermal comfort regardless of the climate. The most frequently analyzed is the indoor air temperature [15,16,17]. There are also authors who prefer calculations of thermal comfort indicators, i.e., PMV, PPD, PET, SET [18,19,20,21]. It is a more technical method and less associated with people’s subjective feelings. In some rooms with a small number of people, it is the only method to determine comfort.
The aim of this work is to analyze the perception of thermal comfort by people in the room, based on the measurements made in the teaching room and surveys carried out in the group of students. The main objective of the analysis is to determine whether women and men experience thermal comfort differently under the same thermal conditions.
2. Materials and Methods
2.1. Experimental Research
The research was carried out in a university didactic teaching room located in the building of the Faculty of Civil and Environmental Engineering of the Bialystok University of Technology in north-eastern Poland. The building is a detached, two-story, with a full basement. In recent years, the building has been completely thermo-modernized. The scope of thermo-modernization works included insulation of external walls and flat roof, replacement of window frames, as well as modernization of the HVAC system. The HVAC system is equipped with thermostatic valves set at 21 °C. There is no mechanical cooling in the rooms. The room in which the research was carried out is located on the first floor of the south-west side. The tests were carried out in one room. The room is adjacent to other rooms and a corridor. In the neighboring rooms only temperature measurement was made. The air temperature in all adjacent rooms are the same.
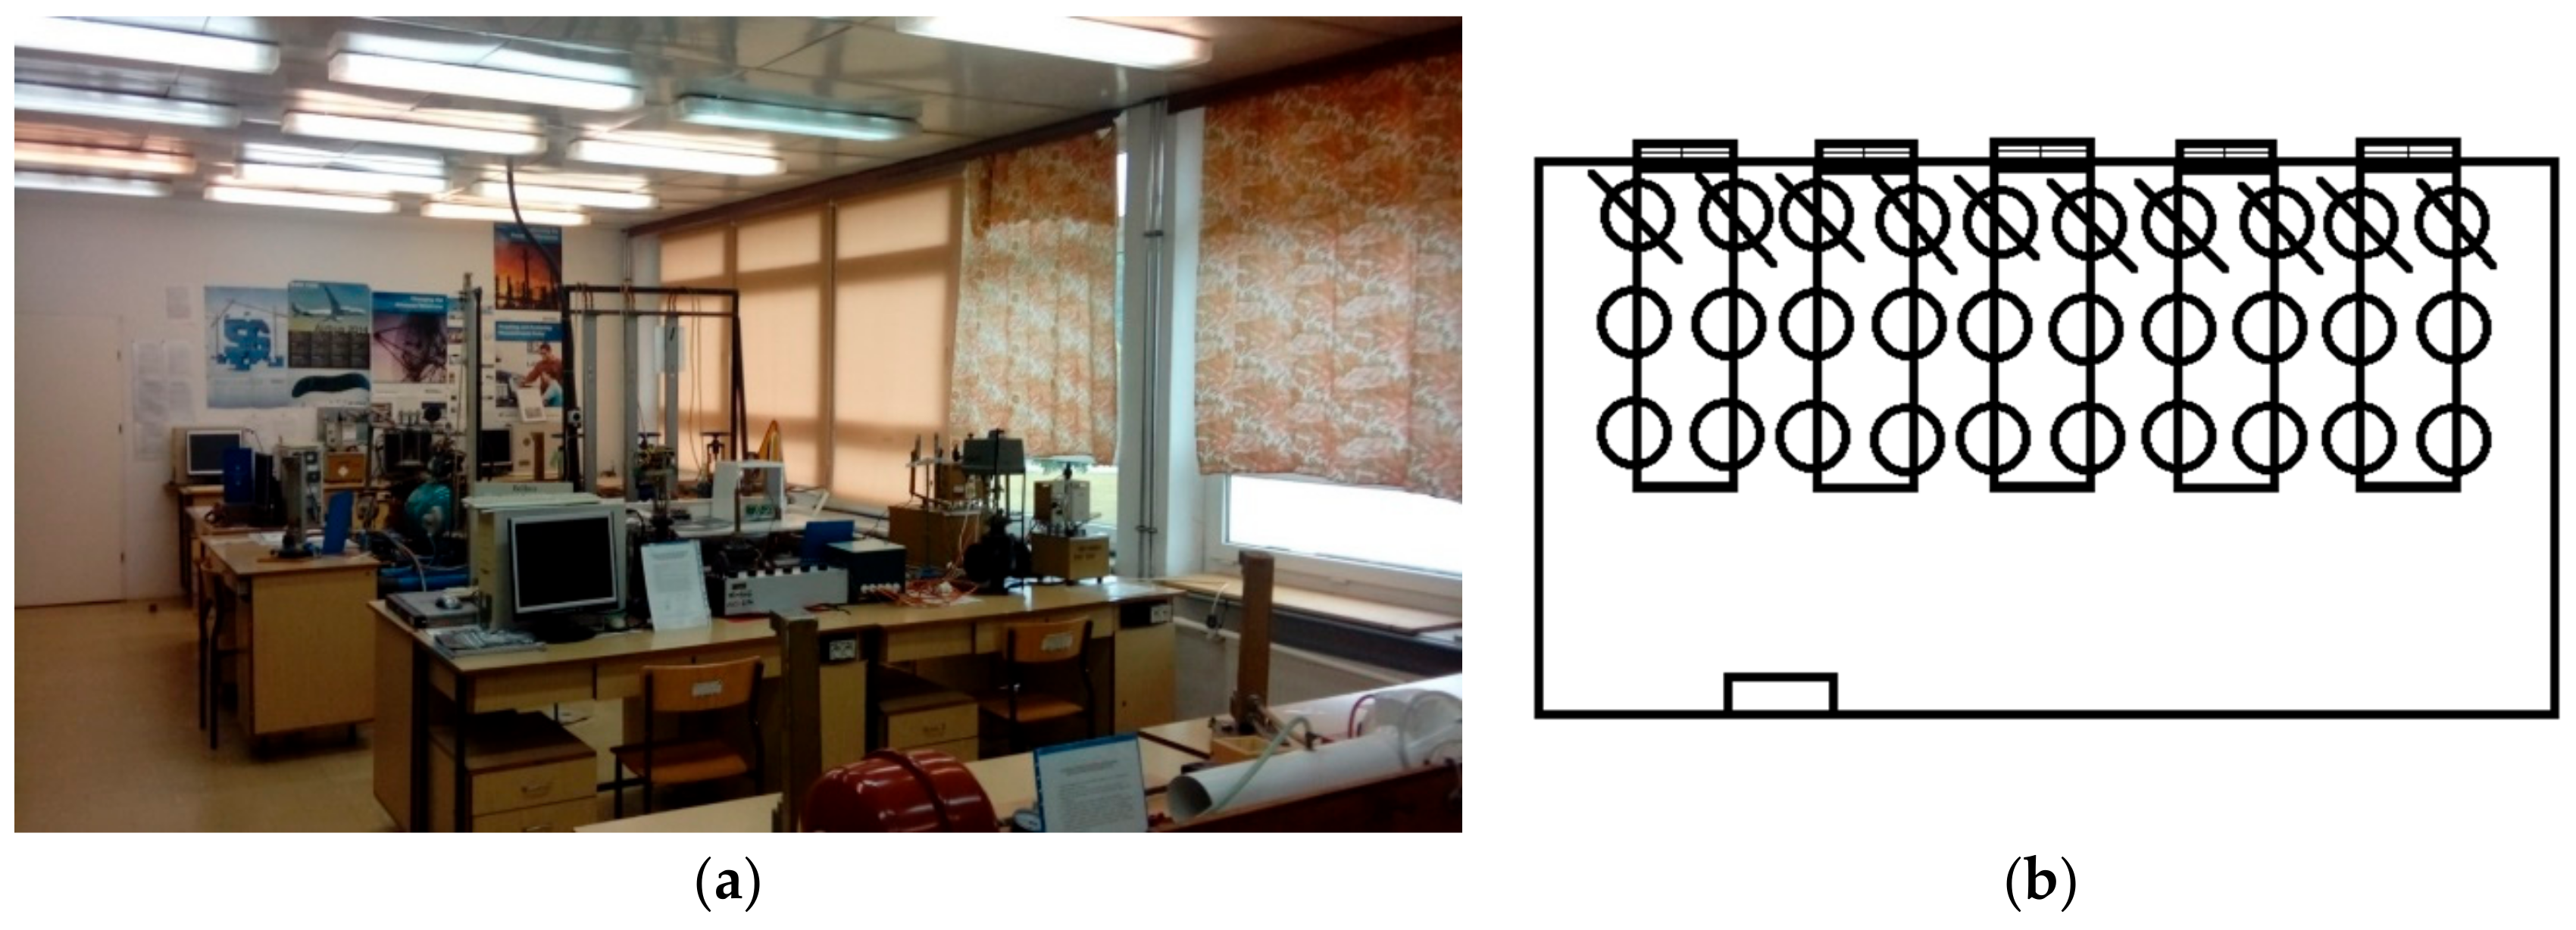
Figure 1 shows the test room, which has dimensions of 11.8 m × 5.57 m and a height of 3.0 m. The room has one outer wall and three inner walls. In the outer wall of the room there are nine windows facing the south side, 2 m high and 1.2 m wide, installed at a height of 0.8 m from the floor. On sunny days, the windows are a source of heat, therefore they have been equipped with blinds and curtains. During the experiment, computers (which are also a source of heat) remained off.
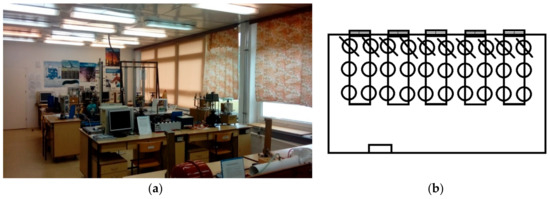
Figure 1.
Didactic teaching room in which the tests were conducted: (a) photo; (b) scheme, where the chairs are marked with circles, the chairs deleted were non occupied.
Tests on the temperature of air and mean radiant internal side walls in the teaching room were carried out simultaneously with student surveys. The experiment was carried out in periods with similar climatic conditions: in the spring calendar season (from March 21 to June 22, 2016) and in the autumn season (from September 23 to December 22, 2016). In one week, ten measurement series were carried out on average, in which 10 to 15 students participated [22]. In a typical day, there were two series of measurements. Outdoor temperature measurement for this study was taken from the weather station [23] and confirmed by own measurements taken simultaneously with the experiment in the room.
The studies included three objective basic physical parameters of the room: real indoor air temperature, external wall mean radiant temperature, and real outdoor air temperature. Air and wall parameters in all experiments were tested using the Testo 435-4 meter with various probes: the IAQ probe and the fast-reacting probe for measuring the surface temperature. The IAQ probe simultaneously measured the indoor air temperature, humidity, and CO2 concentration. The accuracy of the measuring device is described in the publications [24,25,26]. Measurements of internal air parameters were carried out at a height of approx. 1.00 to 1.10 meter from the floor and at a distance of approx. 2 m from persons in the room, and at a distance of about 2 m from windows and devices, as recommended ASHRAE [27]. First, the air room temperature was measured, followed by the mean radiant temperature of the partitions: the internal walls and the external wall.
2.2. Surveys
The surveyed students entered the didactic room from the hallway. During the measurements, they were dressed in their everyday clothes, in which they stayed in the building and felt good in terms of heat (without overcoats). The persons participating in the study completed surveys after approx. 10–15 minutes from entering the room. The time between entering the teaching room and carrying out the test was to allow the acclimatization of people with the thermal conditions prevailing in the room. Persons filling in the surveys remained in sedentary position and they did not do any physical work. The survey was developed for the needs of the author’s own experimental research.
During the test, the thermal conditions in the room were constant and the same for all participants. Other factors that could affect the respondents’ comfort also remained the same.
The respondents filled out the following questionnaire form:
- Date of survey:
- Gender: W/M
- Comfort: bad (too cold or too hot); good (neither too cold nor too hot)
In total 333 questionnaires were analyzed. The questionnaires were filled out by 199 women and 134 men.
2.3. Limitations of the Research
The purpose of the survey is to define sensations regarding the thermal comfort of young people in the same room, in different conditions of internal and external temperatures.
The studies did not take into account the thermophysical properties of building materials and components, as they were the same for all respondents. Also, air velocity and relative humidity were the same for all respondents. Fluctuations of these parameters during one research session were small (2%). It has assumed that the most important factors are: indoor and outdoor air temperature and the external wall temperature.
The empirical research was conducted with a convenience sample of people (non-probability sampling method) [28]. Non-probability sampling technique is widely used when researchers aim at conducting qualitative research, pilot studies or exploratory research. Convenience sampling is the most common of all sampling techniques. With convenience sampling, the samples are selected because they are accessible to the researcher. This technique is considered easiest, cheapest, and least time consuming.
The survey was carried out on a uniform group in terms of age and physical condition, representing young, healthy people in their early adulthood, i.e., aged 23–34 (here 22–23). This age is defined as the peak of physical development [29]. In this way, it is possible to exclude the probable impact of differences in the sense of comfort caused by different physical condition related to age (no effects of possible differences in the physical condition of the subjects, physical disability, impairment of health or chronic diseases). The study did not consider how students were dressed. It was assumed that each of them dressed so that he was thermally well. The issue of why thermal comfort is perceived as bad—whether it is too warm or too cold—has not been analyzed.
In the article no indicators of comfort were calculated, therefore in further analyzes neither relative humidity nor air velocity in the room were taken into account (although these values were measured).
2.4. Mathematical Tools Used in the Analysis of Research Results
The following mathematical tools were used to analyze the results of the research: linear discriminant analysis (LDA) and artificial neural networks (ANNs).
The question under consideration was solved as a classification problem using linear discriminant analysis (LDA) and artificial neural networks (ANNs). Data analysis was carried out using the computer software Statistica 12 [30,31].
2.4.1. Linear Discriminant Analysis (LDA)
Discriminant analysis is a statistical procedure enabling examination of differences between two or more groups, by analyzing a few variables simultaneously [30].
The procedures for the classification of cases are determined using one or more functions that classify the analyzed cases into appropriate groups. As the analysis tool, discriminant analysis was chosen because one of the independent variables (X1 = gender code) was a qualitative variable.
The linear functions are the most commonly used as the canonical discriminative functions separating groups. The number of discriminatory functions does not exceed the number of discriminatory variables or the number of groups minus one, depending on which is smaller. With us, only one discriminatory function can be specified, because we only have two groups of thermal comfort: g (good) or b (bad). In the case of two groups, discriminant analysis is analogous to multiple regression and is then called Fisher linear discriminant analysis (LDA) [32,33]. In the case of two groups, the linear equation is used as a discriminatory function:
where: xi, i = 1, …, m is a i-th discriminant variable, a is constant and b1 – bm are regression coefficients.
group = a + b1x1 + b2x2 +…+ bmxm,
Wilks’ lambda is a standard statistic used to determine the statistical significance of discriminatory power by currently selected discriminant variables and its value ranges from 1.0 to 0.0. Wilk’s partial lambda statistic defines the specific contribution of a given variable to group discrimination. As for Wilks’ lambda statistic, the value of Wilks’ partial lambda statistics of 0.0 means excellent discriminative power, and 1.0 means no discriminatory power. The smaller the Wilk’s partial statistics value, the higher the discriminant power of a given variable.
2.4.2. Artificial Neural Networks (ANNs)
Artificial neural networks (ANNs) is a modern mathematical tool used in almost all fields of science and in practice [34]. The use of artificial neural networks allows modelling of complex processes depending on many factors. It is an alternative method to statistical methods and their advantage is that, unlike statistical procedures, they do not require many theoretical assumptions. ANNs often allow the development of better models of phenomena than statistical models and are characterized by resistance to damage and can be improved as new data for network training is acquired [34,35]. Disadvantage of ANNs is the lack of an explicit model and the need to collect a large dataset [35,36].
ANNs are used to solve various complex problems related to: prediction [36,37], classification, and recognition of group elements [38,39], optimization [40,41], matching, analysis and filtering of signals [42] and many other issues.
The most commonly used are multilayer networks (most often with one hidden layer) with the unidirectional signal flow (feedforward) of multi-layer perceptron type (MLP) as regression and classification models, with the following structure: N-H-M, where: N is the number of input neurons, H is the number of neurons in the hidden layer, and M is the number of output neurons.
The number of input neurons corresponds to the number of explanatory variables (N = Xi, where i = 1, …, N), the number of output neurons is equal to the number of explanatory variables (M = Yk, where k = 1, …, M). The number of neurons in the hidden layer H is determined by an iterative method in the process of learning of neural networks based on the analysis of network error measures. The collected dataset is divided randomly into subsets: learner (L), test (T), and validation (V). The network learning process is based on such determination of weights (numerical coefficients) of individual neurons, so that the neural network at the output gives the values of the explanatory variables as close as possible to their real values. This is the process of repeated network feeding of all instances of the learning subset of data (L) and network weights correction (back propagation). One cycle of feeding the whole set of learning data is called the epoch (epoch). Every now and then network error measures are controlled on a test subset (T), and the final check is performed on a validation subset (V) that is used for this purpose only once. The learned, ready-made neural network is characterized by fixed parameters: structure (architecture) and weight values assigned to each network neuron.
A measure of the quality of the model is the area under the ROC (receiver operating characteristic) curve (AUC). For an ideal network AUC = 1. AUC values equal to or below 0.5 indicate the ineffectiveness of the model. AUC = 0.5 is obtained with random selection.
3. Results and Discussion
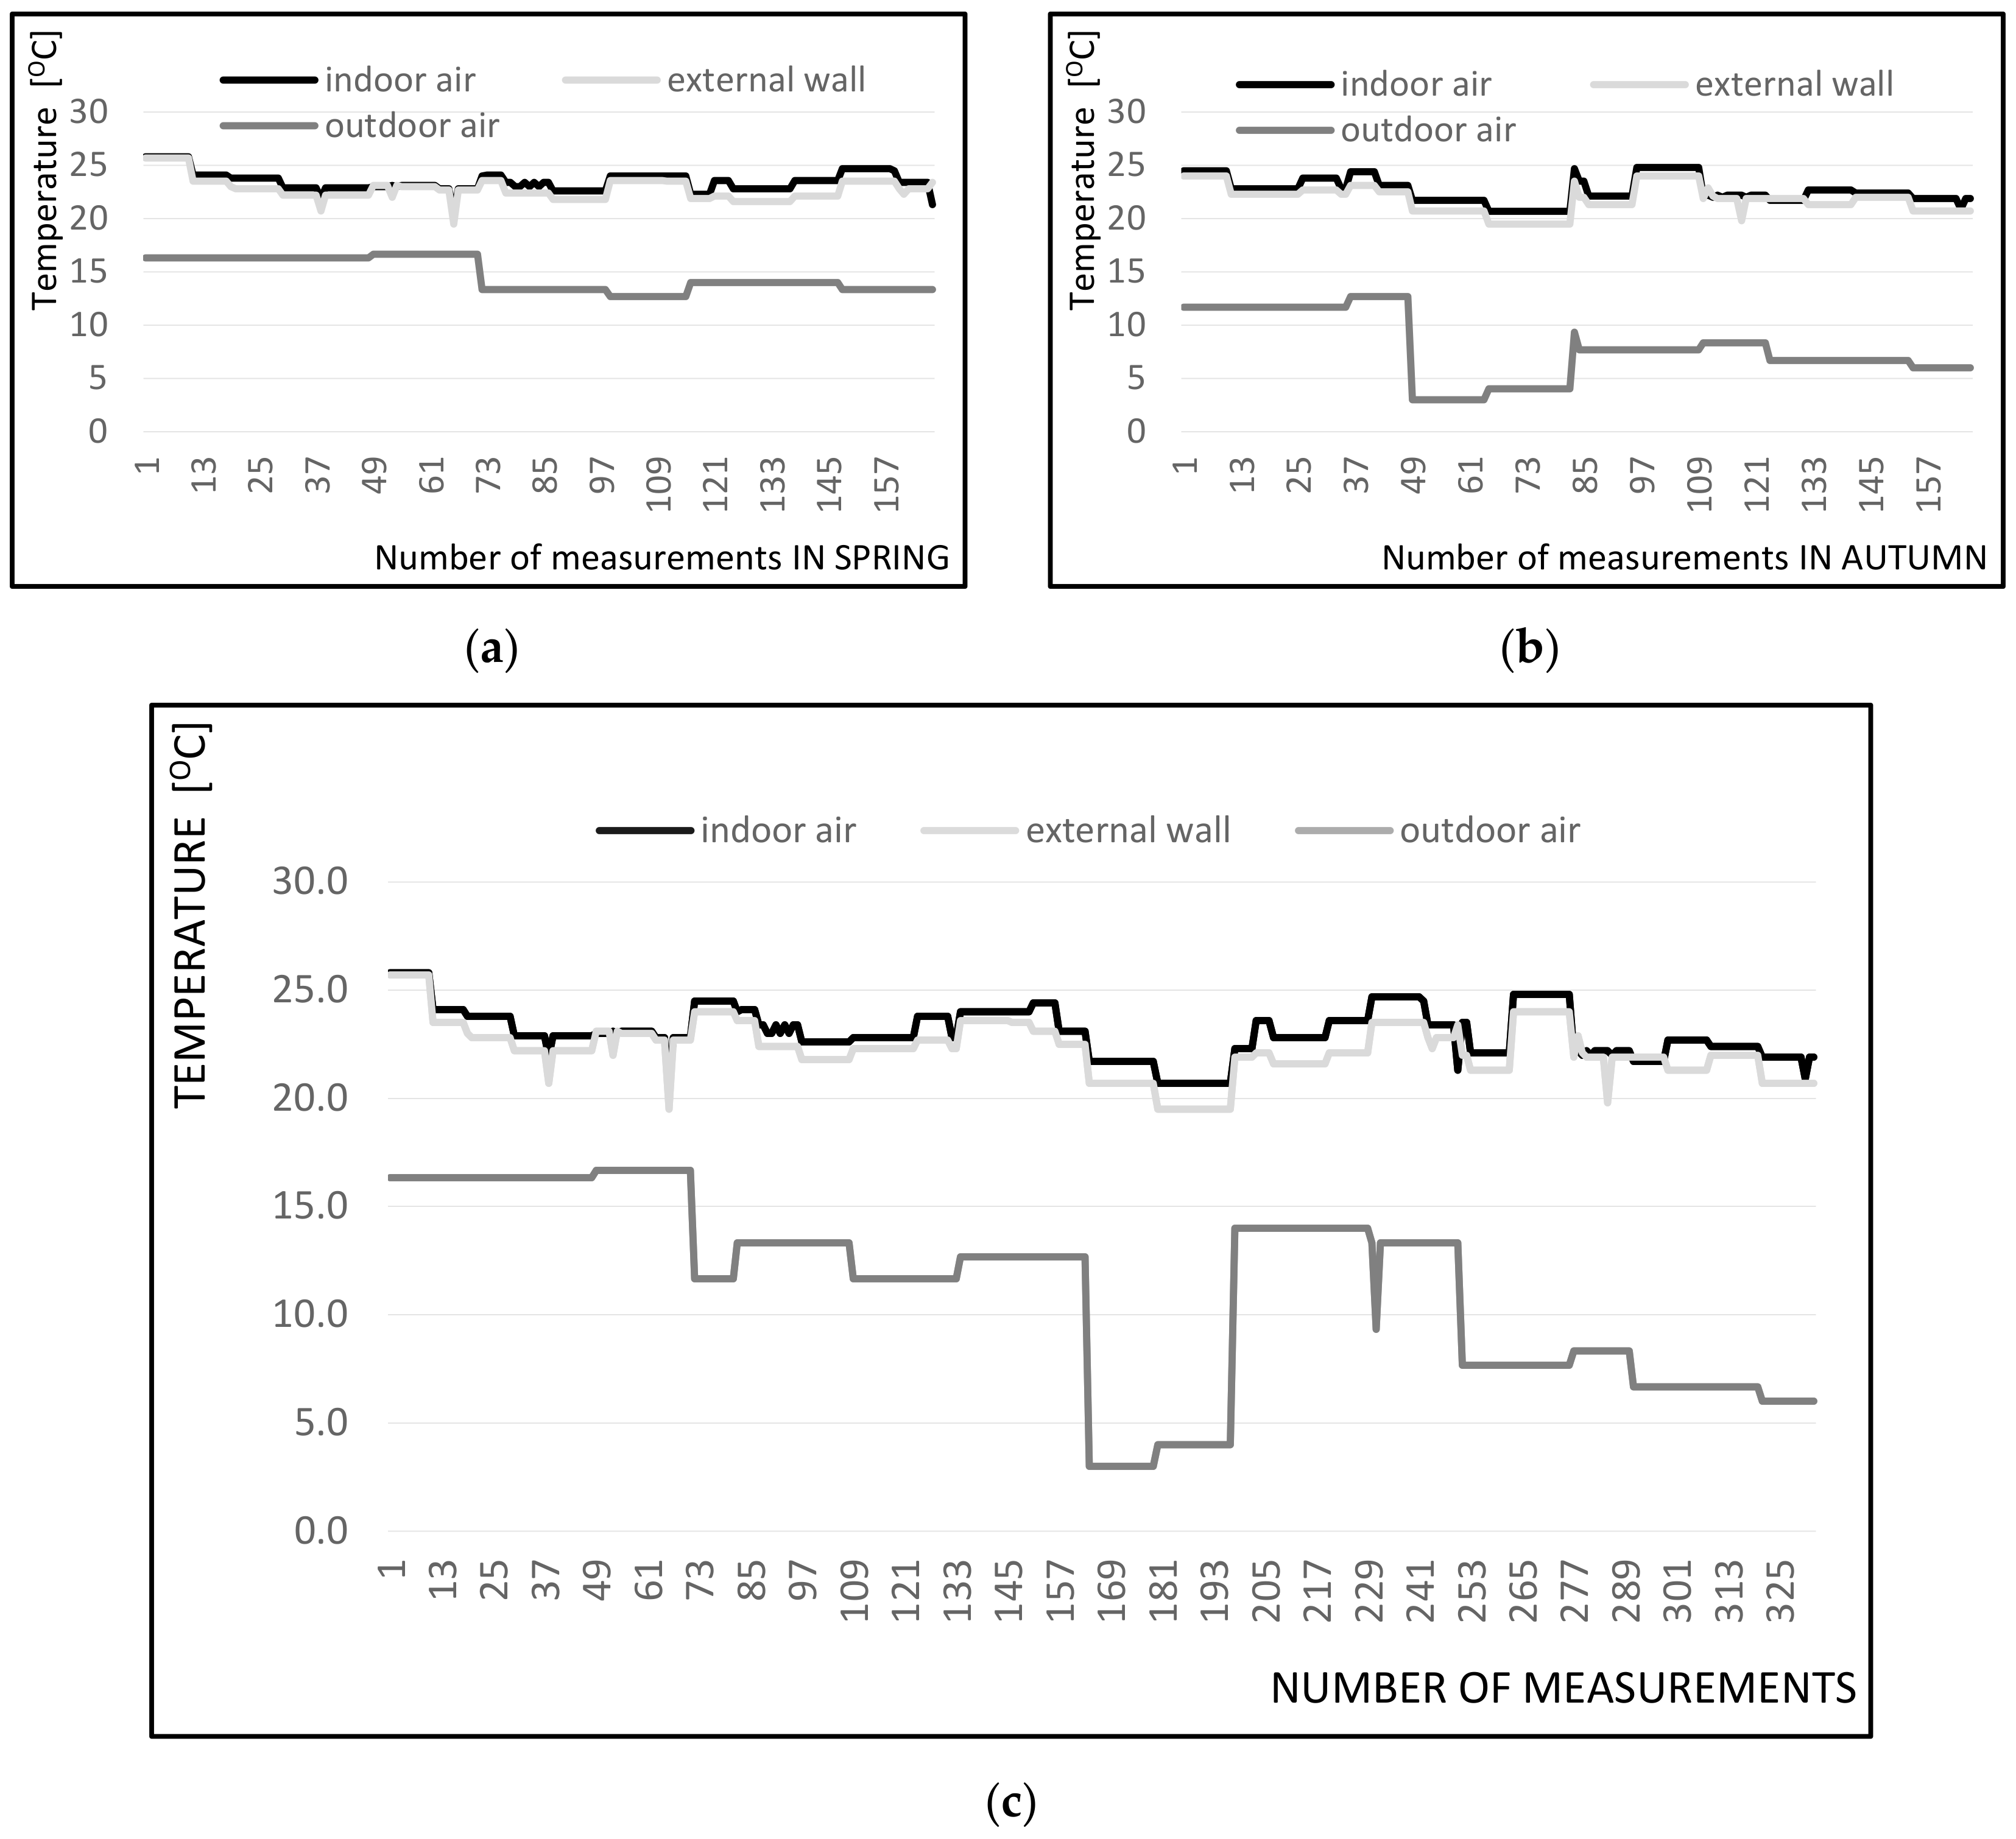
The results of measurements of indoor and outdoor air temperature and mean radiant temperature of the external wall of the room are shown in Figure 2. In Figure 2a,b, the X-axis shows measurements taken in spring and autumn. In Figure 2c X-axis represents all measurements taken in the whole monitoring period. The three internal walls always have a temperature similar to the air temperature in the room. The actual temperature of the indoor air in the room where the experiment was conducted varied within 20.7–25.8 °C, whereas the mean radiant temperature of the external wall fluctuated within 19.5–25.7 °C.
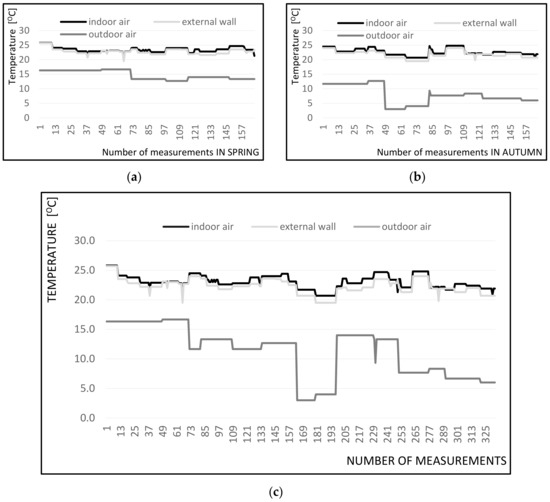
Figure 2.
Air temperature and external wall mean radiant temperature of: (a) spring, (b) autumn, (c) both seasons.
The mean radiant temperature of the external wall was always lower than the internal air temperature. The temperature difference increased with the outside temperature drop. External air temperature measurements were made during experiments. The temperature of the outside air in spring and autumn ranged from 3.0 to 16.7 °C. It can be noticed that the mean radiant temperature of the external wall and the indoor air temperature were almost equal (the average temperature difference was approx. 1–2 °C, the maximum temperature difference was 3–4 °C).
The relative humidity of the indoor air during the experiment ranged from 35 to 42%. The air velocity in the room ranged from 0.86 to 1 m/s.
The average real indoor air temperature was 22.9 °C and the average real outside wall mean radiant temperature was 22.0 °C.
During the experiment, the respondents defined thermal comfort as good, 281 people (good 84.4% of all answers), or bad, 52 people (15.6% of all respondents, including: too hot (12 women, 14 men), too cold (22 women, 4 men)). Thermal comfort rated as good was declared by: 165 out of 199 women, which is 82.9% of women and 116 out of 134 men, which is 86.6% of men. Thermal comfort was bad as assessed by: 34 out of 199 women, which makes up 17.1% of women and 18 out of 134 men, which is 13.4% of men. In general, about 4% more men than women considered comfort as good, that is, for approx. 4% women more than men, thermal comfort was unsatisfactory.
Other authors conducted similar research in the tropical city of Makasar (Indonesia) [15]. The purpose of their research was to determine the acceptability of high temperatures by a group of secondary school students in a hot climate. More than 86% of respondents accepted thermal conditions. But if there was a chance, 72% of respondents would like a lower air temperature.
Similar thermal acceptability (above 85%) by people of different nationalities participating in the study was also obtained by the authors of the study in Japan [16]. In Portugal, thermal comfort was accepted by over 85% of respondents [18]. The same results were obtained from studies in Spain [19] and India [17]. The results of these various studies testify to one. Man has a great ability to adapt to existing conditions. The authors from Portugal concluded that if gender is added as an analysis factor, it can be seen that TSV does not shown significant differences between male and female respondents [18].
The dataset consisted of n = 333 cases, described by the following five variables, where Y – dependent variable, Xi, i = 1 – 4 independent variables:
- (1)
- Qualitative variable: Y = b or g – assessment of thermal comfort, where: b – bad thermal comfort, g – good thermal comfort, with subsets’ content: nb = 52, ng = 281,
- (2)
- Qualitative variable: X1 ϵ [0,1] – respondent’s gender code: W or M, where: W = 0 for women, M = 1 for men, with subset’s content: nW = 199, nM = 134,
- (3)
- Quantitative variable: X2 ϵ [20.7 – 25.8 °C] – actual indoor air temperature,
- (4)
- Quantitative variable: X3 ϵ [19.5 – 25.7 °C] – external wall mean radiant temperature,
- (5)
- Quantitative variable: X4 ϵ [( + 3) – (+ 16.67) °C] – actual (real) outdoor air temperature.
The discriminant analysis was used to determine:
- (i)
- Whether it is possible to distinguish one group from another (thermal comfort assessment as good or bad) on the basis of several variables (discriminatory);
- (ii)
- How well discriminatory variables distinguish group data?
- (iii)
- Which variables are best at discriminating?
A discriminant analysis was carried out, the purpose of which was to demonstrate that it is possible to predict the thermal comfort assessment based on variables X1-X4.
The summary shows that the following values obtained: number of variables Xi in model (1) is 4, value of Wilks lambda statistic = 0.9933, statistics value F = 4.328, computer probability level p = 0.56 > 0.05, which means that the discrimination function is statistically insignificant.
The assessment of the usefulness of particular Xi variables to prediction of group affinity is shown in Table 1. As can be seen, p > 0.05 is present for all variables Xi, which means that the assessment of thermal comfort cannot be predicted on the basis of any of the variables.

Table 1.
A choice of discriminant variables.
Case classification matrix enables observation which cases were classified incorrectly (Table 2).

Table 2.
Case classification matrix.
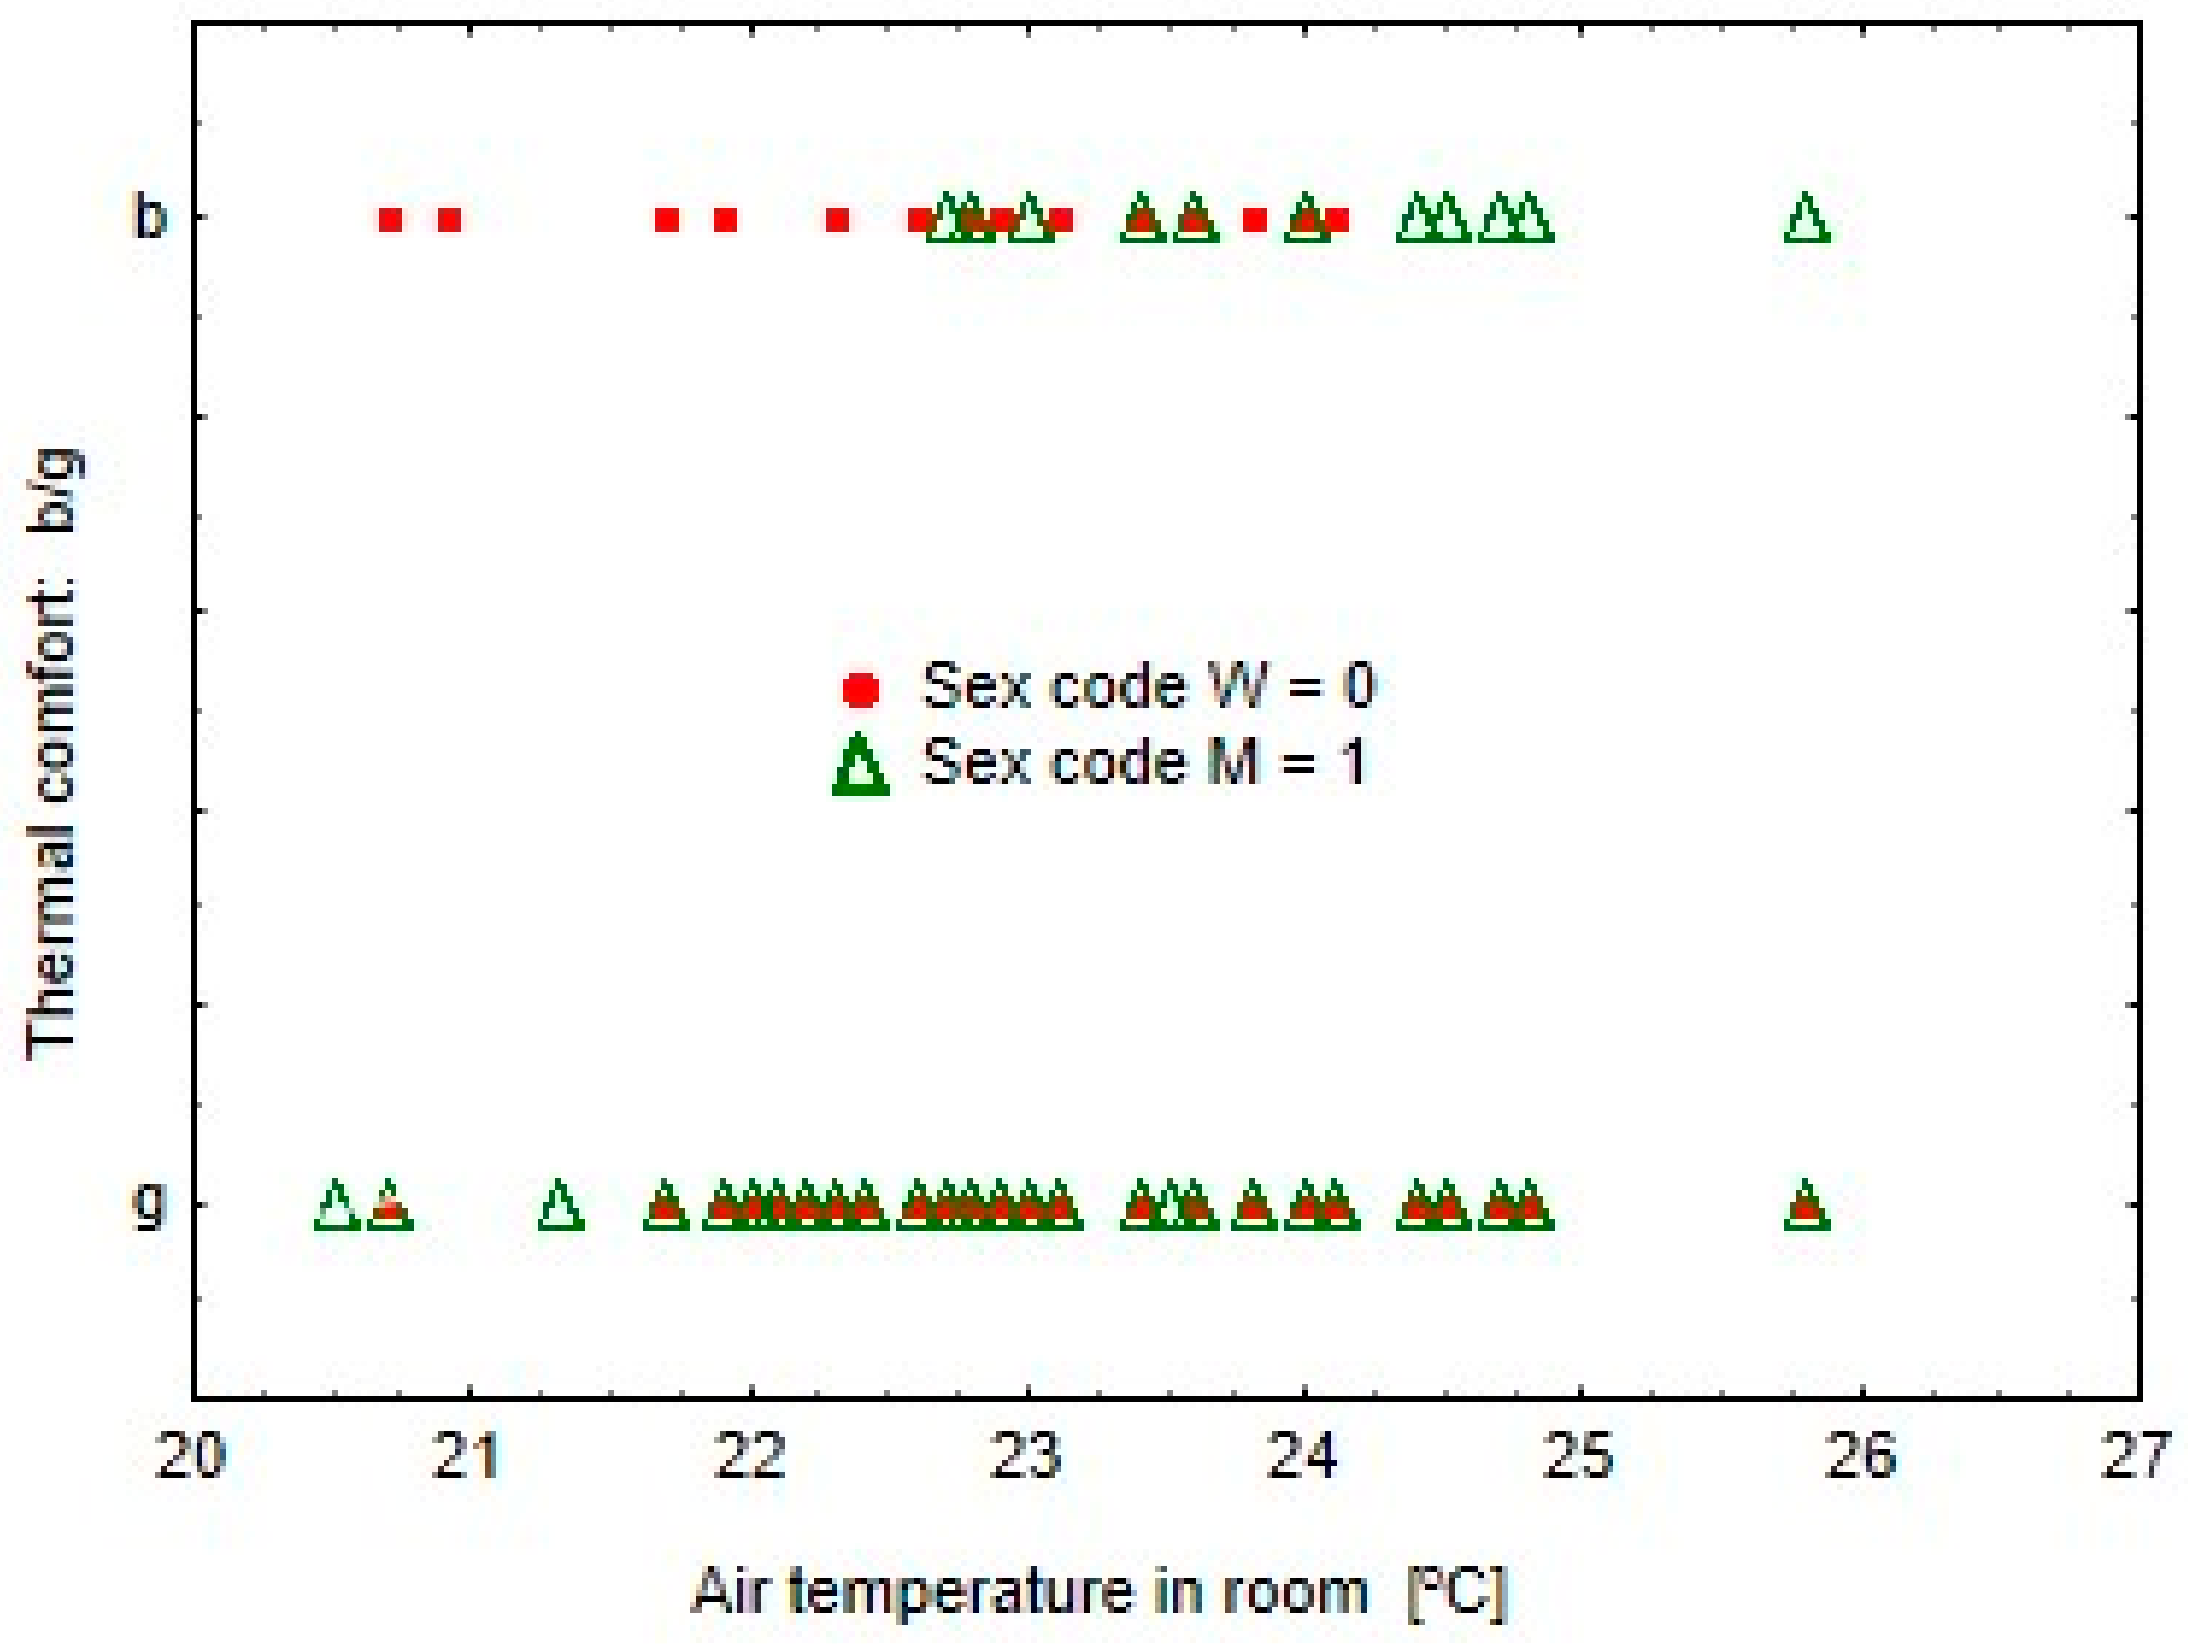
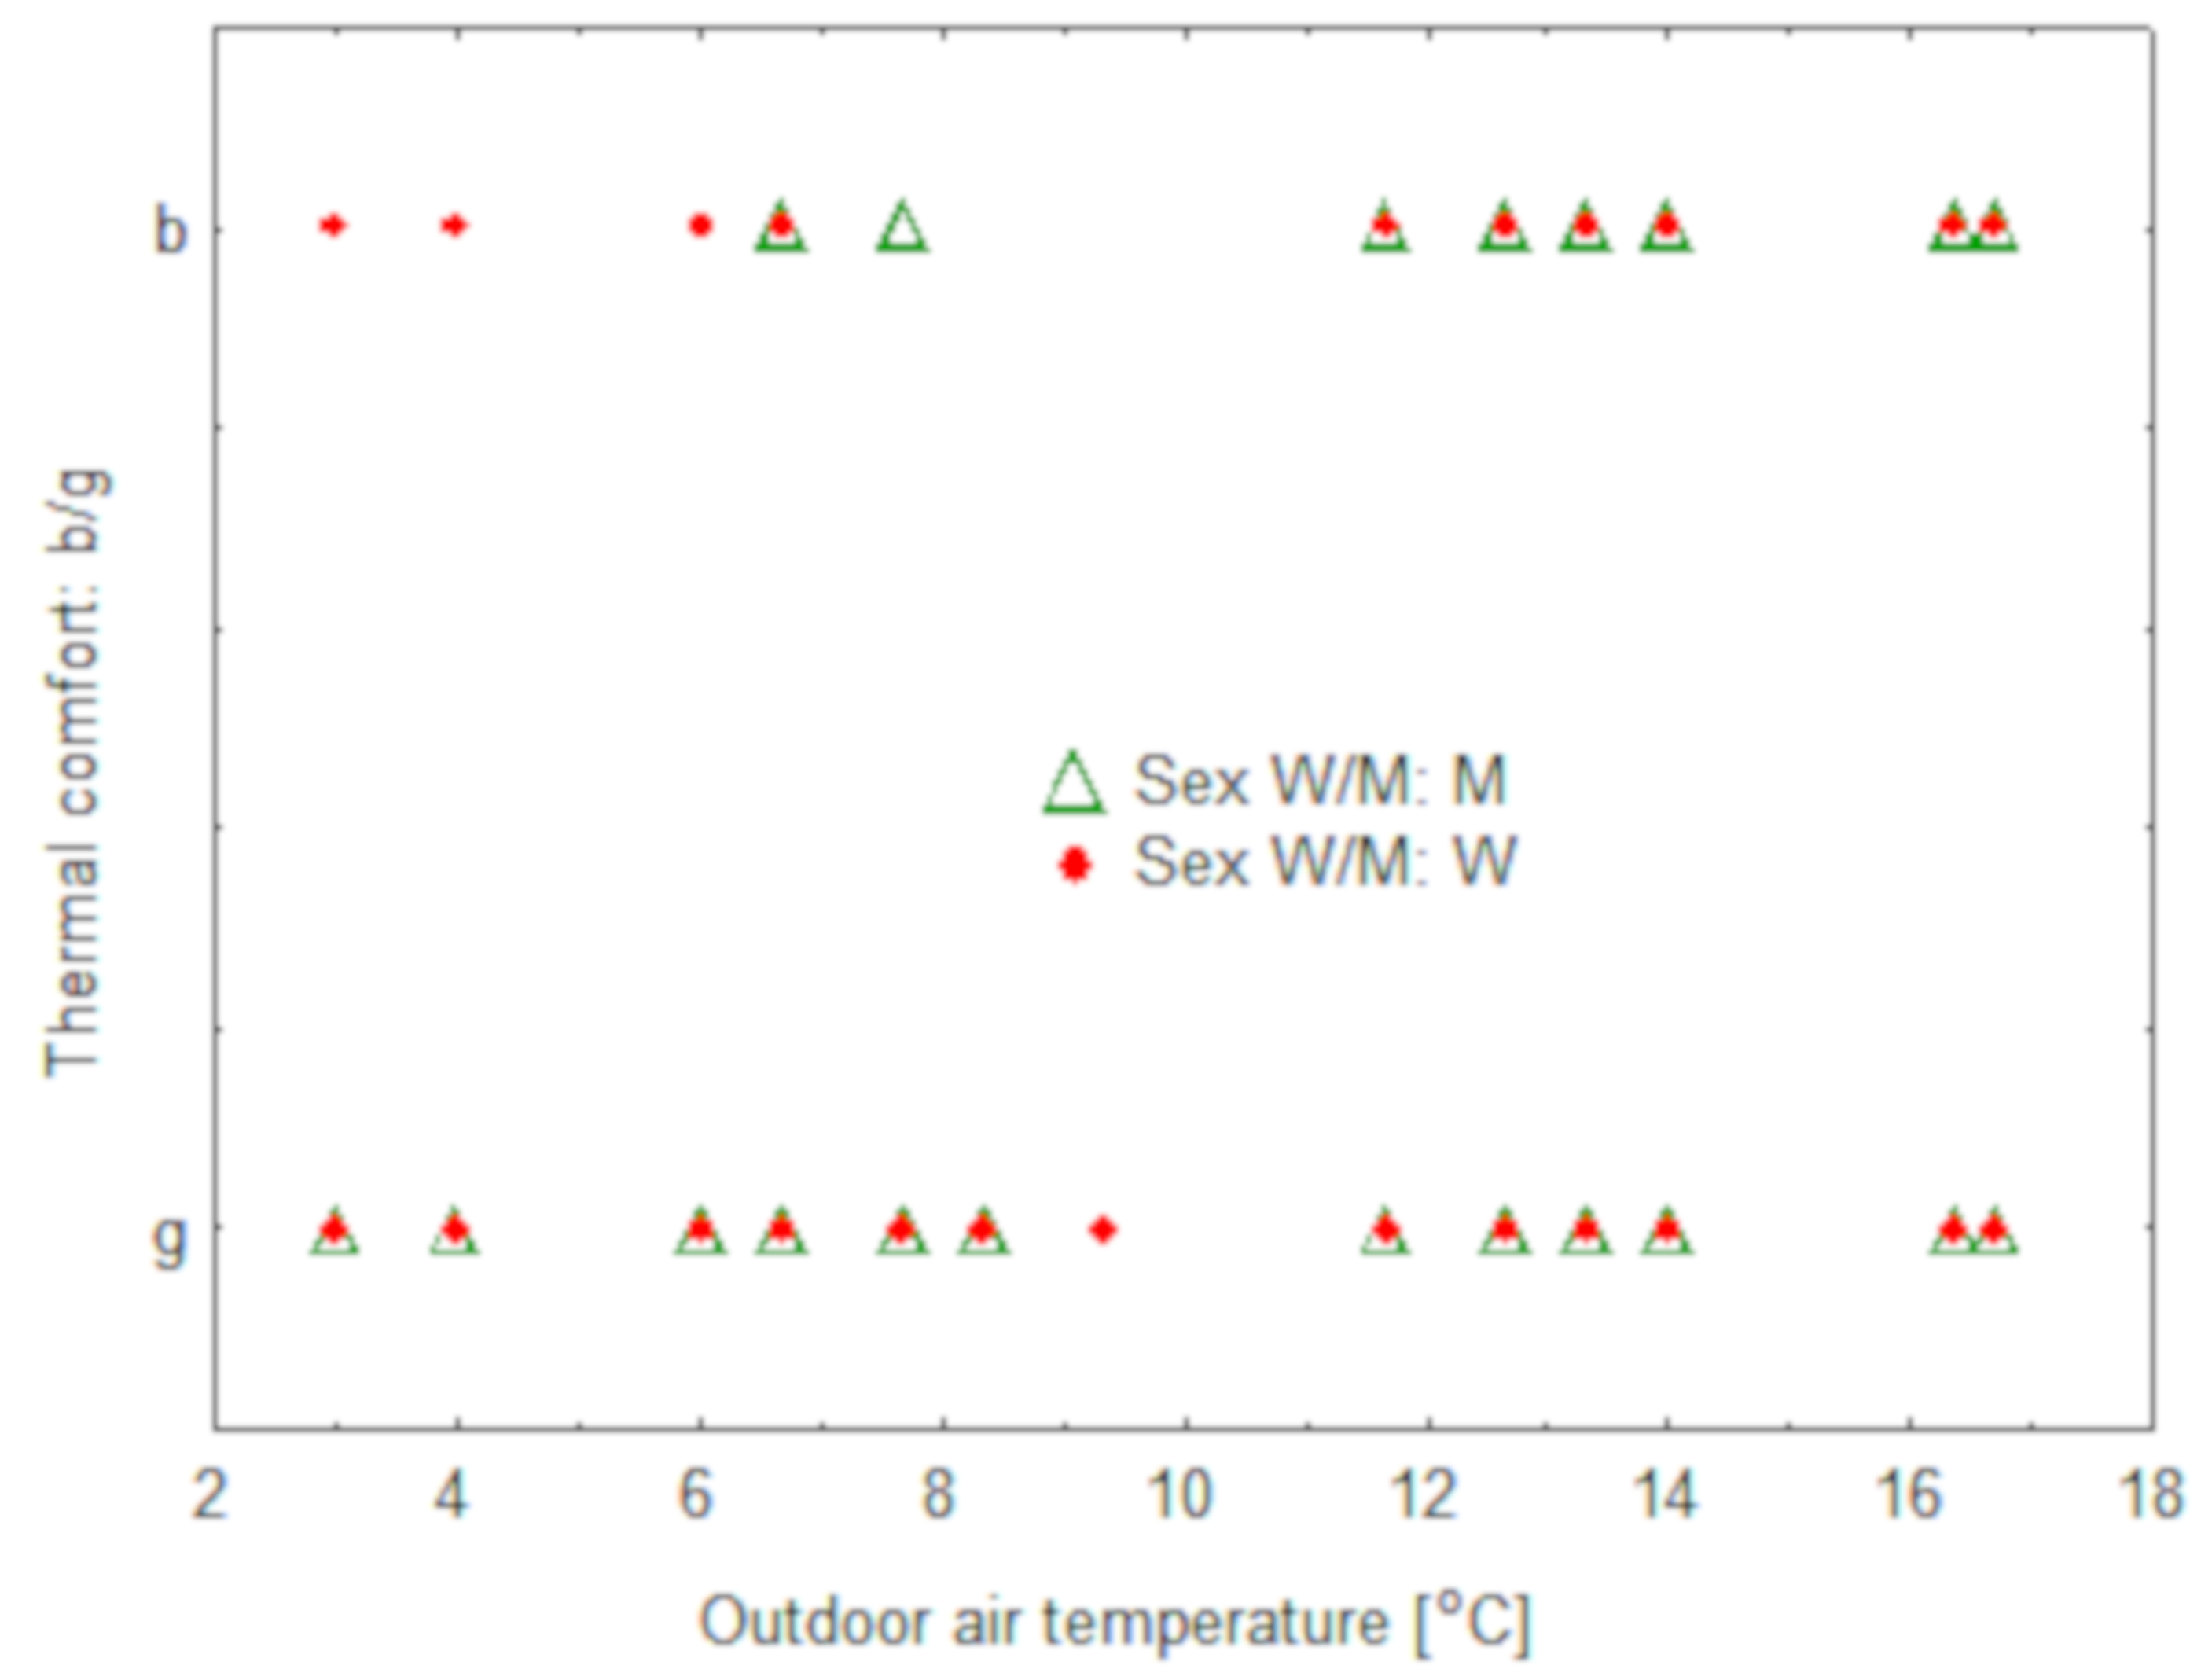
Since the output variable Y has highly unevenly distributed classes, it could be assumed that a class (good, bad) with a smaller frequency will be mistakenly recognized. As it can be seen in Table 2, all cases of good comfort assessment were classified correctly, and all cases of comfort assessment as poor were classified incorrectly and recognized as good. The explanation of this situation is illustrated in Figure 3 and Figure 4.
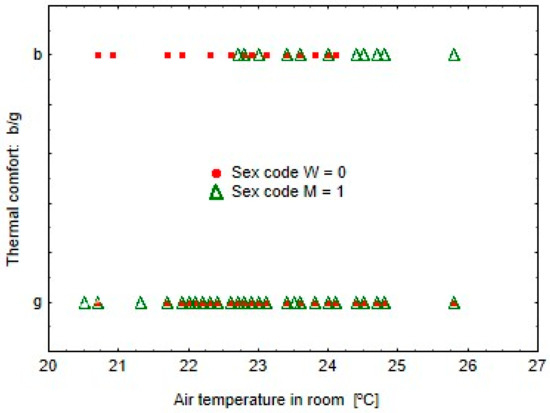
Figure 3.
Dependence of thermal comfort on the actual indoor temperature X2 and the gender of the respondent.
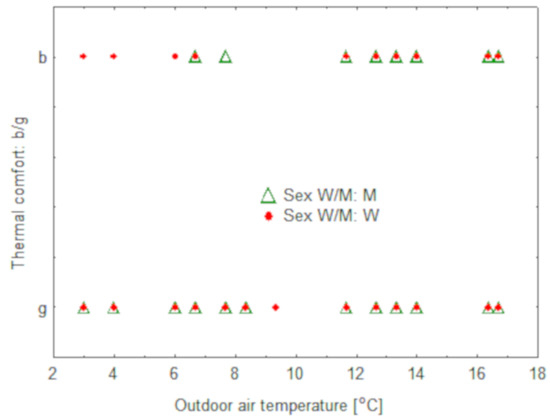
Figure 4.
Dependence of thermal comfort on the actual outdoor temperature and the gender of the respondent.
Figure 3 and Figure 4 show that the majority of thermal comfort ratings for both good and poor rates coincide with each other for women and men, regardless of the value of variables X2 or X4. On this basis, it can be concluded that the perception of comfort does not depend on the sex of the respondent.
It can be seen in Figure 3 that in the group of persons who described comfort as bad, men more often stated that comfort is bad at higher indoor air temperatures, and women at lower temperatures. This observation concerns only less than 2% of respondents. The ranges of good comfort for men and women coincide in a very wide temperature range from approx. 20.7 to 25.7 °C.
Figure 4 shows that in the assessments of good and bad comfort depending on the outside air temperature, men and women mostly agree with each other.
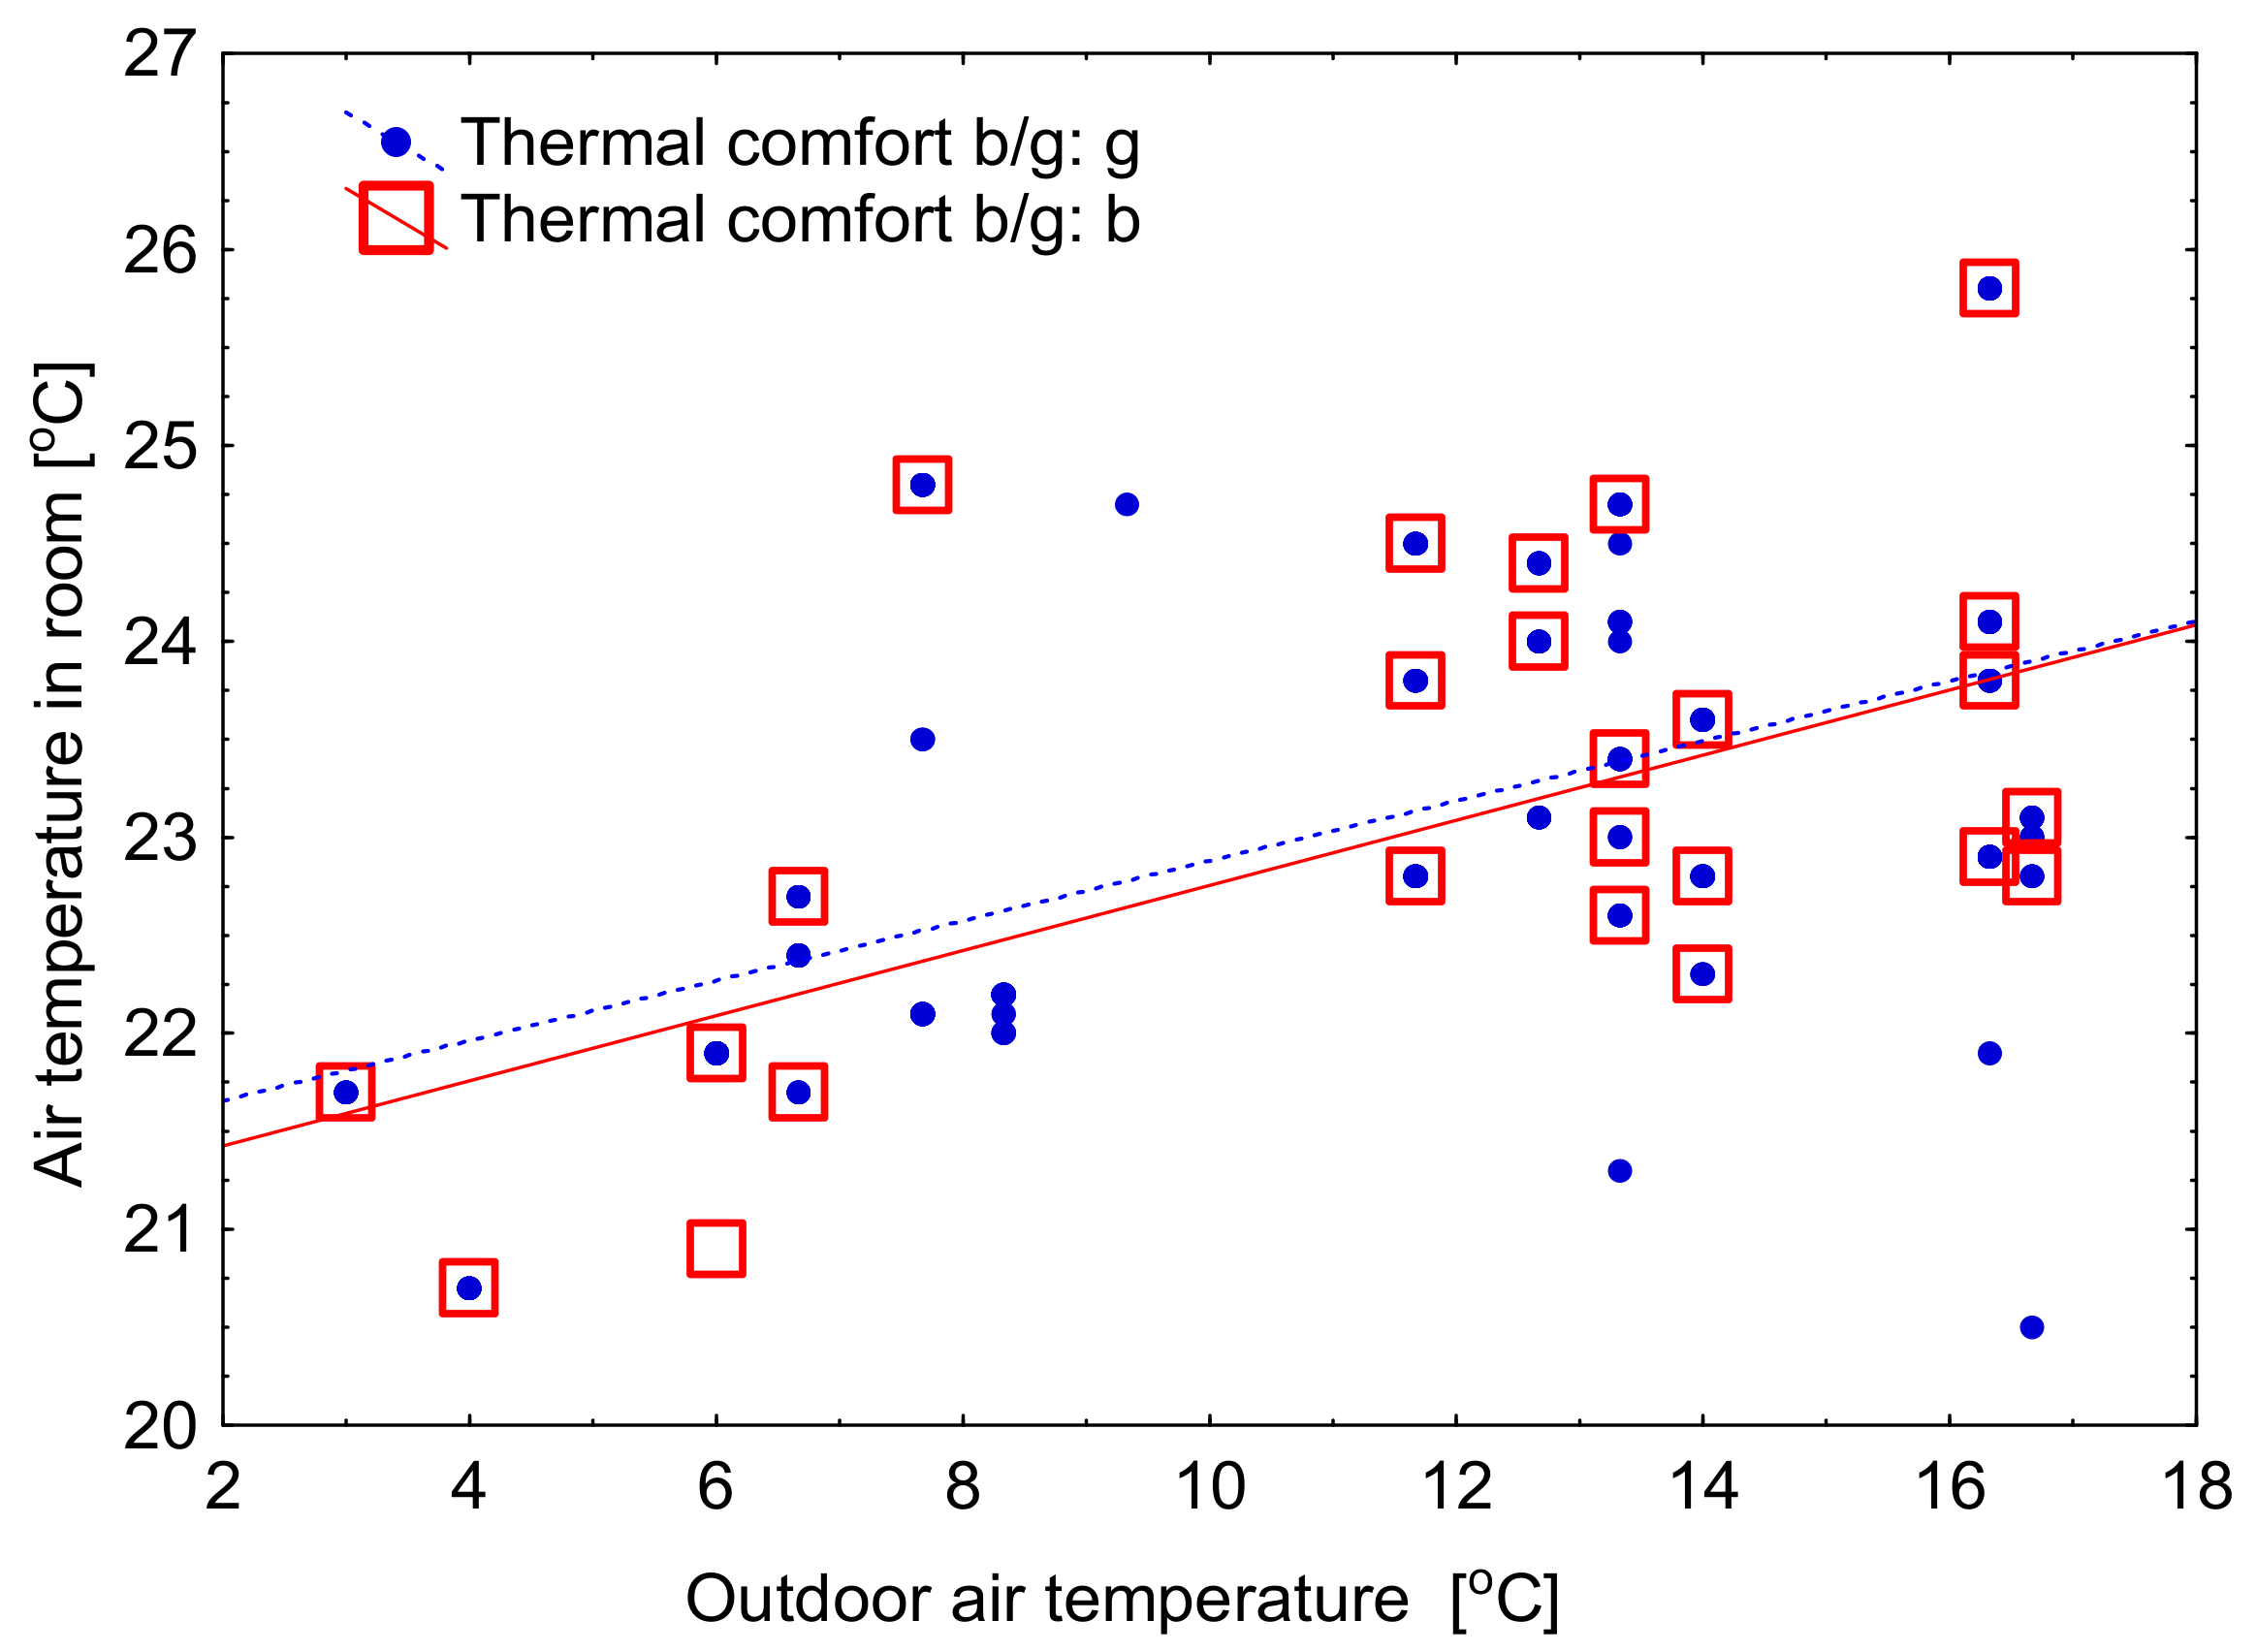
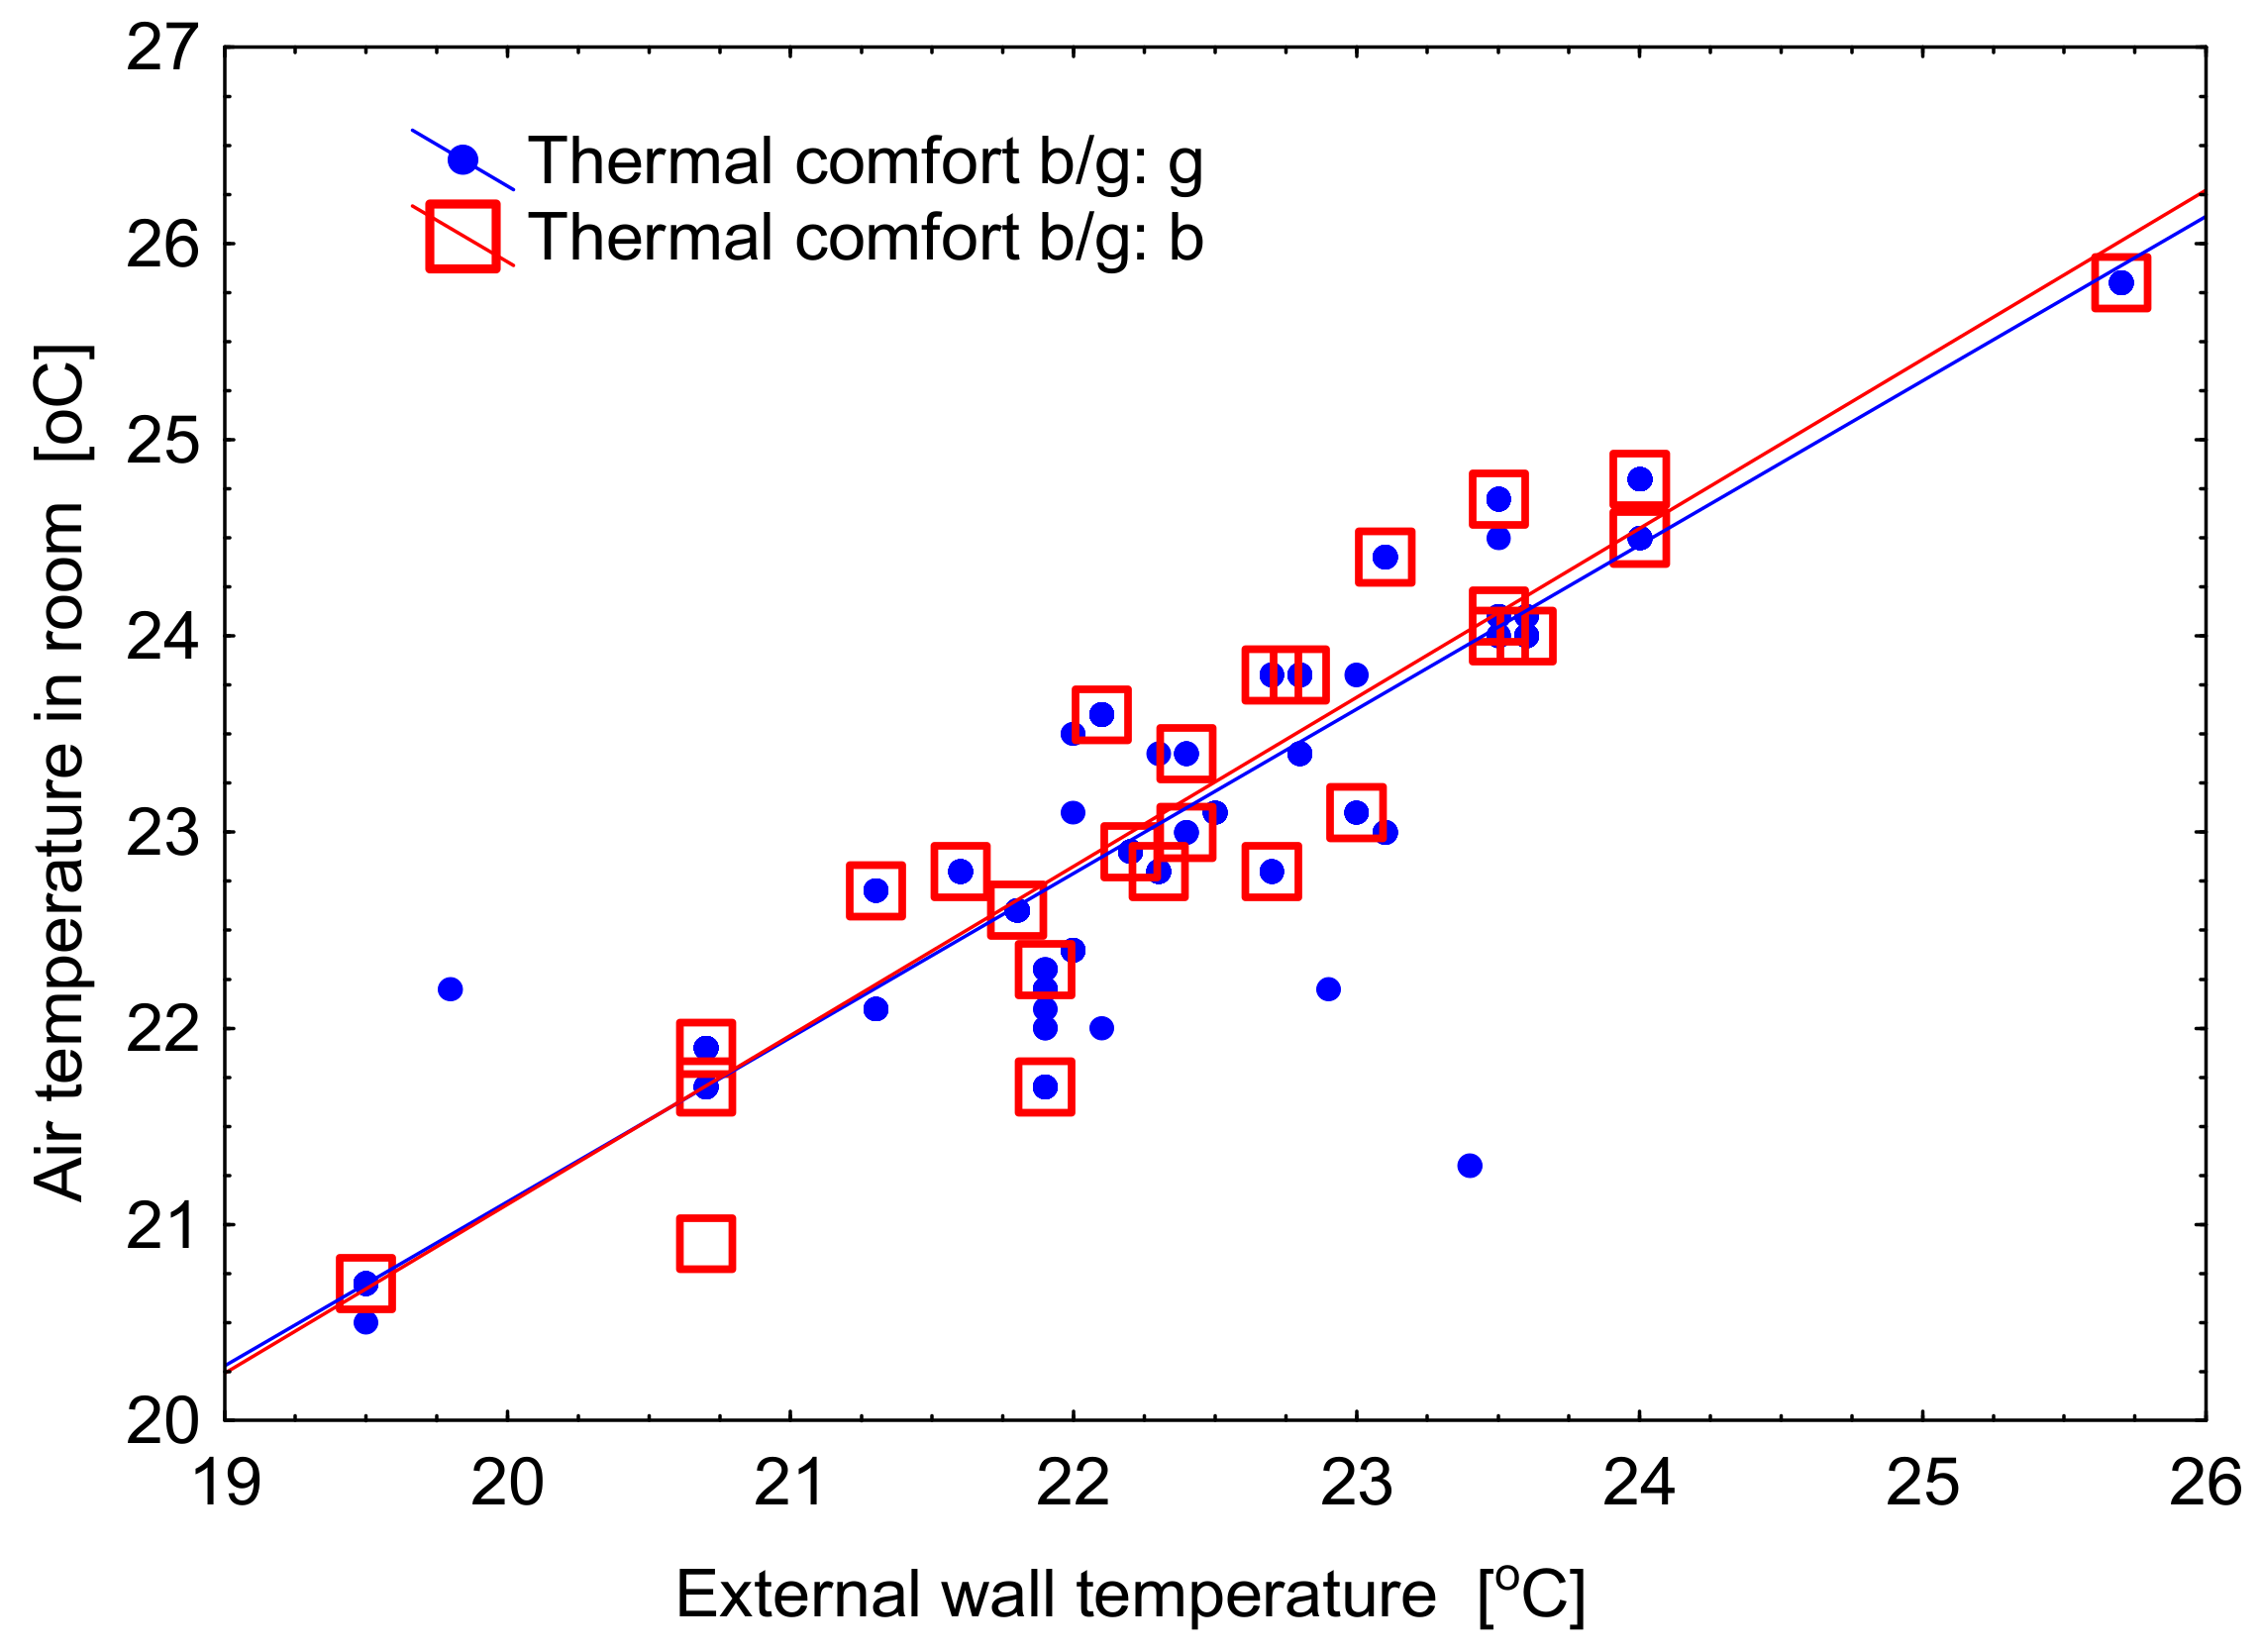
This is confirmed by the diagrams presenting dependence of the actual indoor air temperature on the outdoor temperature when assessing comfort as good or bad. For good and poor comfort, the diagrams almost coincide (Figure 5). Similarly, there is a coincidence of the diagrams showing dependence of the actual indoor air temperature on the mean radiant temperature of the external wall in the assessment of comfort as good or bad (Figure 6).
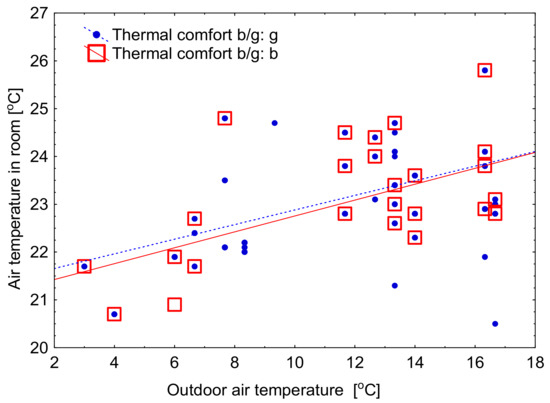
Figure 5.
The dependence of the actual indoor temperature on the actual outdoor air temperature and their influence on the thermal comfort assessment.
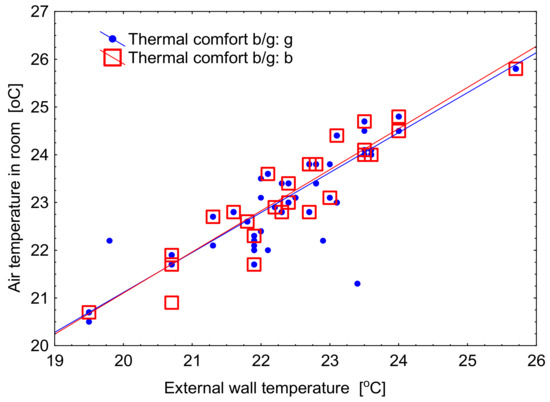
Figure 6.
The dependence of the actual indoor temperature on the mean radiant temperature of the external wall and their influence on the assessment of thermal comfort.
Since it was found that by means of linear discriminant analysis it is not possible to properly classify the thermal comfort ratings into two groups, an attempt was made to use artificial neural networks for this purpose.
Artificial neural networks of multilayer perceptron type (MLP) with one hidden layer have been applied to predict the classification of thermal comfort ratings in two groups.
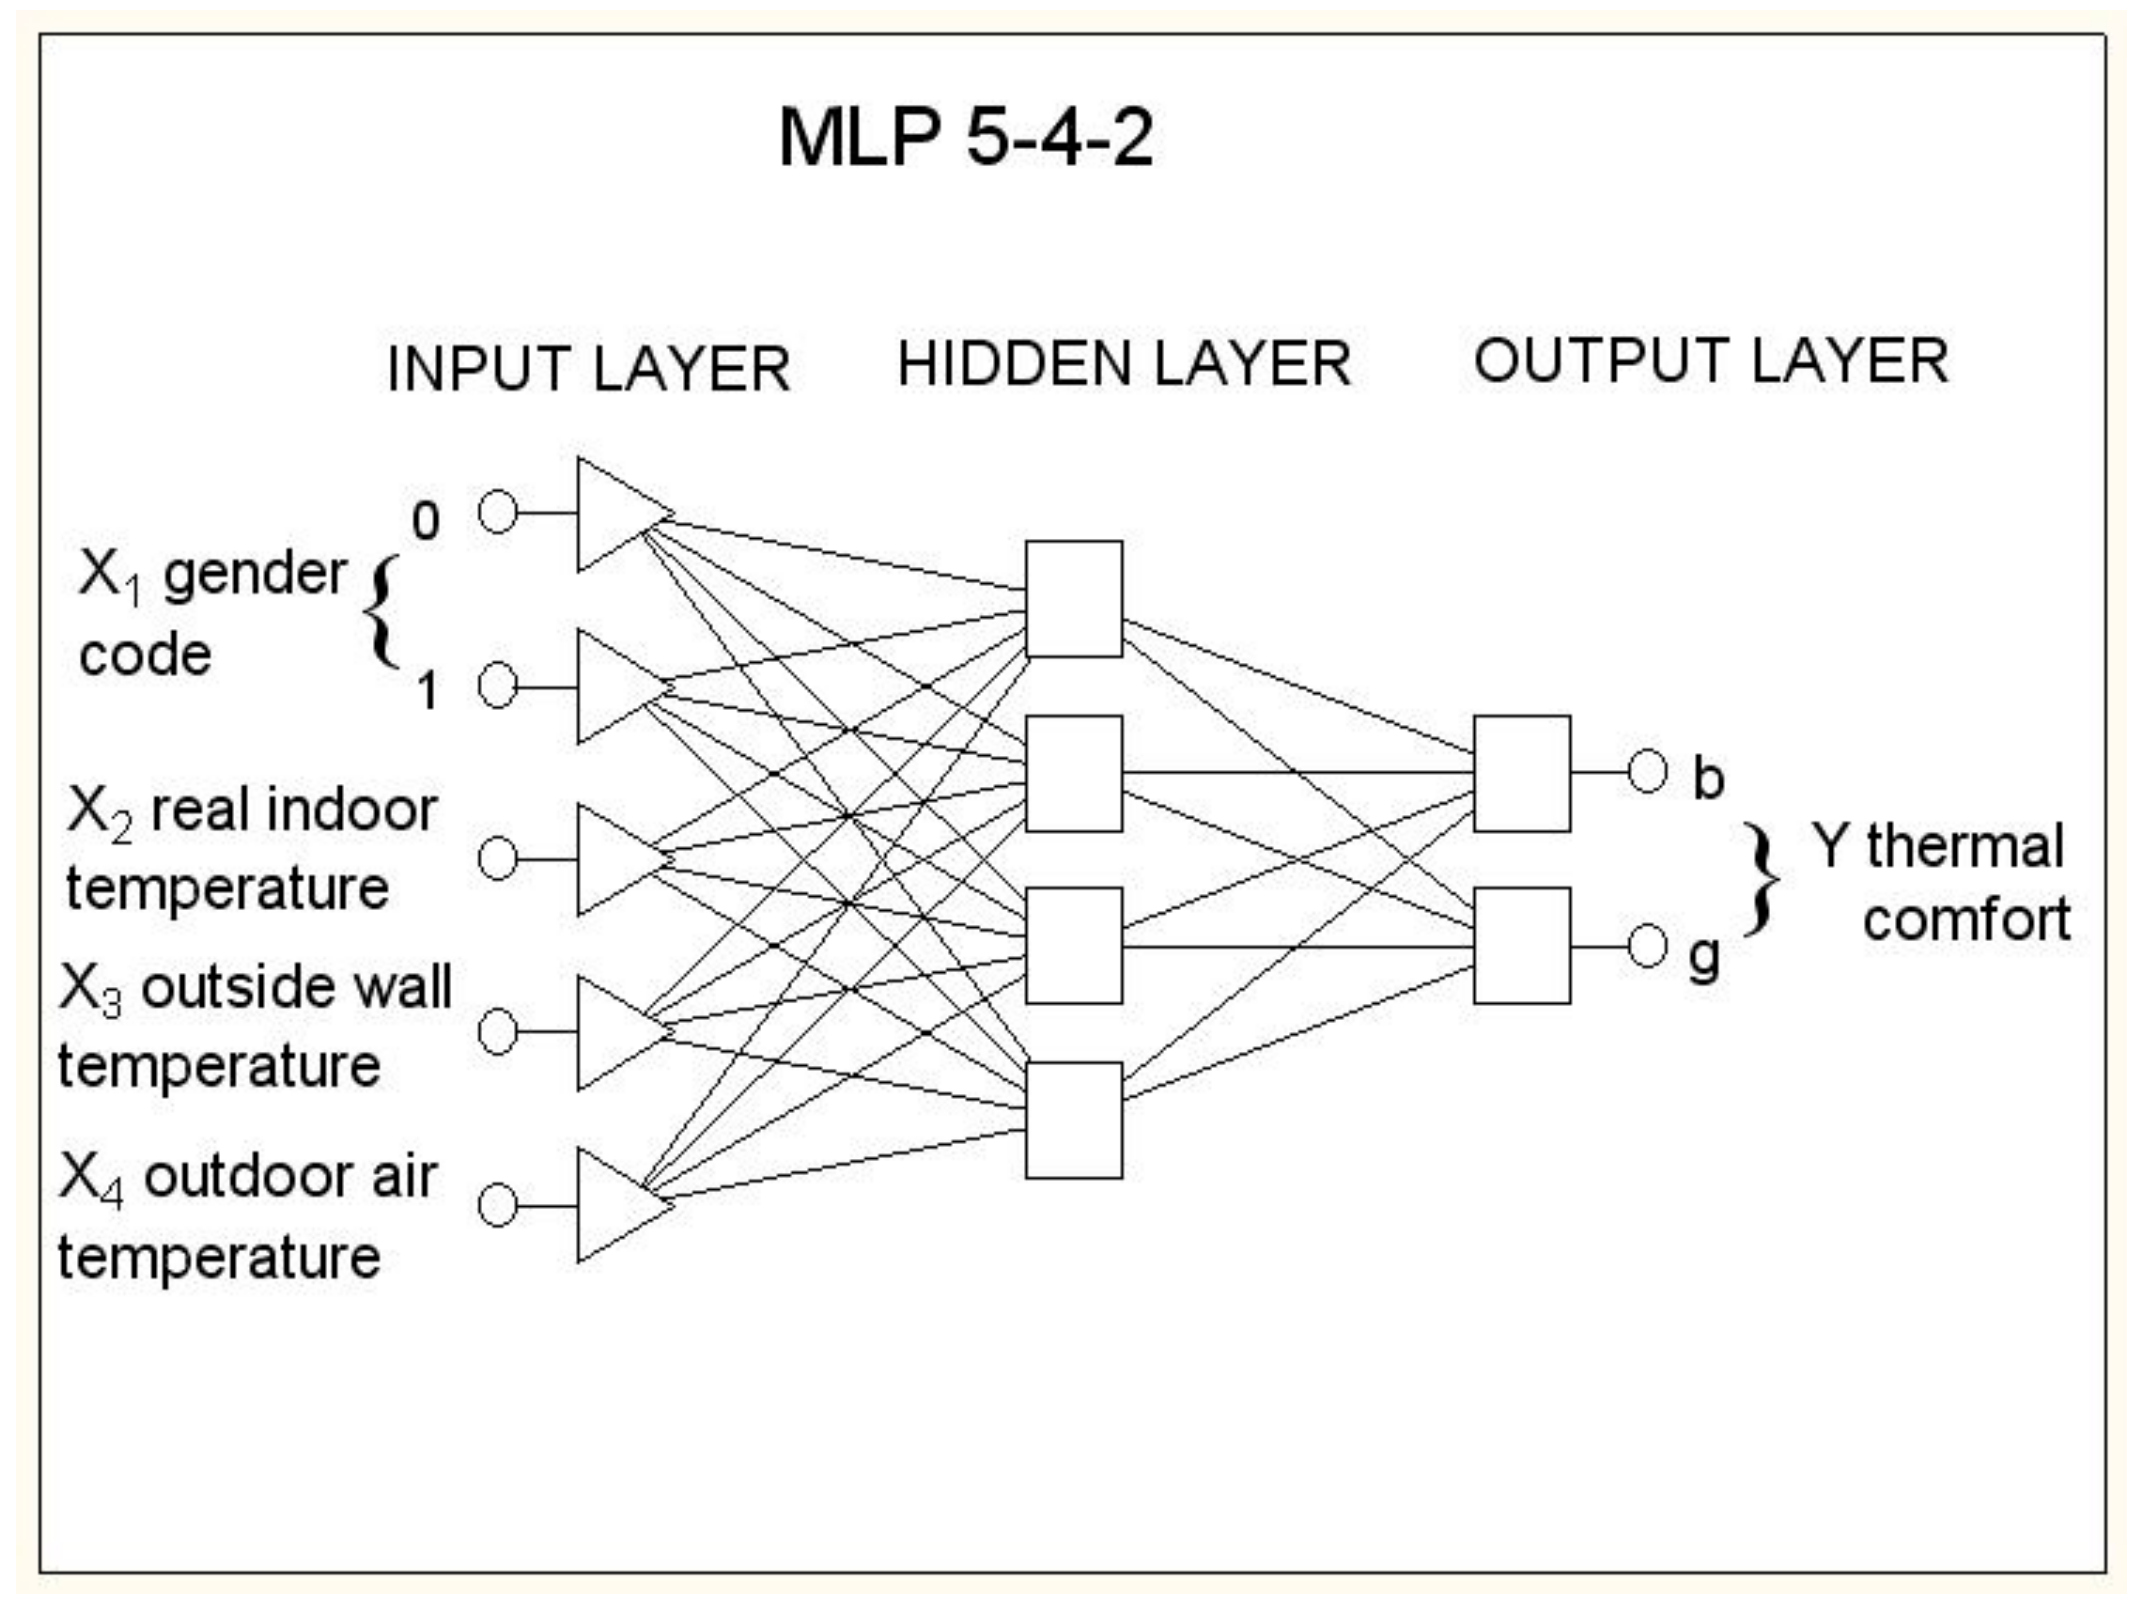
Input variables were: X1 – X4. Since the X1 variable was of a qualitative-binary type (women or men), two neurons were predicted for this variable, one of which introduced a gender code equal to 0 and the other introducing a gender code equal to 1. Therefore, the total number of input neurons equaled N = 5. The output variable was also of a qualitative - binary type (good or bad), therefore the number of neurons in the output layer was M = 2. Consequently, the structure of the neural network was 5-H-2. Upon the basis of a great number of neural network analyses, the number of H = 2 neurons in the hidden layer was designed for networks with the best predictive quality. The scheme of the adopted artificial neural network architecture is presented in Figure 7.
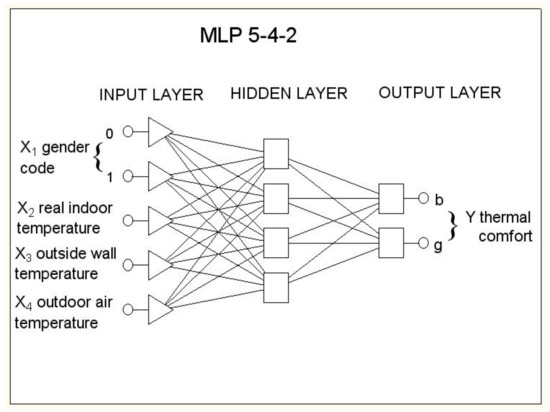
Figure 7.
The scheme of the adopted artificial neural network.
The entire dataset was randomly divided into the proportion of about 70%, 15%, 15% of cases for subsets: (L) learning nL = 235, test (T) nT = 49 and validity (V) nV = 49. Number of unknown network parameters (neuron weights) was 5·4 + 4·2 + 4 + 2 = 34 and it was almost 7 times smaller than the number of cases in the training set, which indicates that the size of the training set was large and sufficient. Division of cases into subsets for all the analyzed networks was constant. The following neural network parameters were determined on the basis of a great number of simulations with variable network parameters: the number of neurons in the hidden layer was assumed to be 4, the function of hidden neurons activation: hyperbolic tangent tanh = (ea – e–a)/(ea + e–a), where a is a properly weighted sum of signals “entering” the neuron, function of activation of output neurons: softmax = exp(a)/Σexp(a), learning algorithm: metric variable method using the Broyden-Fletcher-Goldfarb-Shanno recursive formula (BFGS), number of epochs 1.
The error function was cross entropy:
where n is the number of cases of set, ti is the known values of the test, and yi corresponds to the values predicted from neural network.
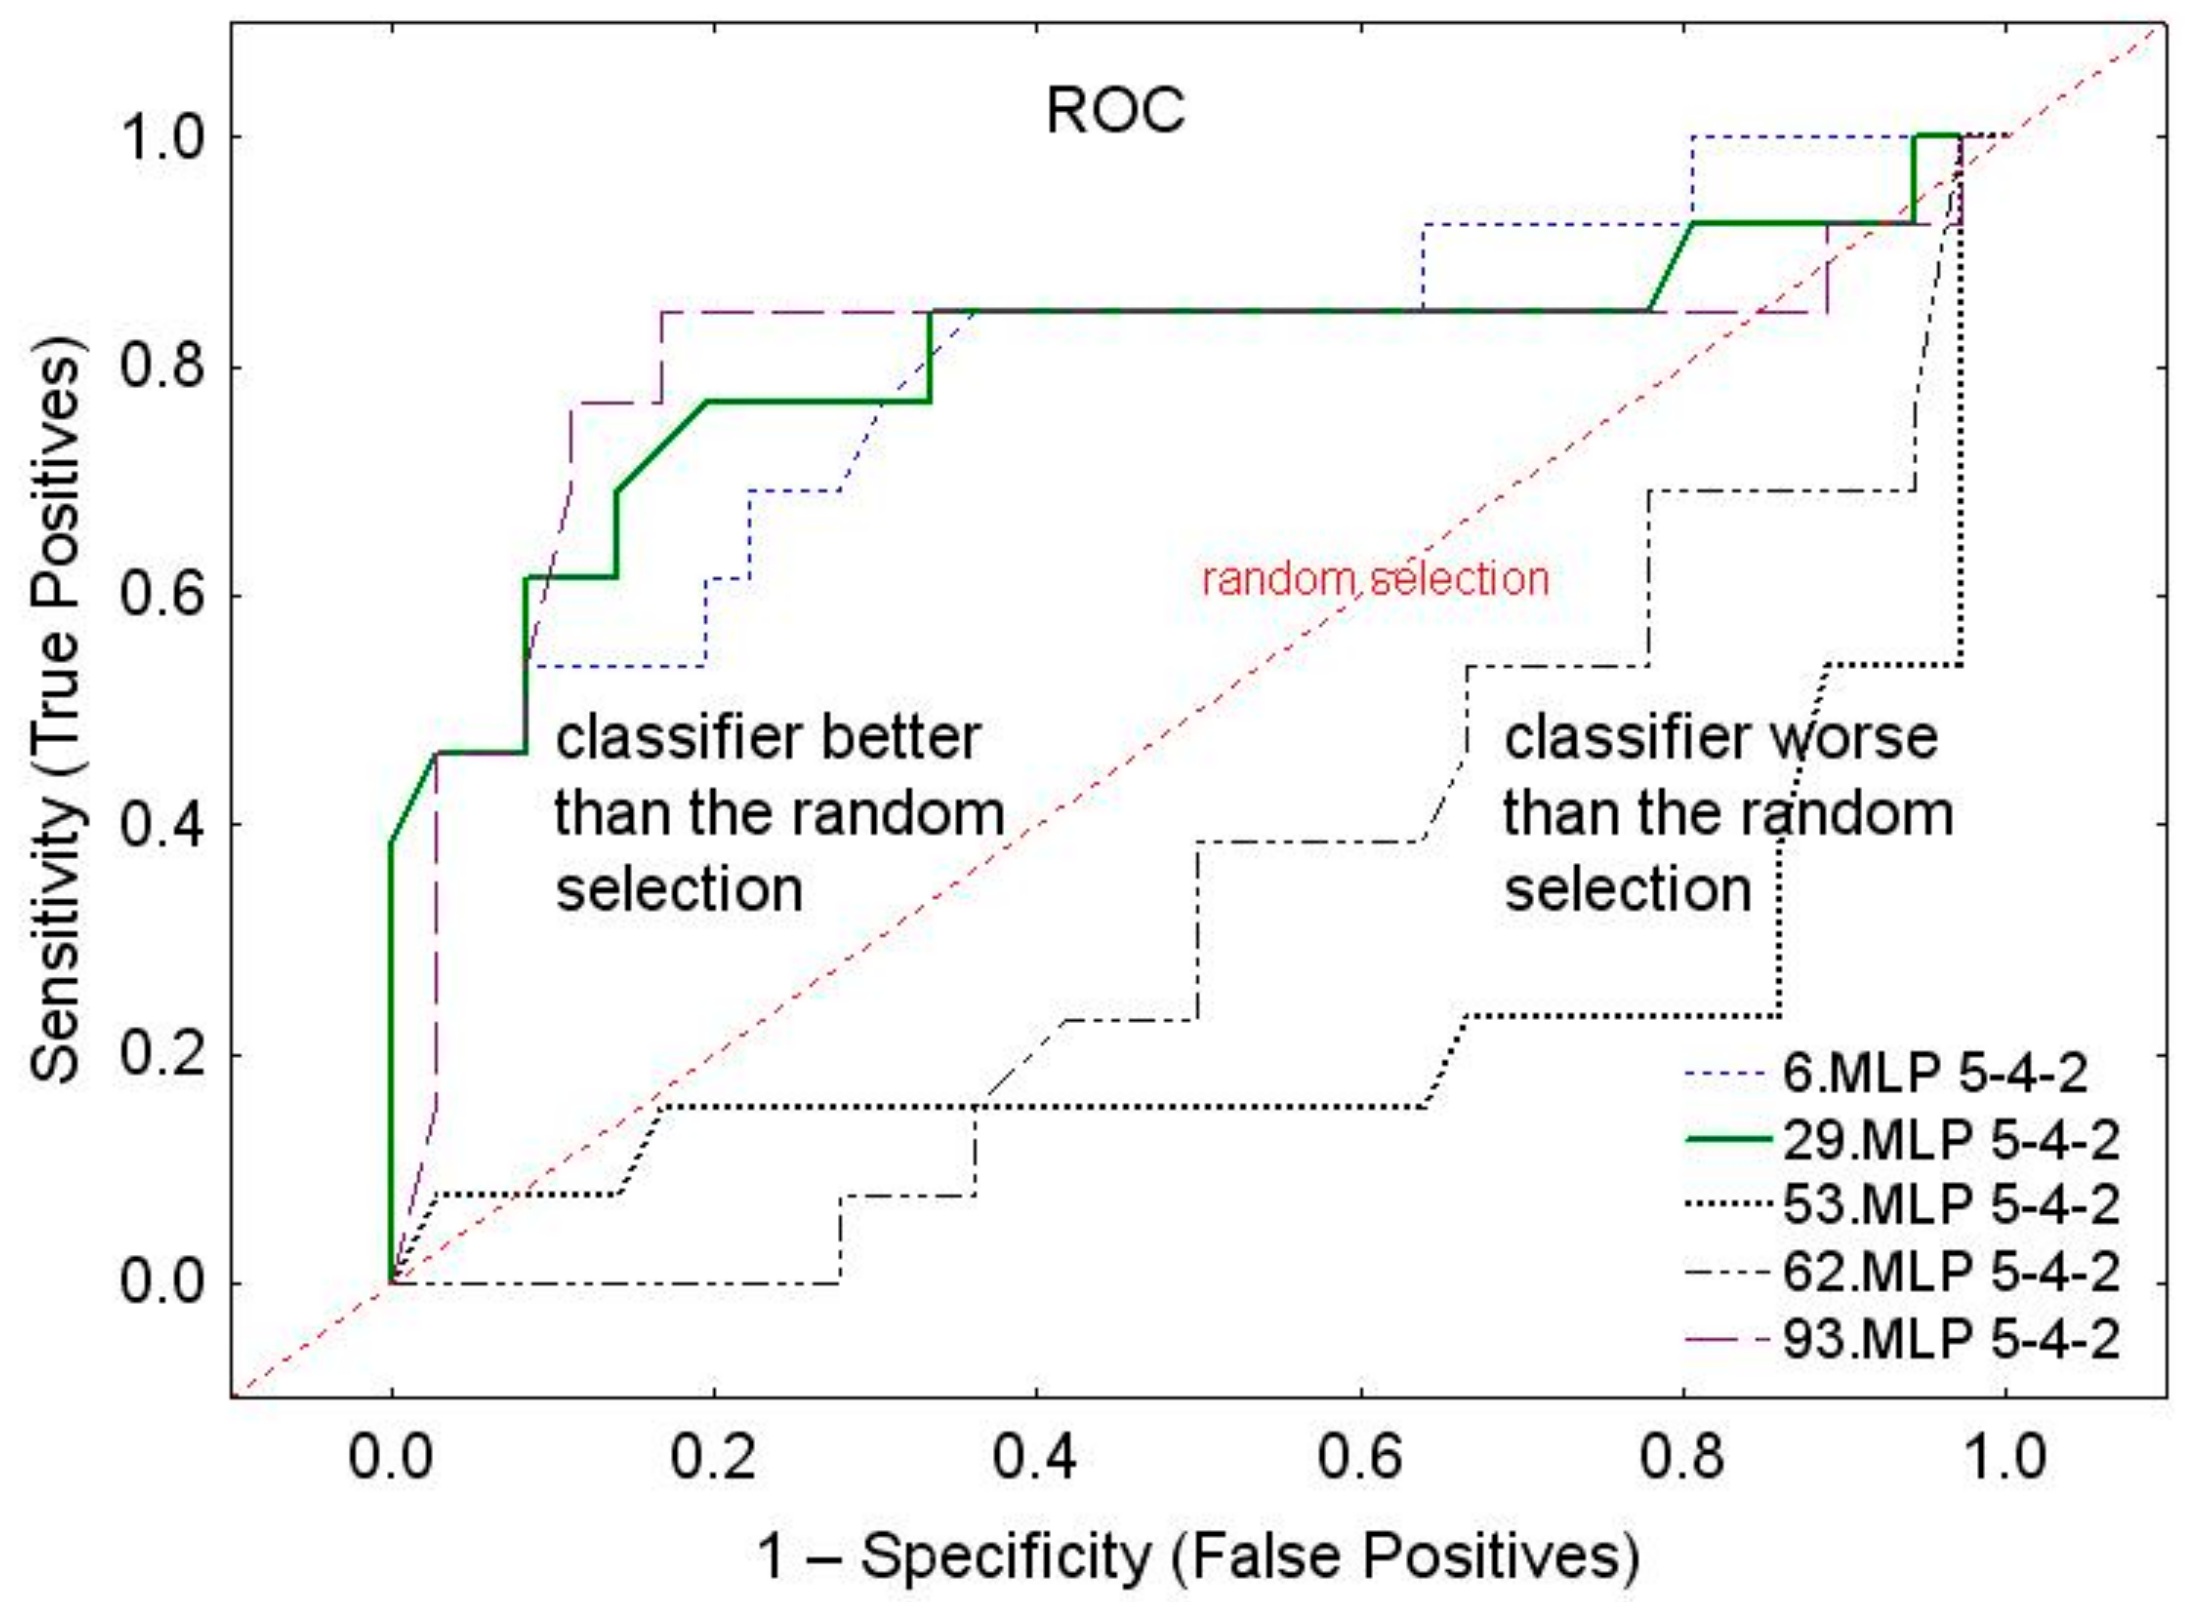
Next, a set of 100 neural networks was created, of which the best neural networks were selected based on ROC (receiver operating characteristic) curve analysis in the validation (V) subset. The classification threshold (and also the acceptance and rejection threshold) was adopted in such a way that the number of incorrect classifications in both classes was as similar as possible. The results for the best selected neural networks are presented in Table 3. Figure 8 shows ROC curves for selected neural networks.

Table 3.
Area under ROC curve (AUC) area and receiver operating characteristic (ROC) classification threshold for the best and the worst ANNs.
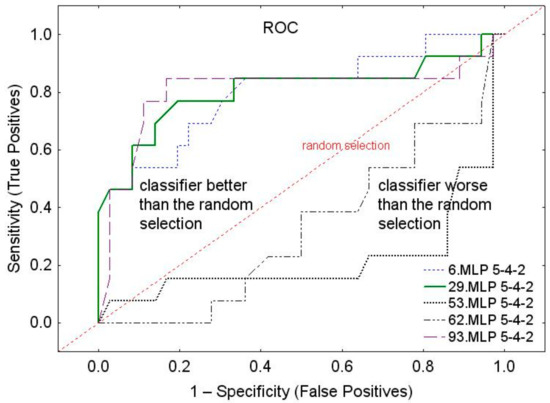
Figure 8.
ROC curves.
The best of neural networks (Nos. 29 and 93) show AUC = 0.803, whereas the worst neural network (No 53) shows AUC = 0.221.
It seems that the best neural networks, Nos. 29 and 93 have a fairly good classification quality. The final assessment of the correctness of the classification was made on the basis of confusion matrix (Table 4).

Table 4.
Confusion matrix for both groups.
As it can be seen in Table 4 all “good” thermal comfort ratings were correctly identified and all “bad” ratings were incorrectly recognized as “good” by all neural networks, regardless of the quality of the neural network. Probably one of the causes of incorrect classifications is that the output variable have very unevenly distributed classes: 84.4% of cases belonged to the “good” class and 15.6% of cases belonged to the “bad” class, and moreover, the classes overlay (on a dark background).
To check how important the individual input variables of the network were, a global analysis of sensitivity of networks listed in Table 4 was conducted. The results of the sensitivity analysis are presented in Table 5. For each of the selected models, the error quotient of the network is presented without the given input variable and the network error with the set of inputs. A quotient less than 1 means that the network works even better without a given variable, which is an obvious tip to remove a given independent variable from the analysis.

Table 5.
Network sensitivity analysis for learning, testing and validation.
Table 5 indicates that no variable is the most important, regardless of the predictive quality of neural network, because for each variable the error ratios are about 1.0. From the sensitivity analysis it can be concluded that the perception of thermal comfort in young people does not depend on the measured variables in the analyzed temperature ranges.
The discriminatory and neural analyses lead to the conclusion that thermal comfort perceived by young, healthy adults is not dependent on gender or the temperature conditions prevailing in the room in the studied temperature range and in the climatic temperate zone.
The test results presented in this article are similar to the results of tests carried out by other authors in other climatic conditions [13,14,15,16,17]. The feeling of thermal comfort of people may therefore depend on other factors (external or individual) that were not included in this study.
4. Conclusions
The study group of 333 persons was representative for adult, young, and healthy people, staying in a room under specific temperature conditions, in a geographical area with a moderate climate.
After the discriminant and neural analyses it was found that it is not possible to forecast the thermal comfort assessment in the room based on the analyzed variables: gender, indoor air temperature, external wall mean radiant temperature, and outdoor air temperature.
The results of this study confirm that under the same thermal conditions about 85% of respondents assess thermal comfort as good, and about 15% of respondents assess thermal comfort as bad. The test results presented in this article are similar to the results of tests carried out by other authors in other climatic conditions.
The ranges of good comfort for men and women coincide in a very wide temperature of air in room of range from approx. 20.7 to 25.7 °C. In the group of persons who described comfort as bad, men more often stated that comfort is bad at higher indoor air temperatures, and women at lower temperatures. This observation concerns only less than 2% of respondents.
Based on the analysis of the test results, it can be concluded that, in particular, the feeling of thermal comfort under the specific temperature conditions used in the test does not depend on sex.
The thermal comfort assessments of men and women were similar and overlapped.
Because of the fact that the tests were uneven, it is planned to repeat the research in two variants: (1) for equal groups of respondents and (2) in the summer season, when in moderate climate everyone experiences too high temperatures.
The study provides a baseline for further research in developing thermal comfort standards for teaching room, in a geographical area with a moderate climate (in Poland).
Author Contributions
Conceptualization, K.G.-F. and M.J.S.; formal analysis, M.J.S.; investigation, K.G.-F. and M.J.S.; resources, K.G.-F. and M.J.S.; writing—original draft preparation, K.G.-F. and M.J.S.; project administration, K.G.-F.; funding acquisition, K.G.-F. and M.J.S. All authors have read and agreed to the published version of the manuscript.
Funding
The Ministry of Science and Higher Education of Poland, from the resources of the WZ/WBiIŚ/4/2019 work and S/WBiIŚ/2/2018.
Acknowledgments
The research was carried out at the Bialystok University of Technology and financed from a subsidy provided by the Ministry of Science and Higher Education of Poland, from the resources of the WZ/WBiIŚ/4/2019 work and S/WBiIŚ/2/2018 and Project co-financed by the European Regional Development Fund under the Regional Operational Program of the Podlaskie Province for the years 2007-2013 – 1.1.
Conflicts of Interest
The authors declare no conflict of interest.
References
- Lia, Y.; Yuan, Y.; Li, C.; Han, X.; Zhang, X. Human responses to high air temperature, relative humidity and carbon dioxide concentration in underground refuge chamber. Build. Environ. 2018, 131, 53–62. [Google Scholar] [CrossRef]
- Ugranli, T.; Toprak, M.; Gursoy, G.; Cimrin, A.H.; Sofuoglu, S.C. Indoor environmental quality in chemistry and chemical engineering laboratories at Izmir Institute of Technology. Atmos. Pollut. Res. 2015, 6, 147–153. [Google Scholar] [CrossRef]
- Koelblen, B.; Psikuta, A.; Bogdan, A.; Annaheim, S.; Rossi, R.M. Thermal sensation models: Validation and sensitivity towards thermo-physiological parameters. Build. Environ. 2018, 130, 200–211. [Google Scholar] [CrossRef]
- Brągoszewska, E.; Mainka, A.; Pastuszka, J.S.; Lizończyk, K.; Desta, Y.G. Assessment of bacterial aerosol in a preschool, primary school and high school in Poland. Atmosphere 2018, 9, 87. [Google Scholar] [CrossRef]
- Canha, N.; Lage, J.; Candeias, S.; Alves, C.; Almeida, S.M. Indoor air quality during sleep under different ventilation patterns. Atmos. Pollut. Res. 2017, 8, 1132–1142. [Google Scholar] [CrossRef]
- ASHRAE Standard 55. Thermal Environment Conditions for Human Occupancy; American Society of Heating, Refrigerating and Air-Conditioning Engineers: Atlanta, GA, USA, 2004. [Google Scholar]
- De Dear, R.J.; Brager, G.S. Thermal comfort in naturally ventilated buildings: Revisions to ASHRAE Standard 55. Energy Build. 2002, 34, 549–561. [Google Scholar] [CrossRef]
- Doherty, T.J.; Arens, E. Evaluation of the physiological bases of thermal comfort models. ASHRAE Trans. 1988, 94, 15. [Google Scholar]
- Fanger, P.O. Calculation of thermal comfort: Introduction of a basic comfort equation. ASHRAE Trans. 1967, 73, 1–20. [Google Scholar]
- Fanger, P.O. Thermal Comfort, Analysis and Application in Environmental Engineering; Technical Press: Copenhagen, Denmark, 1970. [Google Scholar]
- Fanger, P.O. Thermal comfort. In Analysis and Applications in Environmental Engineering; McGraw-Hill: New York, NY, USA, 1972. [Google Scholar]
- Wang, Z. A field study of the thermal comfort in residential buildings in Harbin. Build. Environ. 2006, 43, 1034–1039. [Google Scholar] [CrossRef]
- Kingma, B.; van Marken, W. Energy consumption in buildings and female thermal demand. Clim. Chang. 2015, 5, 1054–1056. [Google Scholar] [CrossRef]
- Choia, J.-H.; Yeom, D. Development of the data-driven thermal satisfaction prediction model as a function of human physiological responses in a built environment. Build. Environ. 2019, 150, 206–218. [Google Scholar] [CrossRef]
- Hamzah, B.; Gou, Z.; Mulyadi, R.; Amin, S. Thermal Comfort Analyses of Secondary School Students in the Tropics. Buildings 2018, 8, 56. [Google Scholar] [CrossRef]
- Draganova, V.; Tsuzuki, K.; Nabeshima, Y. Field Study on Nationality Differences in Thermal Comfort of University Students in Dormitories during Winter in Japan. Buildings 2019, 9, 213. [Google Scholar] [CrossRef]
- Jindal, A. Investigation and analysis of thermal comfort in naturally ventilated secondary school classrooms in the composite climate of India. Archit. Sci. Rev. 2019, 62, 466–484. [Google Scholar] [CrossRef]
- Campano, M.A.; Pinto, A.; Acosta, I.; Muñoz-González, C. Analysis of the Perceived Thermal Comfort in a Portuguese Secondary School: Methodology and Results. Int. J. Eng. Technol. 2017, 9, 448–455. [Google Scholar] [CrossRef]
- Campano, M.A.; Domínguez-Amarillo, S.; Fernández-Agüera, J.; Sendra, J.J. Thermal Perception in Mild Climate: Adaptive Thermal Models for Schools. Sustainability 2019, 11, 3948. [Google Scholar] [CrossRef]
- Attaianese, E.; d’Ambrosio Alfano, F.R.; Palella, B.I. An Ergonomic Approach of IEQ Assessment: A Case Study. In Proceedings of the 20th Congress of the International Ergonomics Association (IEA 2018) Volume VIII: Ergonomics and Human Factors in Manufacturing, Agriculture, Building and Construction, Sustainable Development and Mining, Florence, Italy, 26–30 August 2019; pp. 504–513. [Google Scholar] [CrossRef]
- D’Ambrosio Alfano, F.R.; Ianniello, E.; Palella, B.I. PMV–PPD and Acceptability in Naturally Ventilated Schools. Build. Environ. 2013, 67, 129–137. [Google Scholar] [CrossRef]
- Sztulc, P. Badanie Temperatury Powietrza w Pomieszczeniu. Master’s Thesis, under direction Gładyszewska-Fiedoruk, K. Bialystok University of Technology, Bialystok, Poland, 2017. (In Polish). [Google Scholar]
- Pogoda. Available online: https://freemeteo.pl/pogoda/?language=polish&country=poland (accessed on 10 June 2019).
- Gładyszewska-Fiedoruk, K. Concentration of carbon dioxide in the cabin of a small passenger car. Transp. Res. Part D Transp. Environ. 2011, 16, 327–331. [Google Scholar] [CrossRef]
- Gładyszewska-Fiedoruk, K. Concentrations of carbon dioxide in a car. Transp. Res. Part D Transp. Environ. 2011, 16, 166–171. [Google Scholar] [CrossRef]
- Sulewska, M.J.; Gładyszewska-Fiedoruk, K.; Sztulc, P. Analysis of the results of empirical research and surveys of perceived indoor temperature depending on gender and seasons. Environ. Sci. Pollut. Res. 2018, 25, 31205–31218. [Google Scholar] [CrossRef]
- ASHRAE. Thermal Environmental Conditions for Human Occupancy; ANSI/ASHRAE Standard 55; ASHRAE: Atlanta, GA, USA, 2013. [Google Scholar]
- Yin, R.K. Case Study Research: Design and Methods, 4th ed.; SAGE Inc.: Thousand Oaks, CA, USA, 2017. [Google Scholar]
- Heathcoate, A.; Berne’s, E. Development of ego state theory: Where did it all begin and who influenced him? Trans. Anal. J. 2010, 40, 254–260. [Google Scholar]
- Stanisz, A. Przystępny Kurs Statystyki z Zastosowaniem STATISTICA PL na Przykładach z Medycyny; StatSoft Polska Sp. z.o.o.: Krakow, Poland, 2006. [Google Scholar]
- STATISTICA—Software Package; Polish Edition; StatSoft Polska Sp. z.o.o.: Krakow, Poland, 2002.
- Fisher, R.A. The use of multiple measurements in taxonomic problems. Ann. Eugen. 1936, 7, 179–188. [Google Scholar] [CrossRef]
- López-Chao, V.; Amado-Lorenzo, J.; Martin-Gutiérrez, J. Architectural Indoor Analysis: A Holistic Approach to Understand the Relation of Higher Education Classrooms and Academic Performance. Sustainability 2019, 11, 6558. [Google Scholar] [CrossRef]
- Haykin, S. Neural Networks. A Comprehensive Foundation; Prentice Hall International Inc.: Madison, WI, USA, 1999. [Google Scholar]
- Bishop, C.M. Neural Networks for Pattern Recognition; Clarendon Press: Oxford, UK, 1995. [Google Scholar]
- Sulewska, M.J.; Zabielska-Adamska, K. Data compression by principal component analysis (PCA) in modelling of soil density parameters based on soil granulation. Geol. Q. 2015, 59, 400–407. [Google Scholar] [CrossRef]
- Asfour, O.S.; Gadi, M.B. A comparison between CFD and Network models for predicting wind-driven ventilation in buildings. Build. Environ. 2007, 42, 4079–4085. [Google Scholar] [CrossRef]
- Sulewska, M.J.; Zabielska-Adamska, K. Dynamic CBR test to assess the soil compaction. J. Test. Eval. 2015, 43, 1028–1035. [Google Scholar]
- Yang, J.; Ni, S.; Weng, W. Modelling heat transfer and physiological responses of unclothed human body in hot environment by coupling CFD simulation with thermal model. Int. J. Therm. Sci. 2017, 120, 437–445. [Google Scholar] [CrossRef]
- Zhang, Z.; Kusiak, A.; Zeng, Y.; Wei, X. Modelling and optimization of a wastewater pumping system with data-mining methods. Appl. Energy 2016, 164, 303–311. [Google Scholar] [CrossRef]
- Villarrubia, G.; De Paz, J.F.; Chamoso, P.; De la Prieta, F. Artificial neural networks used in optimization problems. Neurocomputing 2018, 272, 10–16. [Google Scholar] [CrossRef]
- Qin, R.; Yan, D.; Zhou, X.; Jiang, Y. Research on a dynamic simulation method of atrium thermal environment based on neural network. Build. Environ. 2012, 50, 214–220. [Google Scholar] [CrossRef]
© 2020 by the authors. Licensee MDPI, Basel, Switzerland. This article is an open access article distributed under the terms and conditions of the Creative Commons Attribution (CC BY) license (http://creativecommons.org/licenses/by/4.0/).

