Article

Model Based IAS Analysis for Fault Detection and Diagnosis of IC Engine Powertrains

1
Centre for Efficiency and Performance Engineering, University of Huddersfield, Huddersfield HD1 3DH, UK
2
School of Industrial Automation, Beijing Institute of Technology, Zhuhai 519088, China
3
College of Mechanical and Electrical Engineering, Qingdao Agricultural University, Qingdao 266109, China
*
Authors to whom correspondence should be addressed.
Energies 2020, 13(3), 565; https://doi.org/10.3390/en13030565
Submission received: 31 October 2019 / Revised: 16 January 2020 / Accepted: 21 January 2020 / Published: 24 January 2020

Abstract

:
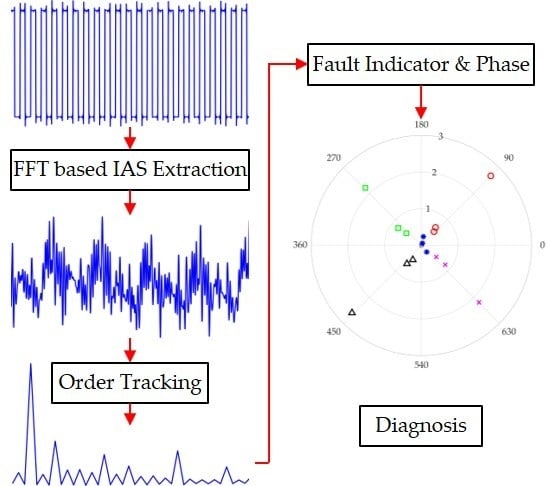
Internal combustion (IC) engine based powertrains are one of the most commonly used transmission systems in various industries such as train, ship and power generation industries. The powertrains, acting as the cores of machinery, dominate the performance of the systems; however, the powertrain systems are inevitably degraded in service. Consequently, it is essential to monitor the health of the powertrains, which can secure the high efficiency and pronounced reliability of the machines. Conventional vibration based monitoring approaches often require a considerable number of transducers due to large layout of the systems, which results in a cost-intensive, difficultly-deployed and not-robust monitoring scheme. This study aims to develop an efficient and cost-effective approach for monitoring large engine powertrains. Our model based investigation showed that a single measurement at the position of coupling is optimal for monitoring deployment. By using the instantaneous angular speed (IAS) obtained at the coupling, a novel fault indicator and polar representation showed the effective and efficient fault diagnosis for the misfire faults in different cylinders under wide working conditions of engines; we also verified that by experimental studies. Based on the simulation and experimental investigation, it can be seen that single IAS channel is effective and efficient at monitoring the misfire faults in large powertrain systems.

Graphical Abstract

1. Introduction

Reciprocating engines are one of the frequently used power sources in vehicles, ships, power generation and so on. Reliable operation throughout the course of their service is significantly important to ensuring high efficiency and high reliability. However, the occurrence of faults is inevitable during the machine service. The misfire is a common fault in IC engines, which can result from spark failure, broken gaskets, poor fuel/air mixing, lack of compression or improper valve timing. These misfires lead to poor efficiency and the short machine life. Therefore, the detection and diagnosis of misfire faults is desired to guarantee the great performance of IC engines.
Misfire fault detection and diagnosis are always challenging tasks in reciprocating engines, especially the large engines [1,2]. The most commonly used techniques are body vibration [2] and instantaneous angular speed (IAS). However, due to the large scale and multiple cylinders, the body vibration requires a considerable number of accelerometers and data acquisition channels [1], making it cost-intense, and it requires advanced signal processing methods. The IAS measurements can monitor the dynamic responses of the rotors by using several channels [3,4,5]. This paper mainly focuses on the IAS based fault detection and diagnosis. IAS is actually the torsional vibration of the rotors, which is the speed oscillation of the angular motions. In most cases, the speed is related to the average speed of the machine, but the instantaneous angular speed is informative for the rotary systems. The acquisition of IAS signals is often based on the time deviation of the uniform slots passing a fixed position. The successive impulses are usually obtained by an encoder sensor (either optical switch or magnetic pickup) and a wheel with uniformly distributed slots or teeth. The main advantages of the IAS measurement technique are [6]:
  • High signal to noise ratio (SNR);
  • Being directly related to machine dynamics;
  • Inexpensive transducers;
  • Easy installation.
Remond introduced that encoder signals are a cheap, easy, precise and reliable way to obtain torsional vibration in rotating machines [7]. It is a milestone that the optimal configurations for IAS measurements are discussed and recommended in the reference [8], and the noise effects can be eliminated by proper control. Jung compensated the flywheel errors, and hence made the flywheel IAS based misfire detection more robust [9]. Diamond, Heyns and Oberholster used Bayesian regression to compensate the geometry errors in IAS measurements for a wide range of speeds [10]. The IAS signals can be easily and accurately obtained from the successive pulse signals via the frequency demodulation analysis.
Gubran extracted the IAS during the machine start-up stage to disclose the blade vibration, and then achieved the detection of blade crack faults [11]. The IAS signals can be used to reconstruct the load curve, and then can be used for the misfire detection and diagnosis [3]. Gu et al. used the radial basis function to predict the in-cylinder pressure by the IAS signals, when led to the effective and efficient detection of incipient faults in engines [12]. Chen et al. sent the features extracted from the IAS and body vibration to an artificial neural network (ANN) for the intelligent diagnosis of misfire faults [13]. Feldman and Seibold developed the IAS based damage diagnosis and assessment in a rotor system [14]. Charles et al. employed IAS signal to diagnosis the combustion faults based on the IAS waveforms in a polar representation [15]. The IAS based fault detection and diagnosis is promising and effective; however, the optimal placement and essential channel numbers are not discussed and investigated in this research filed. Consequently, this paper aims to find the solution of optimum IAS placement in the powertrain drive lines.
Compared to experimental studies, model based investigation is efficient and flexible. Daniel et al. developed an accurate model of the flywheel angular speed under the conditions of misfire and flywheel manufacture errors [16]. A nonlinear dynamic torsional model of a single cylinder engine was develop by Boysal and Rahnejat [17] for investigating the whirl phenomenon of main bearings. Chen et al. developed an accurate torsional model to train the ANN and achieved a satisfied result [13]. Mendes et al. modelled the crankshaft as a flexible rotor, for which the outputs are similar to the experimental signals [18]. Liu et al. developed an nonlinear model of the engine powertrain to compare the performances of IAS and torque measurements when detecting and diagnosing the misfire faults [19]. These research activities show that the model based investigation can be accurate and reliable, and therefore, this paper focuses on using simulation studies to develop the fault detection and diagnosis approach and the optimal measurement position for IAS.
The aforementioned research publications achieve accurate detection and diagnosis of engine combustion faults by using instantaneous angular speed techniques. However, the diagnosis methods are computational, or the understanding of the results require skilled engineers. A concise and interpretable representation of the IAS results is highly desired for the practical condition monitoring of engines. Based on the review of the relevant research studies, the torsional vibration based condition monitoring of engines is focused on the development of advanced signal processing methods. The sensor placement and essential channels are not investigated in this field. The performances of the IAS at different positions on the drive lines are not equivalent and the placement of the IAS sensors has a significant influence on the effectiveness and robustness of the diagnosis results. This paper aims to find the most cost-effective and efficient approach for detecting and diagnosing engine misfire faults via a model based investigation.
The contents are organised as follows: Section 2 introduces the experimental facilities and the test cases. In Section 3, the development of the torsional model is proposed by the improvement of torque calculation and Fourier series based curve fitting. The main contents in Section 4 are the development of the diagnosis approach, and the novel visualisation of the diagnosis results. The performance of the proposed fault indicator is presented in Section 5 and the conclusions are drawn in the last part.

2. Torsional Vibration Measurements and Processing

2.1. Test Facilities of the Engine Powertrain

The powertrain system studied in the paper is a four cylinder and inline diesel engine based test rig. This test powertrain is composed of a diesel engine, a flexible coupling and a dynamometer, as shown in Figure 1a.
The key specifications of the diesel engine are shown in Table 1. The speed and power outputs are adjusted through a Cadet V12 control and data logging system.
In order to obtain the torsional vibration of the engine powertrain, a data acquisition (DAQ) system, depicted in the Figure 1b, was set up to acquire the IAS signals and in-cylinder pressure. The cylinder pressure transducer was installed by drilling a hole into the chamber of the cylinder 1. The IAS transducers were implemented at three accessible positions—at the free end, flywheel and dynamometer respectively. The transducer at the free end is the optical switch, which utilises an encoder wheel with 180 holes. The IAS measurements at the flywheel are obtained by a magnetic pickup with the exploitation of the flywheel with 122 teeth. The teeth on the flywheel are commonly used to measure the torsional vibration of the engine powertrains. The key specifications of the DAQ facilities are listed in the Table 2.
In the experiment, the test engine was operated at different loads and speeds. The engine was running at three speeds (1000, 1300 and 1600 rpm) and four loads (0, 105, 201 and 315 Nm). At each operating point, cylinder pressure signals, along with other signals, were acquired simultaneously for three rounds of 20 s at a sampling rate 750 kHz when the engine operated steadily. These dynamic responses were used to develop and verify the torsional model, and finally find the most efficient and cost-effective method for misfire detection and diagnosis. In addition, the tests at two speeds (1200 and 1800 rpm) and two loads (0 and 105 Nm) were carried out to obtain the encoder signals for verifying the approaches developed in this paper. The verification tests included three cases: healthy, Cylinder 1 misfire and Cylinder 4 misfire. The test cases are shown in Table 3.

2.2. IAS Extraction

Torsional vibration is inevitable for the diesel engines due to the reciprocating movement of the piston-crack systems. The working mechanisms of four strokes make the torsional vibration more pronouncedly, because only the power strokes generate outputs for the rotary powertrains, and the other three strokes consume energy to overcome the mechanical loss. The main variation of the IAS, representing the torsional vibration, is based on the change of the in-cylinder pressure, and consequently, the IAS fluctuates at a working cycle. The IAS has a peak at the combustion stroke of each cylinder, and hence, the fundamental frequency of IAS is identical to the firing frequency of the engine. The fluctuation of the speed gives one a chance to detect and diagnose the combustion faults of the engines. Any faults, resulting in the abnormal cylinder pressure, can cause the subsequent variation of the IAS.
The IAS measurements were achieved by relying on successive pulses from encoders—a critical step for torsional vibration based condition monitoring. The pulses are obtained from the well-distributed slots or teeth on an encoder wheel no matter whether it is a commercial encoder or a magnetic/optical switch. Optimal configurations for IAS data collection are thoroughly investigated in the reference [8] and the authors proposed several rules for accurate IAS measurement. As the IAS is a frequency modulated signal [8], the approaches to estimate IAS signals from the consecutive pulses can be divided into time-interval and fast Fourier transform (FFT) based techniques. An instinctive method—time interval—is the time interval, which calculates the crank angle between slots over the time difference for passing the contiguous slots. Another FFT based frequency demodulation method is recommended instead, as it is more efficient and more accurate [8]. This study selected the FFT based IAS estimation method to investigate the optimal approach to diagnosing the misfire faults.
The instantaneous angular speed signals can be simplified as a frequency modulation (FM) signal, which can be expressed as
s ( t ) = A cos [ ω c t + ϕ ( t ) ] ,
where ω c is the carrier frequency (the slot passing frequency) and ϕ ( t ) is the phase deviation due to the speed fluctuation.
The extraction of IAS from the FM signal in the Equation (1) is to first construct an analytic signal by the Hilbert transform, which is expressed as
w ( t ) = s ( t ) + i H [ s ( t ) ] = A s ( t ) e i ϕ s ( t ) ,
where H means the Hilbert transform; A s is the instantaneous amplitude; and ϕ s is the instantaneous phase. Consequently, the IAS can be obtained by
ω ( t ) = d ϕ s ( t ) d t = I m [ w ˙ ( t ) w ( t ) ] .
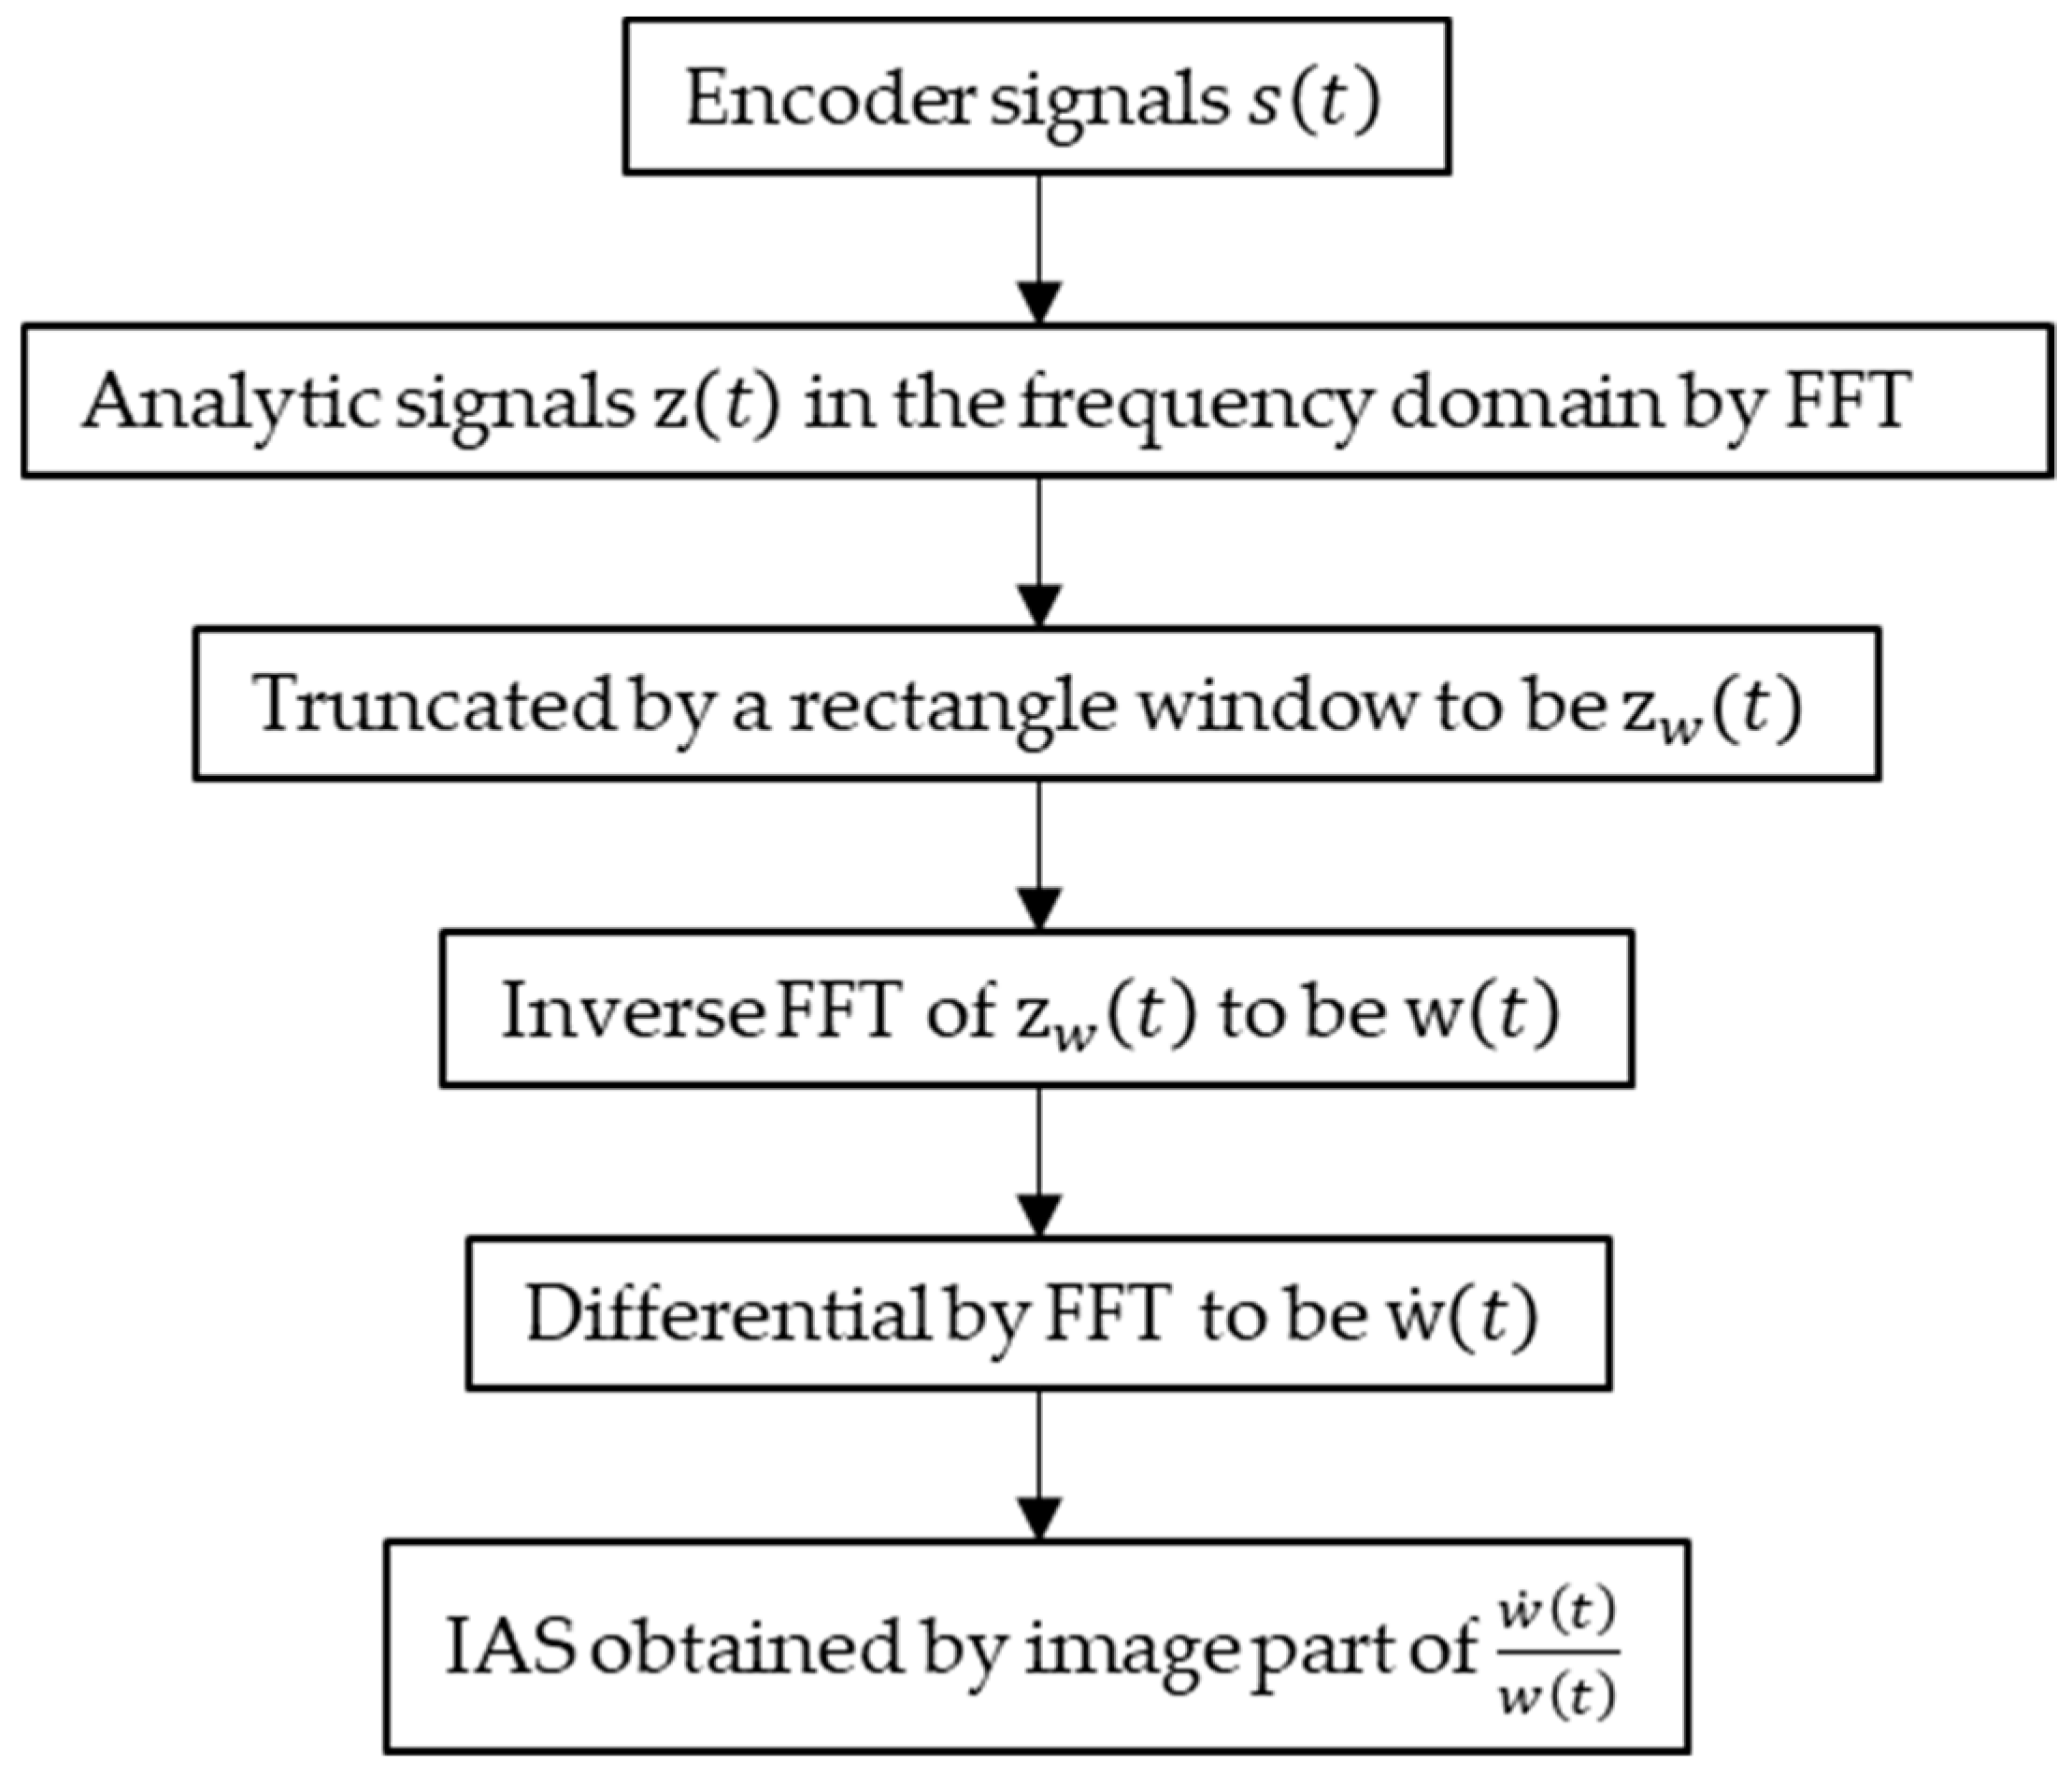
The whole process can be achieved in the frequency domain, and the frequency domain method has the merits of high computational efficiency, easy filter implementation and noise suppression. The steps of the frequency domain method are described in Figure 2.
Step 1: The analytic representation of original signal is obtained by setting the negative frequency components from FFT to zero in the frequency domain.
Step 2: The analytic sequence is truncated by multiplying a rectangle window around the carrier frequency, which is the implementation of the band pass filter in the frequency domain. The frequency bandwidth is determined by the frequency of interest.
Step 3: The filtered analytic sequence is transformed into the time domain by the inverse FFT, which is the analytic representation w ( t ) .
Step 4: The differential of w ( t ) is achieved by the multiplication of a frequency sequence and the filtered analytic sequence. Then, the inverse FFT is applied to obtain the w ˙ ( t ) .
Step 5: The instantaneous angular speed is extracted by the image part of the complex division between w ˙ ( t ) and w ( t ) .
The frequency domain approach of IAS estimation is almost completed by the fast Fourier transform, which makes the algorithm highly efficient.

3. Torsional Model Development of the Powertrain

This research aims to find a cost-effective approach to detecting and diagnosing the misfire faults of the engines. Compared with the physical experiments, the model based study is more cost-effective, more efficient, safer and more environment-friendly. This paper employs a torsional model of the engine powertrain to investigate, evaluate and develop an optimal scheme for the engine misfire detection and diagnosis with high efficiency and low cost.

3.1. Torsional Model

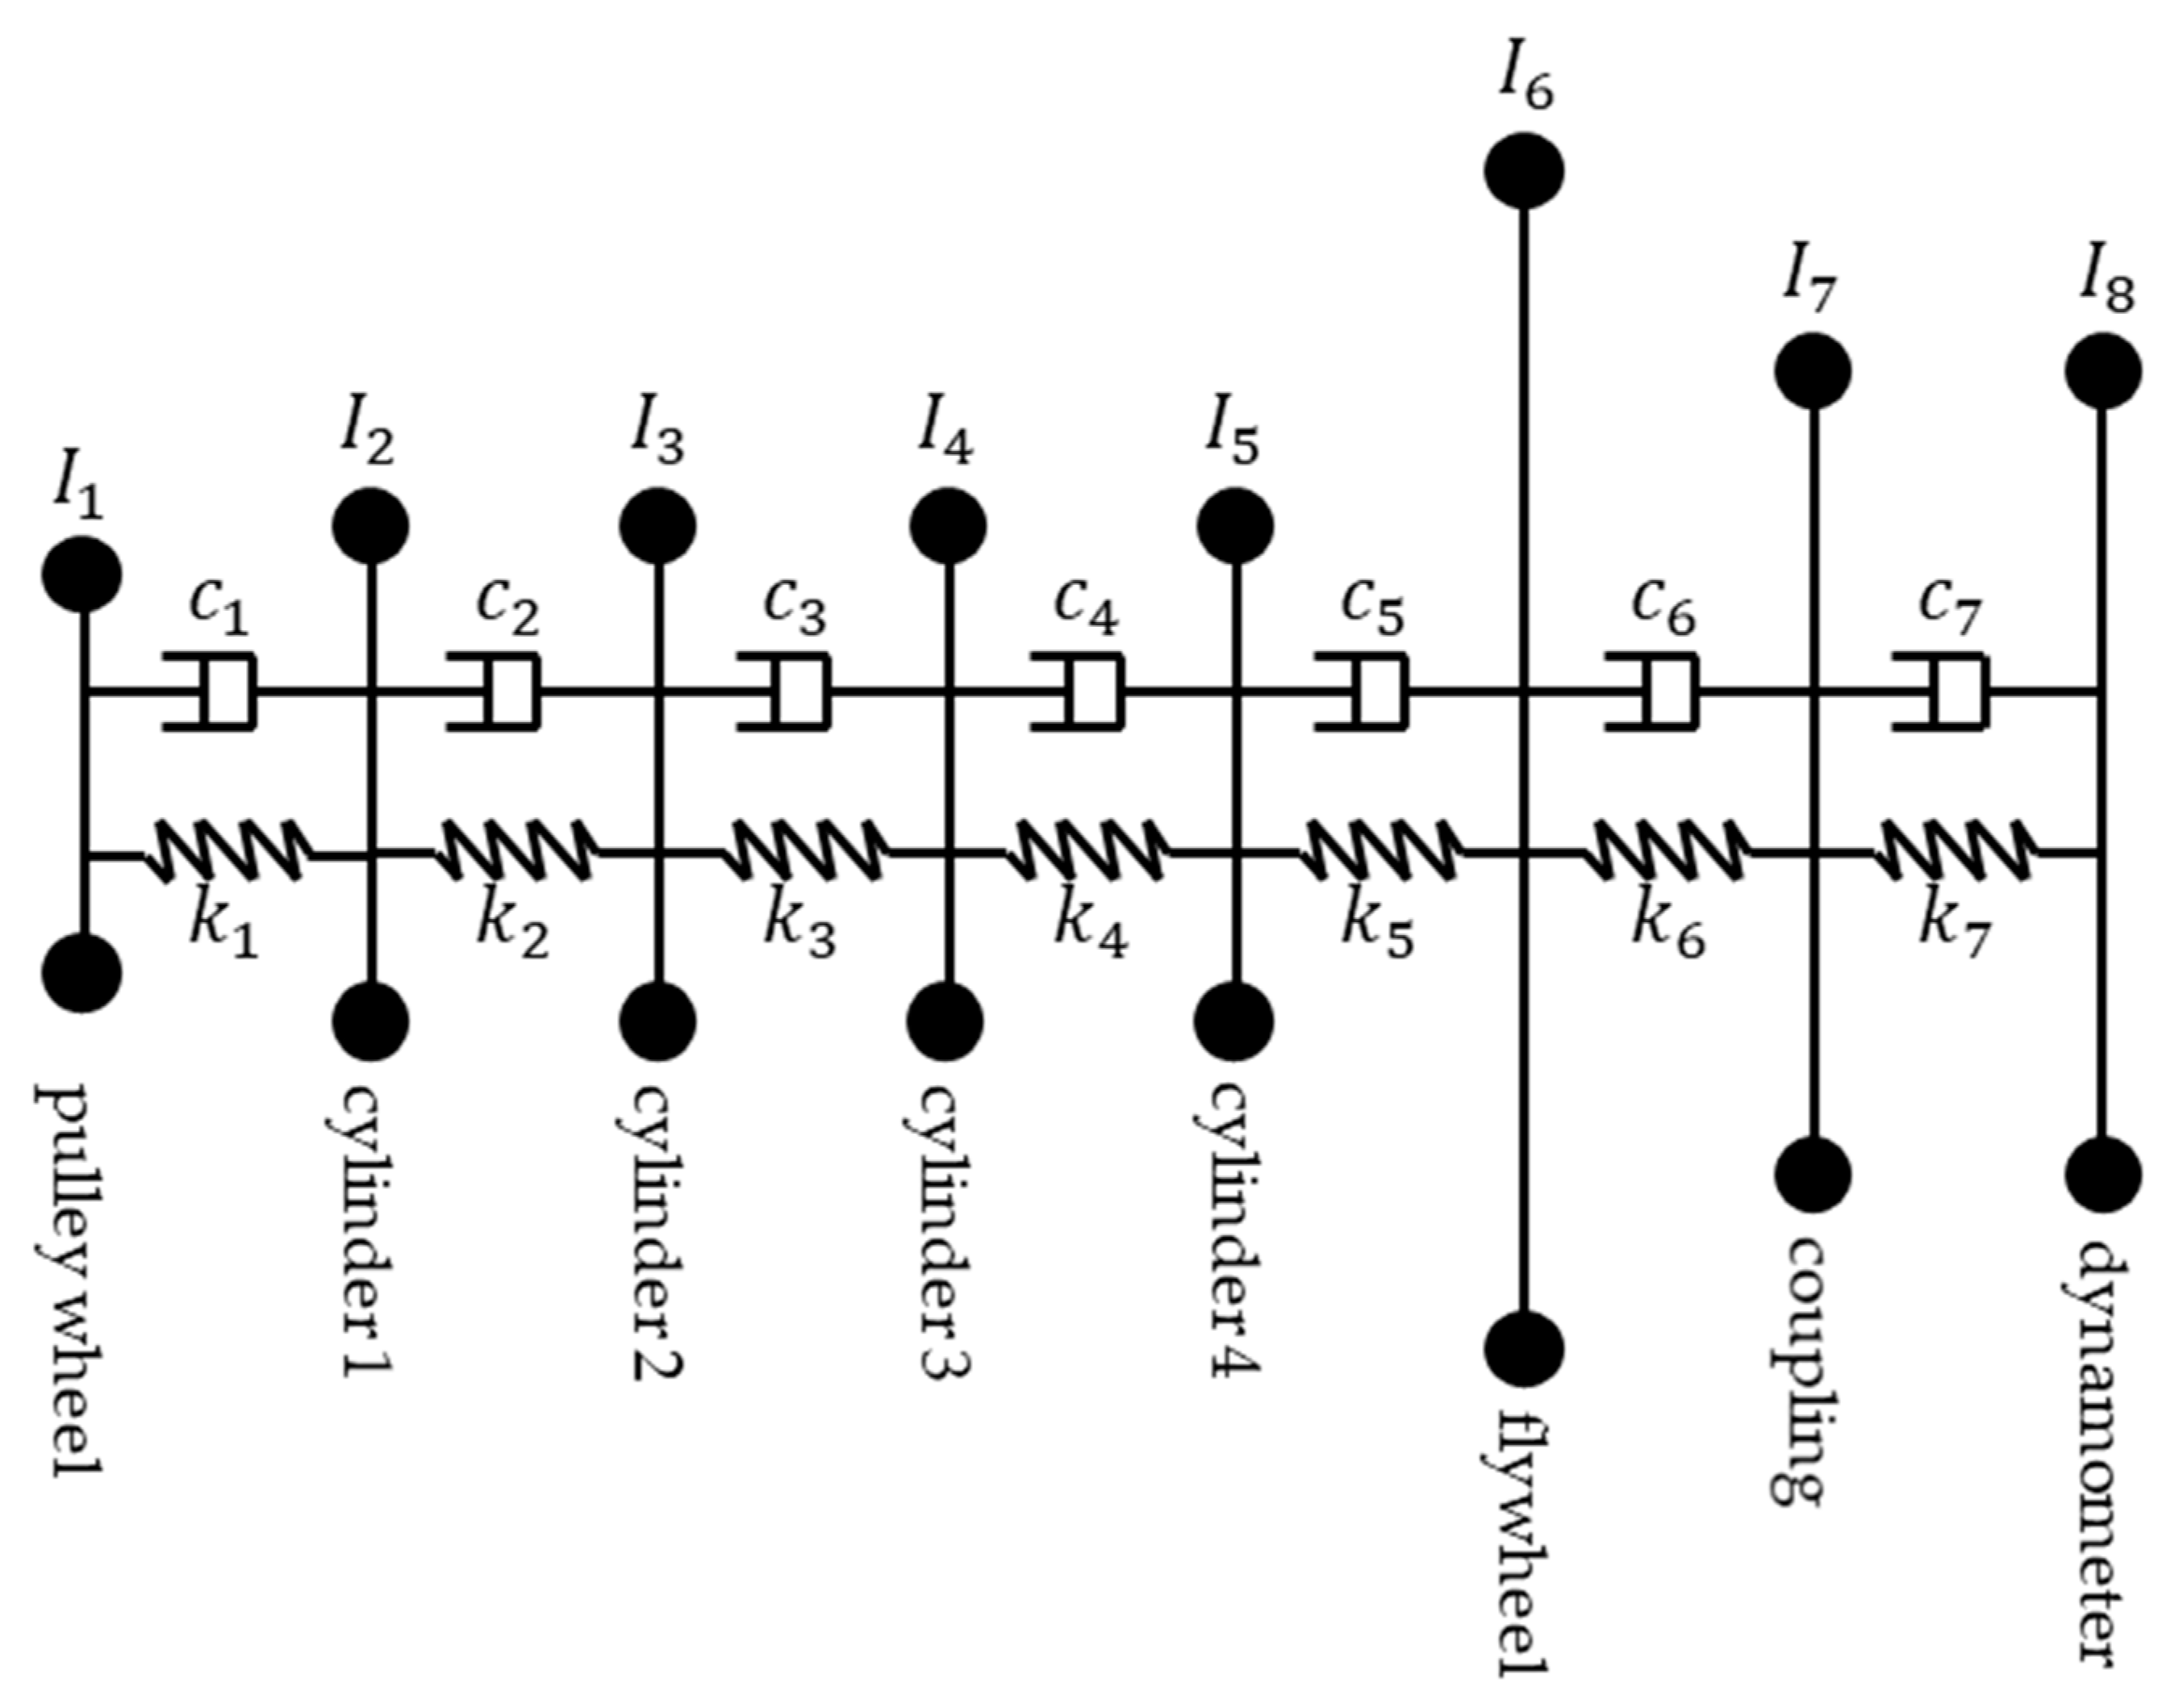
Based on the physical powertrain system, a torsional vibration model was developed to simulate the dynamic responses of the rotor systems. The engine powertrain system can be represented by a lump model to investigate the torsional vibration responses. As illustrated in the Figure 3, the torsional model has 10 degrees of freedom (DOF), including the pulley wheel, four cylinders, the flywheel, the flexible coupling and the dynamometer.
The torsional vibration model of the system can be derived by the first principle and it can be expressed in the matrix form as
I { θ ¨ } + C { θ ˙ } + K { θ } = T T ,
where θ = [ θ 1   θ 2 θ 8 ] T is the crank angle at each DOF; I , C and K are the matrixes of the moment of inertia, torsional damping and torsional stiffness, which can be expressed as follows.
I = diag ( [ I 1 , I 2 , I 8 ] )
C = [ c 1 c 1 c 1 c 1 + c 2 c 2 c 2 c 2 + c 3 c 3 c 3 c 3 + c 4 c 4 c 4 c 4 + c 5 c 5 c 5 c 5 + c 6 c 6 c 6 c 6 + c 7 c 7 c 7 c 8 ]
K = [ k 1 k 1 k 1 k 1 + k 2 k 2 k 2 k 2 + k 3 k 3 k 3 k 3 + k 4 k 4 k 4 k 4 + k 5 k 5 k 5 k 5 + k 6 k 6 k 6 k 6 + k 7 k 7 k 7 k 8 ]
The torques on the torsional model are the torques generated from the piston and the external load, which are expressed as
T T = [ 0 , T c 1 ( θ 2 ) , T c 2 ( θ 3 ) , T c 3 ( θ 4 ) , T c 4 ( θ 5 ) , 0 , 0 , T e ( θ 8 ) ]   ,
where the T c 1 , T c 2 , T c 3 , T c 4 are the torques of the combination between gas torques from the combustion and inertia torques at each cylinder; T e is the external load from the dynamometer.
The parameters used in this model, including the moment of inertia, the torsional stiffness and torsional damping, are listed in the Table 4.
The modal parameters can be obtained from the inertia and stiffness matrix, and the first five modes of the model are listed in Table 5.
These resonant responses are generally considered to be negative for the accurate detection and diagnosis when using the IAS signals [19]. In the simulation studies, the resonant responses in the torsional vibration were investigated to denote the fair diagnostic performance.

3.2. Torque Simulation

The engine produces the power for the whole rotor system. The positive torques generated by the fuel combustion are used to drive the model for obtaining the IAS at different positions and different working conditions. An accurate model paves the way for understanding the dynamic responses and developing an optimal detection and diagnosis approach for the engine powertrains. The torques from the piston onto the cranks can be calculated from the variation of the in-cylinder pressure in a working cycle, and subsequently, the torques from pistons can be applied at each crank. The cylinder pressure signals were obtained during the tests, which were resampled and denoised by time synchronous averaging (TSA). The discrete cylinder pressure in the angular domain can be utilised to calculate the corresponding torques at the same crank angle as the cylinder pressure.
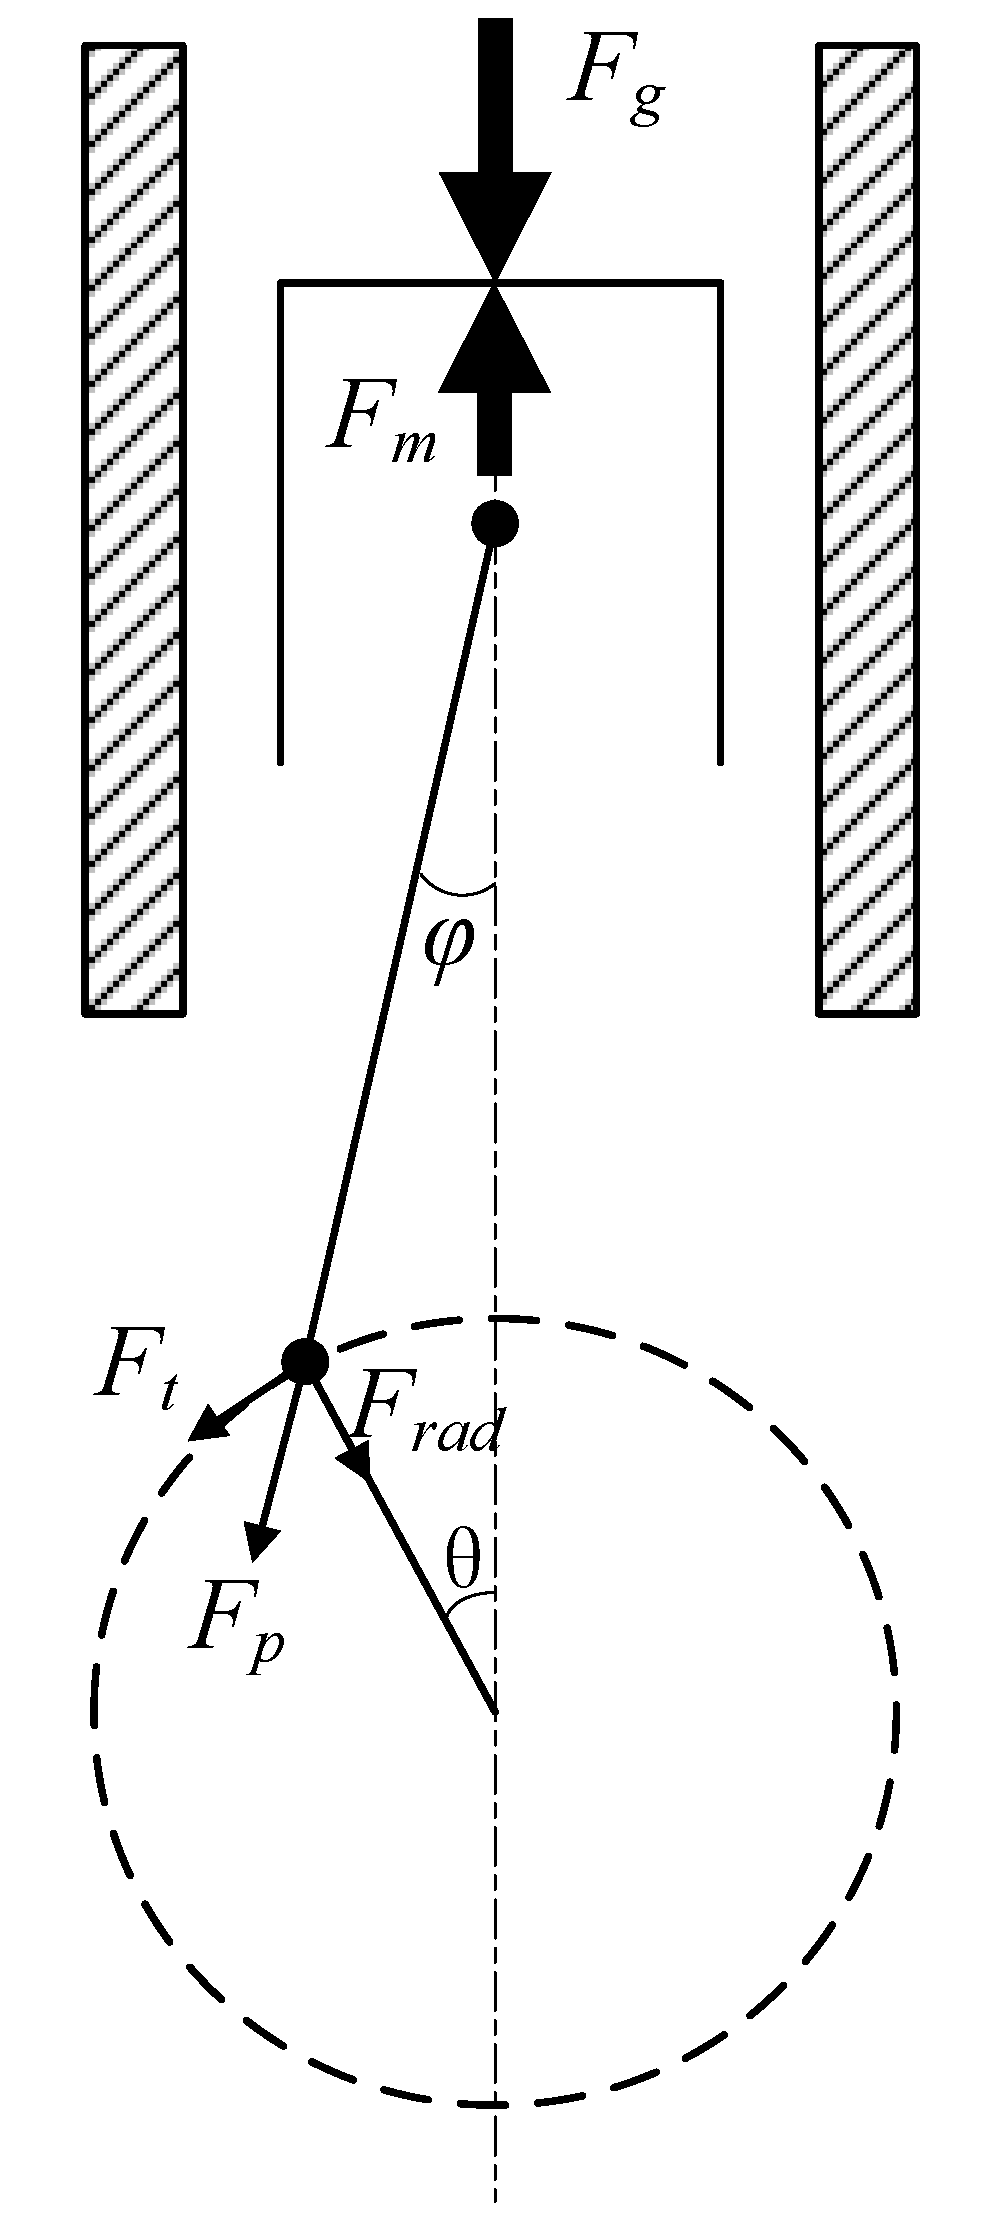
Figure 4 depicts the forces on the elements of the crank-piston system. To simplify the model, the friction forces were not considered in this study. Imaging the external load is constant, the variations of the torques are mainly from the reciprocating movement of the pistons. With the general mechanical analytics, the torque on a crank is deduced as
T T = F t r = ( F g F m ) s i n ( θ + φ ) r / c o s φ ,
where F g is the gas force produced by the cylinder pressure; F m is the oscillating inertia force, which depends on the acceleration of the piston movement. The oscillating inertia force due to the acceleration of the piston and part of the connecting rod can be calculated by
F m = m p θ ˙ 2 r ( cos θ + r l cos 2 θ ) ,
where m p is the mass of the piston and the small end of the connecting rod; r and l are the lengths of the crank and the connecting rod respectively; θ and θ ˙ are the crankshaft rotating angle and angular speed.
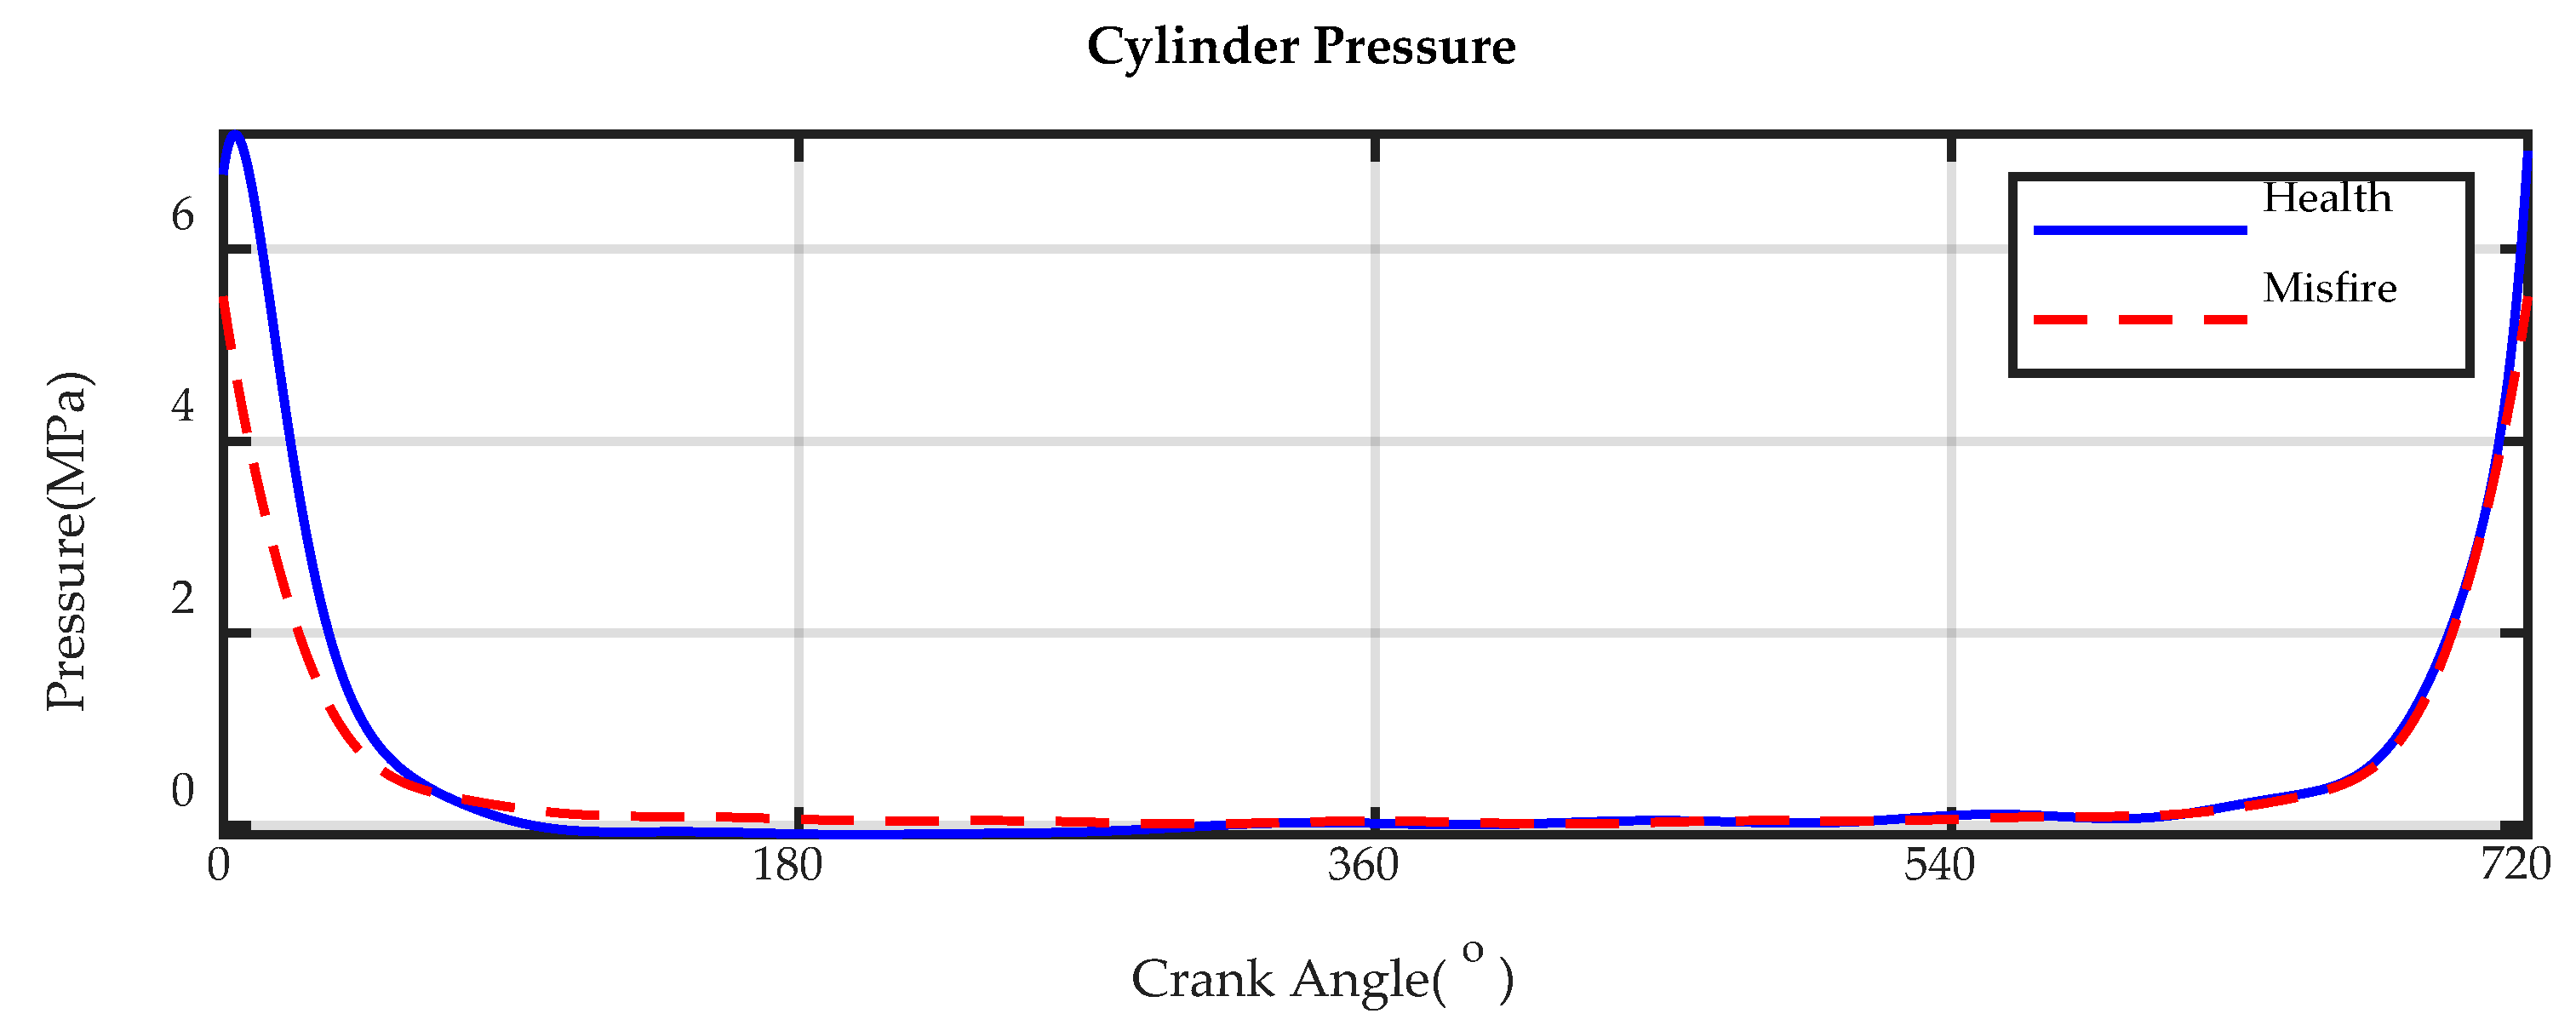
The cylinder pressure signals are pre-processed, and then converted into the angular domain waveforms by the time synchronous averaging (TSA). The cylinder pressure signals, rearranged in the angular domain, have a length of 3600 samples per revolution, and in another words, the length of the angular pressure signals in an engine working cycle is 7200 points. The cylinder pressure signals of health and misfire cases at the working conditions of 1000 rpm and 105 Nm are depicted in Figure 5. The main difference of the cylinder pressure signals is located at the combustion stroke, and the peak pressure at the faulty condition drops due to misfire, which leads to the abnormal decrease of the IAS.
According to the Equations (9) and (10), the torques on the crankshaft generated by the gas forces and the inertia forces can be calculated and then used to solve the ordinary differential equations of the numerical model. Figure 6a shows the torques’ variation of the first cylinder in a working cycle and Figure 6b depicts the torques from four cylinders. For a straight-four engine, the torsional torque is repeatable at each cylinder, but delayed based on the firing order.
The torques derived from the motion of the crank-piston system are utilised to solve the differential equations in the developed model by MATLAB (R2019b, MathWorks, Natick, MA, USA) ode functions. However, the solution requires a continuous representation of the torques, and the discrete torques from the cylinder pressure waveforms are not adequate for the simulation. Therefore, an accurate and efficient fitting method of the torque curve is required for achieving an optimal solution. A Fourier series based fitting method was selected to reconstruct the torques, and the discrete torques can be expanded as a Fourier series
x [ i ] = 1 2 R e X [ 0 ] + k = 1 N 2 1 R e X [ k ] cos ( 2 π k i N ) + k = 1 N 2 1 I m X [ k ] sin ( 2 π k i N ) ,
where X [ · ] represents the Fourier coefficients from the fast Fourier transform (FFT); R e and I m are the real and imaginary parts of a complex number, respectively; N is the signal length of the discrete torque waveform, and it is an even number. If the signal length N is an odd number, the expression can be easily found in a signal processing book, and it is not discussed here.
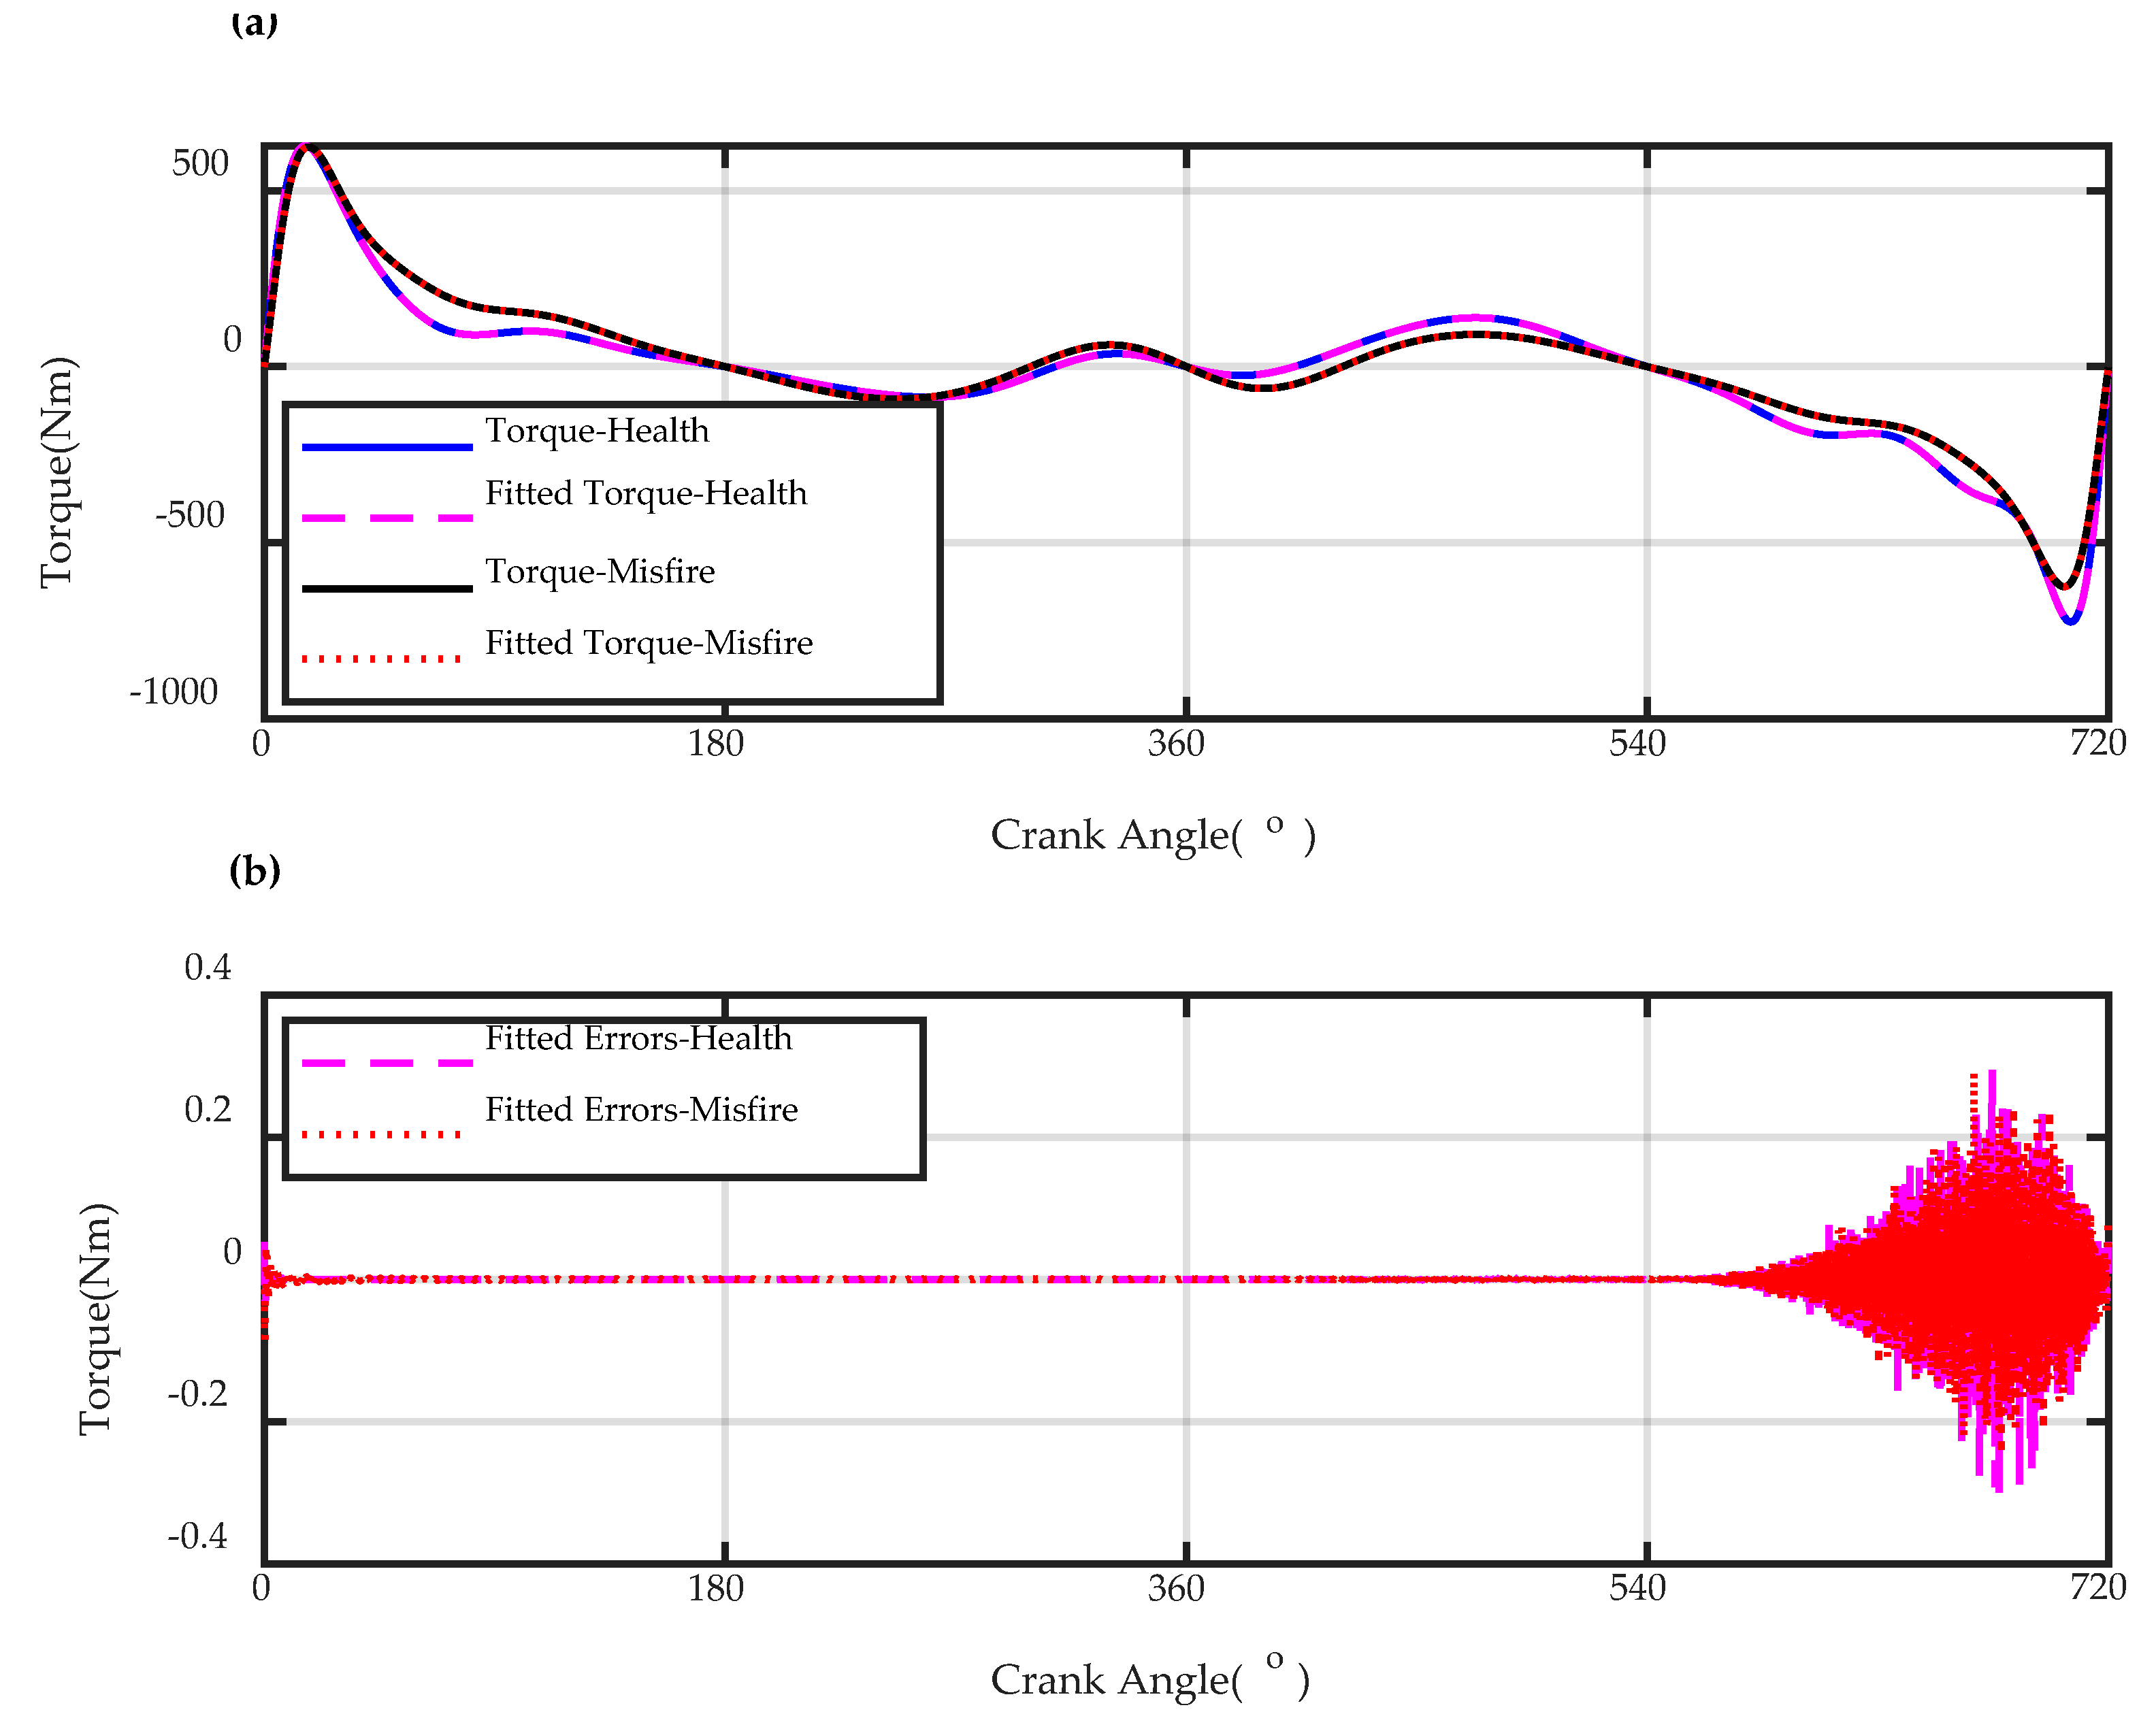
The variable k from 0 to N / 2 1 is the order of the Fourier series and the orders can be manually selected based on the demand. In this study, the order up to 500 is selected to reconstruct the torque curves. The torques on the cranks are the combination of the torque from the fuel combustion and the moment of inertia. As shown in Figure 7a, the torque on one crank at the health condition is denoted by the blue solid line and the fitted curve by Fourier series is shown in the red dash line. Similarly the torque signals and the fitted one are depicted by the black solid line and red dotted line respectively. The fitting errors of the healthy and faulty torque curves are represented in Figure 7b. It can be seen that the fitting errors are tiny compared to the original signals. To quantify the fitting performance of the Fourier series method, the coefficient of determination R 2 is used to give the goodness of the model fitting. The coefficients of determination R 2 are 99.99% for fitting the healthy torque and 99.98% for fitting the misfire torque. The resultant torque at each crank is applied to drive the model according to the cylinder firing order.

3.3. Verification of the Torsional Model

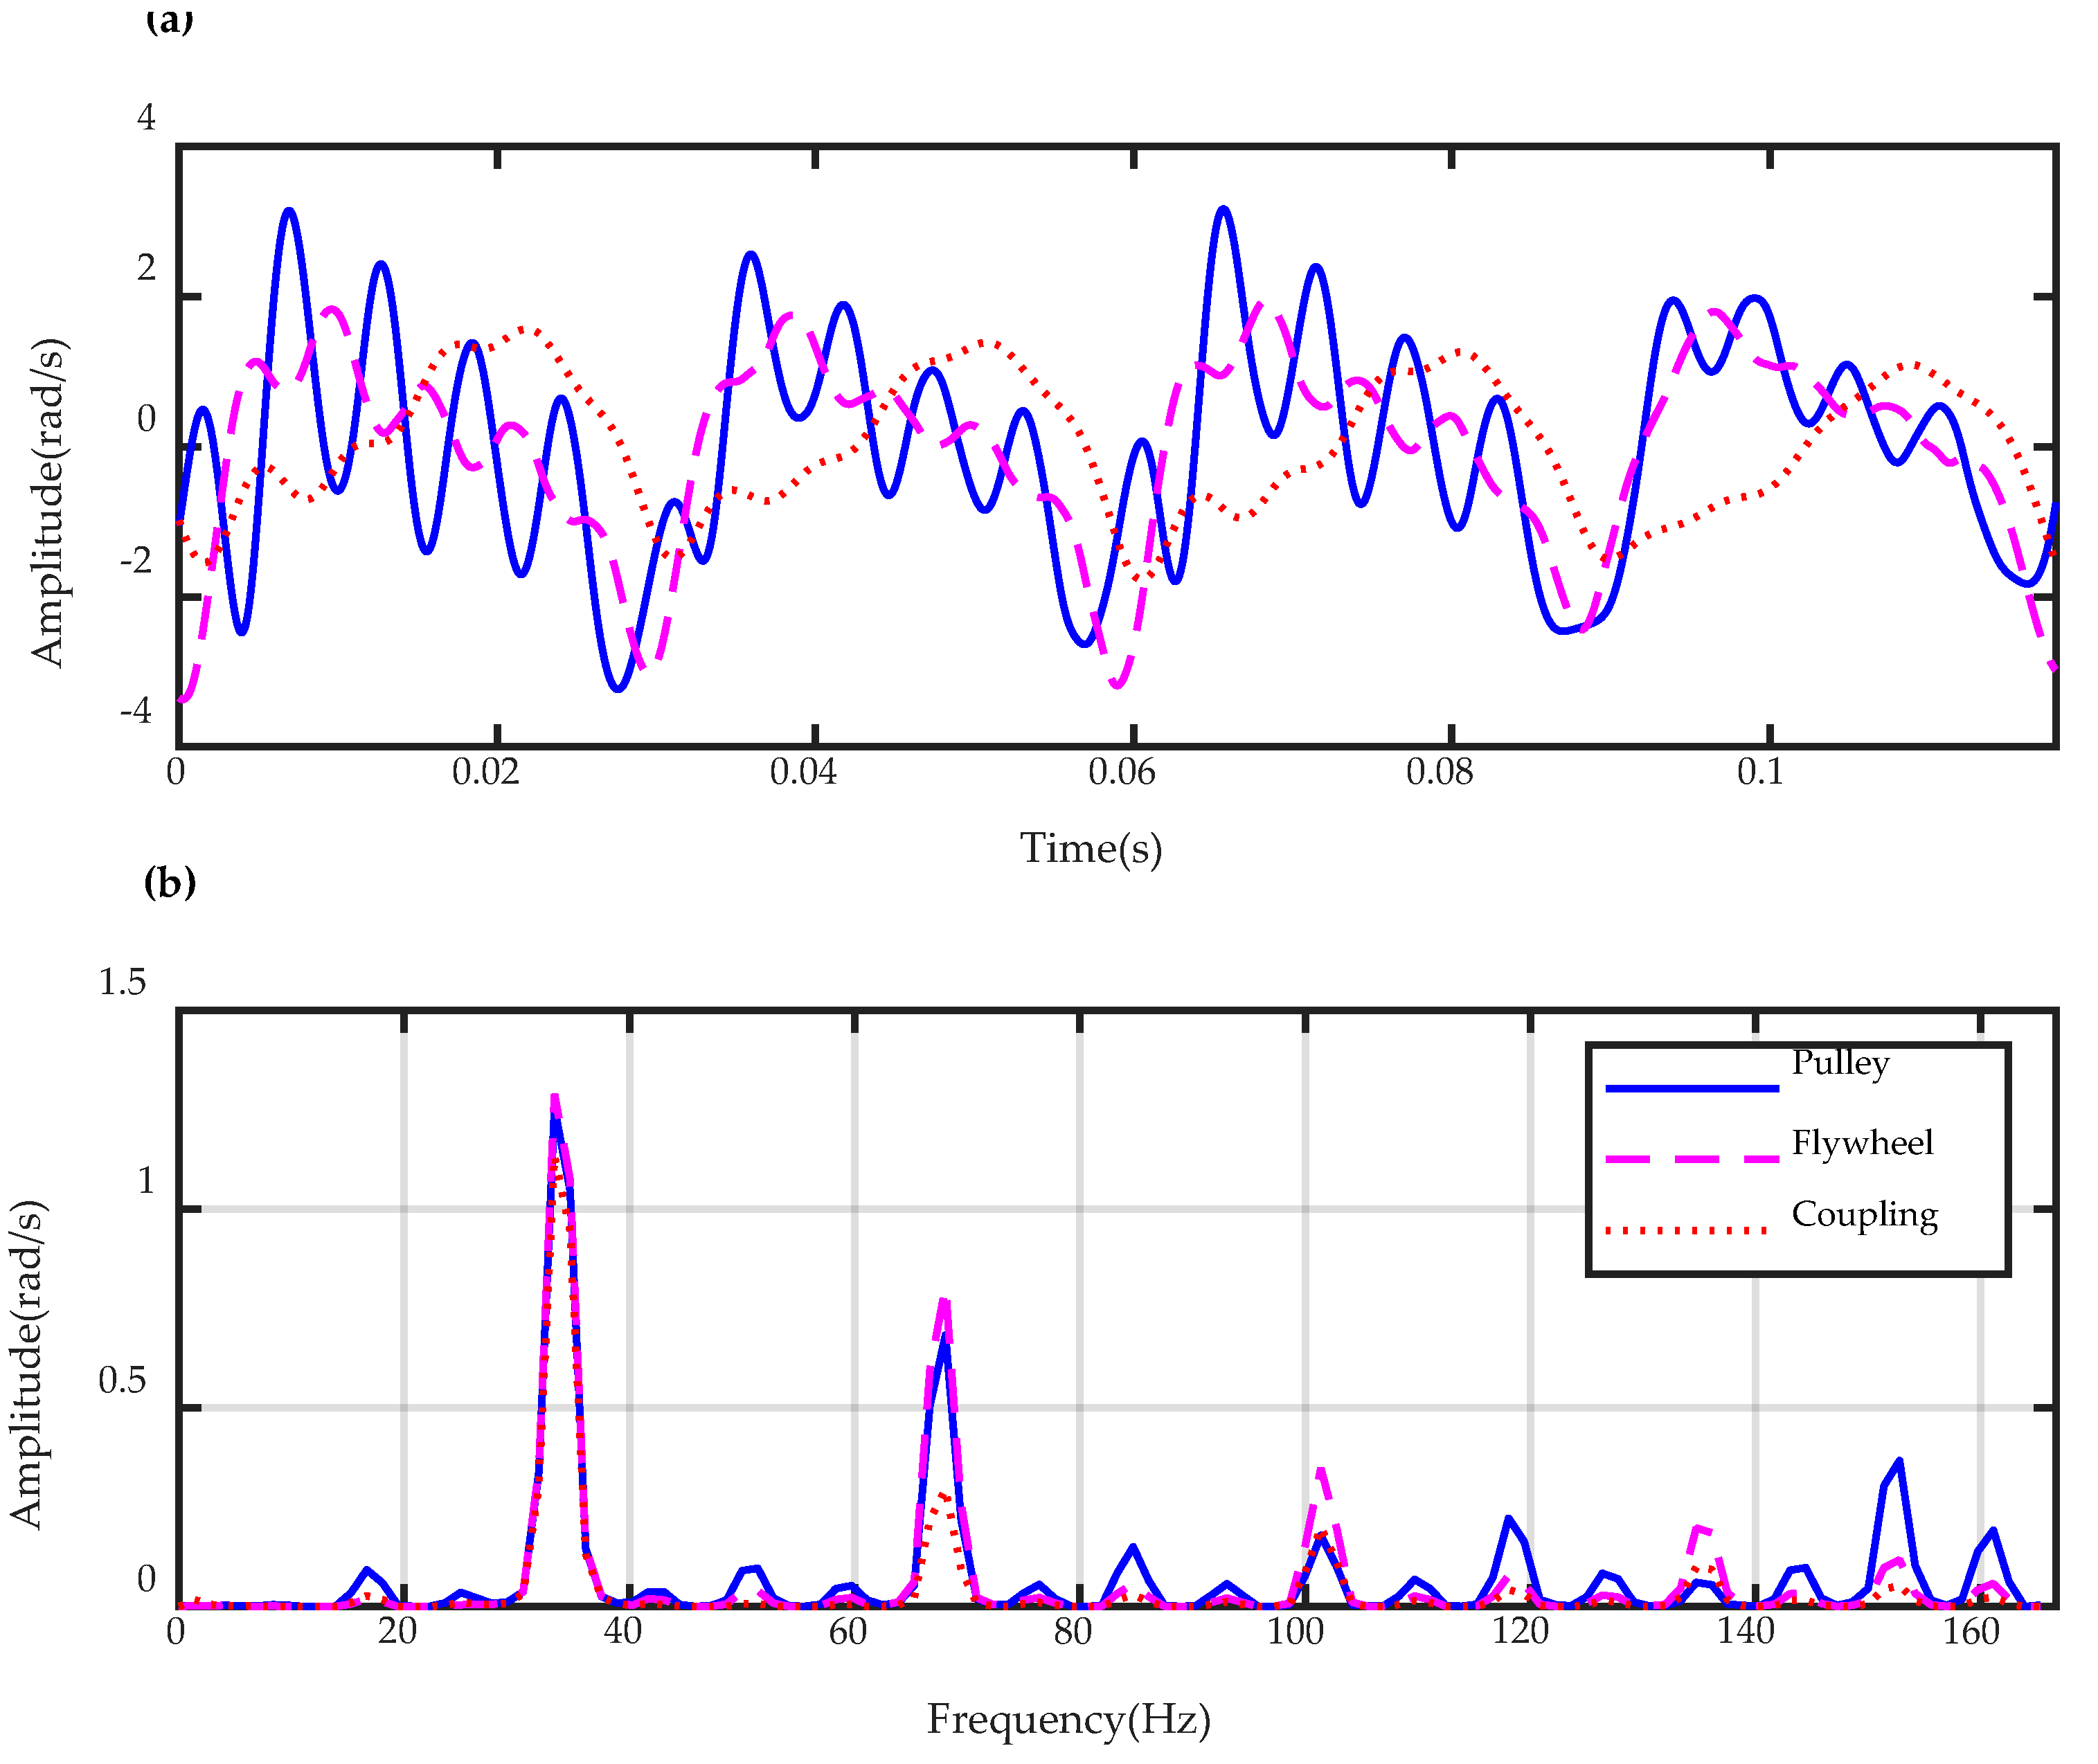
The simulation results of the IAS at the pulley, flywheel and coupling are displayed in the Figure 8a. The results in the figure are based on the engine running at the speed of 1000 rpm with a load of 105 Nm, and the following results are mainly explained under those working condition. The IAS oscillation describes the speed variation in engine working cycles. The simulation results in both angle and frequency domain show that the responses at the flywheel and coupling are smoother than that at the pulley, which is mainly due to the large moment of inertia of the flywheel. The spectra of the IAS signals are depicted in the Figure 8b. The dominant peak is the second harmonic of the rotating speed, and this is due to the working principle of four cylinder engines. The target engine is a four cylinder and four stroke diesel engine, which has two combustion events in every revolution. In the combustion stroke, the power generated by the fuel combustion supports the continuous rotation, and thus the torque outputs of the powertrain. Consequently, the IAS in the power stroke rises, leading to a peak in the working cycle.
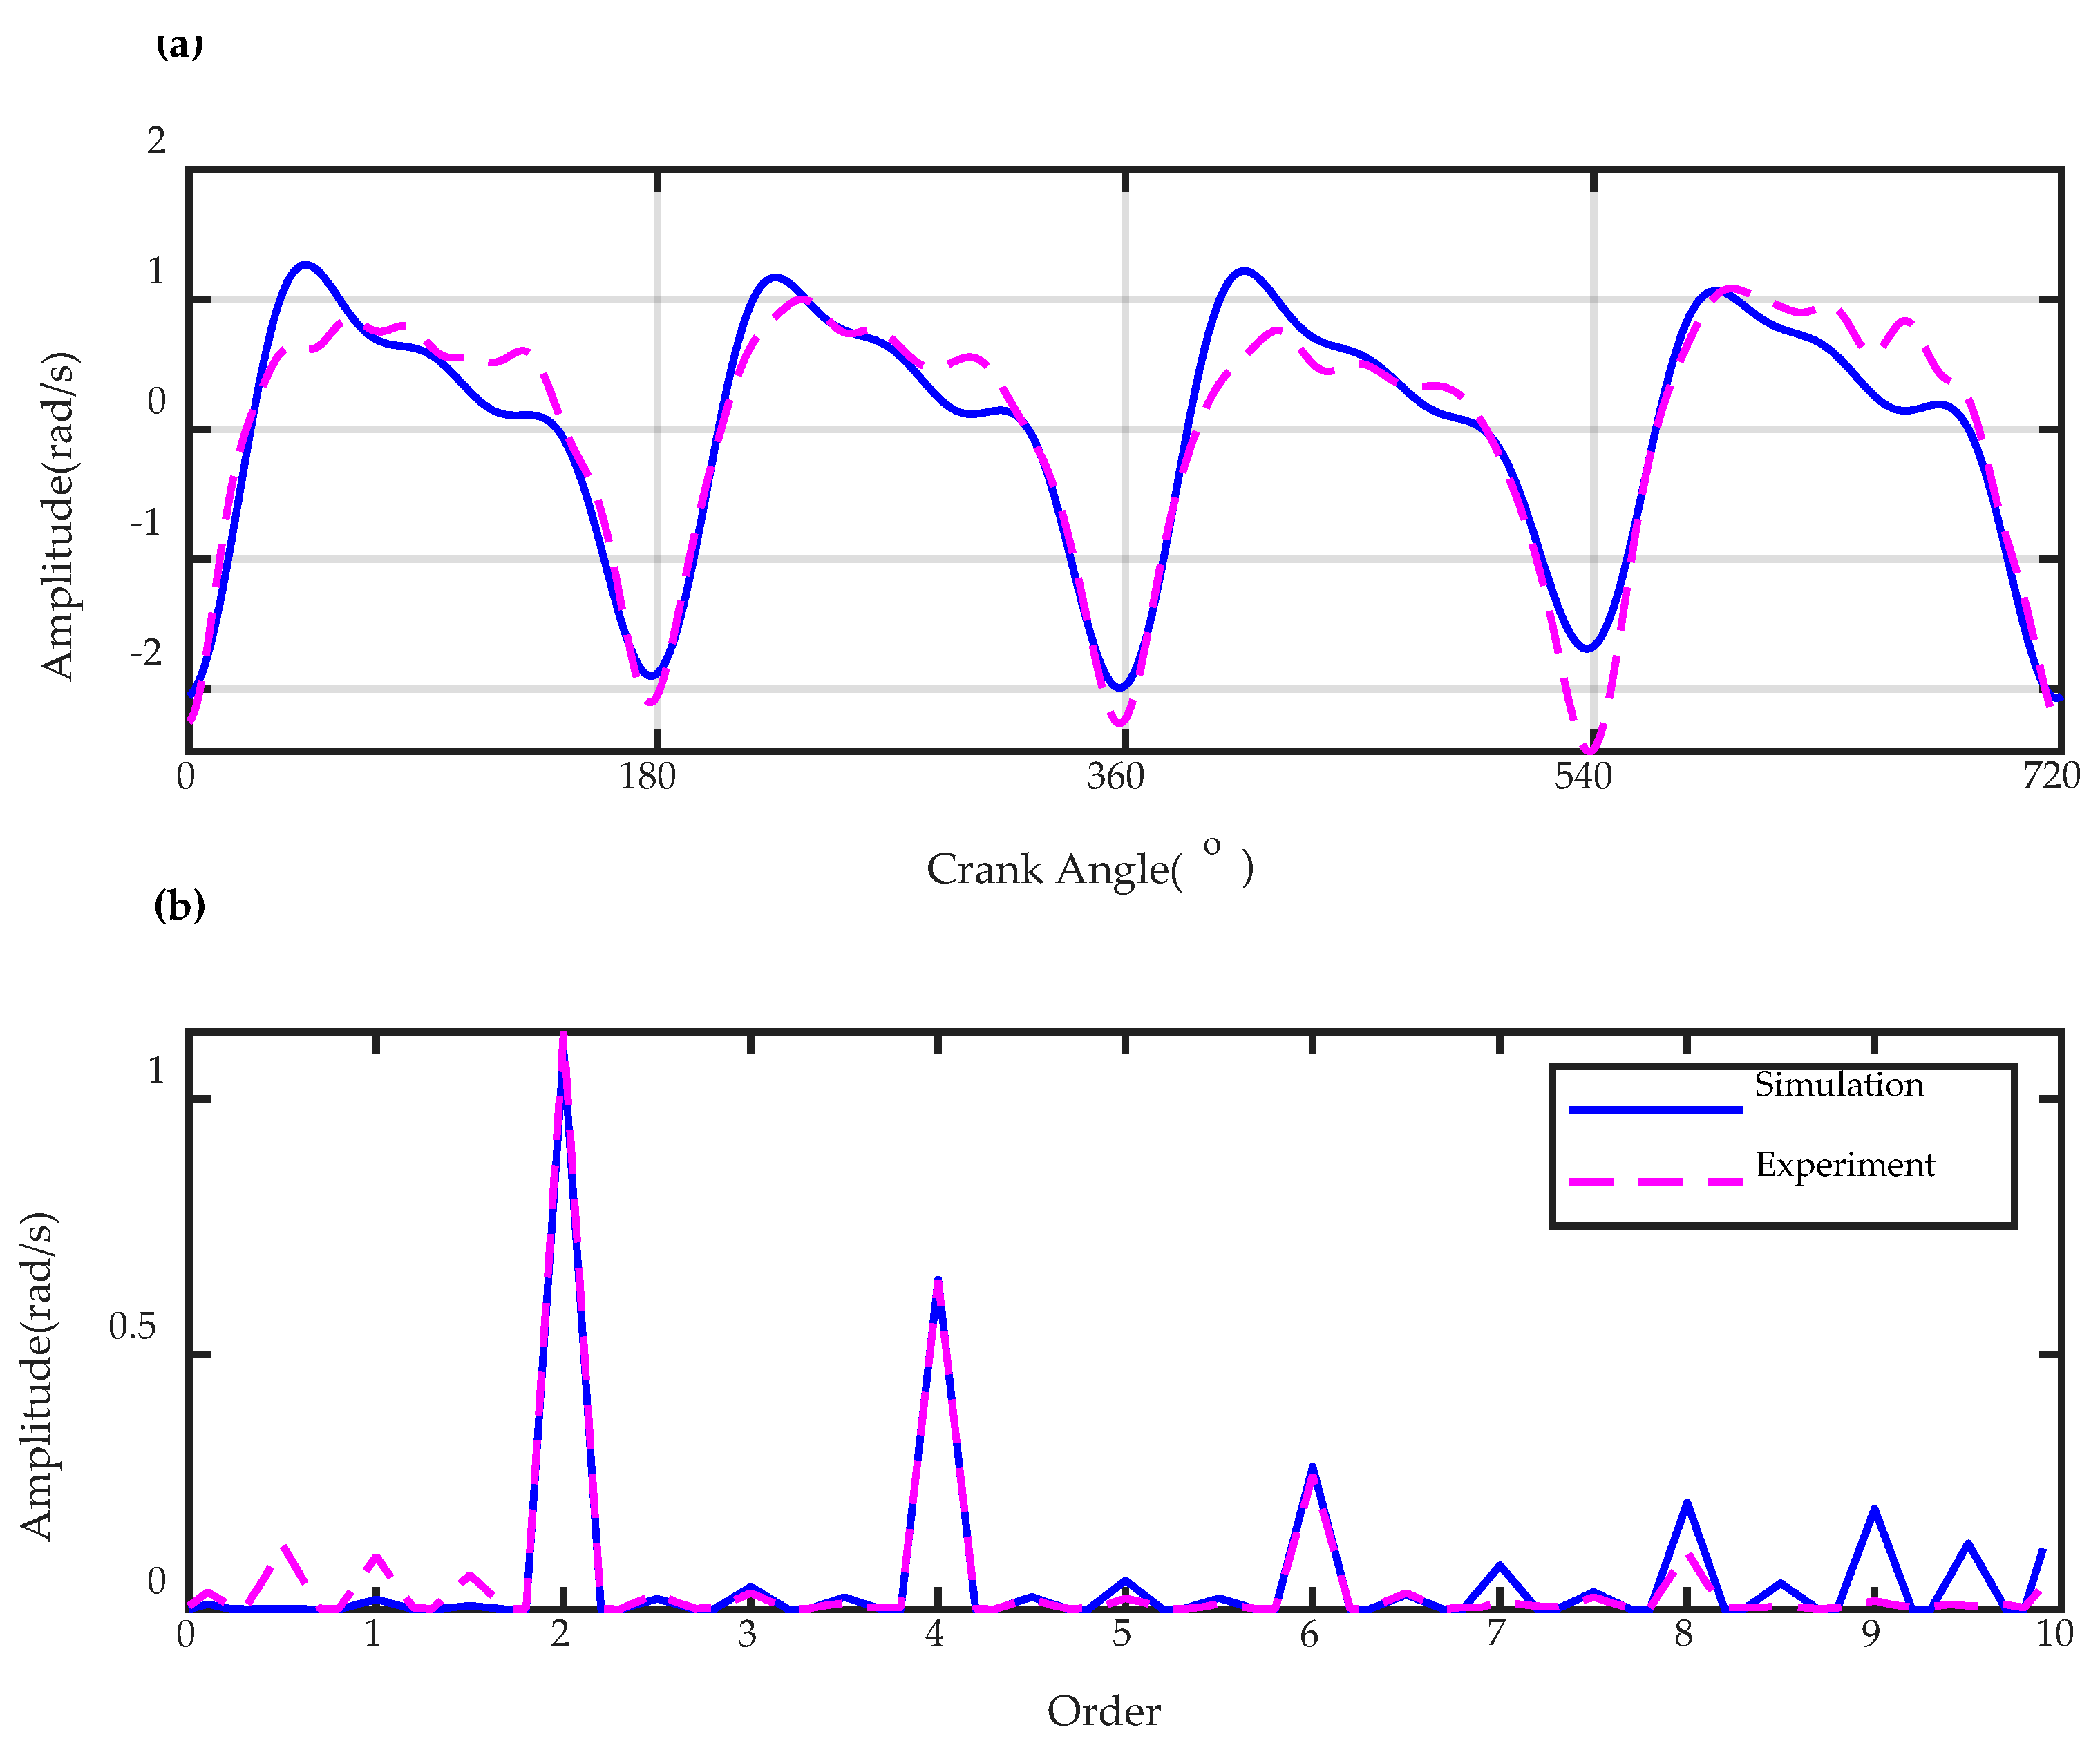
To verify the developed model, the IAS signals obtained from the simulation and experiments are compared in both angular and frequency domains. The Figure 9a shows the angular waveforms of IAS at the flywheel in the simulation and experimental studies. It can be seen that the simulated IAS signals are similar to the experimental ones in the angular domain. From another viewpoint, the spectra in the frequency domain show more information about the IAS signals in the Figure 9b. The main peaks, including firing frequency and its harmonics, are same although the subharmonics; particular, the rotating frequency and 0.5 harmonic are different due to the uneven combustion in the cylinders, which is a common phenomenon in diesel engines. The highly efficient engines are considered to have equivalent combustion in each cylinder and the imbalances between each cylinder are actually the occurrences of faults.

4. Model Based Investigation

4.1. Simulation of Misfire Faults

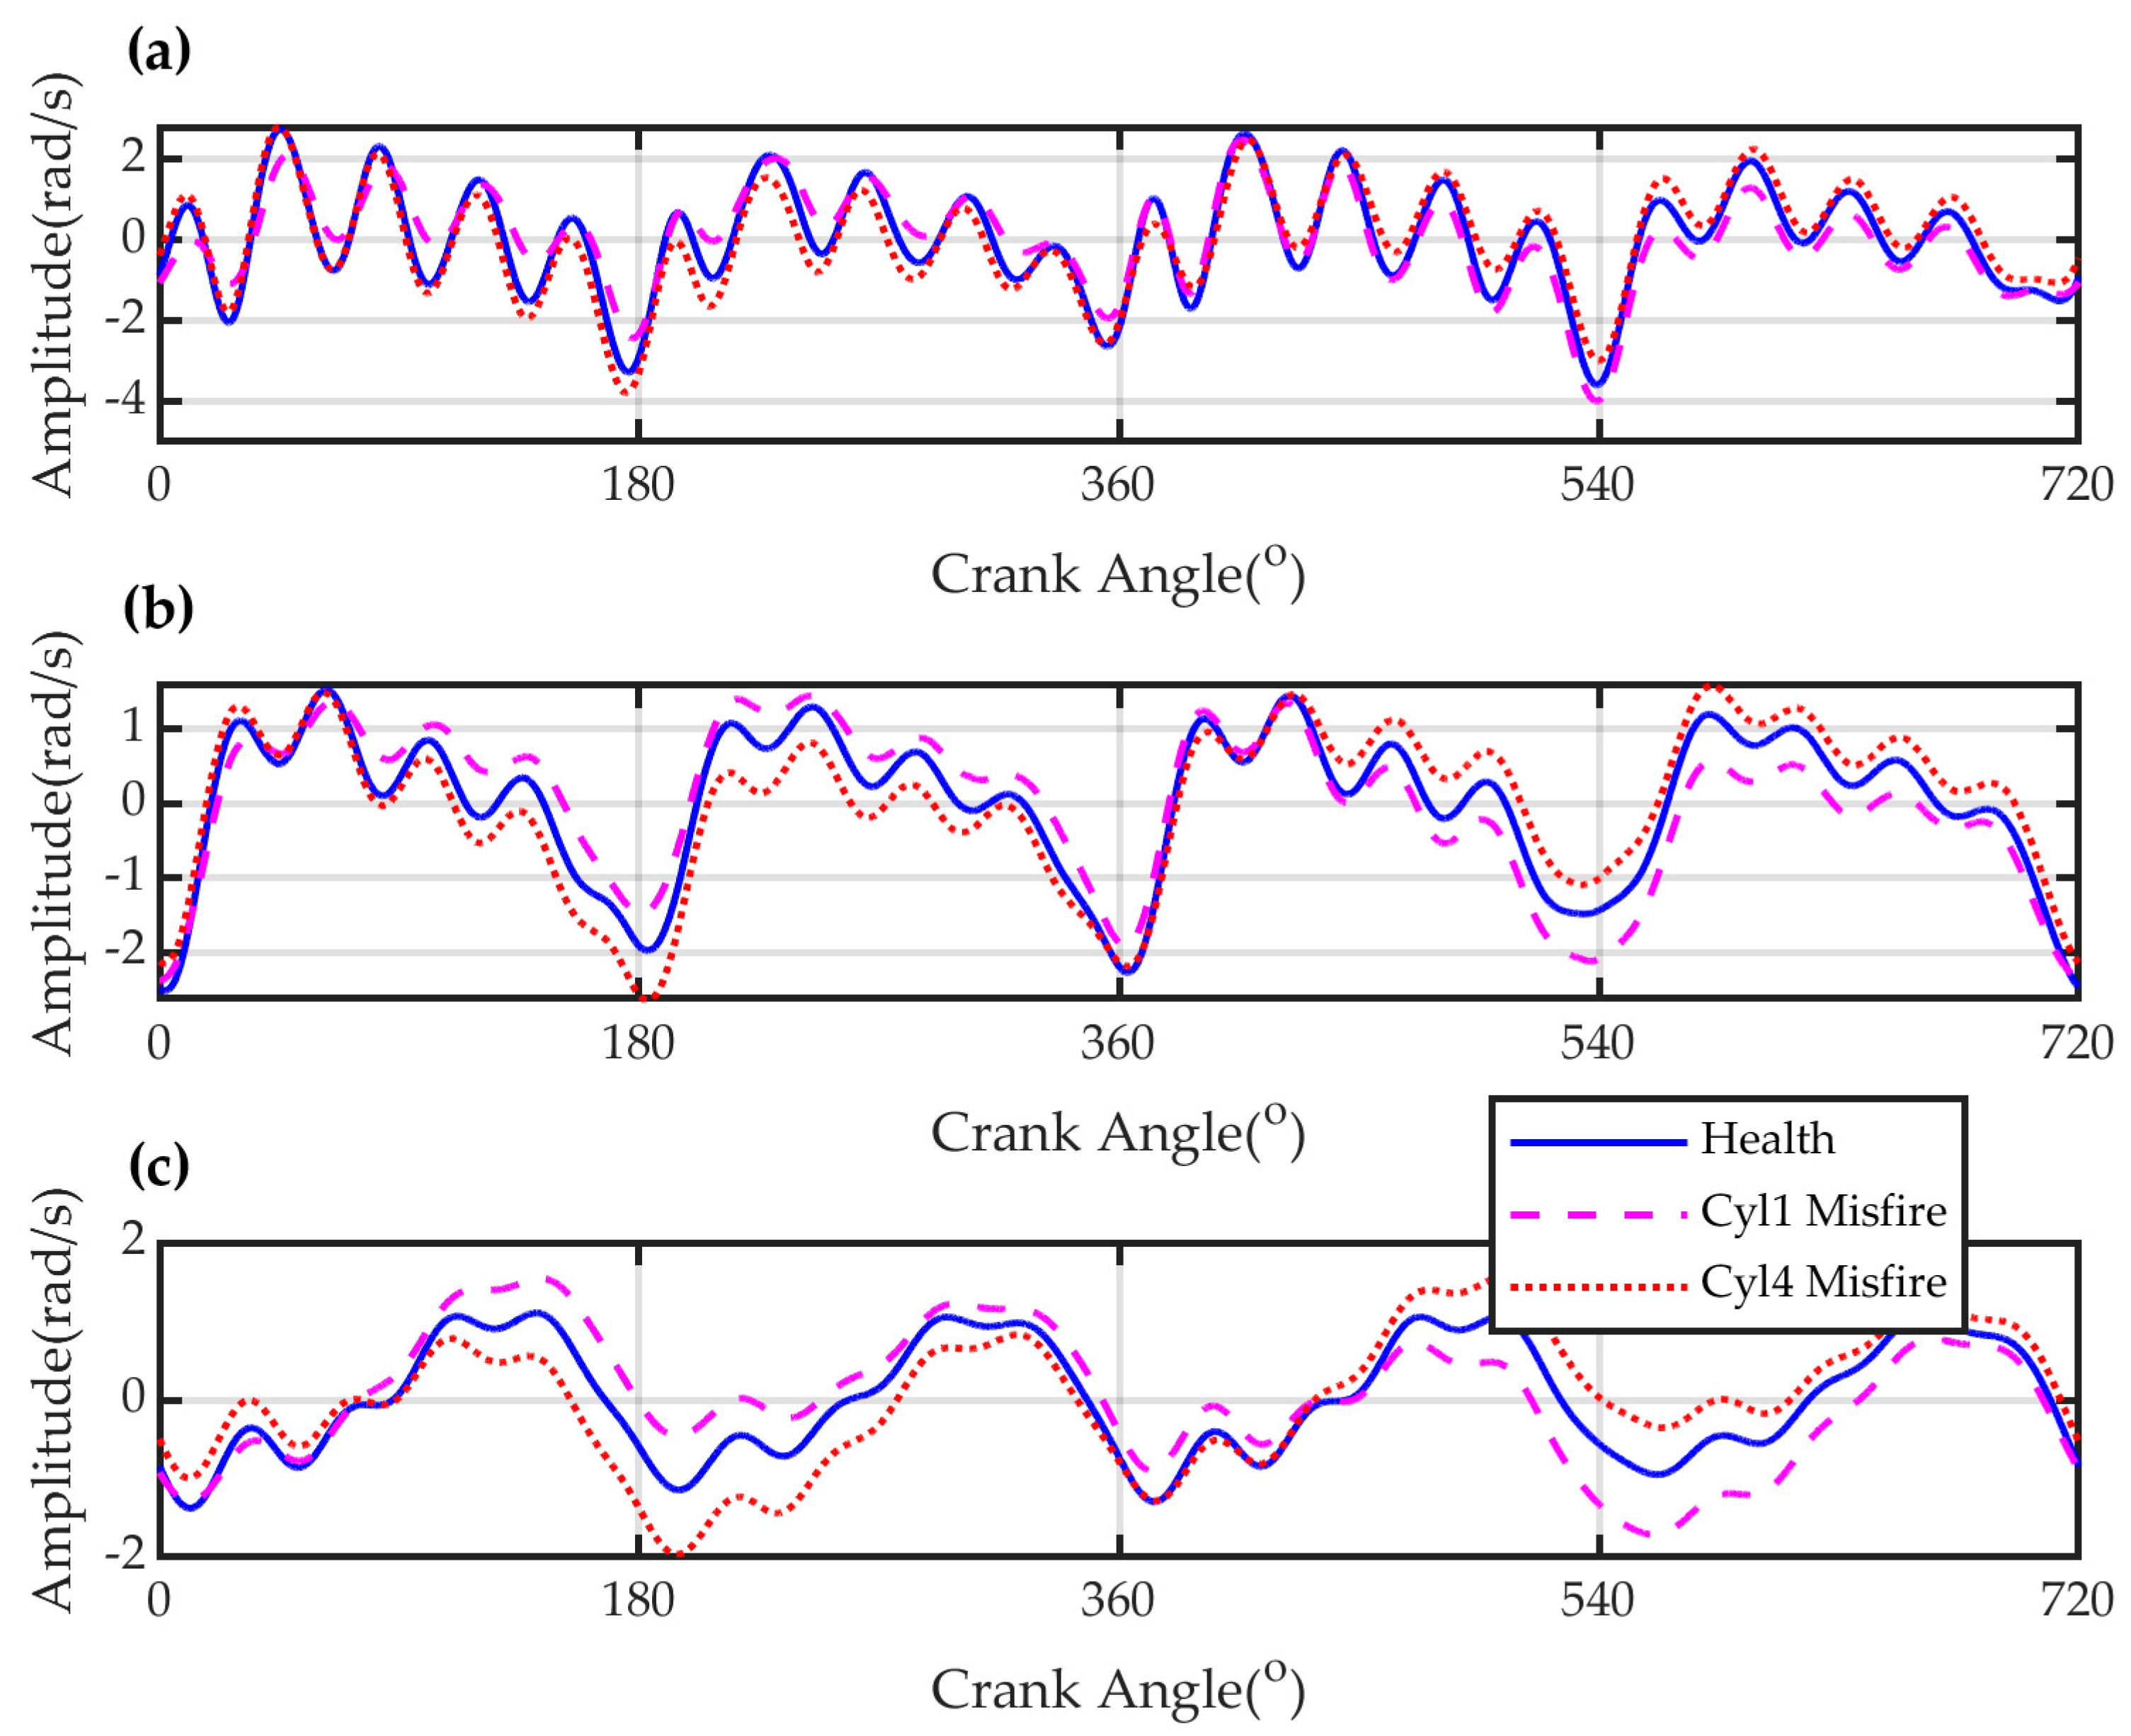
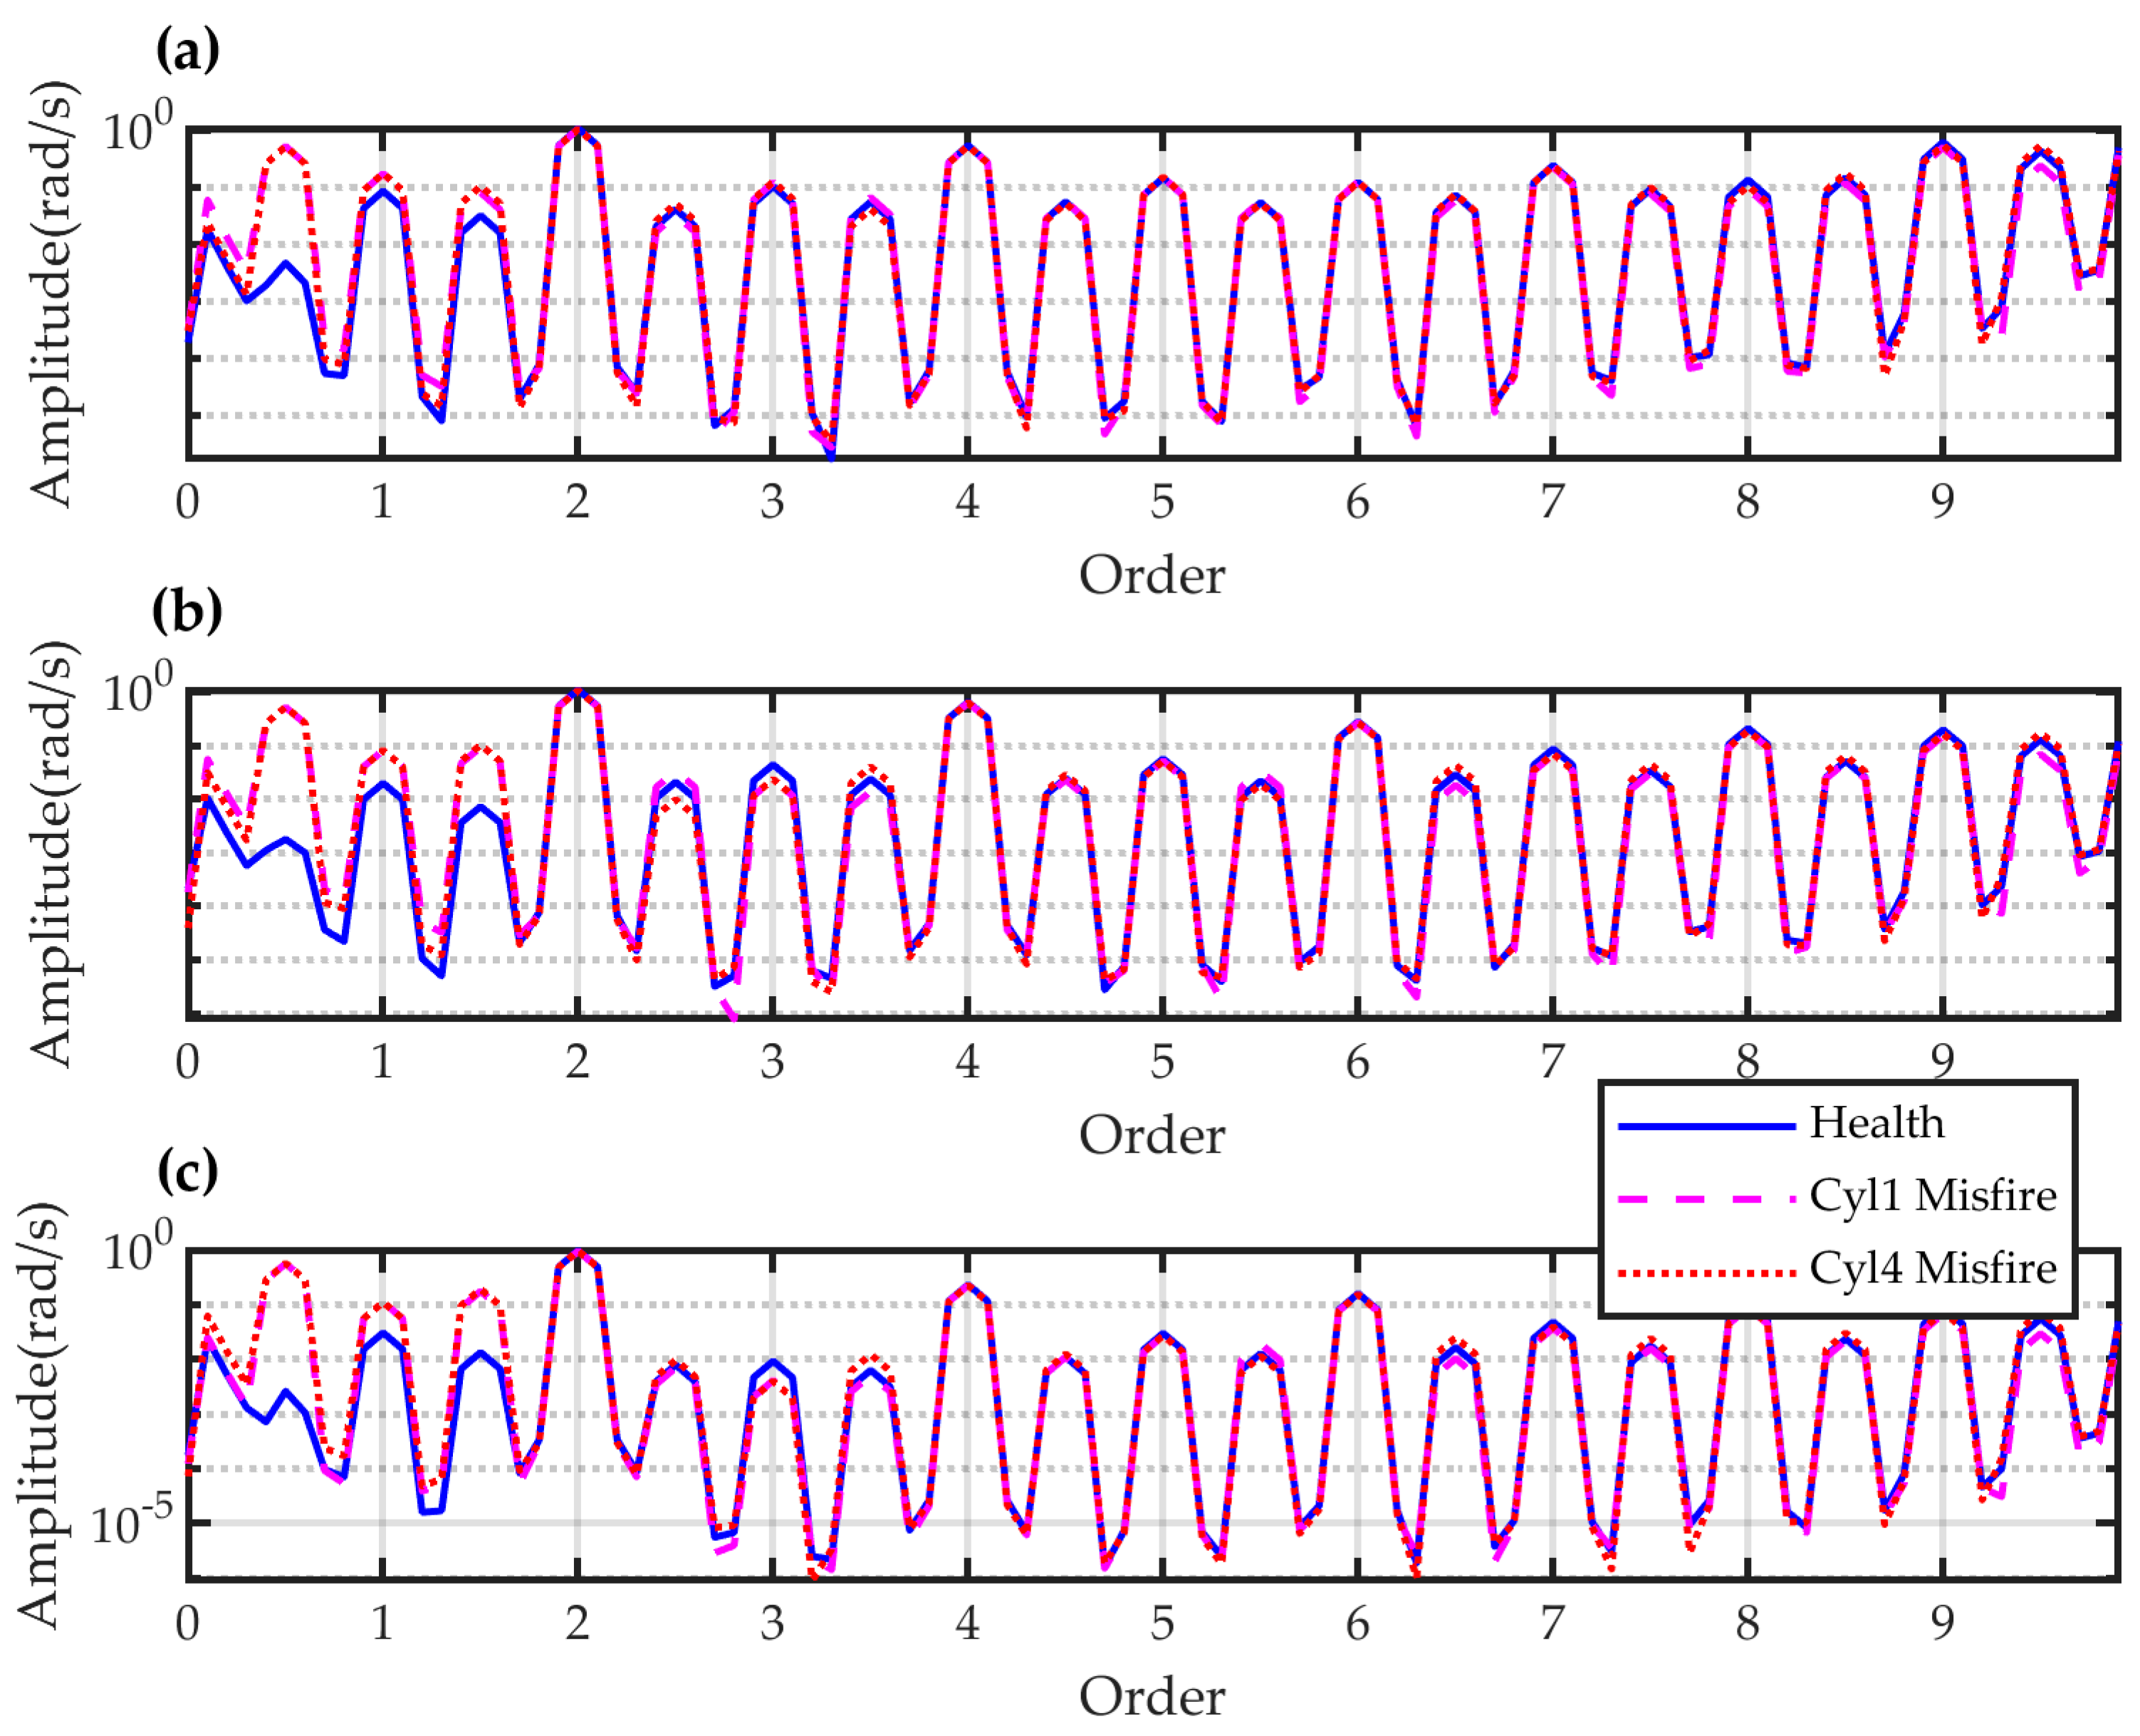
The torsional model of the engine powertrain was developed to investigate the most efficient and effective measurement location for detecting and diagnosing misfire faults. The faults introduced in the following simulation studies were 100% misfires at each cylinder of the engines. The variations of the IAS signals at the pulley, flywheel and coupling are exhibited as the representatives of eight DOF in the angular and frequency domain for the cases of health and faulty conditions. Figure 10 shows the IAS signals obtained at the pulley, flywheel and coupling respectively. In each subfigure, the IAS signals are comprised of the speed variation in the conditions of health, Cylinder 1 misfire (Cly1 Misfire) and Cylinder 4 misfire (Cyl4 Misfire). Based on the firing order (1–3–4–2) shown in the Figure 11, the misfire leads to the decrease of the IAS at the power stroke of the corresponding cylinder. In the meantime, the IAS at other power strokes increases to compensate the insufficient outputs of the faulty cylinder. The difference at the flywheel and coupling is more pronounced than that at the pulley side.
The order spectra (OS) from the angular IAS signals are depicted in the Figure 12. The differences are mainly located in the low order range, for which the reason is that the misfire faults destroy the periodicity of the torques generated by combustion, and hence lead to more oscillation around the shaft rotation.
The mean squared error (MSE) is used to quantify the variation induced by the misfire faults at four cylinders.
M S E = 1 N i = 1 N ( Y h Y f ) 2 ,
where N is the length of the angular waveform or the order spectrum; Y h denotes the angular waveform or the order spectrum for the healthy situation; and Y f is the faulty signal.
The MSE of the angular signals in both angular and frequency domain are displayed in the Figure 13. The results show that the IAS at the coupling give an efficient and effective indicator for the misfire faults in each cylinder. The IAS at the pulley is more efficient when the misfire occurs at the nearby cylinders.

4.2. Fault Detection and Diagnosis

The IAS based fault detection is a straightforward means because the misfire faults can lead to the manifest increase of the half order of the rotating frequency and decrease of the firing frequency or the second order of the rotating frequency. It is common that due to unbalanced fuel injection, nonuniform valve opening and closing and manufacture and assembly errors, the combustion in each cylinder is different in nature. Consequently, the unbalanced combustion delivers the appearance of the half order harmonic. The single use of half order harmonic is not robust enough to detect and diagnose the misfire faults. Based on the findings in the simulation signals, an indicator of the ratio between the sum of the 0.5, 1 and 1.5 order harmonics and the second order harmonics is raised as an effective and efficient misfire indicator, which can be expressed as
R f = i = 1 3 A ( f o ( i / 2 ) ) A [ f o ( 2 ) ] ,
where A is the amplitude of the order spectra of IAS signals; f o is the order of the spectrum.
The diagnosis of misfire faults is often a difficult task in condition monitoring. In this paper, the phase of the half order harmonic is used to point the misfired cylinder. Ideally the subharmonic is highly correlated with the uneven combustion, especially the most unbalanced case, misfire faults.
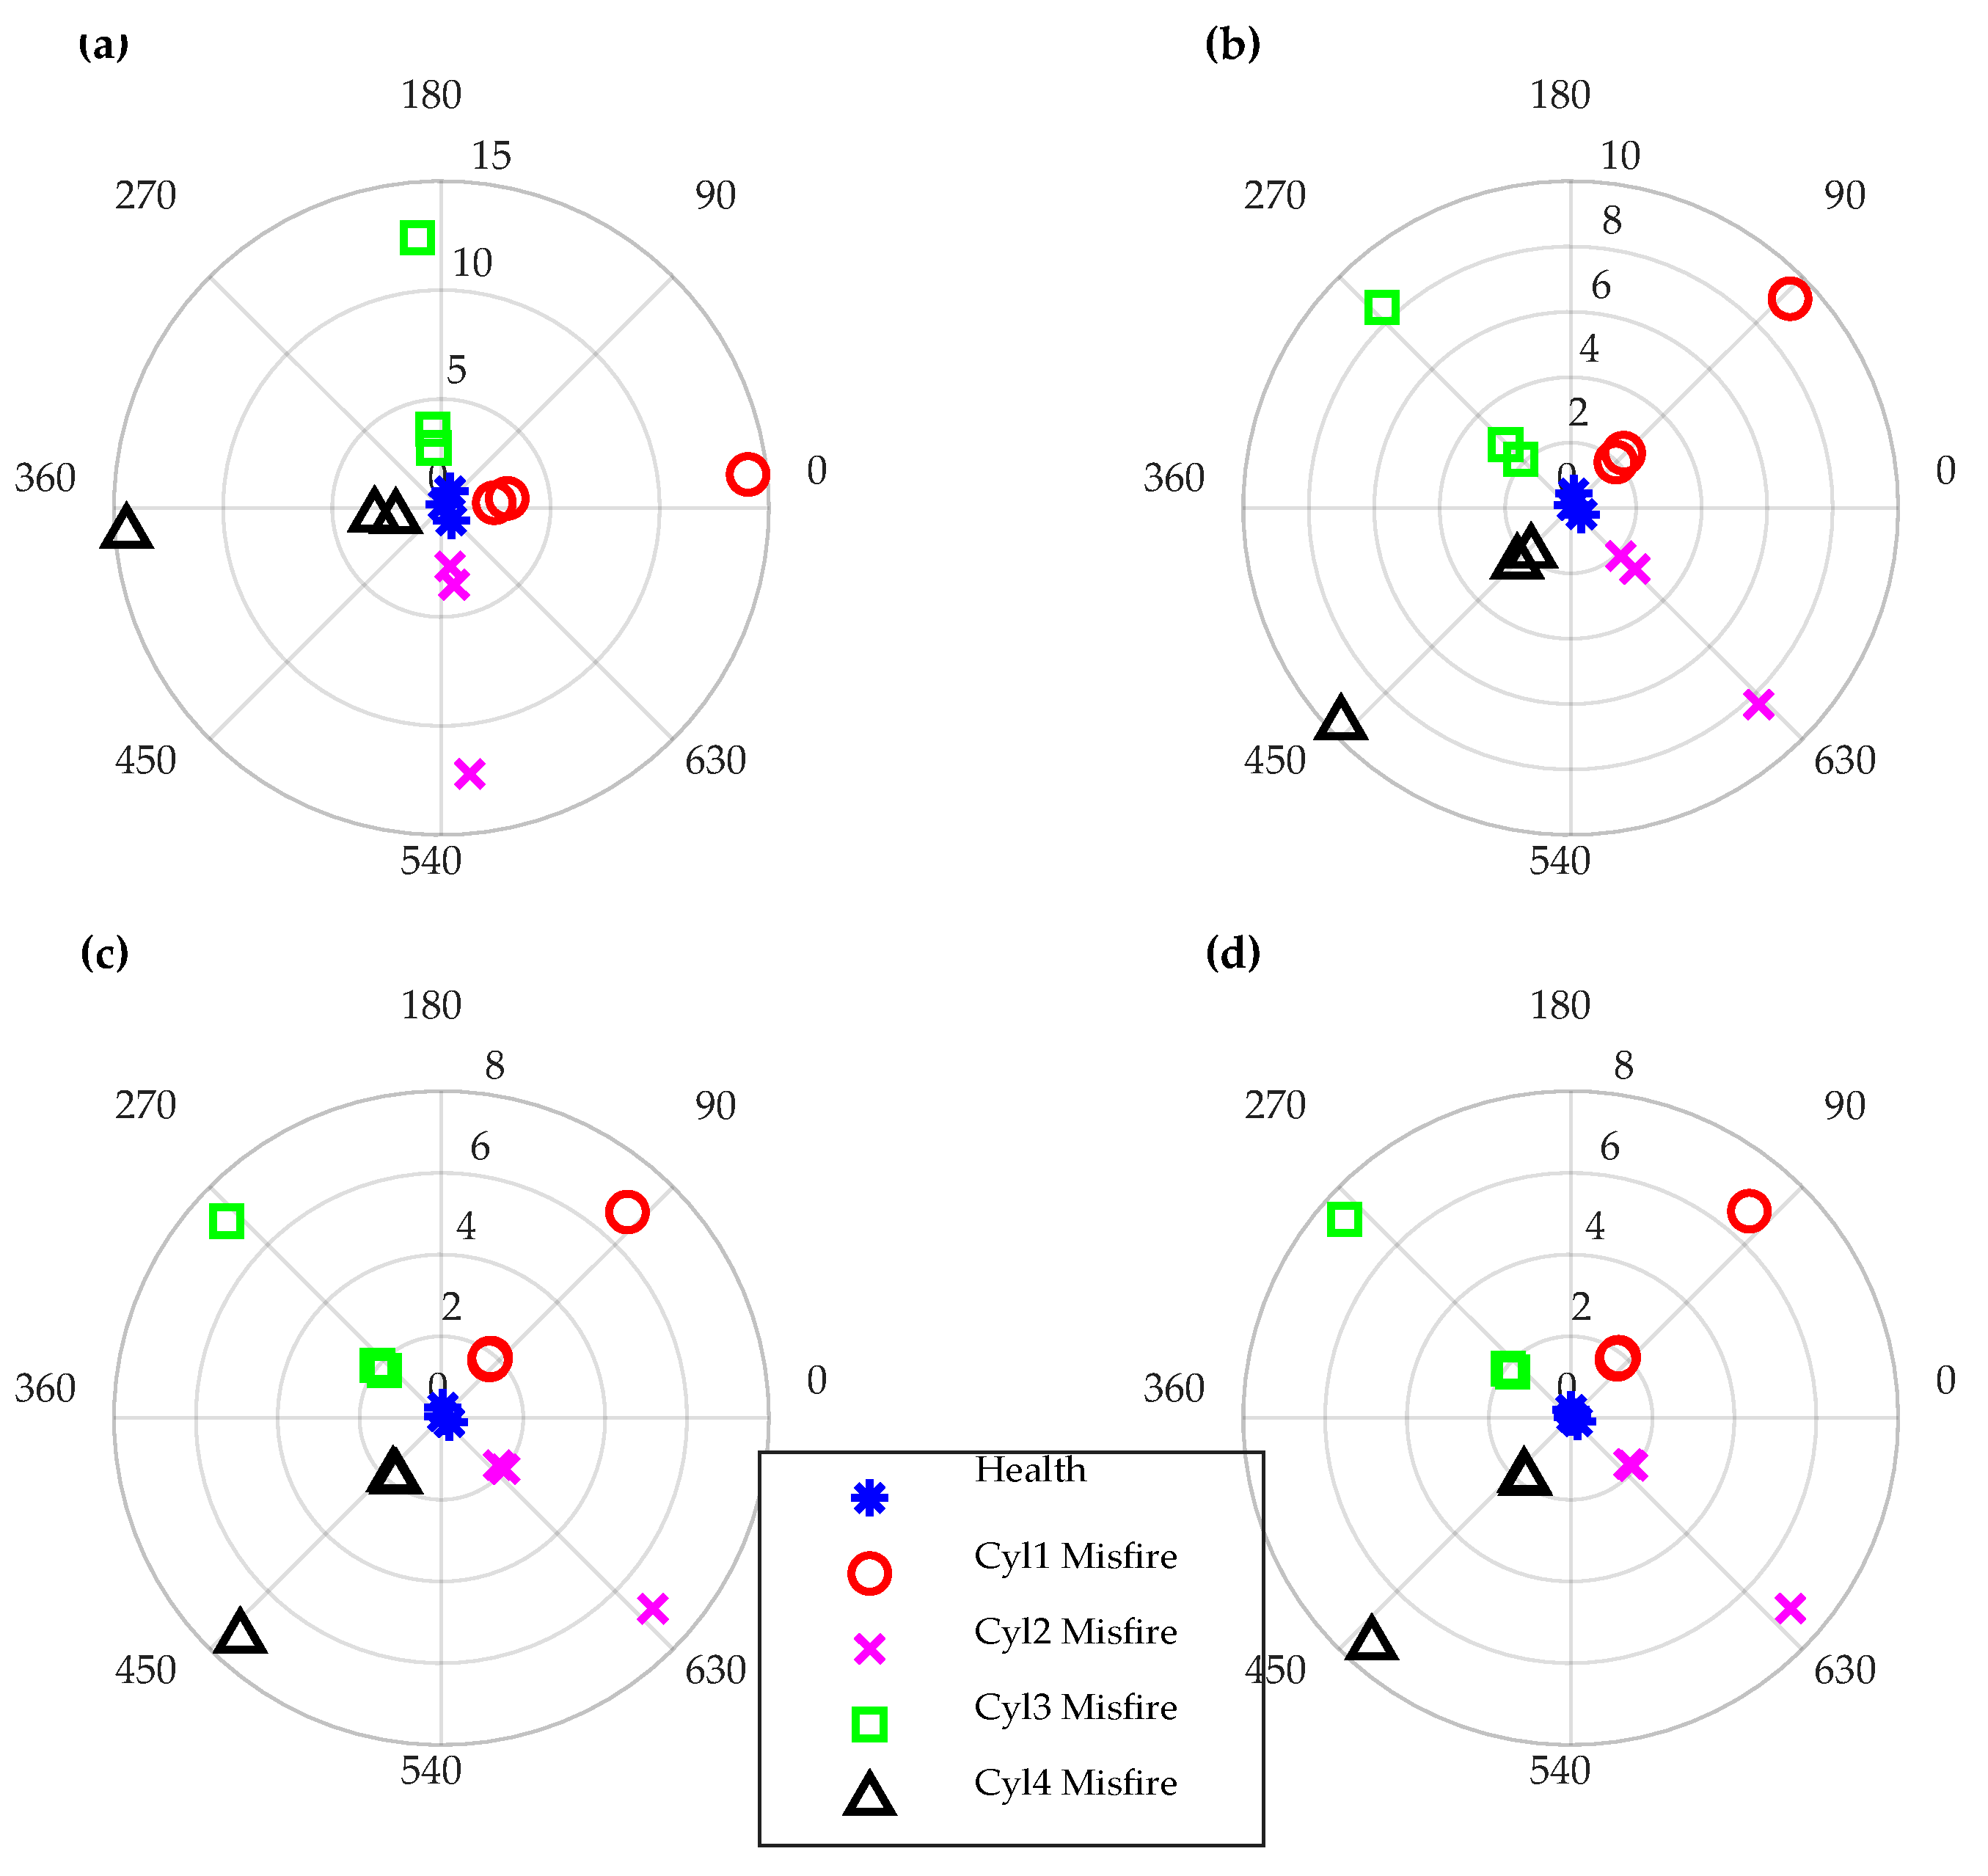
A polar plotting method is introduced to illustrate the diagnostic results based on the fault indicator and the phase information of the half order harmonic. As shown in the Figure 14, the amplitude of the polar plotting is the proposed fault indicator and the angles in an engine working cycle are calculated from the phase of the half order harmonic. The angle of the misfire faults in the engine cycle increases correspondingly to the firing angle, which gives a vivid demonstration of the proposed diagnosis method. The introduced polar graphic makes the misfire fault diagnosis straightforward and efficient. The engine cycle is two revolutions of the crankshaft and the polar representation in a cycle is equivalent to the working cycle of the engine. It can be divided into four zones according to the firing order of the four cylinders. Each zone corresponds to the firing cylinder so that the polar plotting can easily denote the faulty cylinders.
The results in the Figure 14, Figure 15 and Figure 16 show the polar representation of the fault features at the engine working conditions of 1000, 1300 and 1600 rpm respectively. With healthy conditions, the combustion in four cylinders is nearly uniform. Therefore, the misfire indicator is tiny, and the phase of the half order harmonic comes from the noise, which leads to the features randomly distributing around the zero with an extremely small radius. If the engine is working with a light load (typically at idle speed), the poor combustion results in the abnormal oscillation. It is can be seen that the fault features at medium and high loads are located in the middle of the cylinder zone, whilst the indicators at light loads are near the edge of the cylinder zone but still in the right area. The effectiveness and efficiency of the proposed approach for detecting and diagnosing the misfire faults are demonstrated in these results. The best identification results are achieved by the IAS obtained at the location of coupling, which has the greatest indication ratio in various ranges of working speeds and loads. In addition, the higher the engine speeds, the greater the misfire ratios.
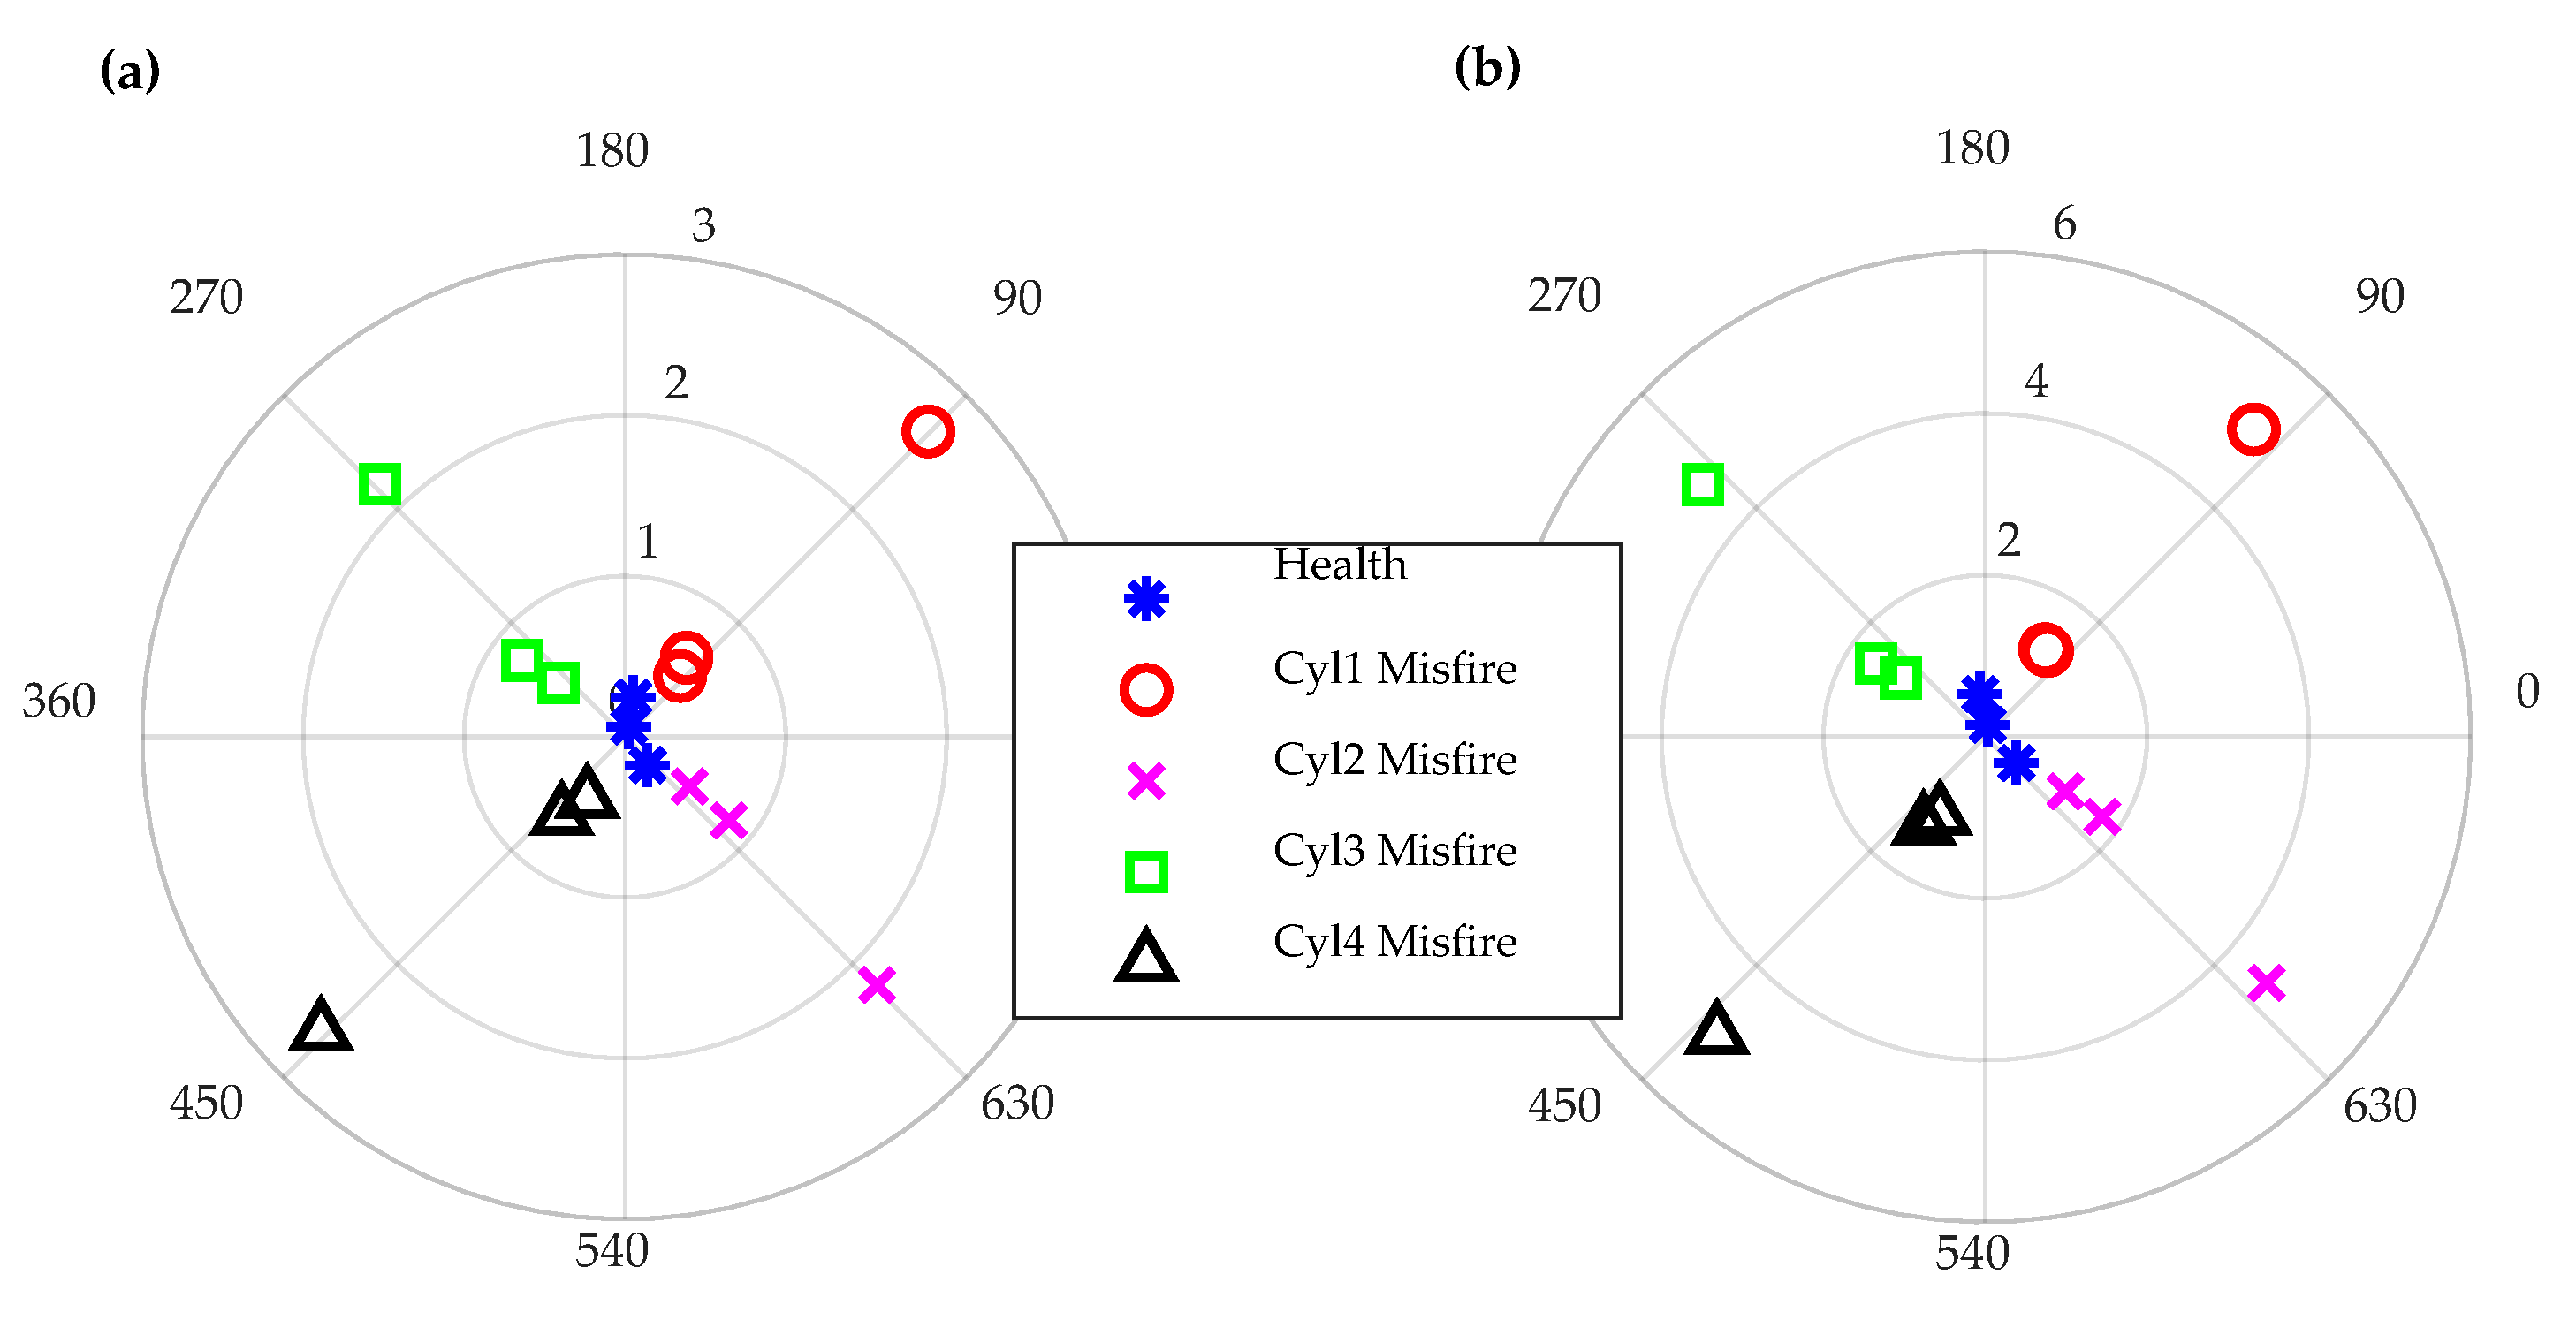
The dynamic IAS responses around the natural frequencies are considered to be negative for fault detection and diagnosis. To examine the performance of the proposed method, the engine powertrain was run around the critical speed (about 1800 rpm) at zero load and 105 Nm. For safety issues, the experiments at high loads were not carried out. The simulation results based on the in-cylinder pressure are shown in Figure 17, and the proposed misfire indicator—especially at the position of the coupling—is accurate.
Based on the findings in the model based studies, the polar representation, which is the meaningful combination of the misfire indicator and the initial phase of half order harmonic, is robust and effective at detecting and diagnosing misfire faults in reciprocating engines. The measurements of IAS at the pulley are an optimum position for achieving the most effective diagnoses of the misfire faults.

5. Experimental Verification

Based on the simulation studies, the performance of the proposed method is excellent in misfire fault detection and diagnosis. To further verify the approach, the experimental IAS at two speeds (1200 and 1800 rpm) and two loads (0 and 105 Nm) are used to examine the effectiveness and efficiency of the proposed fault indicator. The misfire faults were achieved by cutting the fuel supply into the cylinder from the fuel pump. The fuel supply of the target cylinder from the pump was guided into the fuel tank by the pipeline. The polar representations in Figure 18 and Figure 19 verify the accuracy and robustness of the misfire fault indicators.

6. Conclusions

This paper focused on the investigation of the most effective IAS deployment for misfire fault detection and diagnosis. To fulfil the research aim, an accurate powertrain model was developed and improved by the Fourier series based torque fitting. This improvement can increase the computational efficiency and allows the flexible configuration of the model. Based on the accurately developed torsional model, an effective misfire indicator and a novel polar representation were developed to display the IAS based misfire fault diagnosis. In this research, the diagnosis performance of IAS measurements was achieved by the speed variation at the coupling of the powertrain system. The simulation studies show that the misfire indicator from the IAS at the coupling is more than two times higher than the other measurements. Furthermore, the merit of IAS at the coupling becomes more pronounced (for instance, six times higher at 1800 rpm and 315 Nm) with the increase of speed and load, which can be further verified by the experimental results. Both simulation and experimental studies show that the single point measurements at the coupling not only give an outstanding detection result but also locate the faulty cylinder accurately in a wide range of working conditions. In addition, the proposed method can be further investigated for diagnosing the engine faults at an early stage. For instance, incomplete combustion, cylinder imbalance and improper valve timing can also lead to the variation of IAS, which can be potentially detected and diagnosed based on the developed approach. This study can pave the way to the development of the effective and cost-effective approaches for monitoring the working conditions of the large powertrains.

Author Contributions

Conceptualization, F.G. and A.D.B.; methodology, Y.X. and Y.Y.; validation, Y.X.; investigation, Y.X. and F.G.; writing—original draft preparation, Y.X.; writing—review and editing, B.H., F.G. and R.C.; funding acquisition, B.H. All authors have read and agreed to the published version of the manuscript.

Funding

The research was funded by the National Natural Science Foundation of Guangdong, China, grant number 2017A030313291, and the Tribology Science Fund of State Laboratory of Tribology, grant number SKLTKF18A05.

Acknowledgments

The authors would like to acknowledge the support from the Chinese Scholarship Council and the University of Huddersfield. The authors also appreciate the support of the technicians in the automotive laboratory.

Conflicts of Interest

The authors declare no conflict of interest.

References

  1. Sharma, A.; Sugumaran, V.; Babu Devasenapati, S. Misfire detection in an IC engine using vibration signal and decision tree algorithms. Measurement 2014, 50, 370–380. [Google Scholar] [CrossRef]
  2. Tao, J.; Qin, C.; Li, W.; Liu, C. Intelligent Fault Diagnosis of Diesel Engines via Extreme Gradient Boosting and High-Accuracy Time–Frequency Information of Vibration Signals. Sensors 2019, 19, 3280. [Google Scholar] [CrossRef] [PubMed] [Green Version]
  3. Lin, T.R.; Tan, A.C.; Ma, L.; Mathew, J. Condition monitoring and fault diagnosis of diesel engines using instantaneous angular speed analysis. Proc. Inst. Mech. Eng. Part C J. Mech. Eng. Sci. 2015, 229, 304–315. [Google Scholar] [CrossRef] [Green Version]
  4. Charchalis, A.; Dereszewski, M.; Charchalis, A.; Dereszewski, M. Processing of Instantaneous Angular Speed Signal for Detection of a Diesel Engine Failure. Math. Probl. Eng. 2013, 2013, e659243. [Google Scholar] [CrossRef]
  5. Xie, J.; Chen, J.; Peng, Y.; Zi, Y. A New Concept of Instantaneous Whirling Speed for Cracked Rotor’s Axis Orbit. Appl. Sci. 2019, 9, 4120. [Google Scholar] [CrossRef] [Green Version]
  6. Li, Y.; Gu, F.; Harris, G.; Ball, A.; Bennett, N.; Travis, K. The Measurement of Instantaneous Angular Speed. Mech. Syst. Signal Process. 2005, 19, 786–805. [Google Scholar] [CrossRef]
  7. Remond, D. Practical performances of high-speed measurement of gear transmission error or torsional vibrations with optical encoders. Meas. Sci. Technol. 1998, 9, 347. [Google Scholar] [CrossRef]
  8. Gu, F.; Yesilyurt, I.; Li, Y.; Harris, G.; Ball, A. An Investigation of the Effects of Measurement Noise in the Use of Instantaneous Angular Speed for Machine Diagnosis. Mech. Syst. Signal Process. 2006, 20, 1444–1460. [Google Scholar] [CrossRef]
  9. Jung, D.; Frisk, E.; Krysander, M. A flywheel error compensation algorithm for engine misfire detection. Control Eng. Pract. 2016, 47, 37–47. [Google Scholar] [CrossRef]
  10. Diamond, D.H.; Heyns, P.S.; Oberholster, A.J. Online shaft encoder geometry compensation for arbitrary shaft speed profiles using Bayesian regression. Mech. Syst. Signal Process. 2016, 81, 402–418. [Google Scholar] [CrossRef] [Green Version]
  11. Gubran, A.A.; Sinha, J.K. Shaft Instantaneous Angular Speed for Blade Vibration in Rotating Machine. Mech. Syst. Signal Process. 2014, 44, 47–59. [Google Scholar] [CrossRef]
  12. Gu, F.; Jacob, P.J.; Ball, A.D. Non-parametric models in the monitoring of engine performance and condition: Part 2: Non-intrusive estimation of diesel engine cylinder pressure and its use in fault detection. Proc. Inst. Mech. Eng. Part D J. Automob. Eng. 1999, 213, 135–143. [Google Scholar] [CrossRef] [Green Version]
  13. Chen, J.; Bond Randall, R. Improved automated diagnosis of misfire in internal combustion engines based on simulation models. Mech. Syst. Signal Process. 2015, 64–65, 58–83. [Google Scholar] [CrossRef] [Green Version]
  14. Feldman, M.; Seibold, S. Damage Diagnosis of Rotors: Application of Hilbert Transform and Multihypothesis Testing. J. Vib. Control 1999, 5, 421–442. [Google Scholar] [CrossRef] [Green Version]
  15. Charles, P.; Sinha, J.K.; Gu, F.; Lidstone, L.; Ball, A.D. Detecting the Crankshaft Torsional Vibration of Diesel Engines for Combustion Related Diagnosis. J. Sound Vib. 2009, 321, 1171–1185. [Google Scholar] [CrossRef]
  16. Eriksson, D.; Eriksson, L.; Frisk, E.; Krysander, M. Flywheel angular velocity model for misfire and driveline disturbance simulation. IFAC Proc. Vol. 2013, 46, 570–575. [Google Scholar] [CrossRef]
  17. Boysal, A.; Rahnejat, H. Torsional vibration analysis of a multi-body single cylinder internal combustion engine model. Appl. Math. Model. 1997, 21, 481–493. [Google Scholar] [CrossRef]
  18. Mendes, A.S.; Meirelles, P.S.; Zampieri, D.E. Analysis of torsional vibration in internal combustion engines: Modelling and experimental validation. Proc. Inst. Mech. Eng. Part K J. Multi Body Dyn. 2008, 222, 155–178. [Google Scholar] [CrossRef]
  19. Liu, Z.; Wu, K.; Ding, Q.; Gu, J.X. Engine Misfire Diagnosis Based on the Torsional Vibration of the Flexible Coupling in a Diesel Generator Set: Simulation and Experiment. J. Vib. Eng. Technol. 2019. [Google Scholar] [CrossRef]
Figure 1. Layout of the engine test rig: (a) photograph of the test rig; (b) schematic diagram.
Energies 13 00565 g001
Figure 2. Flow chart of instantaneous angular speed (IAS) estimation by the frequency domain method.
Energies 13 00565 g002
Figure 3. Schematic of the torsional model.
Energies 13 00565 g003
Figure 4. Schematic diagram of forces on components of the crank-piston system.
Energies 13 00565 g004
Figure 5. Cylinder pressure signals at health and misfire conditions.
Energies 13 00565 g005
Figure 6. Torques on the crankshaft: (a) first cylinder; (b) four cylinders.
Energies 13 00565 g006
Figure 7. Torque on the crank at health and misfire conditions: (a) fitting results; (b) fitting errors.
Energies 13 00565 g007
Figure 8. IAS values of the pulley, flywheel and coupling: (a) in the angular domain; (b) in the frequency domain.
Energies 13 00565 g008
Figure 9. Simulated and experimental IAS values of the flywheel: (a) in the angular domain; (b) in the frequency domain.
Energies 13 00565 g009
Figure 10. IAS signals in the angular domain at: (a) the pulley; (b) the flywheel; (c) coupling.
Energies 13 00565 g010
Figure 11. Firing order of the diesel engine.
Energies 13 00565 g011
Figure 12. Order spectrum of the IAS signals at: (a) the pulley; (b) the flywheel; (c) coupling.
Energies 13 00565 g012
Figure 13. MSE of the IAS signals in: (a) the angular domain; (b) the frequency domain.
Energies 13 00565 g013
Figure 14. Polar plotting of the fault indicators at 1000 rpm: (a) 0 Nm; (b) 105 Nm; (c) 210 Nm; (d) 315 Nm.
Energies 13 00565 g014
Figure 15. Polar plotting of fault indicators at 1300 rpm: (a) 0 Nm; (b) 105 Nm; (c) 210 Nm; (d) 315 Nm.
Energies 13 00565 g015
Figure 16. Polar plotting of fault indicators at 1600 rpm: (a) 0 Nm; (b) 105 Nm; (c) 210 Nm; (d) 315 Nm.
Energies 13 00565 g016
Figure 17. Polar plotting of the fault indicators at 1800 rpm and: (a) 0 Nm; (b) 105 Nm.
Energies 13 00565 g017
Figure 18. Polar plotting of the fault indicators at 1200 rpm and: (a) 0 Nm; (b) 105 Nm.
Energies 13 00565 g018
Figure 19. Polar plotting of the fault indicators at 1800 rpm and: (a) 0 Nm; (b) 105 Nm.
Energies 13 00565 g019
Table 1. Diesel engine specifications.
Technical ParametersKey Specifications
Engine typeDiesel engine
Number of Cylinders4
Firing order1-3-4-2
Maximum torque425 Nm @ 1300 rpm
Maximum power74.2 kW @ 2200 rpm
Compression ratio18.3:1
Table 2. Equipment on the test rig.
EquipmentModelKey Specifications
Optical switchOPB900W55Z70 ns
Magnetic pickupIME12-02 BPSZ2 kHz
Cylinder pressureKistler 6125A15.8 pC/bar
DAQ deviceYE63234 CH, 750 kHz
Table 3. Test cases.
Test CasesSpeedsLoads
Health condition1000 rpm
1300 rpm
1600 rpm
0 Nm
105 Nm
201 Nm
315 Nm
Cylinder 1 misfire1200 rpm
1800 rpm
0 Nm
105 Nm
Cylinder 1 misfire1200 rpm
1800 rpm
0 Nm
105 Nm
Table 4. Model parameters.
Inertia   ( k g m 2 ) Stiffness   ( 10 6 N m / r a d ) Damping   ( N m / r a d / s )
I 1 = 0.04 k 1 = 0.1 c 1 = 5.37
I 2 = 0.14 k 2 = 0.65 c 2 = 12.35
I 3 = 0.14 k 3 = 0.65 c 3 = 12.35
I 4 = 0.14 k 4 = 0.65 c 4 = 12.35
I 5 = 0.14 k 5 = 1.95 c 5 = 18.94
I 6 = 0.51 k 6 = 0.01 c 6 = 40
I 7 = 0.1 k 7 = 0.02 c 7 = 20
I 8 = 0.2 --
Table 5. Natural frequencies.
Modal OrderNatural Frequency (Hz)
1st25
2nd69.1
3rd275.2
4th511.7
5th1229.1