Article

Investigation of the Noise Induced by Unstable Flow in a Centrifugal Pump

1
Key Laboratory of Fluid and Power Machinery, Ministry of Education, Xihua University, Chengdu 610039, China
2
Department of Energy and Power Engineering, Tsinghua University, Beijing 100084, China
*
Authors to whom correspondence should be addressed.
Energies 2020, 13(3), 589; https://doi.org/10.3390/en13030589
Submission received: 16 December 2019 / Revised: 20 January 2020 / Accepted: 22 January 2020 / Published: 28 January 2020

Abstract

:
In order to investigate the mechanism and the characteristics of the noise induced by unstable flow in a centrifugal pump, the internal flow characteristics in the pump were numerically researched, and the acoustic pressure fluctuations at the pump inlet and outlet were experimentally investigated. Obvious corresponding relationships between the flow instabilities, the cavitation and the noise were established. It was found that the rotating stall, the backflow, the hump, the occurrence of unstable flow and the cavitation in such a centrifugal pump were effectively detected through the noise, which could help to provide fundamental information on flow instabilities and guarantee safe and steady operating conditions for the system. The recirculation and prewhirl regions in the pump upstream pipe, which were caused by the backflow and the rotation of the impeller, presented the circumferential movement with a spiral shape, causing apparent broadband fluctuations at low frequency band of the acoustic pressure. The backflow and rotating stall could also result in broadband fluctuations of the pump outlet noise, which was distributed from 100 Hz to 150 Hz. Meanwhile, the broadband fluctuations of the pump outlet acoustic pressure distributed in the low frequency range, which was produced by the occurrence of cavitation, moved to the lower frequency band as the flow rate increased. The enhanced broadband fluctuations of the pump inlet and outlet noise distributed from 1 kHz to 6 kHz were caused by the coupling between the cavitation-induced noise and the system-produced noise. The broadband fluctuations of the pump inlet noise distributed between 6 kHz and 9 kHz were regarded as the typical frequency band of cavitation in the centrifugal pump.

1. Introduction

Centrifugal pumps are widely applied in a variety of fields, such as industrial plants, agricultural irrigation, the petroleum and chemical industries, aeronautics and astronautics [1,2,3]. Due to the current energy crisis and restrictions on environmental noise levels, centrifugal pumps that operate with low noise, high efficiency, high rotating speed and high reliability have become increasingly important. The unstable flow in centrifugal pumps not only results in pressure fluctuations at both the inlet and outlet [4,5] but also accounts for the generation of noise [6,7]. The noise induced by unstable flow and cavitation are mainly caused by inducers and turbopumps, which have rather high rotation speeds [8,9]. Some attention is also paid to the numerical study of the noise induced by flow in centrifugal pumps, which presents the acoustic properties of the flows [10,11,12]. The hydraulic noise caused by diffuser pumps and volute is theoretically investigated by Clark, who finds that although the noise generated by the pump casing is weak, the blade wake and blade circulation are of prime significance in determining the noise level of pumps [13]. In fact, to obtain the characteristics of noise associated with flow instabilities, one effective method is to conduct the experiment in centrifugal pumps. Choi and Mongeau’s investigations [6,14] present a strong corresponding relationship between the radiated noise and the unsteady pressure fluctuations on the impeller surface produced by flow. Meanwhile, in Chu, Dong, Wang and Si’s work [15,16,17,18,19], the noise caused by flow appears to be mainly produced by the rotor–stator interaction, which results from the pressure pulse when impeller blades pass by the tongue. An experimental method is proposed by Rzentkowski to examine the acoustic characteristics at the blade-passing frequency for a heat transport pump, which reveals that the source variables demonstrate a jump in the acoustic field and are almost free of resonance effects in the test system [20]. In Guo’s research [21], a noise measurement system is established to investigate the noise characteristics radiated by a centrifugal pump under various working conditions. It is found that the acoustic energy distribution has been impacted little by the variation in working conditions. The total acoustic energy fluctuates around 0.410 and 0.160 corresponding to the ratio of the acoustic energy in the direction facing the tongue and against the tongue, respectively, under various working conditions. Meanwhile, the noise induced by flow in the volute of centrifugal pump is researched in Yuan’s work [22]. The result shows that the acoustic source distributes at cutwater of the volute, which has a strong relationship with the pressure fluctuation. In addition, the noise amplitude outside a centrifugal pump is measured by Ye [23] under a variety of flow-rate conditions. It is found that amplitude of the noise increases to the maximum at the highest efficiency point. An acoustic model is proposed by Parrondo [24] to investigate the internal low-frequency sound field in centrifugal pumps. In order to improve the accuracy of the liquid loading noise measurement in pumps, the four-terminal network model was selected as the noise-measuring model in Si’s research [25]. At the same time, the two-port source testing method is also applied by Lu and Sun to extract the sound source characteristics of a centrifugal pump and valves under a variety of conditions [26,27]. Actually, the changes of flow rate and the occurrence of cavitation can lead to internal unstable flow in centrifugal pumps, resulting in noise generation [28,29]. Extremely complicated unstable flows, which include the rotating stall, backflow and viscous wake, can be found when the pump operates under partial load conditions [30,31]. Research on the noise caused by unstable flow can not only monitor the centrifugal pump to ensure a normal operation but also reduce the harm to the industrial environment and people’s daily life.
Based on the references above, past investigations have mainly focused on the noise produced by the interaction between the rotating blades and the volute tongue. However, few published papers clarify the generation of broadband noise and the identification of various kinds of flow instabilities by noise. Therefore, it is of utmost significance to investigate the noise induced by unstable flow to determine the mechanism of noise generation and accurately obtain safe and high-efficiency operating conditions for centrifugal pumps.
In the present study, the acoustic pressure fluctuations at the pump inlet and outlet are experimentally investigated, and the flow instabilities in the pump are researched. An obvious relationship between the flow instabilities, the cavitation, and the noise signals has been established to research the mechanism and the characteristics of the noise induced by unstable flow in the pump.

2. Experimental Facility and Numerical Method

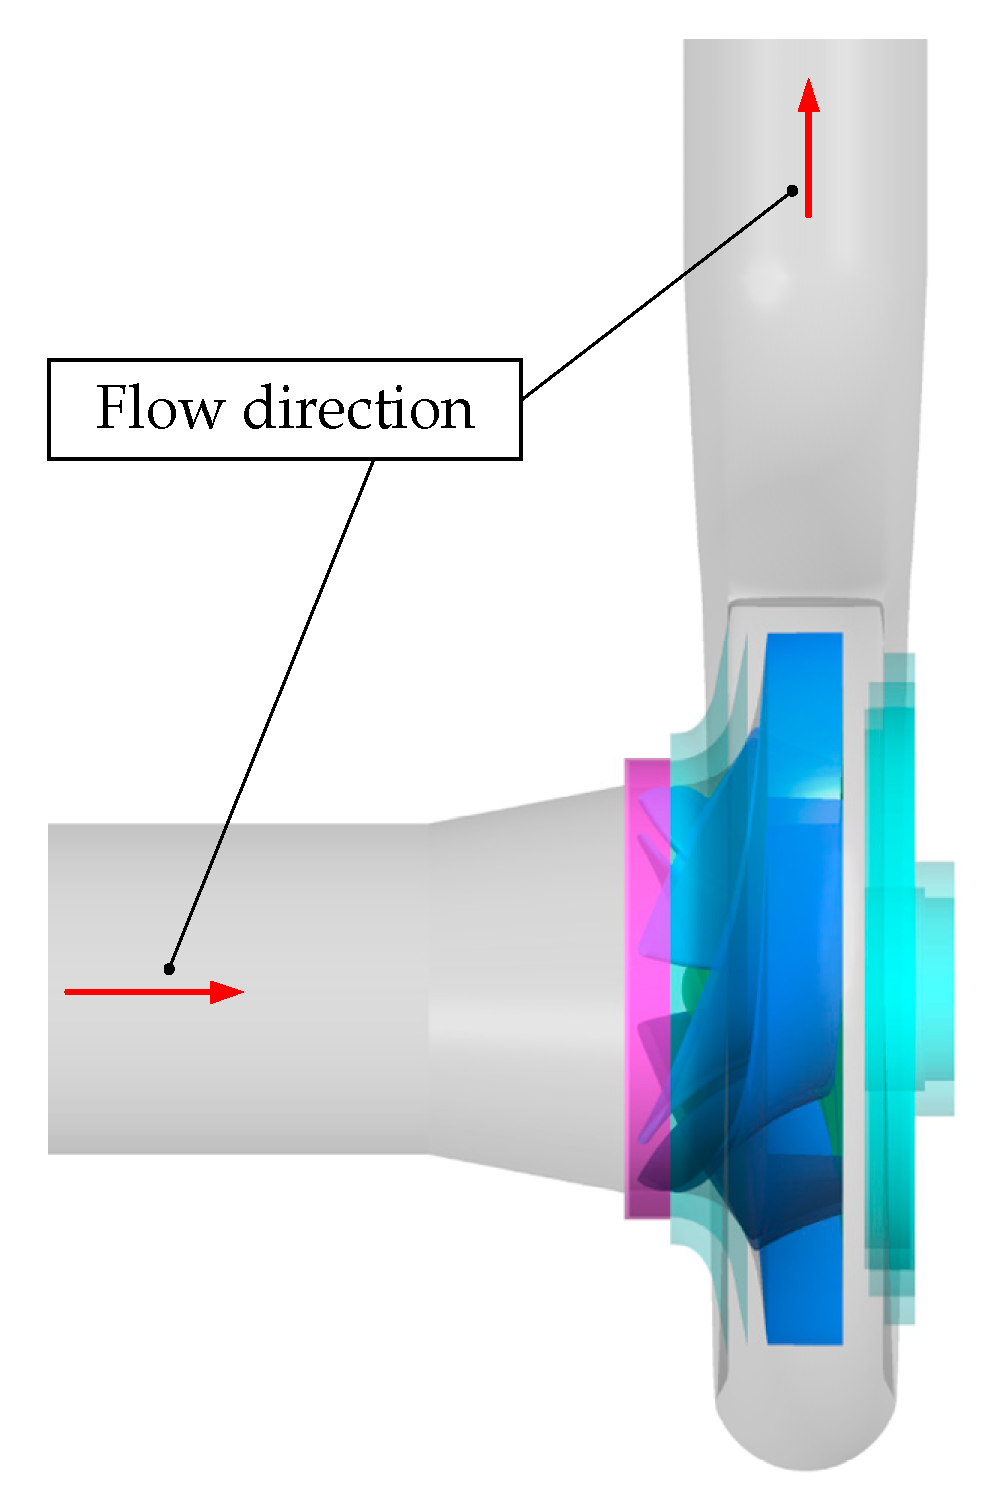
2.1. Experimental Facility

A closed hydraulic test rig was built to conduct the experiment, and a schematic drawing is shown in Figure 1. The stereogram of the experimental set-ups is shown in Figure 2. The primary parameters of the testing centrifugal pump are listed in Table 1. Water with a temperature of 25 centigrade was used as the test fluid. With the variation of the flow rate, the pressure and velocity fields changed substantially in the pump, which led to the radiation of noise. Therefore, the noise produced by the unstable flow can be applied to detect the flow state in the pump. However, because the noise produced upstream is transmitted with the movement of fluid, the noise tested downstream can be affected by the transmission of the upstream acoustics. To solve the problem, the four-terminal network model (dual ports model) was selected as the noise-measuring model to measure the liquid loading noise in the pump. The introduction and detail of the four-terminal network model could be found in Sun’s investigation [27]. Two hydrophones were installed in both the upstream and downstream pipes of the pump.
In the present experiments, the installed positions of the hydrophones are illustrated in Figure 3. The type 8103 hydrophones were made by the B&K Company. The advantages of this type of hydrophone includes its small size, high sensitivity and wide measuring range. The measurable range of this type of hydrophone was from 0.1 Hz to 180 kHz, and the achievable sensitivity was 211 dB/1 VμPa. Cut-off valves were installed between the hydrophones and the testing tubes to aid in fixing and dismantling the hydrophones, as depicted in Figure 3. The sampling frequency of the noise signals was set as 20,000 Hz.

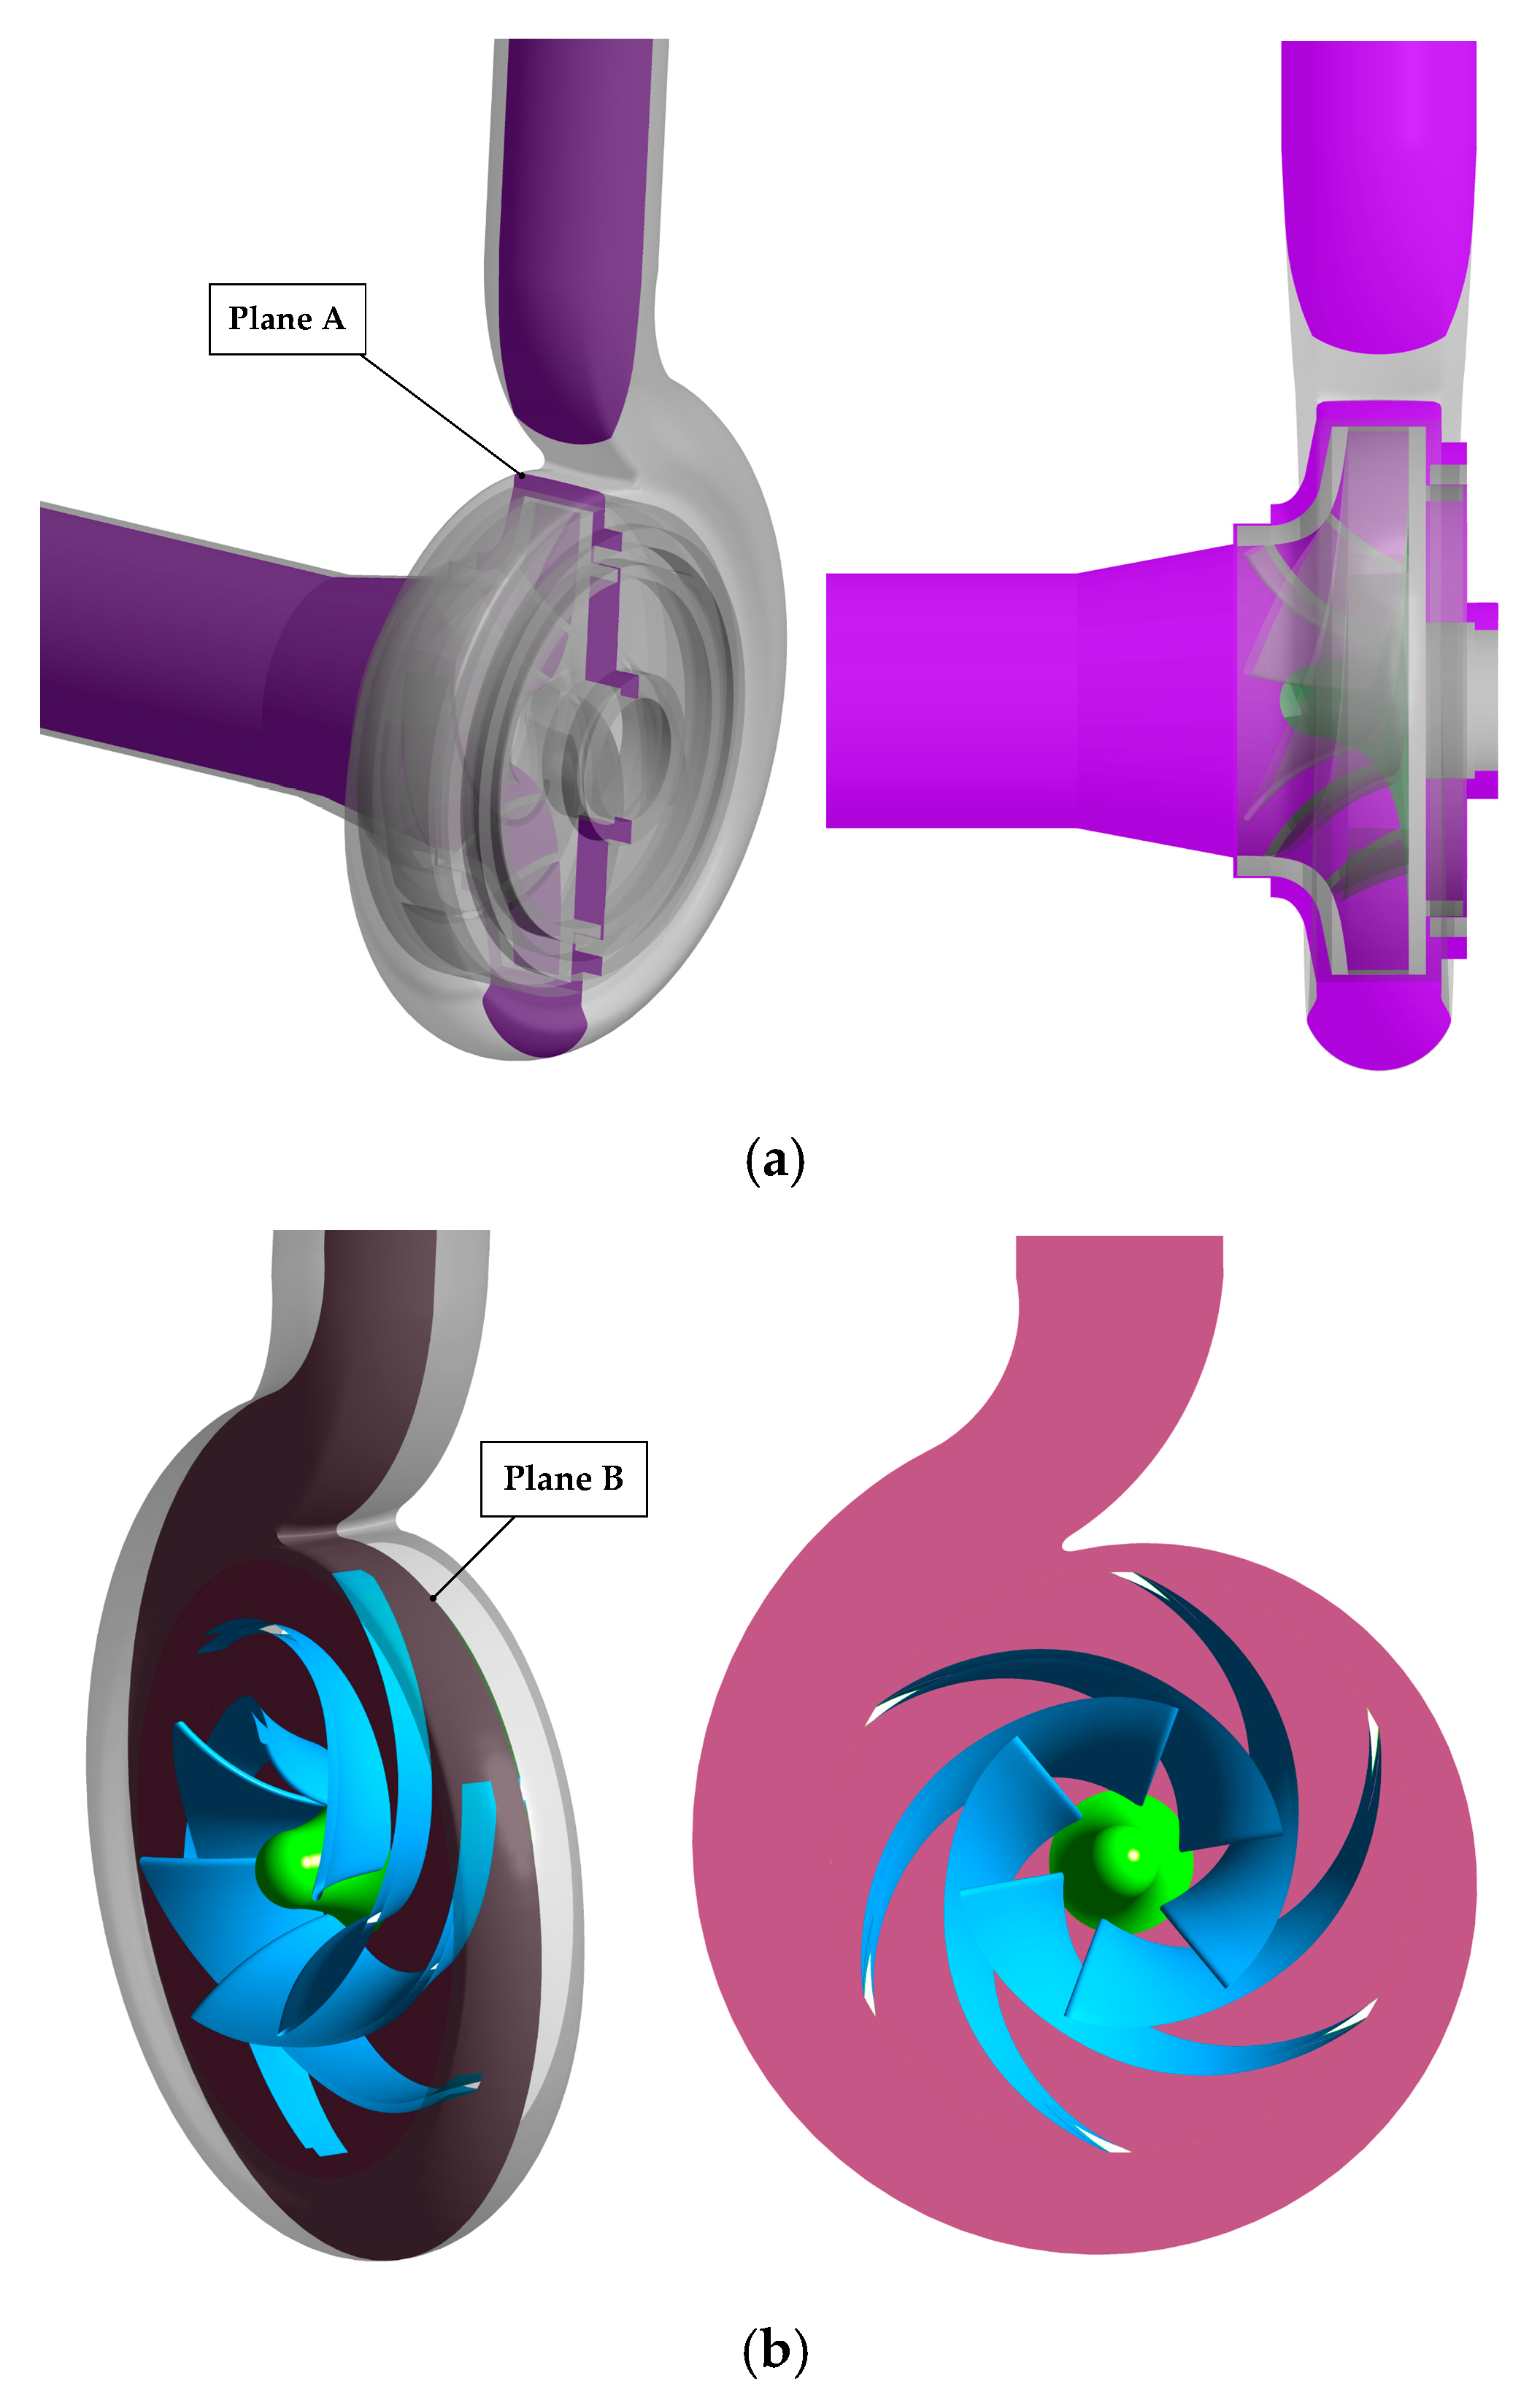
2.2. Numerical Method

The entire flow channels were modeled to guarantee that the computational results would reveal the real flow states in the centrifugal pump. The three-dimensional model, the flow direction and the mesh of the computational domains are illustrated in Figure 4 and Figure 5, respectively. The refined local mesh close to the wall was utilized to improve the accuracy of the numerical simulation.
In the current research, the standard k ε turbulence model was applied to conduct the calculation. The turbulent kinetic energy k and the turbulent dissipation rate ε in the standard k ε turbulence model are defined in Equations (1) and (2), respectively [32].
The governing equation of the turbulent kinetic energy k is defined in Equation (1).
ρ k t + ρ u j k x j = τ i j u i x j ρ ε + x j ( ( μ + μ t σ k ) k x j )
The constraint equation of the turbulent dissipation rate ε is expressed in Equation (2).
ρ ε t + ρ u j ε x j = C ε 1 ε k τ i j u i x j C ε 2 ρ ε 2 k + x j ( ( μ + μ t σ ε ) ε x j )
The boundary conditions at the pump inlet were set as the total pressure, and the mass flow rate was given at the pump outlet. The total pressure and mass flow rate given for the numerical calculation were obtained through the experiment to ensure the same conditions between the numerical simulation and the experimental test. The water temperature was 25 centigrade in the process of the calculation. The grid independence verification, the boundary conditions of the calculation and additional details of the numerical methods were given in previous research [4,5,32]. The flow field in the centrifugal pump was numerically calculated with the commercial ANSYS-CFX 17.0.

3. Results and Discussion

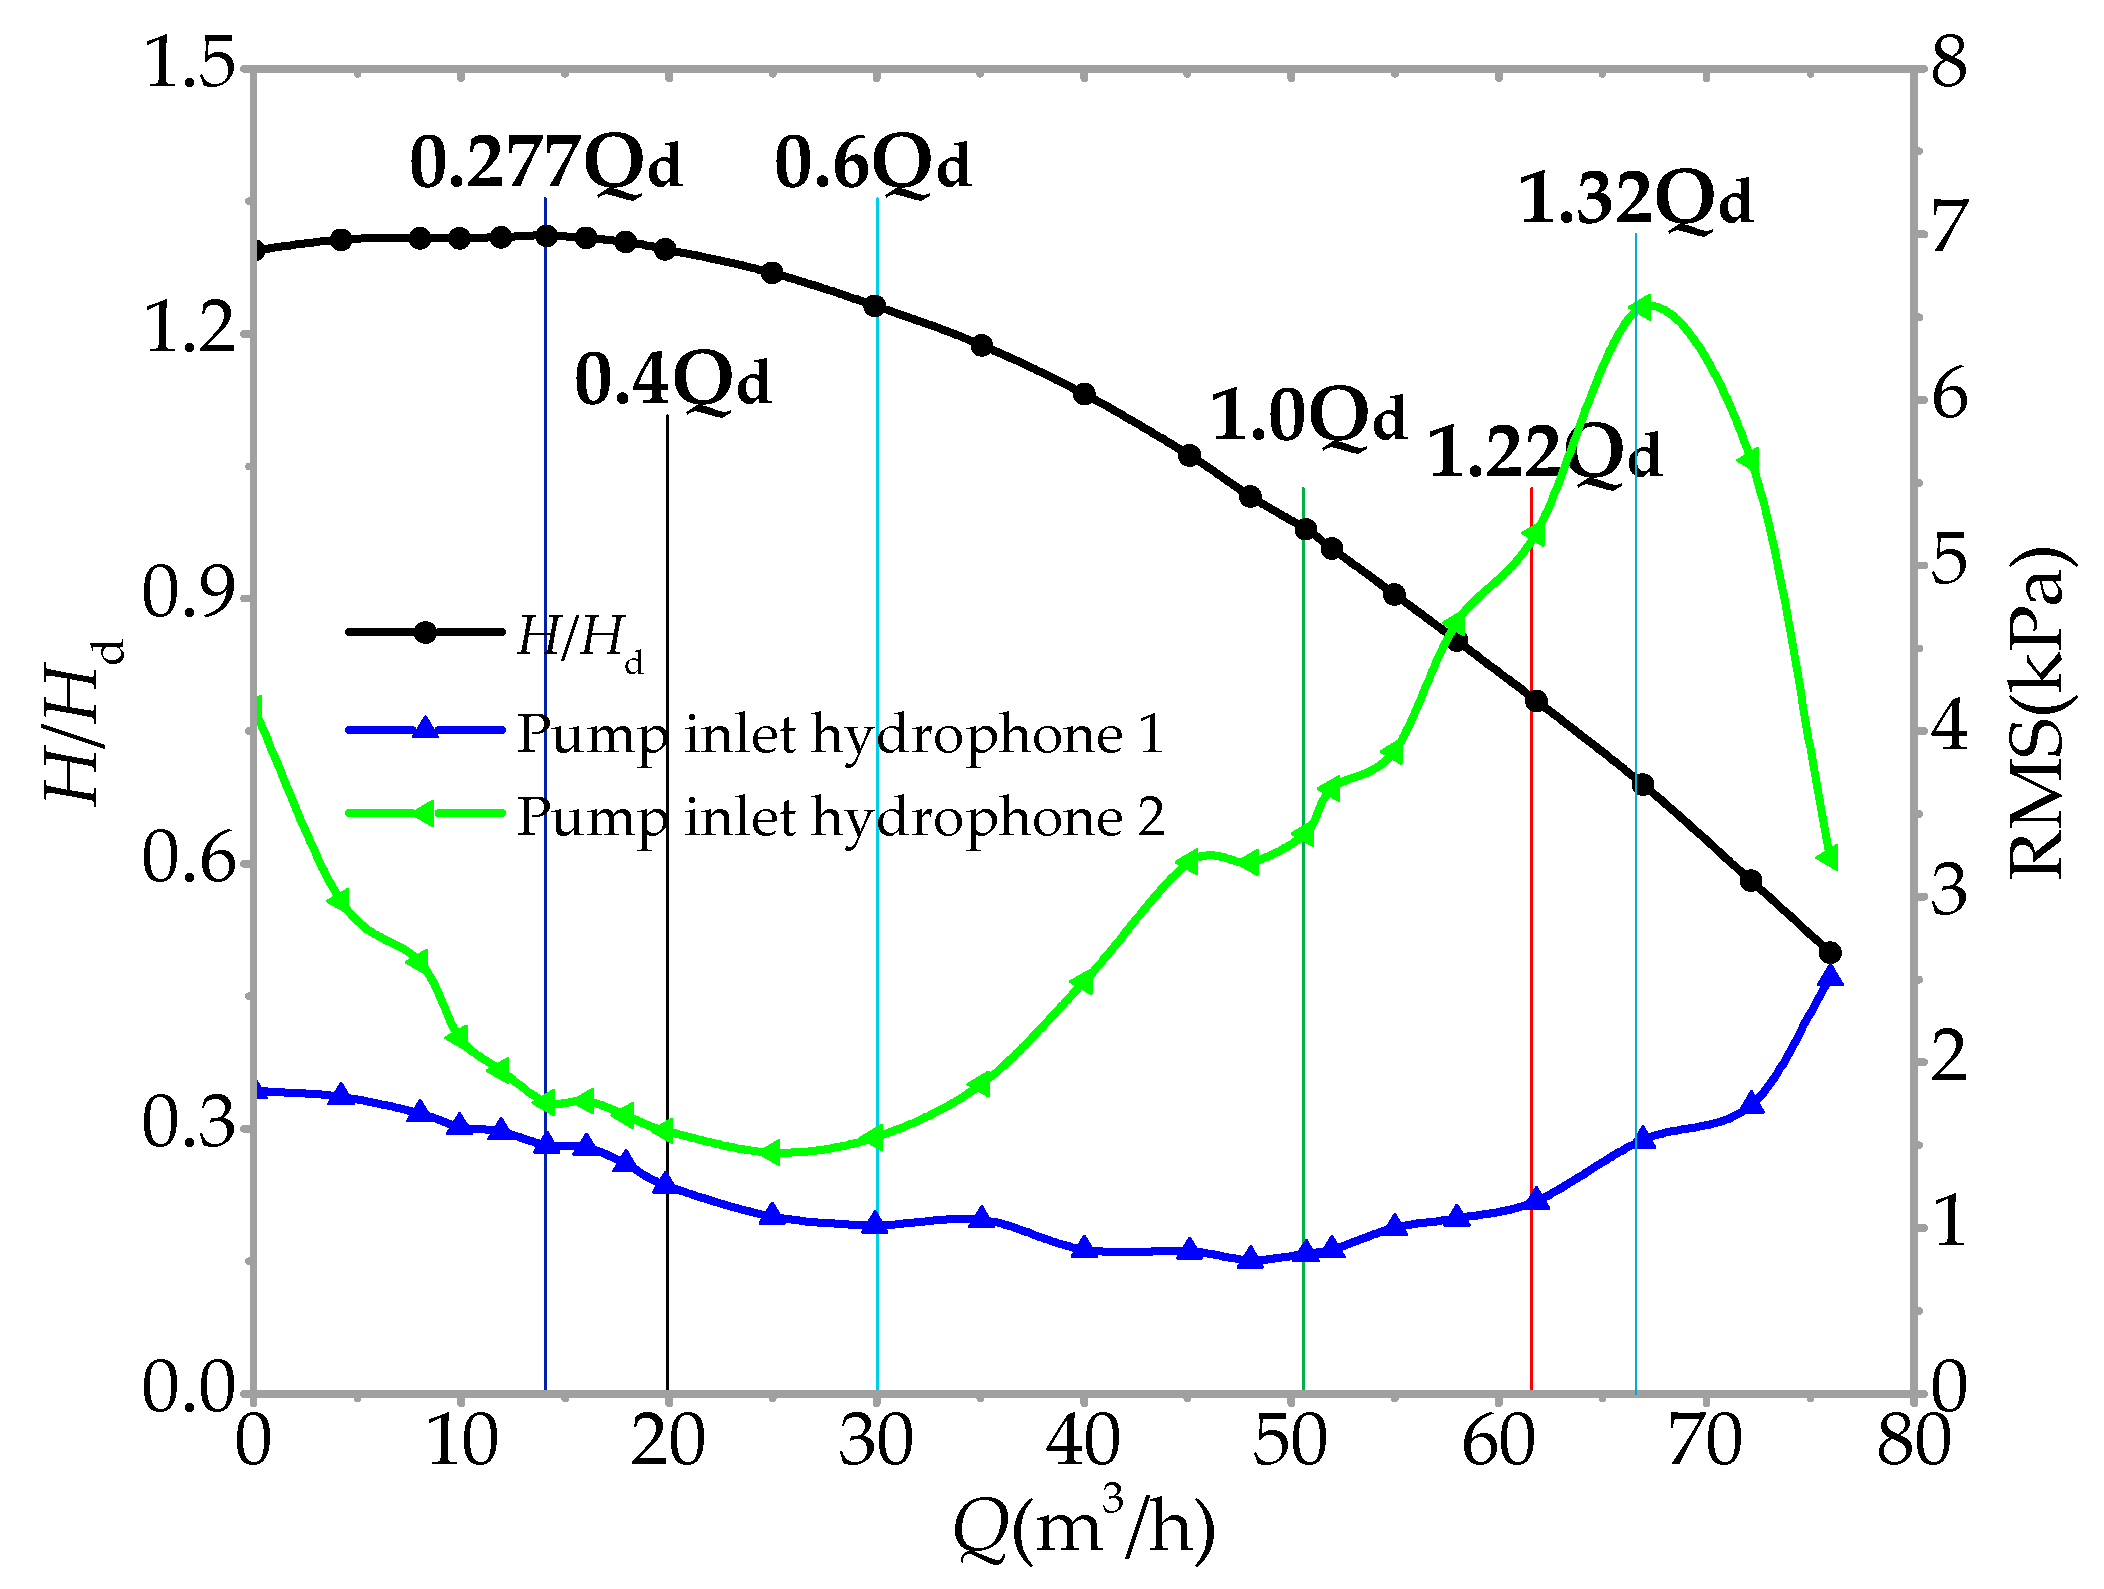
3.1. The Performance of the Pump

The performance curves of the centrifugal pump obtained through the experiments are shown in Figure 6. It was found that the head of the pump reached the maximum value when the flow rate was 0.277 Qd (approximately 14 m3/h), which was the hump point of the pump. The flow rate was lower than that of the condition corresponding to the hump point, which is regarded as the rotating stalling condition [33]. Thus, a rotating stall existed in the pump when the flow rate was lower than 0.277 Qd. It was illustrated that the head of the pump was unstable when it operated under the rotating stalling condition, as depicted in Figure 6. The noise produced by a rotating stall and other types of flow instabilities is discussed below.

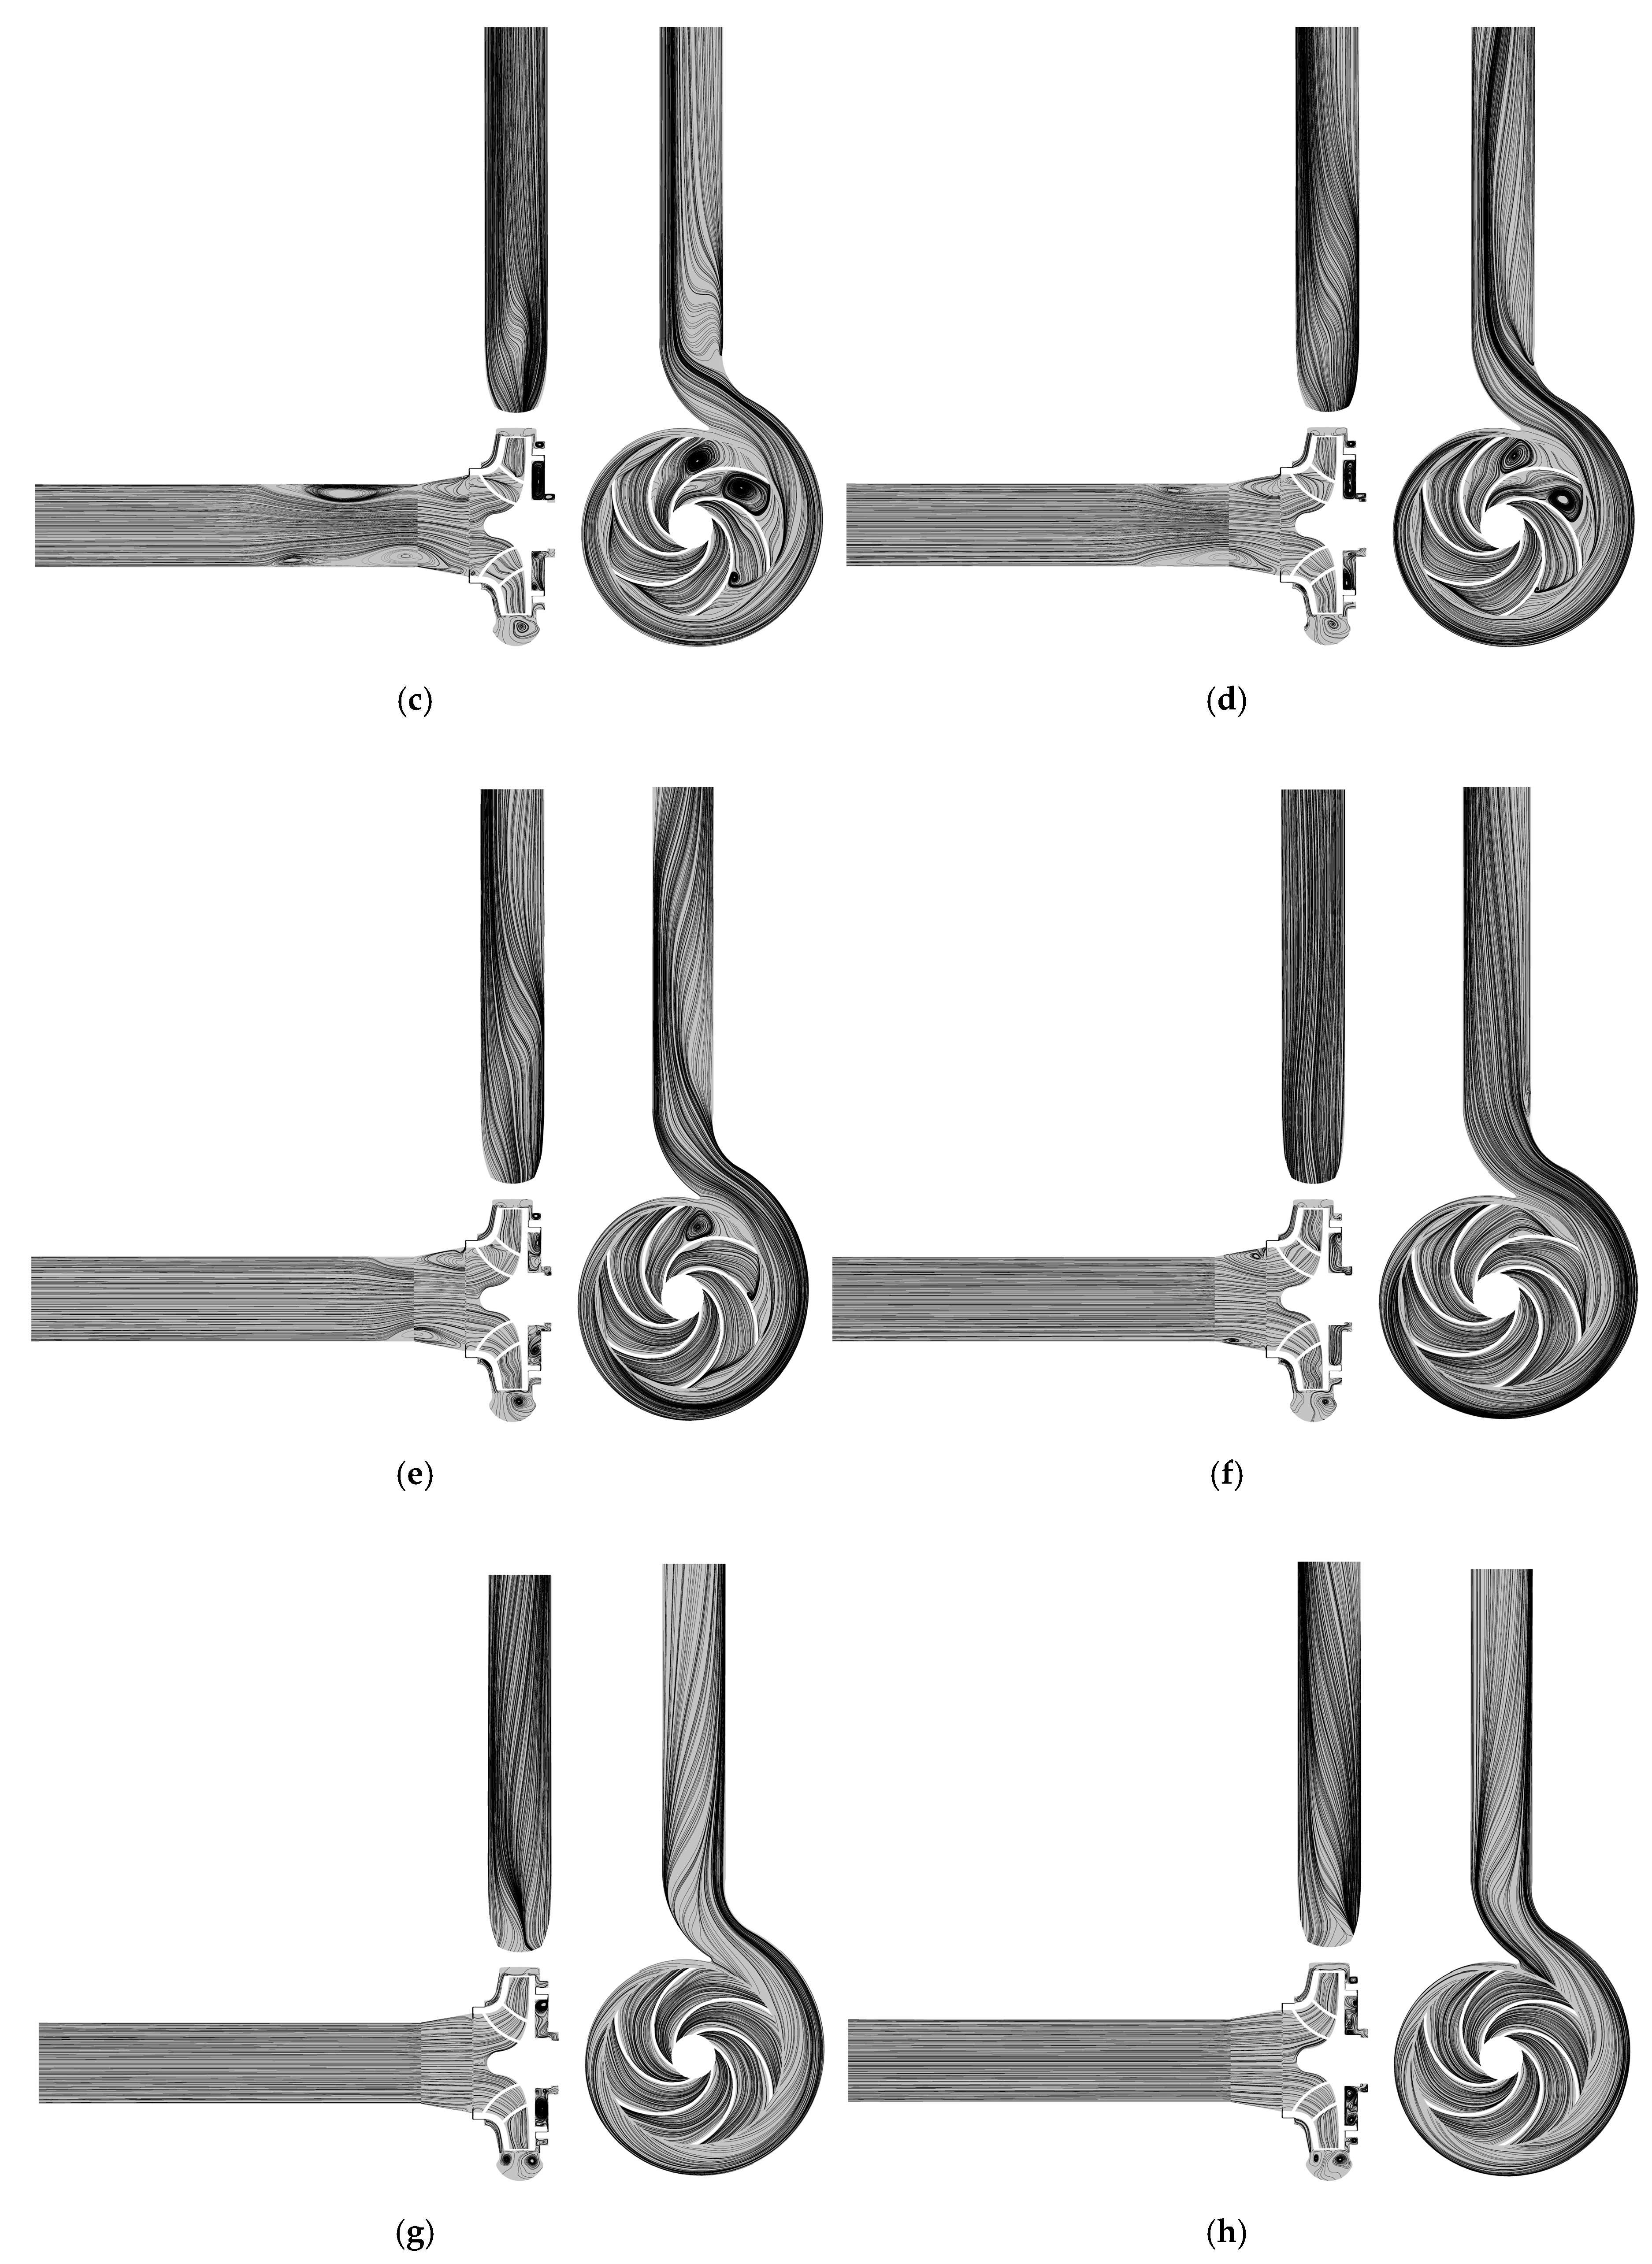
3.2. Numerical Results

The planes A and B, and their locations are shown in Figure 7a,b, respectively. To establish the relationship between the intensification of noise and the aggravation of flow instabilities, the streamlines of water velocity distributed in planes A and B in the centrifugal pump are illustrated in Figure 8. The accuracy of the numerical simulation has been verified in previous investigations [32].
It was obvious that the flow instabilities were aggravated in the centrifugal pump as the flow rate decreased to extremely partial load conditions, as shown in Figure 8. When the flow rate was lower than 0.277 Qd (14 m3/h), corresponding to the hump point, the number of vortices increased, and their intensity was apparently aggravated close to the wall in the pump inlet conduit. Meanwhile, backflow vortices in the pump were found because the flow rate declined to 0.6 Qd (30 m3/h), which was exacerbated as the flow rate decreased. Compared with the flow in the pump inlet pipe, the flow in the pump outlet conduit showed a relatively stable flow state until the flow rate dropped to extremely partial load conditions corresponding to a flow rate lower than 0.2 Qd. It was clear that vortices were generated in the impeller channel close to the volute tongue when the flow rate decreased to 0.4 Qd (20 m3/h) in plane B. The vortex flow in the impeller passages near the tongue became increasingly intensified when the flow rate was lower than 0.277 Qd. In fact, the vortices in the impeller channels rotated with the rotation of the impeller because the rotating stalls occurred when the flow rate was below the hump point. The generation and development of the vortices in the impeller channels could have prevented the upstream liquid from flowing downstream, which was responsible for the unstable dynamic pressure. Li et al. [34] propose that the motion of the vortices in the impeller channels considerably impacts pump hydraulic performance. The occurrence and development of unstable flow, which include backflows, rotating stalls and other types of unstable flow under partial load conditions in the centrifugal pump, could result in the generation and intensification of noise as well. According to the streamline of water velocity, few vortices were found in the inlet and outlet conduits and the impeller when the flow rate was greater than 1.0 Qd. The flow in the pump changed from an unstable flow state to a relatively stable state when the flow rate was greater than 0.6 Qd.
Cavitation was generated in the pump when the flow rate increased to 1.22 Qd; however, the increase of the liquid flow velocity led to a decrease in the local pressure, as demonstrated in Figure 9a. The size of cavitation pockets increased notably as the flow rate increased to 1.32 Qd, as shown in Figure 9b. As depicted in Figure 9, cavitation pockets were found at the pressure side of the blade leading edge on those blades that were rotating toward the volute tongue. The primary reason for this phenomenon was that the attack angle of liquid flow at the blade leading edge was negative under the overload conditions in the centrifugal pump, which led to the cavitation pockets being formed first on the pressure side of the blade leading edge instead of the suction side. The cavitation produced on the pressure side of the blade leading edge was susceptible to the rotating blades and then propagated easily to low pressure areas, which affected the stabilities of the internal flow and the external head of the pump. Thus, the unstable flow and the collapse of cavitation pockets in the pump were sources of noise generation.

3.3. Time Domain of the Noise

Because the intensification of noise was always associated with the aggravation of flow instabilities in the pump, the noise experimentally measured at the pump inlet and outlet is analyzed in the following discussions. The time domains of the acoustic pressure signals measured by pump inlet hydrophone 2 at several typical flow rates are depicted in Figure 10. The abscissa represents the time taken for the impeller to rotate 10 revolutions, and the ordinate is the amplitude of the acoustic pressure. It was shown that the amplitudes and main frequencies of the pump inlet acoustic pressure changed with the variations of the flow rate. The acoustic pressure maintained a relatively stable fluctuation at Qd (Q = 50.6 m3/h), as shown in Figure 10c. Obvious differences were found in the pump inlet acoustic pressure at 0.277 Qd (Q = 14 m3/h) and 1.5 Qd (Q = 76 m3/h) compared with that at Qd (50.6 m3/h), as depicted in Figure 10b and Figure 10f. As discussed in the previous section, the hump of the pump existed when the flow rate was 0.277 Qd (Q = 14 m3/h). Thus, the irregular pulsations of the pump inlet acoustic pressure were produced by the flow instabilities under partial load conditions. At the same time, the irregular fluctuations of the pump inlet acoustic pressure at 1.5 Qd (Q = 76 m3/h) were considered to have mainly been caused by the development of cavitation. This conclusion is further verified in the following discussions.
The time domain of the acoustic pressure tested at pump outlet measuring point 1 under the same conditions mentioned above is shown in Figure 11. Few apparent changes could be found until the flow rate increased 1.5 Qd (76 m3/h) from the time domain of the pump outlet acoustic pressure, as depicted in Figure 11f. The obvious change of the noise signals at 76 m3/h compared with those under other flow rates was considered to be produced by the deterioration of cavitation in this pump.

3.4. Root Mean Square (RMS) of the Noise

To further analyze the noise caused by unstable flow in the centrifugal pump, the RMS was applied to illustrate the characteristics of the acoustic pressure tested under a variety of conditions. As one of the most common statistical methods, the RMS is usually used to process test data in engineering. The expressions of the RMS is shown in Equation (3) as follows:
RMS = 1 N k = 1 N X k 2
where X k is the acoustic pressure at a certain time, and k equals 1, 2, 3, …, N.
The relationships between the head, the RMS values of the noise measured at the pump inlet and outlet, and the changes of flow rate are illustrated in Figure 12 and Figure 13, respectively. It was clear that the RMS of the noise tested at pump inlet measuring point 1 showed a relatively parallel stability and lower values compared with those of pump inlet measuring point 2 in the entire flow rate range, as depicted in Figure 12. Meanwhile, it was noted that the RMS of the noise measured at pump inlet measuring point 1 decreased to almost the minimum value at the rated flow rate (Qd). The slope of the RMS curve of the noise tested at this point showed an almost positively sloping segment when the flow rate was lower than 1.0 Qd and a negatively sloping segment when the flow rate was greater than 1.0 Qd. When the flow rate was greater than approximately 1.22 Qd, the slope of the curve mentioned above increased as the flow rate increased. The primary reason for this phenomenon was that pump inlet noise testing point 1 was relatively far away from the pump, so it was not greatly affected by the unstable flow in the pump. At the same time, the fluid in the pump presented nearly the best flow state at Qd, which resulted in the weakest noise.
By contrast, pump inlet noise measuring point 2 was closer to the pump than point 1, which could make it more susceptible to the unstable flow in the pump. The RMS of the acoustic pressure measured at pump inlet point 2 decreased first and then increased as the flow rate increased from 0 to approximately 1.32 Qd (67 m3/h). Then, the intensity of the noise at this point dropped off dramatically with further increases of the flow rate. The acoustic pressure reached the minimum value and the maximum point at approximately 0.5 Qd (25 m3/h) and 1.32 Qd (67 m3/h), respectively. The explanation for this phenomenon was that the noise was induced by the flow instabilities, which included the backflow and rotating stalls at partial load conditions, and was radiated by the cavitation under the overload conditions in the pump. It was proposed that flow-induced noise radiation is consistent with internal fluid characteristics, as in Mao’s research [35]. Meanwhile, the intensity of the backflow in the pump inlet pipe gradually weakened as the flow rate increased. The intensity of the liquid-loading noise reduced to the minimum point with the gradual disappearance of the backflow when the flow rate increased to the range between 0.5 Qd and 0.6 Qd. Then, the velocity of the liquid increased as the flow rate increased, which caused the intensification of the noise produced by the friction between the wall surface and the fluid. With further increases of the flow rate, the local velocity of the liquid increased notably, which made the local pressure lower than the vaporizing pressure, causing cavitation in the pump. The occurrence of cavitation resulted in the rapid increase of pump inlet noise. Then, the cavitation intensified with further increases of the flow rate, which caused the expansion of cavitation bubbles. The large cavitation bubbles absorbed part of the shock pressure and noise produced by the collapse of vapor bubbles [36], which induced the dramatic drop in the noise.
The noise induced by unsteady flow intensified when the flow instabilities increased. The RMS of the noise measured by pump outlet hydrophones 1 and 2 gradually dropped off first and then increased as the flow rate increased and reached the minimum point when the flow rate was approximately 0.8 Qd (40 m3/h), as shown in Figure 13. A similar changing trend of the noise tested at the two points was found from the RMS curves as the flow rate increased from 0 to 1.0 Qd, indicating that the noise was becoming intensified as a result of the aggravation of the flow instabilities under partial load conditions. The RMS reached the local maximum points when the flow rate increased to approximately 1.03 Qd (52 m3/h) and 1.15 Qd (58 m3/h) at hydrophones 1 and 2, respectively. The intensity of the noise tested at pump outlet measuring point 1 became more severe than that tested at outlet point 2 when the flow rate increased from 0 to approximately 1.1 Qd (55 m3/h). However, the opposite phenomenon was found when the flow rate was greater than 1.15 Qd (58 m3/h). The reason for this phenomenon was that cavitation in the pump was beginning to occur when the flow rate increased from 1.1 Qd to 1.15 Qd. However, the vapor bubbles under these conditions were instable, travelling, and generated on occasion. Meanwhile, noise testing point 1 at the pump outlet was closer to the pump, which made it more sensitive to the noise produced by the collapse of these vapor bubbles.

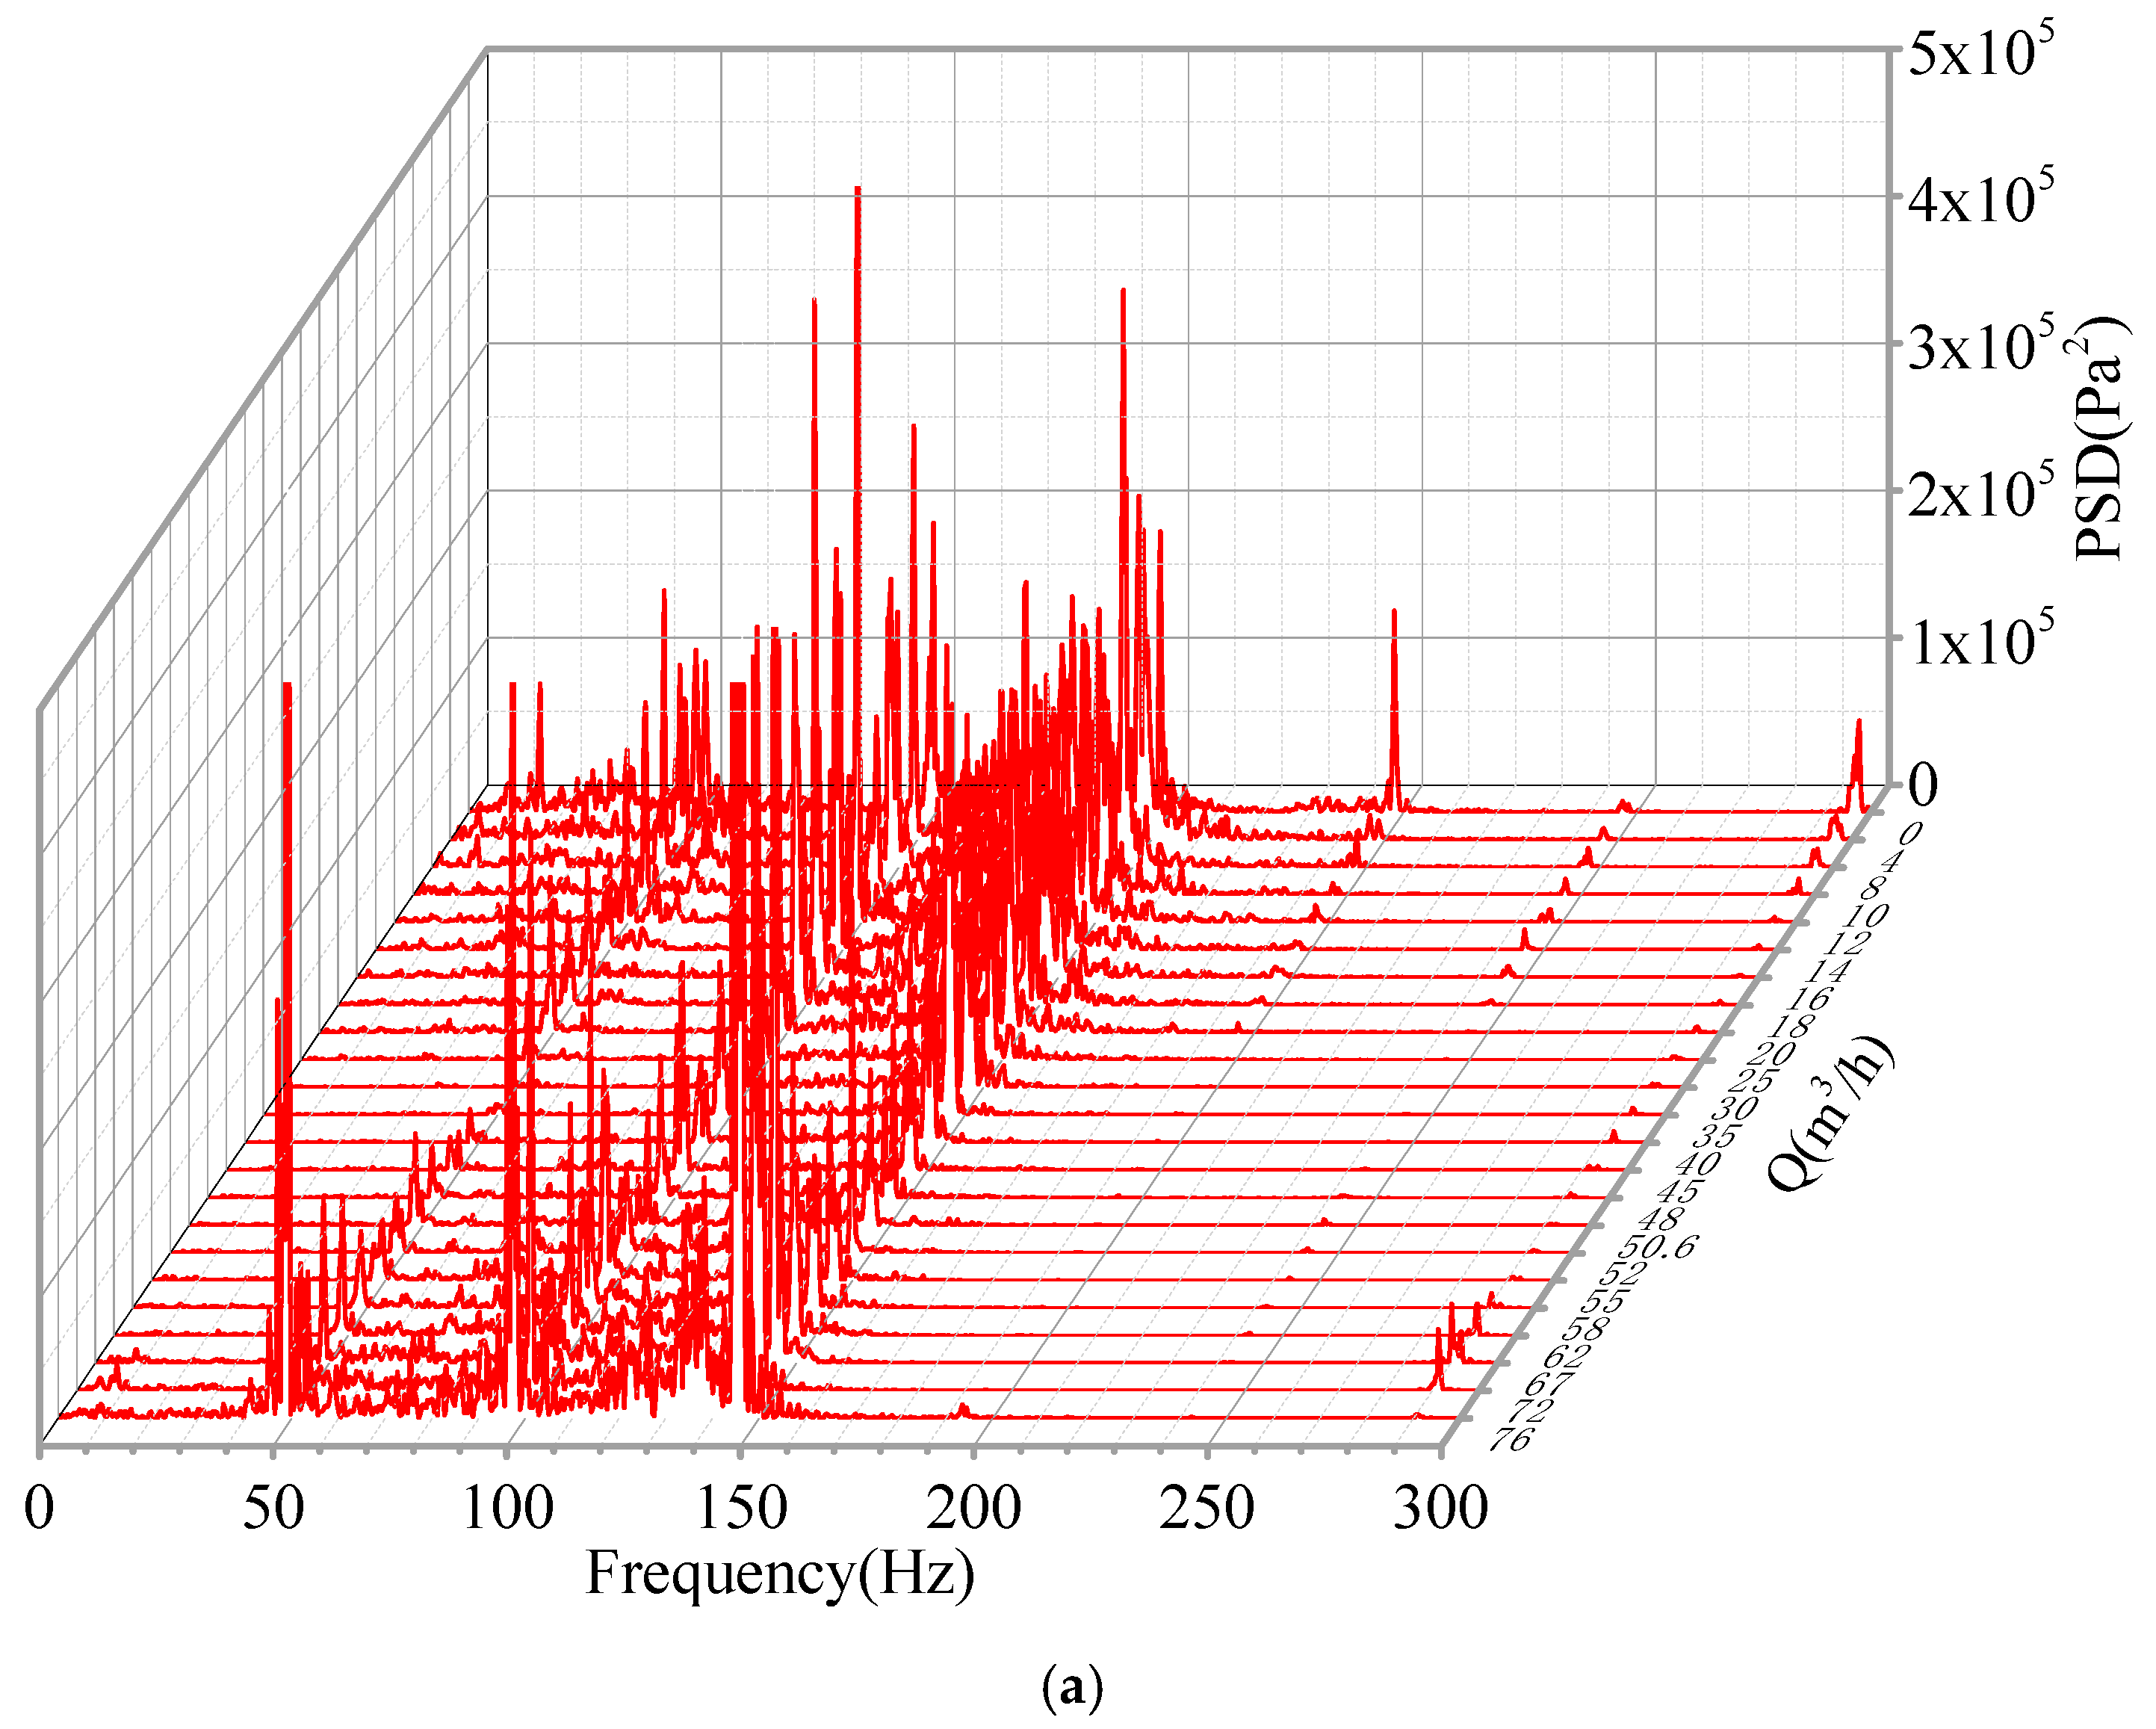
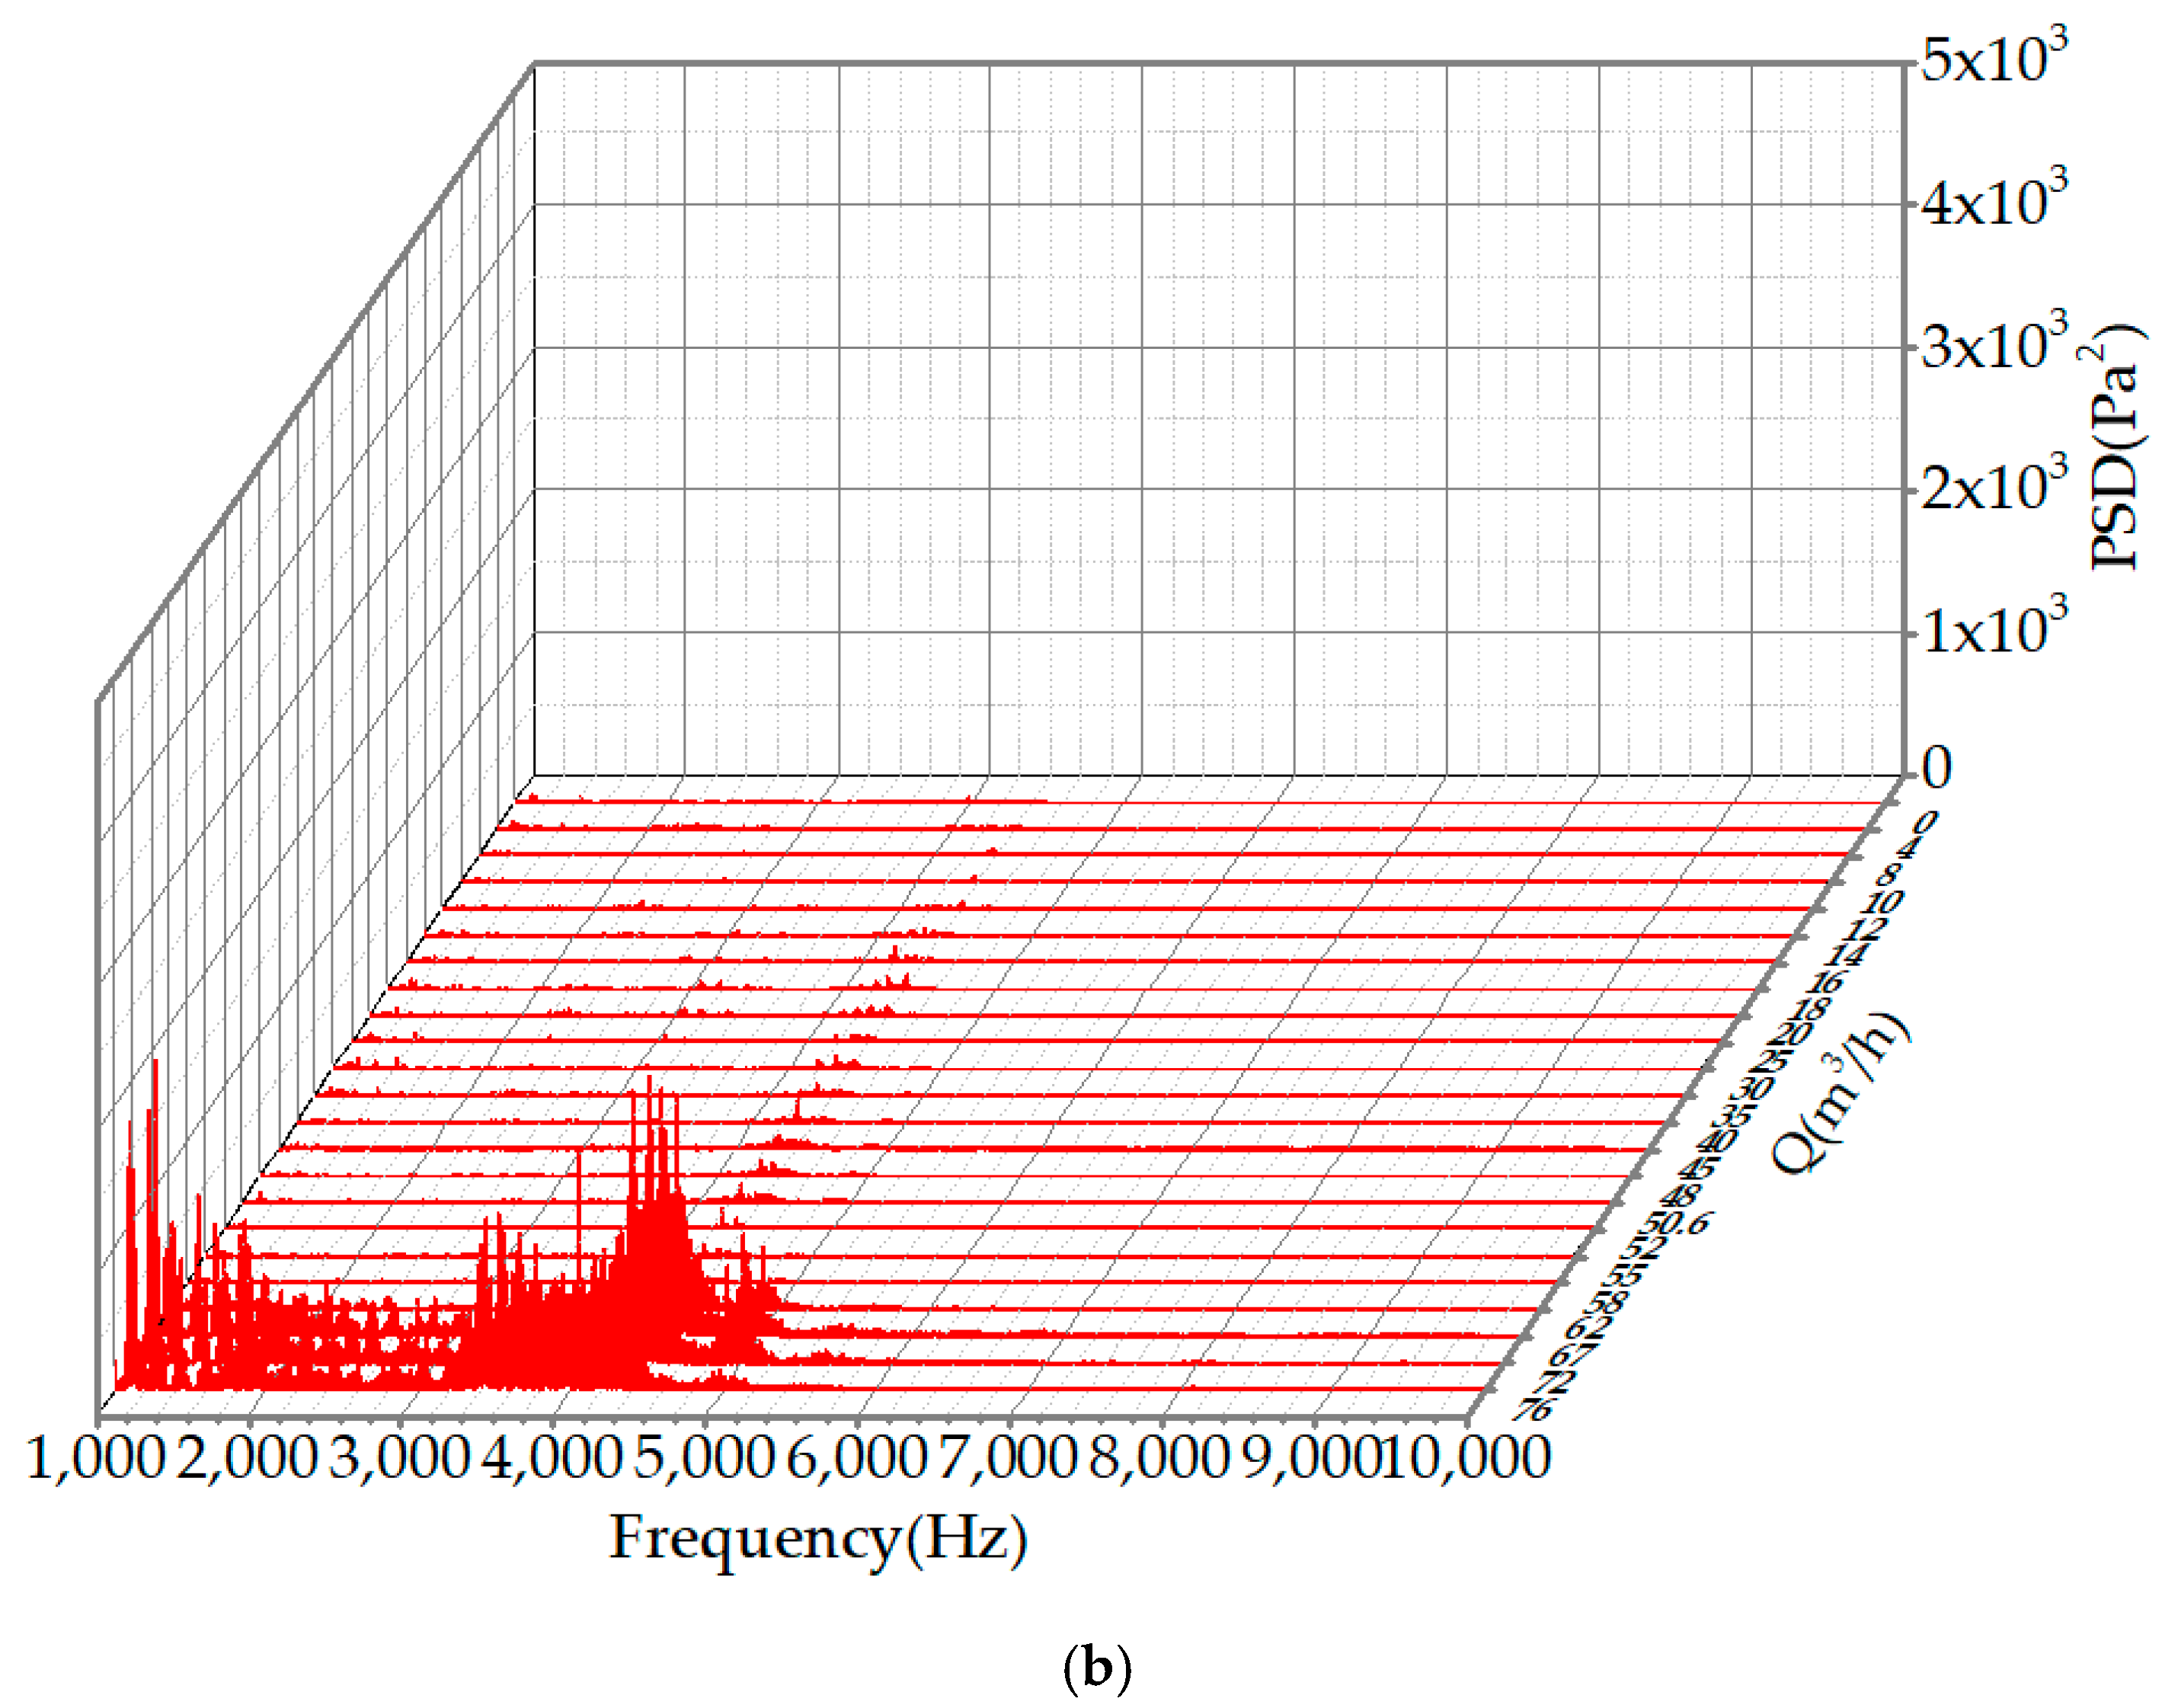
3.5. Power Spectral Density (PSD) of the Noise Measured at the Pump Inlet

The PSD values of the acoustic pressures tested at pump inlet points 1 and 2 under different flow rates are shown in Figure 14 and Figure 15, respectively. An obvious difference in the noise existed between the two measuring points under the same flow rate. As depicted in Figure 15a, the dominant PSD frequency of the noise tested at pump inlet point 2 was the blade-passing frequency (fd). However, the main frequency of the noise measured at pump inlet point 1 was not apparent. Instead, obvious broadband pulsations of the noise were found, which were distributed between 50 Hz and 150 Hz, as shown in Figure 14a. These broadband pulsations became more severe with the reduction of the flow rate. Meanwhile, the broadband pulsations ranged from 0 to 200 Hz because the flow rate decreased to approximately 0.4 Qd (20 m3/h). The primary reason for this phenomenon was that the position of pump inlet noise testing point 1 was closer to the recirculation and prewhirl regions in the pump inlet pipe. The recirculation and prewhirl regions were caused by the backflow and the rotation of the impeller, which had a circumferential speed. The noise broadband fluctuations distributed between 0 and 200 Hz resulted from turbulent structures, which included the vortices produced by the prewhirl and backflow in the pump inlet pipe. To research the prewhirl effect on cavitation, guide vanes were installed in a centrifugal pump inlet pipe to change the prewhirl in Tan’s work [37]. Their results revealed that the critical net positive suction head (NPSHc) of centrifugal pumps could be reduced by this method. The recirculation and prewhirl regions expanded upstream with the reduction of the flow rate in a centrifugal pump’s inlet pipe visualization experiment conducted by Si [38]. In Si’s research, the prewhirl presented a spiral shape in the pipe, as shown in Figure 16. It was apparent that the lengths of the recirculation regions (L1, L2, L3 and L4) produced by backflow diffused upstream in the pump inlet conduit with the decrease of the flow rate, promoting the formation and development of a prewhirl. Therefore, in the current study, pump inlet noise testing point 2, which was closer to the pump and was less affected by the prewhirl and backflow, was in the upstream pipe.
Attention was paid to the broadband fluctuations of the noise tested by pump inlet hydrophone 1 and hydrophone 2 that were distributed from 1 kHz to 5 kHz and 1 kHz to 3 kHz in the entire flow rate range, as shown in Figure 14b and Figure 15b, respectively. The broadband fluctuations of the noise mentioned above were produced by the vibration of mechanical structures during the operating of the centrifugal pump. The intensity of the broadband fluctuations apparently intensified, and the ranges of the fluctuations expanded when the flow rate increased to 1.22 Qd (62 m3/h). Obvious broadband fluctuations of the noise measured by pump inlet hydrophone 2 distributed between 6 kHz and 9 kHz were found as the flow rate increased from 1.22 Qd to 1.5 Qd, as depicted in Figure 15b. However, the broadband fluctuations of the noise tested at pump inlet point 1 were not found in this frequency range. The broadband pulsations of the noise distributed from 6 kHz to 9 kHz were produced by the occurrence and development of cavitation as the flow rate increased to 62 m3/h. Compared with pump inlet hydrophone 1, the testing point 2 at the pump inlet was closer to the cavitation region, which was more sensitive to the noise induced by cavitation. The broadband fluctuations of the noise at the two pump inlet testing points distributed from 1 kHz to 5 kHz and 1 kHz to 3 kHz were caused by the vibration produced by the pump operating system. The intensification of the noise resulted from the vibration produced by cavitation since the occurrence and development of cavitation. The obvious increase in the broadband fluctuations of the noise distributed at this frequency band was caused by the coupling between the cavitation-induced noise and the system-produced noise.

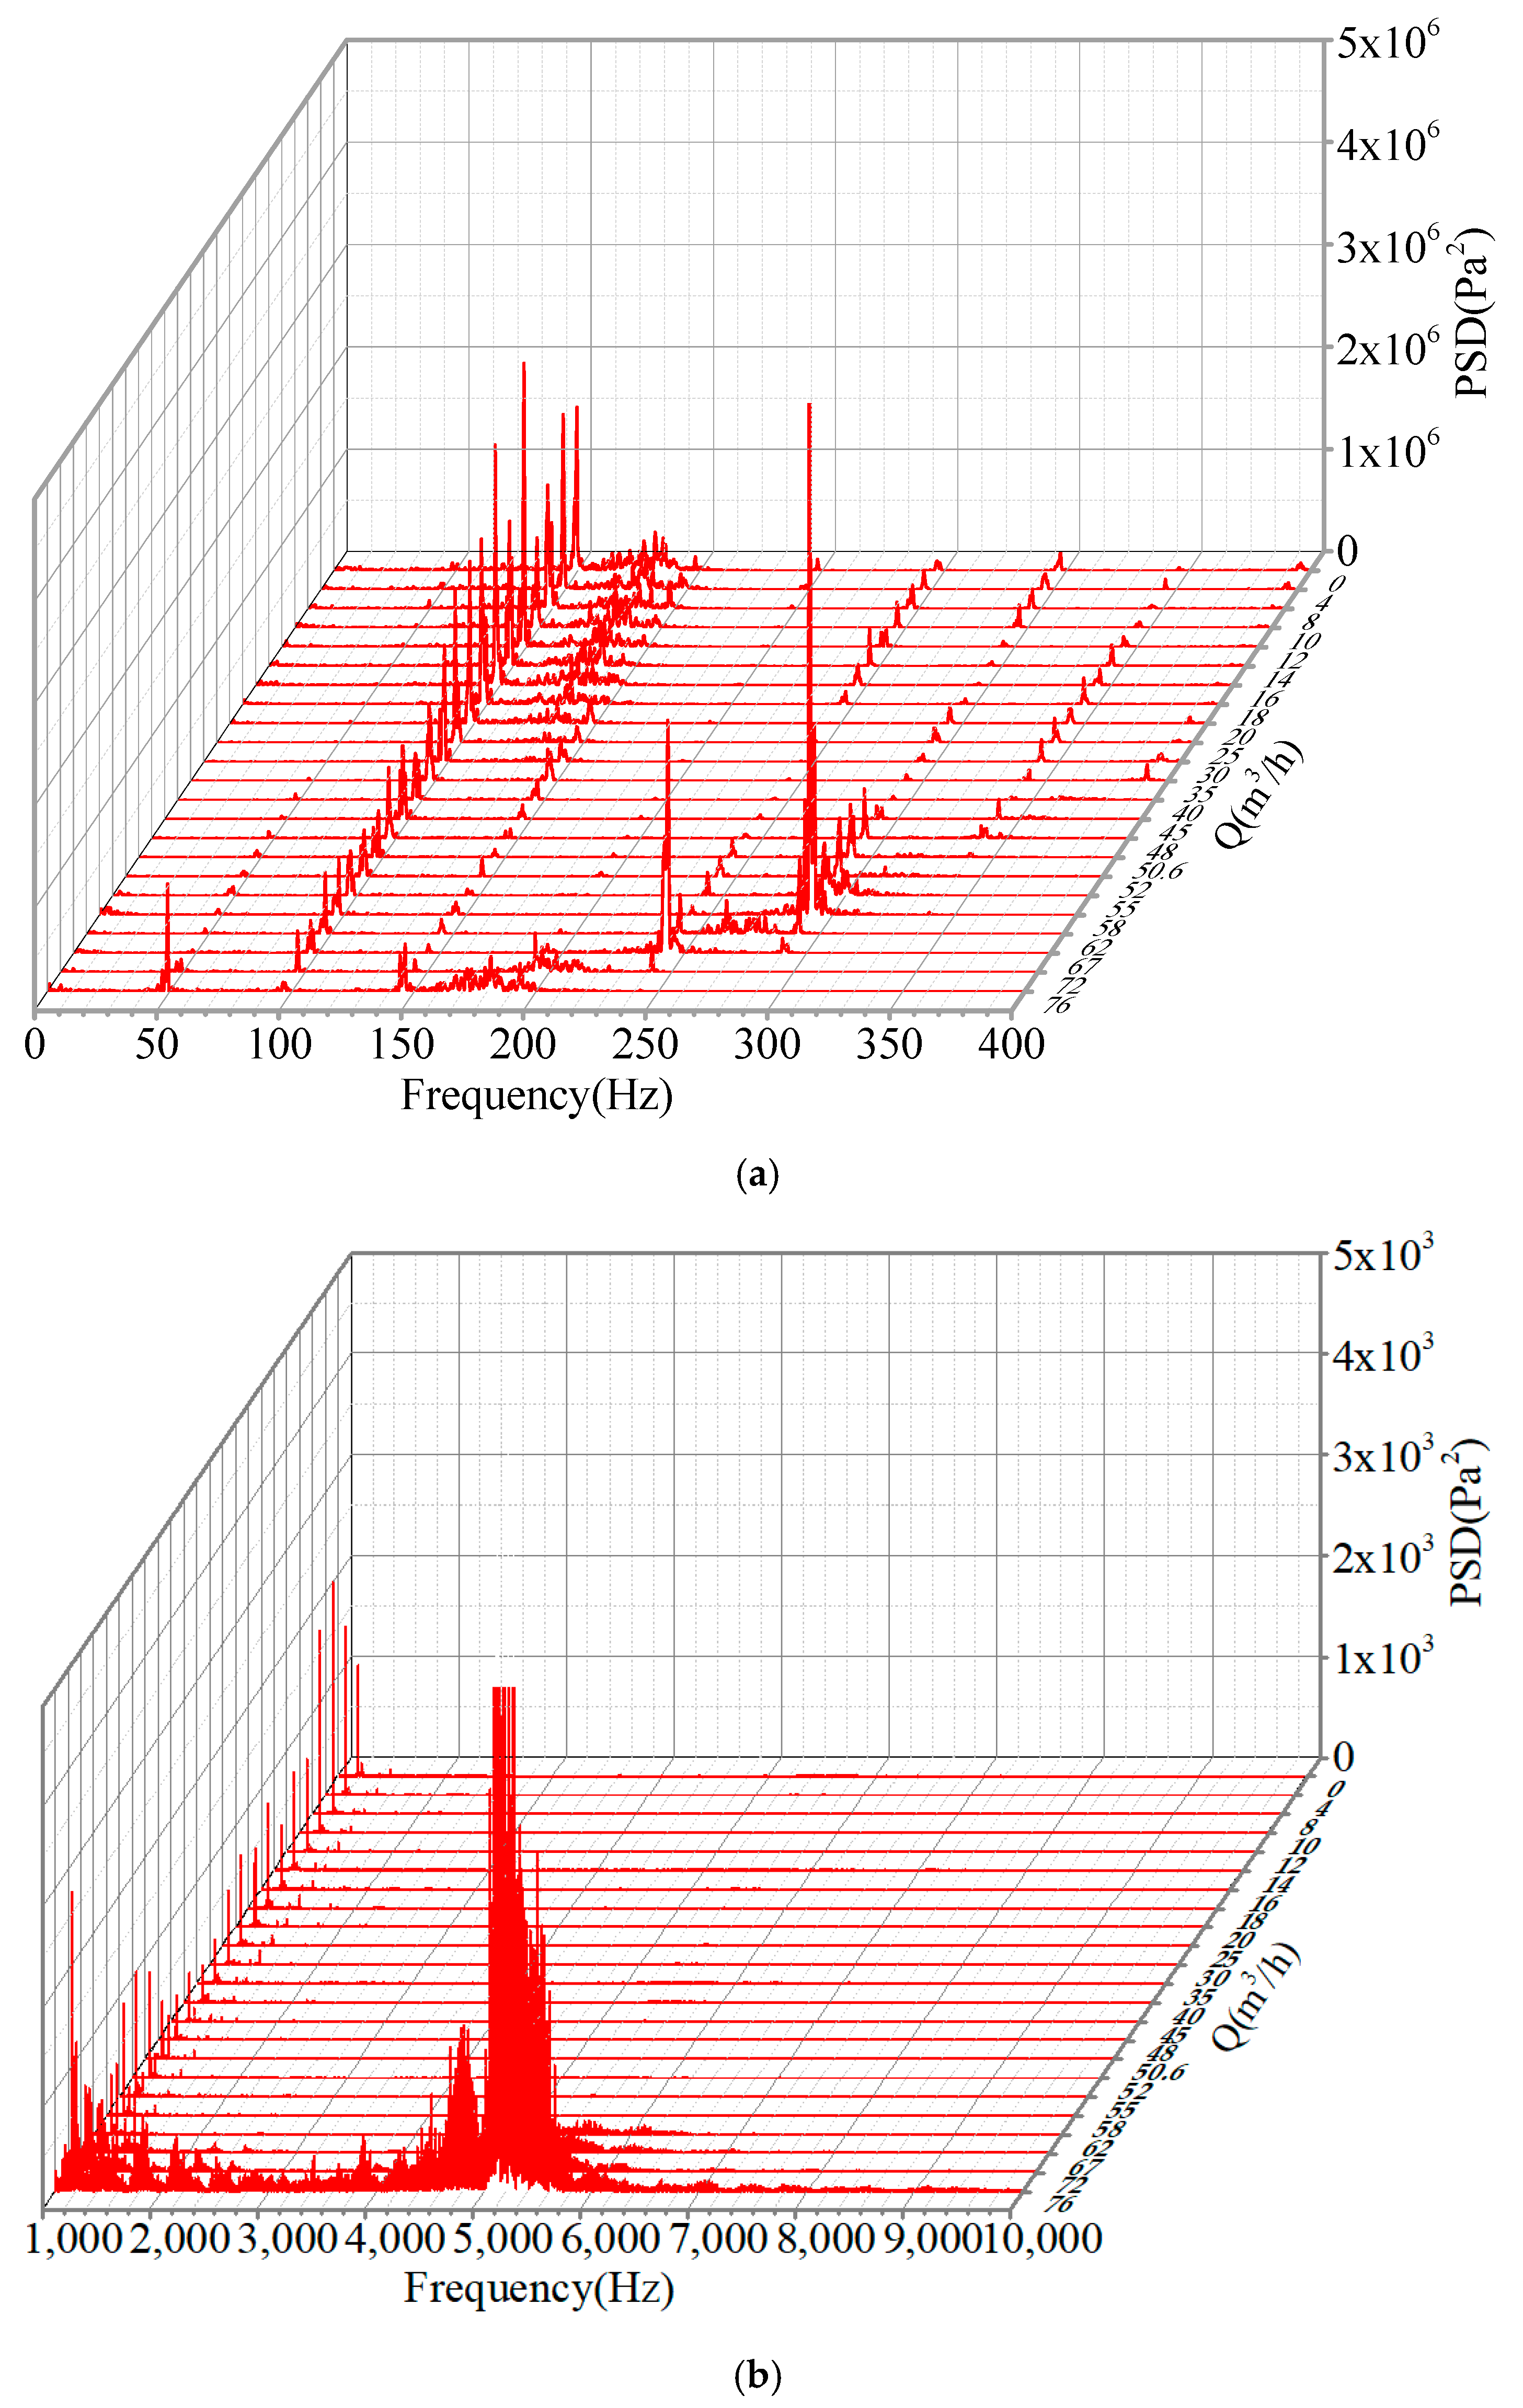
3.6. PSD of the Noise Measured at the Pump Outlet

The relationships between the PSD of the noise measured by pump outlet hydrophone 1 and hydrophone 2 and the variation of the flow rate were determined, as shown in Figure 17 and Figure 18. Obvious local extrema of the PSD signals of pump outlet measuring point 1 were found at five times the shaft frequency (5f0) and the blade passing frequency (fd) as the flow rate increased from 0–0.7 Qd (0 to 35 m3/h), as illustrated in Figure 17a. The local extrema distributed at 5f0 sharply decreased when the flow rate was greater than 0.277 Qd (14 m3/h), which was the hump point of the pump. Therefore, the noise produced at 5f0 was associated with the rotating stall in the pump. However, obvious typical information of the noise measured at pump outlet point 2 was not found at 5f0. The explanation for this phenomenon was that the position of outlet testing point 2 was further from the pump than was outlet point 1, so the flow instabilities were weakened and transformed to stable flow with the liquid flowing from the pump outlet to the downstream pipe.
Apparent broadband fluctuations of the noise tested at the two pump outlet points were found at the broadband frequencies of 100 Hz to 150 Hz when the flow rate increased from 0 to 0.4 Qd. The broadband fluctuations mainly resulted from the backflow and rotating stalls in the pump. Meanwhile, the broadband fluctuations and the extrema of the noise measured by pump outlet hydrophone 1 were found at 4f0 when the flow rate increased to approximately 0.9 Qd (45 m3/h), as depicted in Figure 17a. However, the reasons for this phenomenon were not clear. Due to the occurrence and development of cavitation as the flow rate increased from 1.22 Qd (62 m3/h) to 1.5 Qd (76 m3/h), the acoustic pressure pulsations mentioned above at 4f0 gradually moved to the low frequency band with the further increase of the flow rate.
The extrema of the noise at outlet testing point 2 dramatically increased at the blade-passing frequency (fd) when the flow rate increased to 1.15 Qd (58 m3/h), as shown in Figure 18a. The primary reason for this phenomenon was that the quite small, unstable and travelled vapor bubbles occurred on occasions when the flow rate increased to 58 m3/h, causing the intensification of noise. It was well known that cavitation would become more severe with the decrease of pressure due to the increase of the flow rate. Then, it was found that the extrema converted to broadband pulsations moved to the low frequency band as the flow rate increased, indicating the development of cavitation.
Meanwhile, similar to the pump inlet noise, significantly enhanced broadband fluctuations of the acoustic pressure measured at the two pump outlet points at the high-frequency band were found as the flow rate increased from 1.22 Qd to 1.5 Qd, which resulted from the occurrence and development of cavitation, as shown in Figure 17b and Figure 18b. Because outlet testing point 1 was closer to the pump, the intensity of these broadband fluctuations of the pump outlet noise was stronger than that of outlet testing point 2. Therefore, various kinds of flow instabilities in the pump could be detected by the noise.

4. Conclusions

The internal flow characteristics in the pump were numerically researched, and the acoustic pressure fluctuations at the pump inlet and outlet were experimentally investigated. Obvious corresponding relationships between the flow instabilities, the cavitation and the noise were established. It was found that the rotating stall, the backflow, the hump, the occurrence of unstable flow and the cavitation in such a centrifugal pump were effectively detected through the noise, which could help to provide fundamental information on flow instabilities and guarantee safe and steady operating conditions for the system.
(a)
The inlet and outlet noise-measuring points should be as close as possible to the pump to accurately detect the unstable flow inside the pump.
(b)
The recirculation and prewhirl regions in the pump upstream pipe, which were caused by the backflow and the rotation of the impeller, presented the circumferential movement with a spiral shape, causing apparent broadband fluctuations at low frequency band of the acoustic pressure. The backflow and rotating stall could also result in the broadband fluctuations of the pump outlet noise, which was distributed from 100 Hz to 150 Hz.
(c)
The broadband fluctuations of the pump outlet acoustic pressure distributed from 100 Hz to 300 Hz, which was produced by the occurrence of cavitation, moved to the lower frequency band as the flow rate increased.
(d)
The enhanced broadband fluctuations of the pump inlet and outlet noise distributed from 1 kHz to 6 kHz were caused by the coupling between the cavitation-induced noise and the system-produced noise. Meanwhile, the broadband fluctuations of the pump inlet noise distributed between 6 kHz and 9 kHz were regarded as the typical frequency band of cavitation in the centrifugal pump.

Author Contributions

J.L. wrote the paper; J.L. and B.H. conducted the experiments; J.L., Y.Z., B.Z. and H.H. analyzed the results; X.L. commented on the paper. All authors have read and agreed to the published version of the manuscript.

Funding

The authors express their heartfelt appreciation to Shouqi Yuan at Jiangsu University for his significant support during Jiaxing Lu’s study. This research was funded by the National Key Research and Development Program “Research and Application Demonstration of Complementary Combined Power Generation Technology between Distributed Photovoltaic and Cascade Small Hydropower” (Grant No. 2018YFB0905200), by the China Postdoctoral Science Foundation (Grant No. 2019M660636), by the Natural Science Foundation of China (Grant No. 51679122, Grant No. 51736008), and by the Open Research Subject of Key Laboratory (Fluid Machinery and Engineering Research Base) of Sichuan Province (Grant No. szjj2019-026), by the Project of the Education Department of Sichuan Province (Grant No. 13ZA0027).

Conflicts of Interest

The authors declare no conflict of interest.

Nomenclature

Latin Symbols
fdBlade-passing frequencyHz
f0Shaft frequencyHz
HHeadm
HdRated head of the pumpm
kConstant-
nRotational speedrpm
NConstant-
QFlow ratem3/s
QdRated flow ratem3/s
XkAcoustic pressurePa
Abbreviations
PSDPower spectral density
RMSRoot mean square

References

  1. He, X.; Zhang, Y.; Wang, C.; Zhang, C.; Cheng, L.; Chen, K.; Hu, B. Influence of critical wall roughness on the performance of double-channel sewage pump. Energies 2020, 13, 464. [Google Scholar] [CrossRef] [Green Version]
  2. Lu, Y.; Zhu, R.; Wang, X.; Wang, Y.; Fu, Q.; Ye, D. Study on the complete rotational characteristic of coolant pump in the gas-liquid two-phase operating condition. Ann. Nucl. Energy 2019, 123, 180–189. [Google Scholar]
  3. Wang, C.; He, X.; Cheng, L.; Luo, C.; Xu, J.; Chen, K.; Jiao, W. Numerical simulation on hydraulic characteristics of nozzle in waterjet propulsion system. Processes 2019, 7, 915. [Google Scholar] [CrossRef] [Green Version]
  4. Lu, J.X.; Yuan, S.Q.; Luo, Y.; Yuan, J.P.; Zhou, B.L.; Sun, H. Numerical and experimental investigation on the development of cavitation in a centrifugal pump. Proc. Inst. Mech. Eng. Part E 2016, 230, 171–182. [Google Scholar] [CrossRef]
  5. Lu, J.X.; Yuan, S.Q.; Parameswaran, S.; Yuan, J.P.; Ren, X.D.; Zhou, B.L. The characteristics investigation under the unsteady cavitation condition in a centrifugal pump. J. Mech. Sci. Technol. 2017, 31, 1213–1222. [Google Scholar] [CrossRef]
  6. Choi, J.S.; McLaughlin, D.K.; Thompson, D.E. Experiments on the unsteady flow field and noise generation in a centrifugal pump impeller. J. Sound Vib. 2003, 263, 493–514. [Google Scholar] [CrossRef]
  7. Lu, J.X.; Yuan, S.Q.; Yuan, J.P.; Si, Q.R.; Luo, Y. Experiments on effects of AC motor water-cooling device on performance of centrifugal pump. J. Drain. Irrig. Mach. Eng. 2014, 32, 737–741. [Google Scholar]
  8. Cumpsty, N.A. A critical review of turbomachinery noise. J. Fluids Eng. 1977, 99, 278–293. [Google Scholar] [CrossRef]
  9. Brennen, C.E. Hydrodynamics of Pumps; Cambridge University Press: Cambridge, UK, 2011. [Google Scholar]
  10. Langthjem, M.A.; Olhoff, N. A numerical study of flow-induced noise in a two-dimensional centrifugal pump. Part I. Hydrodynamics. J. Fluids Struct. 2004, 19, 349–368. [Google Scholar] [CrossRef]
  11. Langthjem, M.A.; Olhoff, N. A numerical study of flow-induced noise in a two-dimensional centrifugal pump. Part II. Hydroacoustics. J. Fluids Struct. 2004, 19, 369–386. [Google Scholar] [CrossRef]
  12. Gao, M.; Dong, P.X.; Lei, S.H.; Turan, A. Computational study of the noise radiation in a centrifugal pump when flow rate changes. Energies 2017, 10, 221. [Google Scholar] [CrossRef] [Green Version]
  13. Simpson, H.C. A theoretical investigation of hydraulic noise in pumps. J. Sound Vib. 1967, 5, 456–488. [Google Scholar] [CrossRef]
  14. Mongeau, L. Experimental study of the mechanism of sound generation by a rotating stall in centrifugal turbomachines. J. Acoust. Soc. Am. 1992, 91, 2288. [Google Scholar] [CrossRef]
  15. Chu, S.; Dong, R.; Katz, J. Relationship between unsteady flow, pressure fluctuations, and noise in a centrifugal pump—Part A: Use of PDV data to compute the pressure field. J. Fluids Eng. 1995, 117, 24–29. [Google Scholar] [CrossRef]
  16. Chu, S.; Dong, R.; Katz, J. Relationship between unsteady flow, pressure fluctuations, and noise in a centrifugal pump—Part B: Effects of blade-tongue interactions. J. Fluids Eng. 1995, 117, 30–35. [Google Scholar] [CrossRef]
  17. Dong, R.; Chu, S.; Katz, J. Effect of modification to tongue and impeller geometry on unsteady flow, pressure fluctuations, and noise in a centrifugal pump. J. Turbomach. 1997, 119, 506–515. [Google Scholar] [CrossRef] [Green Version]
  18. Si, Q.R.; Yuan, S.Q.; Yuan, J.P.; Wang, C.; Yang, J. Study on the influence of volute to flow–induced noise in centrifugal pump. Adv. Mater. Res. 2012, 516, 1009–1017. [Google Scholar] [CrossRef]
  19. Wang, C.; Chen, X.X.; Qiu, N.; Zhu, Y.; Shi, W.D. Numerical and experimental study on the pressure fluctuation, vibration, and noise of multistage pump with radial diffuser. J. Braz. Soc. Mech. Sci. Eng. 2018, 40, 481. [Google Scholar] [CrossRef]
  20. Rzentkowski, G.; Zbroja, S. Experimental characterization of centrifugal pumps as an acoustic source at the blade-passing frequency. J. Fluids Struct. 2000, 14, 529–558. [Google Scholar] [CrossRef]
  21. Guo, C.; Gao, M.; Lu, D.Y.; Wang, K. An Experimental study on the radiation noise characteristics of a centrifugal pump with various working conditions. Energies 2017, 10, 2139. [Google Scholar] [CrossRef] [Green Version]
  22. Yuan, J.P.; Ge, A.X.; Sun, W.; Fu, Y.X.; Xue, F. A study of flow–induced noise in the volute of centrifugal pump based on sysnoise. Adv. Mater. Res. 2012, 468–471, 643–649. [Google Scholar] [CrossRef]
  23. Ye, X.M.; Pei, J.J.; Li, C.X.; Liu, Z. Experimental study on nosie characteristics of centrifugal pump based on near–field acoustic pressure method. Chin. J. Power Eng. 2013, 33, 375–380. [Google Scholar]
  24. Parrondo, J.; Pérez, J.; Barrio, R.; González, J. A simple acoustic model to characterize the internal low frequency sound field in centrifugal pumps. Appl. Acoust. 2011, 72, 59–64. [Google Scholar] [CrossRef]
  25. Si, Q.R.; Yuan, S.Q.; Yuan, J.P. Experimental study on the influence of impeller–tongue gap on the performance and flow-induced noise characteristics of centrifugal pumps. J. Vib. Shock 2016, 35, 164–168. [Google Scholar]
  26. Lu, D.Y. Experimental Study on Flow-Noise of Centrifugal Pump in Variable Working Condition. Master’s Thesis, Shandong University, Jinan, China, 2017. [Google Scholar]
  27. Sun, Y.D.; Zhong, R.; Wang, S.Q.; Hao, X.Y.; Wang, J. Experimental research on hydrodynamic noise of centrifugal pumps based on two-port source characteristic test method. J. Ship Mech. 2016, 20, 198–205. [Google Scholar]
  28. Yuan, S.Q.; Yang, J.; Yuan, J.P.; Luo, Y.; Pei, J. Experimental investigation on the flow–induced noise under variable conditions for centrifugal pumps. Chin. J. Mech. Eng. 2012, 25, 456–462. [Google Scholar]
  29. Lu, J.X.; Yuan, S.Q.; Yuan, J.P.; Ren, X.D.; Pei, J.; Si, Q.R. Research on the noise induced by cavitation under the asymmetric cavitation condition in a centrifugal pump. J. Phys. Conf. Ser. 2015, 656, 012102. [Google Scholar] [CrossRef] [Green Version]
  30. Yuan, J.P. Inner Flow PIV Measurement and its Unsteady Turbulent Flow Numerical Simulation for a Centrifugal Pump with Multi-Programs. Ph.D. Thesis, Jiangsu University, Zhenjiang, China, 2008. [Google Scholar]
  31. Hou, J.S. Research on the Dynamic Characteristics of Inlet Backflow Vortex Cavitation in Centrifugal Pumps. Master’s Thesis, Jiangsu University, Zhenjiang, China, 2018. [Google Scholar]
  32. Lu, J.X.; Liu, X.B.; Zeng, Y.Z.; Zhu, B.S.; Hu, B.; Yuan, S.Q.; Hua, H. Detection of the flow state for a centrifugal pump based on vibration. Energies 2019, 12, 3066. [Google Scholar] [CrossRef] [Green Version]
  33. Pan, Z.Y.; Yuan, S.Q. Fundamentals of Cavitation in Pumps; Jiangsu University Press: Zhenjiang, China, 2013. [Google Scholar]
  34. Li, X.J.; Chen, B.; Luo, X.W.; Zhu, Z.C. Effects of flow pattern on hydraulic performance and energy conversion characterisation in a centrifugal pump. Renew. Energy 2019. [Google Scholar] [CrossRef]
  35. Mao, X.L.; Pavesi, G.; Chen, D.Y.; Xu, H.S.; Mao, G.J. Flow induced noise characterization of pump turbine in continuous and intermittent load rejection processes. Renew. Energy 2019, 139, 1029–1039. [Google Scholar] [CrossRef]
  36. Xu, Z.H.; Xu, D.H.; Wu, Y.L.; Chen, N.X.; Chen, R. Monitor and diagnose of cavitation in pump and hydro turbine. Trans. Chin. Soc. Agric. Mach. 2003, 34, 139–142. [Google Scholar]
  37. Tan, L.; Zhu, B.S.; Cao, S.L.; Wang, Y.C.; Wang, B.B. Influence of prewhirl regulation by inlet guide vanes on cavitation performance of a centrifugal pump. Energies 2014, 7, 1050–1065. [Google Scholar] [CrossRef]
  38. Si, Q.R. Investigation on Hydraulic Design of Centrifugal Pumps with Low Noise and Mechanism of Rotor-Stator Interaction. Ph.D. Thesis, Jiangsu University, Zhenjiang, China, 2014. [Google Scholar]
Figure 1. Schematic of the experimental test rig.
Energies 13 00589 g001
Figure 2. Experimental set-up with instrumentation.
Energies 13 00589 g002
Figure 3. Installed positions of the hydrophones. (1) Pump outlet pressure transmitter 1; (2) pump inlet pressure transmitter 1; (3) pump outlet pressure transmitter 2; (4) accelerometer 3, Z direction; (5) accelerometer 1, X direction; (6) accelerometer 2, Y direction; (7) accelerometer 4, on the base; (8) pump inlet pressure transmitter 2.
Energies 13 00589 g003
Figure 4. Three-dimensional (3D) model of the centrifugal pump.
Energies 13 00589 g004
Figure 5. Mesh of the computational domain.
Energies 13 00589 g005
Figure 6. Performance curves of the centrifugal pump.
Energies 13 00589 g006
Figure 7. The positions of planes A and B: (a) Axial cross-section; (b) Intermediate cross-section.
Energies 13 00589 g007
Figure 8. The streamlines of water velocity distributed in plane A and plane B. (a) 0 m3/h, 0 Qd; (b) 8 m3/h, 0.16 Qd; (c) 10 m3/h, 0.2 Qd; (d) 14 m3/h, 0.277 Qd; (e) 20 m3/h, 0.4 Qd; (f) 30 m3/h, 0.6 Qd; (g) 50.6 m3/h, 1.0 Qd; (h) 67 m3/h, 1.32 Qd.
Energies 13 00589 g008aEnergies 13 00589 g008b
Figure 9. The distributions of cavitation pockets under different flow rates. (a) 62 m3/h, 1.22 Qd; (b) 67 m3/h, 1.32 Qd.
Energies 13 00589 g009
Figure 10. Time domain of the acoustic pressure measured by pump inlet hydrophone 2 at different flow rates. (a) Q = 0 m3/h; (b) Q = 14 m3/h; (c) Q = 50.6 m3/h; (d) Q = 62 m3/h; (e) Q = 67 m3/h; (f) Q = 76 m3/h.
Energies 13 00589 g010
Figure 11. Time domain of the acoustic pressure measured by pump outlet hydrophone 1 at various flow rates. (a) Q = 0 m3/h; (b) Q = 14 m3/h; (c) Q = 50.6 m3/h; (d) Q = 62 m3/h; (e) Q = 67 m3/h; (f) Q = 76 m3/h.
Energies 13 00589 g011
Figure 12. Root mean square (RMS) of the pump inlet acoustic pressure under different flow rates.
Energies 13 00589 g012
Figure 13. RMS of the pump outlet acoustic pressure under different flow rates.
Energies 13 00589 g013
Figure 14. Power spectral density (PSD) of the acoustic pressure measured by pump inlet hydrophone 1 at different flow rates. (a) 0–300 Hz; (b) 1–10 kHz.
Energies 13 00589 g014aEnergies 13 00589 g014b
Figure 15. PSD of the acoustic pressure measured by pump inlet hydrophone 2 at different flow rates. (a) 0–400 Hz; (b) 1–10 kHz.
Energies 13 00589 g015aEnergies 13 00589 g015b
Figure 16. Visualized experiment of the pump inlet pipe [38]. (a) 0.4Qd; (b) 0.3Qd; (c) 0.2Qd; (d) 0.1Qd.
Energies 13 00589 g016
Figure 17. PSD of the acoustic pressure measured by pump outlet hydrophone 1 at different flow rates. (a) 0–400 Hz; (b) 1–10 kHz.
Energies 13 00589 g017
Figure 18. PSD of the acoustic pressure measured by pump outlet hydrophone 2 at different flow rates. (a) 0–400 Hz; (b) 1–10 kHz.
Energies 13 00589 g018
Table 1. Primary parameters of the centrifugal pump.
Primary ParametersValueUnit
Rated head Hd20.2m
Rated rotating speed n2910rpm
Rated flow rate Qd50.6m3/h
Blade passing frequency fd291Hz
Shaft frequency f048.5Hz
Outlet angle of the blade 23degree

