Article

Earth-Cooling Air Tunnels for Thermal Power Plants: Initial Design by CFD Modelling

by
Eduardo de la Rocha Camba
and
Fontina Petrakopoulou
*
Department of Thermal and Fluid Engineering, University Carlos III of Madrid, Avenida de la Universidad 30, Leganés, 28911 Madrid, Spain
*
Author to whom correspondence should be addressed.
Energies 2020, 13(4), 797; https://doi.org/10.3390/en13040797
Submission received: 13 December 2019 / Revised: 29 January 2020 / Accepted: 8 February 2020 / Published: 12 February 2020
(This article belongs to the Section B: Energy and Environment)

Abstract

:
Climate change and the increase of the consumption of energy resources are expected to further strain anticipated water stress scenarios. The operation of existing thermal plants depends greatly on their cooling capacity, for which large amounts of water are withdrawn and consumed. Dry-cooling systems, on the other hand, do not require water, but they are less efficient and more expensive relative to conventional water-based systems, because of their dependency on the ambient temperature. This paper introduces the new idea of replacing water-based cooling systems in thermal power plants with earth-cooling air tunnels. Based on the concept of existing earth-air heat exchangers, the system takes advantage of the low and relatively constant underground temperature for cooling ambient air before it is introduced in the air condenser of the plant. In this work, we present an initial design of such an open-loop system for a 20 MW concentrated solar power plant. A sensitivity study of both geometric and flow parameters is realized using computational fluid dynamics simulations. Under the requirements of the study, we find that a system using a design of pipes with 0.5 m diameter and about 300 m length can be considered a technically viable zero-water alternative to water-cooling technologies.

1. Introduction

One of the main activities that contributes to climate change is power generation, due to the emissions caused by the burning of fossil fuels [1]. In turn, climate change has a great influence on power generation: the availability of resources, the power output and operational efficiency and the overall associated socioeconomic costs. The efficiency of thermal power plants is expected to decrease by about 0.4%–0.7% per rising degree of temperature and the global annual capacity could be reduced by about 7%–12% by 2050 [2]. Furthermore, population increase, urbanization, deforestation, and the expected increase of the consumption of valuable resources (especially by developed and developing countries) also call for actions to mitigate the emission of greenhouse gases. The cycle of water has been clearly altered and its availability and accessibility have been predicted to be limited in the following decades. The redesign of systems using resources like water, therefore, is one of the actions we are called to take.
Mean river temperatures are expected to increase annually by 1.3 °C, 2.6 °C, and 3.8 °C with air temperature increases of 2 °C, 4 °C, and 6 °C, respectively [3]. The increase of greenhouse gases will reduce the reserves of freshwater with rivers and aquifers drying up, and the melting of ice sheets will furthermore escalate the sea level, as well as the salinization of freshwater. Extreme weather events are expected to occur more frequently, with land and water resources being damaged through erosion and pollution. According to Olsson et al. (2015) [4], global water availability may decrease by more than 10% with a temperature increase of 2–3 °C. The exact regional effects will vary, but dry ecosystems are expected to suffer the most, while wetter areas are expected to become even wetter. In addition, the quality of freshwater will deteriorate due to environmental pollution. All these issues will cause significant socioeconomic impacts related to competition for water accessibility that will increase the value of water even further. This might lead to conflicts between countries, as well as big migration movements. Demands for water, energy and food are expected to increase by 40%, 50%, and 35% by 2030, respectively. Various methods to address the water-energy-food nexus, both qualitative and quantitative, are exposed by Endo et al. (2015) [5]. At the same time, 3.6 billion people live in areas with a high water-scarcity risk during at least one month per year, while 1.8 billions of these people are currently affected by desertification [6]. Water stress is considered one of the main issues to tackle in order to achieve the millennium development goals [7]. Water stress occurs when water availability is lower than the water demand. The United Nations defines water stress when annual water availability drops below 1700 m3 per person, and water scarcity and absolute scarcity when water availability drops below 1000 m3 and 500 m3, respectively [7].
Power generation requires large amounts of water mainly for cooling purposes, upon which the efficiency and power output of thermal plants greatly depend [8]. Cooling is a necessary step of the Rankine cycle for condensing the steam after it is expanded in a steam turbine connected to an electricity generator. Water may be withdrawn (removed from a water source and returned after used) and consumed (evaporated, transpired or incorporated to a circuit or product) [9]. In Europe, about 43% of water withdrawals are used for thermal power generation that generates 78% of the electricity demand. In the United States, these numbers are about 39% and 91%, respectively [3]. In China, 84% of total water withdrawals are consumed in thermal power plants. Globally, 10% of water withdrawals are used in thermal power plants for the generation of 80% of the total power required [10].
Existing wet-cooling technologies (direct or once-through and indirect or recirculating) withdraw and consume great amounts of water. This also implies great amounts of energy consumption and damages to the environment, because the used water is heated and polluted [11]. The water dependency of global power generation supports the importance of the reduction of water use in power plants [12]. Dry systems have the great advantage of almost zero water requirements, but they result in lower efficiencies and greater investment costs. This is due to their dependence on ambient temperatures that are usually higher than water temperatures (a higher cooling temperature will result in a higher pressure at the outlet of the turbine and a lower efficiency of the power plant) [3]. Some thermal plants may also use hybrid cooling systems that combine the use of water with air, when the water reserves are scarce.
During the last decades, several water stress situations have shown the dependency of thermal power plants on water availability [3]. European droughts in 2003 forced France to temporarily shut down four nuclear stations, generating expenses of €300 million from imported electricity. Droughts in California from 2007 to 2009 forced the state to burn natural gas instead of using hydropower, which lead to an additional 12 million tonnes of emitted CO2 and $1.7 billion in extra costs. In India, in 2012, a delayed monsoon increased the demand of water for irrigation and caused two days of blackouts for 700 million people, while in Australia, in 2007, the generation of three coal power stations was curtailed and the price of electricity increased significantly [13,18] Issues caused by water scarcity during periods of droughts and heat waves have also generated conflicts between sectors and protests in the United States and India, when thermal plants were prioritized by the authorities for the withdrawal of water [24]. All mentioned examples show how power generation may be limited as water resources are impacted by climate change. This may be further emphasized in the summer, when increased electricity demand for cooling will coincide with lower water availability and higher temperatures [14]. Van Vliet et al. (2012) estimated a summer average decrease of generated capacity of 6.3%–19% in Europe and 4.4%–16% in the United States for 2031–2060 [15]. Zhou et al. (2018) evaluated the economic consequences of future water scarcity for cooling by a simulation model [8]. They calculated a loss of 0.21% of the global gross domestic product in 2070–2095 and they emphasized the importance of saving water as an important benefit for climate change mitigation. Reducing the water dependency of thermoelectric power plants calls for the replacement of once-through cooling systems, the improvement of recirculating technologies, and a higher implementation rate of dry-cooling systems [16].
Several published studies in literature have focused on the improvement of cooling systems without efficiency reductions, including evaluations of their economic feasibility. Three areas of innovation are highlighted by Stark et al. (2017) [17]: application of inexpensive and high efficient manufacturing technologies for air-cooling systems, implementation of thermal storage, and the utilization of outer space as the last point of heat waste. Elberry et al. (2018) analyzed the performance of an absorption-cooling system when being included into a combined-cycle plant [18]. Other investigations are focused on the optimization of the cooling water mass flow and on the improvement of chemical treatments and monitoring systems [10,19]. Ma et al. (2018) optimized a hybrid cooling system by reducing its total annual costs [20]. The installation of an updraft tower dry-cooling system with a pumped secondary loop was evaluated by Liu et al. (2017), achieving lower efficiency losses than those obtained with air condensers [21]. Furthermore, organizations such as the United Nations and the European Union are also investing in the reduction of water withdrawal and consumption, and in the improvement of cooling systems [22,23,24]. Regulations and laws are also necessary for orientating investments towards the use of recycled water in indirect systems and the selection of dry-cooling systems in the design of new thermal plants [12].
The present study introduces the novel idea of eliminating cooling-water for power plants through the use of earth-cooling air tunnels (Earth CATs). The goal is to use the lower and relatively constant underground temperature for cooling ambient air before it is used to condense the steam that flows through the air condenser of energy conversion systems. The idea is based on existing earth-air heat exchangers (EAHE). These systems move atmospheric air with fans through buried pipes and they are currently mainly used in residential and agricultural applications as a complement or stand-alone mode for heating, cooling, ventilating, and drying in buildings or greenhouses. The novelty of this work is the application of EAHE systems to power plants. Such systems require piping arrangements of a much larger scale than those studied for residential and agricultural applications, implying a much greater technical system complexity and investment. EAHE systems can be open loop, that usually have better performance and lower costs, or closed loop, where the thermal fluid is recirculated. Not only air but also water or specific fluids and groundwater can be used [25]. They have the great advantage of being passive systems with low energy consumption and no greenhouse gas emissions. In ref. [26], the installation of an EAHE system, coupled with a high-pressure cooling system working with organic refrigerants, in a low-to-medium temperature supercritical Rankine plant was studied, obtaining an increment of 1% in the efficiency of the cycle when R134a was used and reducing the impact of daily fluctuations of air temperature. A pipe length of 25 m and a diameter of 0.25 m were considered. In another study, a parametric design of an earth-water heat exchanger (EWHE) for its installation in the cooling system of concentrating photovoltaic cells was developed [27]. It was found that incorporating an EWHE could be cost effective and enhance the cooling performance of two concentrating photovoltaic systems previously analyzed.
Several studies have been used to define the design parameters used in the present work. One-, two- and three-dimensional models have been developed based on fluid dynamic and heat transfer basic equations using the k -ε and k -ω models for turbulent flow. These models have been often simulated numerically with CFD and the obtained results have been validated experimentally. Usually numerical simulations and experimental results agree well and temperature drops of more than 15 °C have been reached.
Furthermore, Vidhi (2018) observed that the performance of EAHE systems is not improved beyond 4 m depth [28]. Bisoniya et al. (2014) concluded that the subsoil temperature remains almost constant after 1.5–2 m depth and that the material of the pipes does not influence the performance significantly [29]. Materials like polyvinyl chloride (PVC), polyethylene and steel can be used, while, backfill materials, e.g., cement, bentonite, concrete, graphite, sand or groundwater, are usually necessary for vertical arrangements [25,30]. Agrawal et al. (2018) mention that the soil temperature remains almost constant at a depth of 3–4 m and concluded that the inlet temperature of the air is the most important parameter to reach high temperature drops, while the diameter of the pipe has the greatest influence on the heat transfer [31]. By contrast, air velocity and pipe length influence the process less. Singh et al. (2017) concluded that longer pipes with smaller diameter achieve better heat transfer, but lead to a higher pressure drop [32]. Typical diameters used are about 0.05–1 m, while lengths of horizontal pipes are usually 30–70 m. In addition, the thermal performance decreases for high air velocities (typical values are about 2–5 m s−1) [33,34]. Bansal et al. (2012) observed that the temperature drop occurs faster at the beginning of the pipes and becomes moderate later [35], probably due to the higher temperature difference between the air and the soil [36].
Horizontal arrangements buried into a depth of 1–2 m, are usually found to be more cost-effective and are frequently installed when enough land space is available. Vertical arrangements, on the other hand, have higher investment cost and the pipes are buried in a depth of 50–150 m to 500 m. Serial connection has been seen to have better results than parallel, although more pumping power is required, while better performance has been obtained with spiral loops than with straight tubes [25]. Finally, the distance between the pipes affects the mean fluid temperature [37], and the optimal distance between tubes is found to be about 1.5 m [38].
The primary objective of the study presented here is to verify if the proposed idea can constitute a technically viable alternative to existing wet-cooling technologies for a 20 MW solar thermal power plant. An initial modelling of Earth CATs is developed based on the design parameters of EAHE systems but on a large-scale. The viability of the idea is analyzed using computational fluid dynamics (CFD) with the ANSYS® 19 R1 Fluent software, considering the ground temperature of the Iberian Peninsula (a region susceptible to extremely high water stress) and through sensitivity analyses of the geometry and flow conditions of the pipes. The parameters studied for the purpose of the work here are presented in the Section 2 below.

2. Methodology

2.1. Scale of the Design

For the application of Earth CATs, a 20 MW concentrated solar plant is considered. At the inlet of the turbine of the plant, a pressure of 100 bar and a temperature of 355 °C are considered. The steam exists the steam turbine with a pressure of 0.06 bar and a temperature of 36.2 °C. To produce 20 MW under the indicated operating conditions, 16.2 kg s−1 of steam flow are necessary in the Rankine cycle [39]. With the rise of the air temperature in the air condenser set to 10 K, the temperature difference between the steam at the outlet of the turbine (36.2 °C) and the temperature of the air at the outlet of the condenser is somewhat higher than 1 K. For these conditions, the air flow rate is approximately equal to 3956 kg s−1. The temperature of the cooling air at the inlet of the condenser (that is, at the outlet of the buried pipes) is set to 25 °C. Figure 1 shows a simplified scheme of a pipe connected to the considered air condenser with the flow conditions of both incoming and exiting air and steam streams.
The design of the system requires electricity for moving the air through the pipes (fans that compensate for the pressure losses within the condenser and ensure a minimum pressure of 1.1 bar at the outlet), as well as filters for eliminating dust particles and dryers for avoiding mildew formation due to condensation of humidity that could damage the pipes. Pressure losses of filters and dryers are not accounted in this work. All of the electrical requirements accounted for are assumed to be provided by the power plant itself.

2.2. CFD Modelling

2.2.1. Geometry

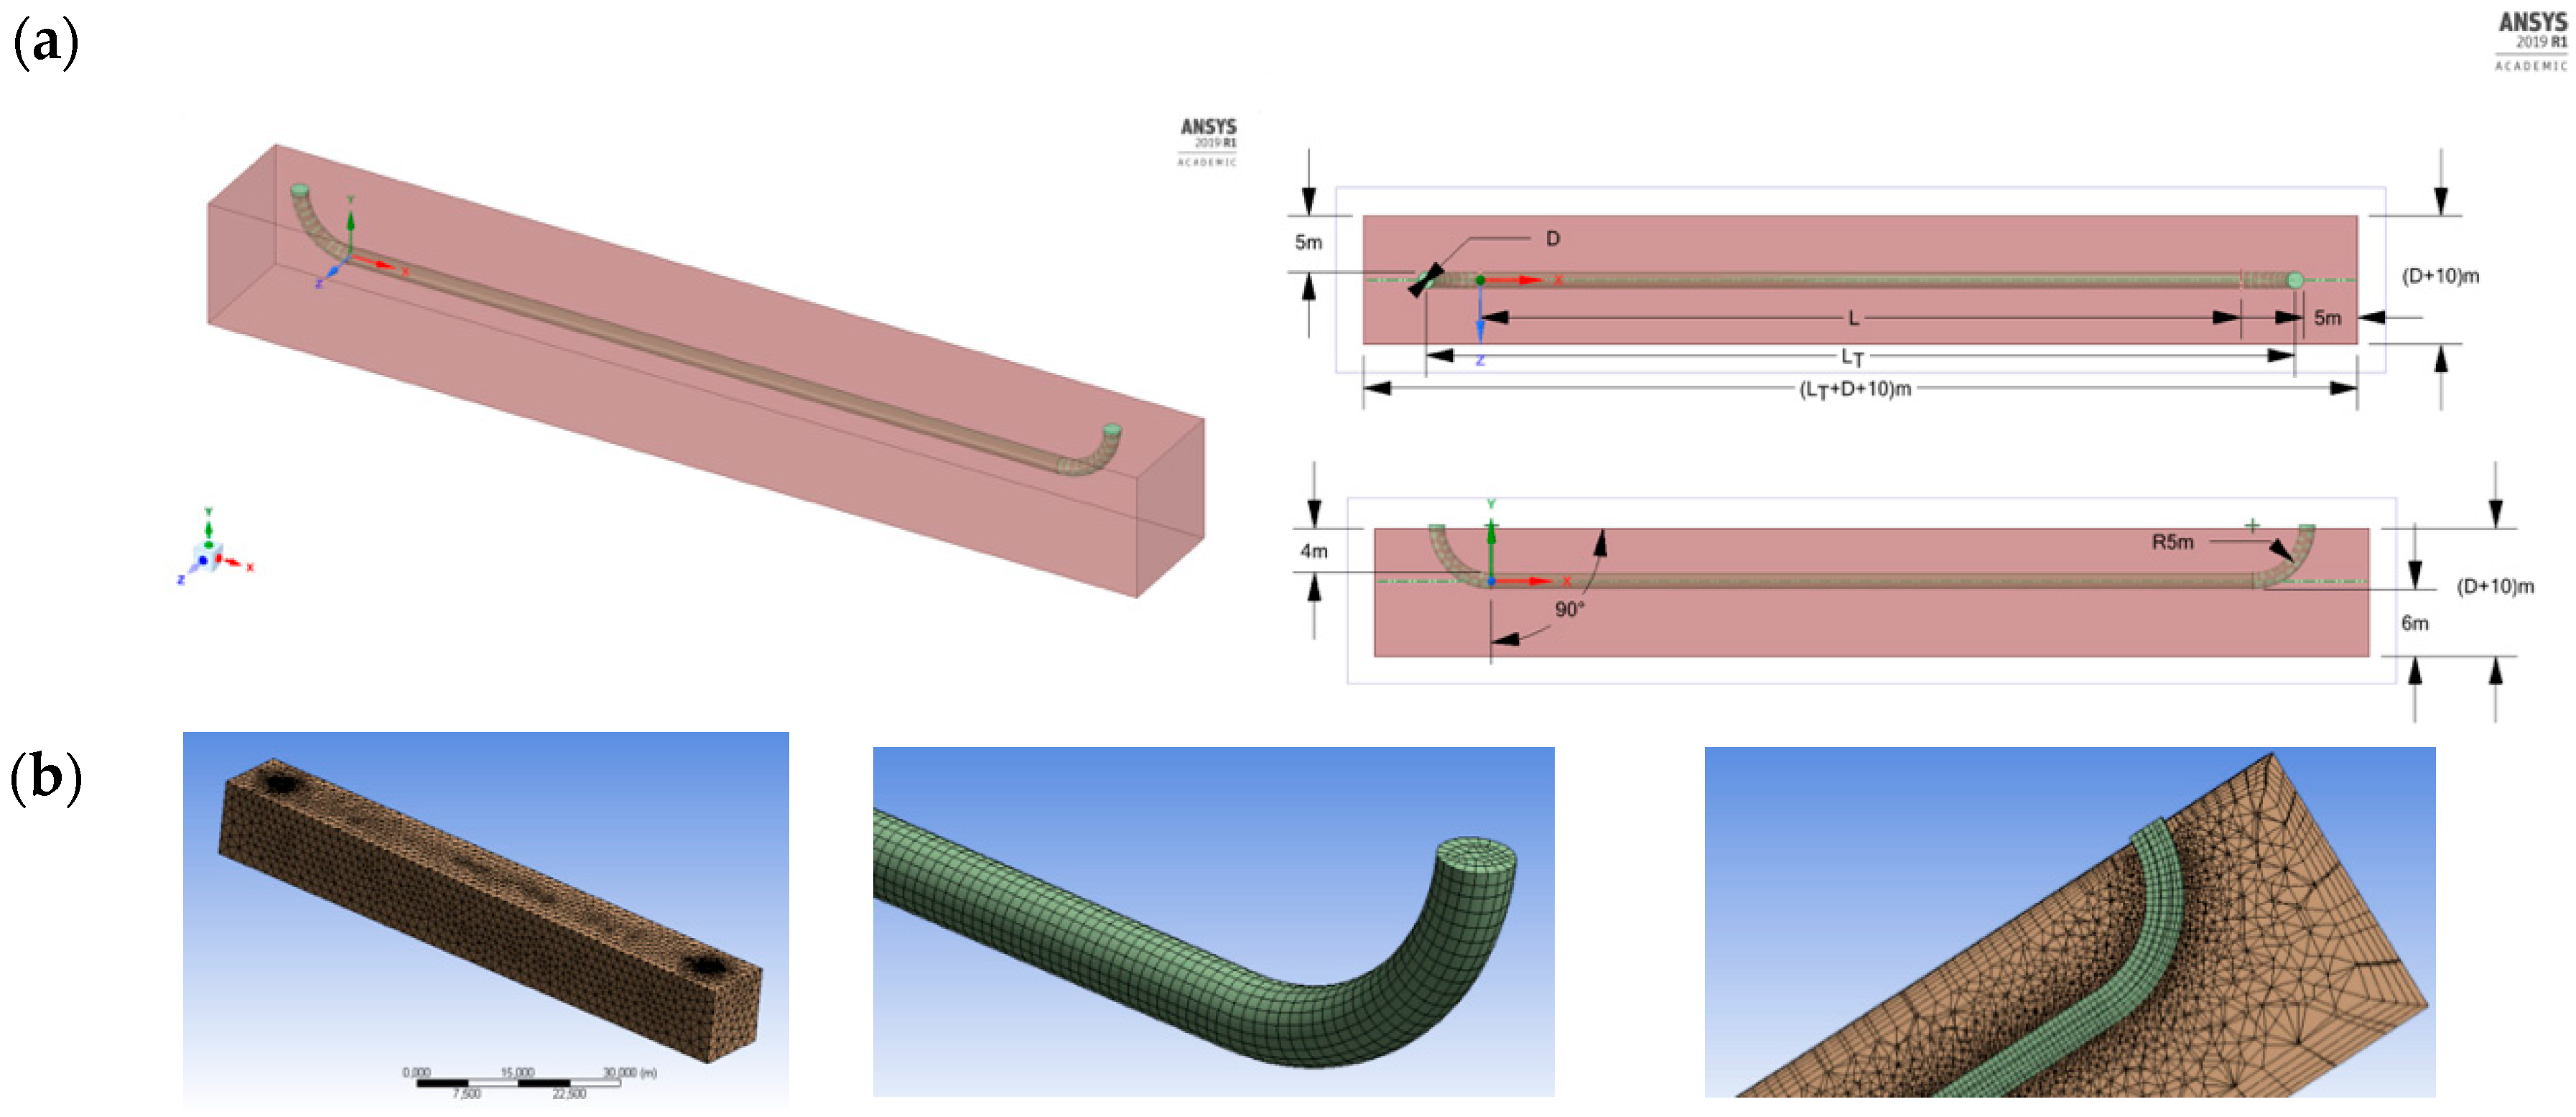
The ANSYS® geometry software has been used for drawing an open-loop horizontal pipe surrounded by a rectangular volume representing the soil. Open loop is selected due to its greater simplicity compared to a closed-loop system, while horizontal arrangement is selected because of its more cost-effective and easier construction, assuming that enough land space is available around the studied power plant. The connection between the pipe and the soil is solved by the interference and the share topology options. The horizontal distance between a pipe and the limits of the soil is 5 m, the distance to the bottom of the soil is 6 m and the buried depth is 4 m. Panel (a) of Figure 2 shows the geometry of the model.

2.2.2. Mesh

For the meshing process, CFD physics and Fluent solver preferences have been selected and both tetrahedral (soil) and hexahedral (pipe) elements have been used. The element order is controlled by the program with a growth rate of 1.2, while curvature and proximity have been captured. An automatic inflation with smooth transition has been used. By controlling the element size, the number of elements and nodes has been varied in order to get a good quality mesh. In addition, orthogonal quality and skewness have been analyzed [40]. Panel (b) of Figure 2 shows the mesh obtained for a specific geometry of the pipe.

2.2.3. Materials and Boundary Conditions

All material properties (shown in Table 1) have been considered isotropic and constant [41]. For the pipe, PVC has been selected based on most references found in literature and because of its economical and constructive advantages. No specific properties from a specific type of soil have been selected.
The boundary conditions set the parameters of the different surfaces comprising the geometry. Specific parameters have been defined at the inlet and outlet of the pipe, as well as at the wall of the pipe and the limits of the soil. The inlet temperature of the air is the ambient temperature. As described in Section 2.1, fans are used to move the air through the pipes and ensure a pressure at the inlet of the condenser enough to compensate the losses. Therefore, a gauge pressure of 8675 Pa (that is, an absolute pressure of 1.1 bar) is set as the outlet boundary condition. Regarding the soil, a temperature of 20 °C at 4 m depth is defined as an average estimation for the Iberian Peninsula [42]. The considered boundary conditions are summarized in Table 2.

2.2.4. Solver

A pressure-based and steady-state solution has been calculated. A pseudo-transient COUPLED solver with hybrid initialization has been applied in order to get good equilibrium between the simulation time and the robustness of the convergence [43]. All default parameters of the solver have been selected, while the convergence criterion for all of the equations has been set to 1 × 10⁻⁶ for a maximum of 1000 iterations. Details related to the three-dimensional numerical modelling used to solve the air flow dynamic and the heat transfer process between the air, the pipe, and the soil are presented in the Appendix A of the paper.

2.2.5. Grid Study

A grid study is realized to ensure that the mesh of the model is good enough to obtain accurate results. The results will be accurate and independent from the size of the mesh with more elements and nodes, but the computational effort will be higher as well. Therefore, a good equilibrium between a grid independent model and the computational effort required for the convergence of the solution has to be found.
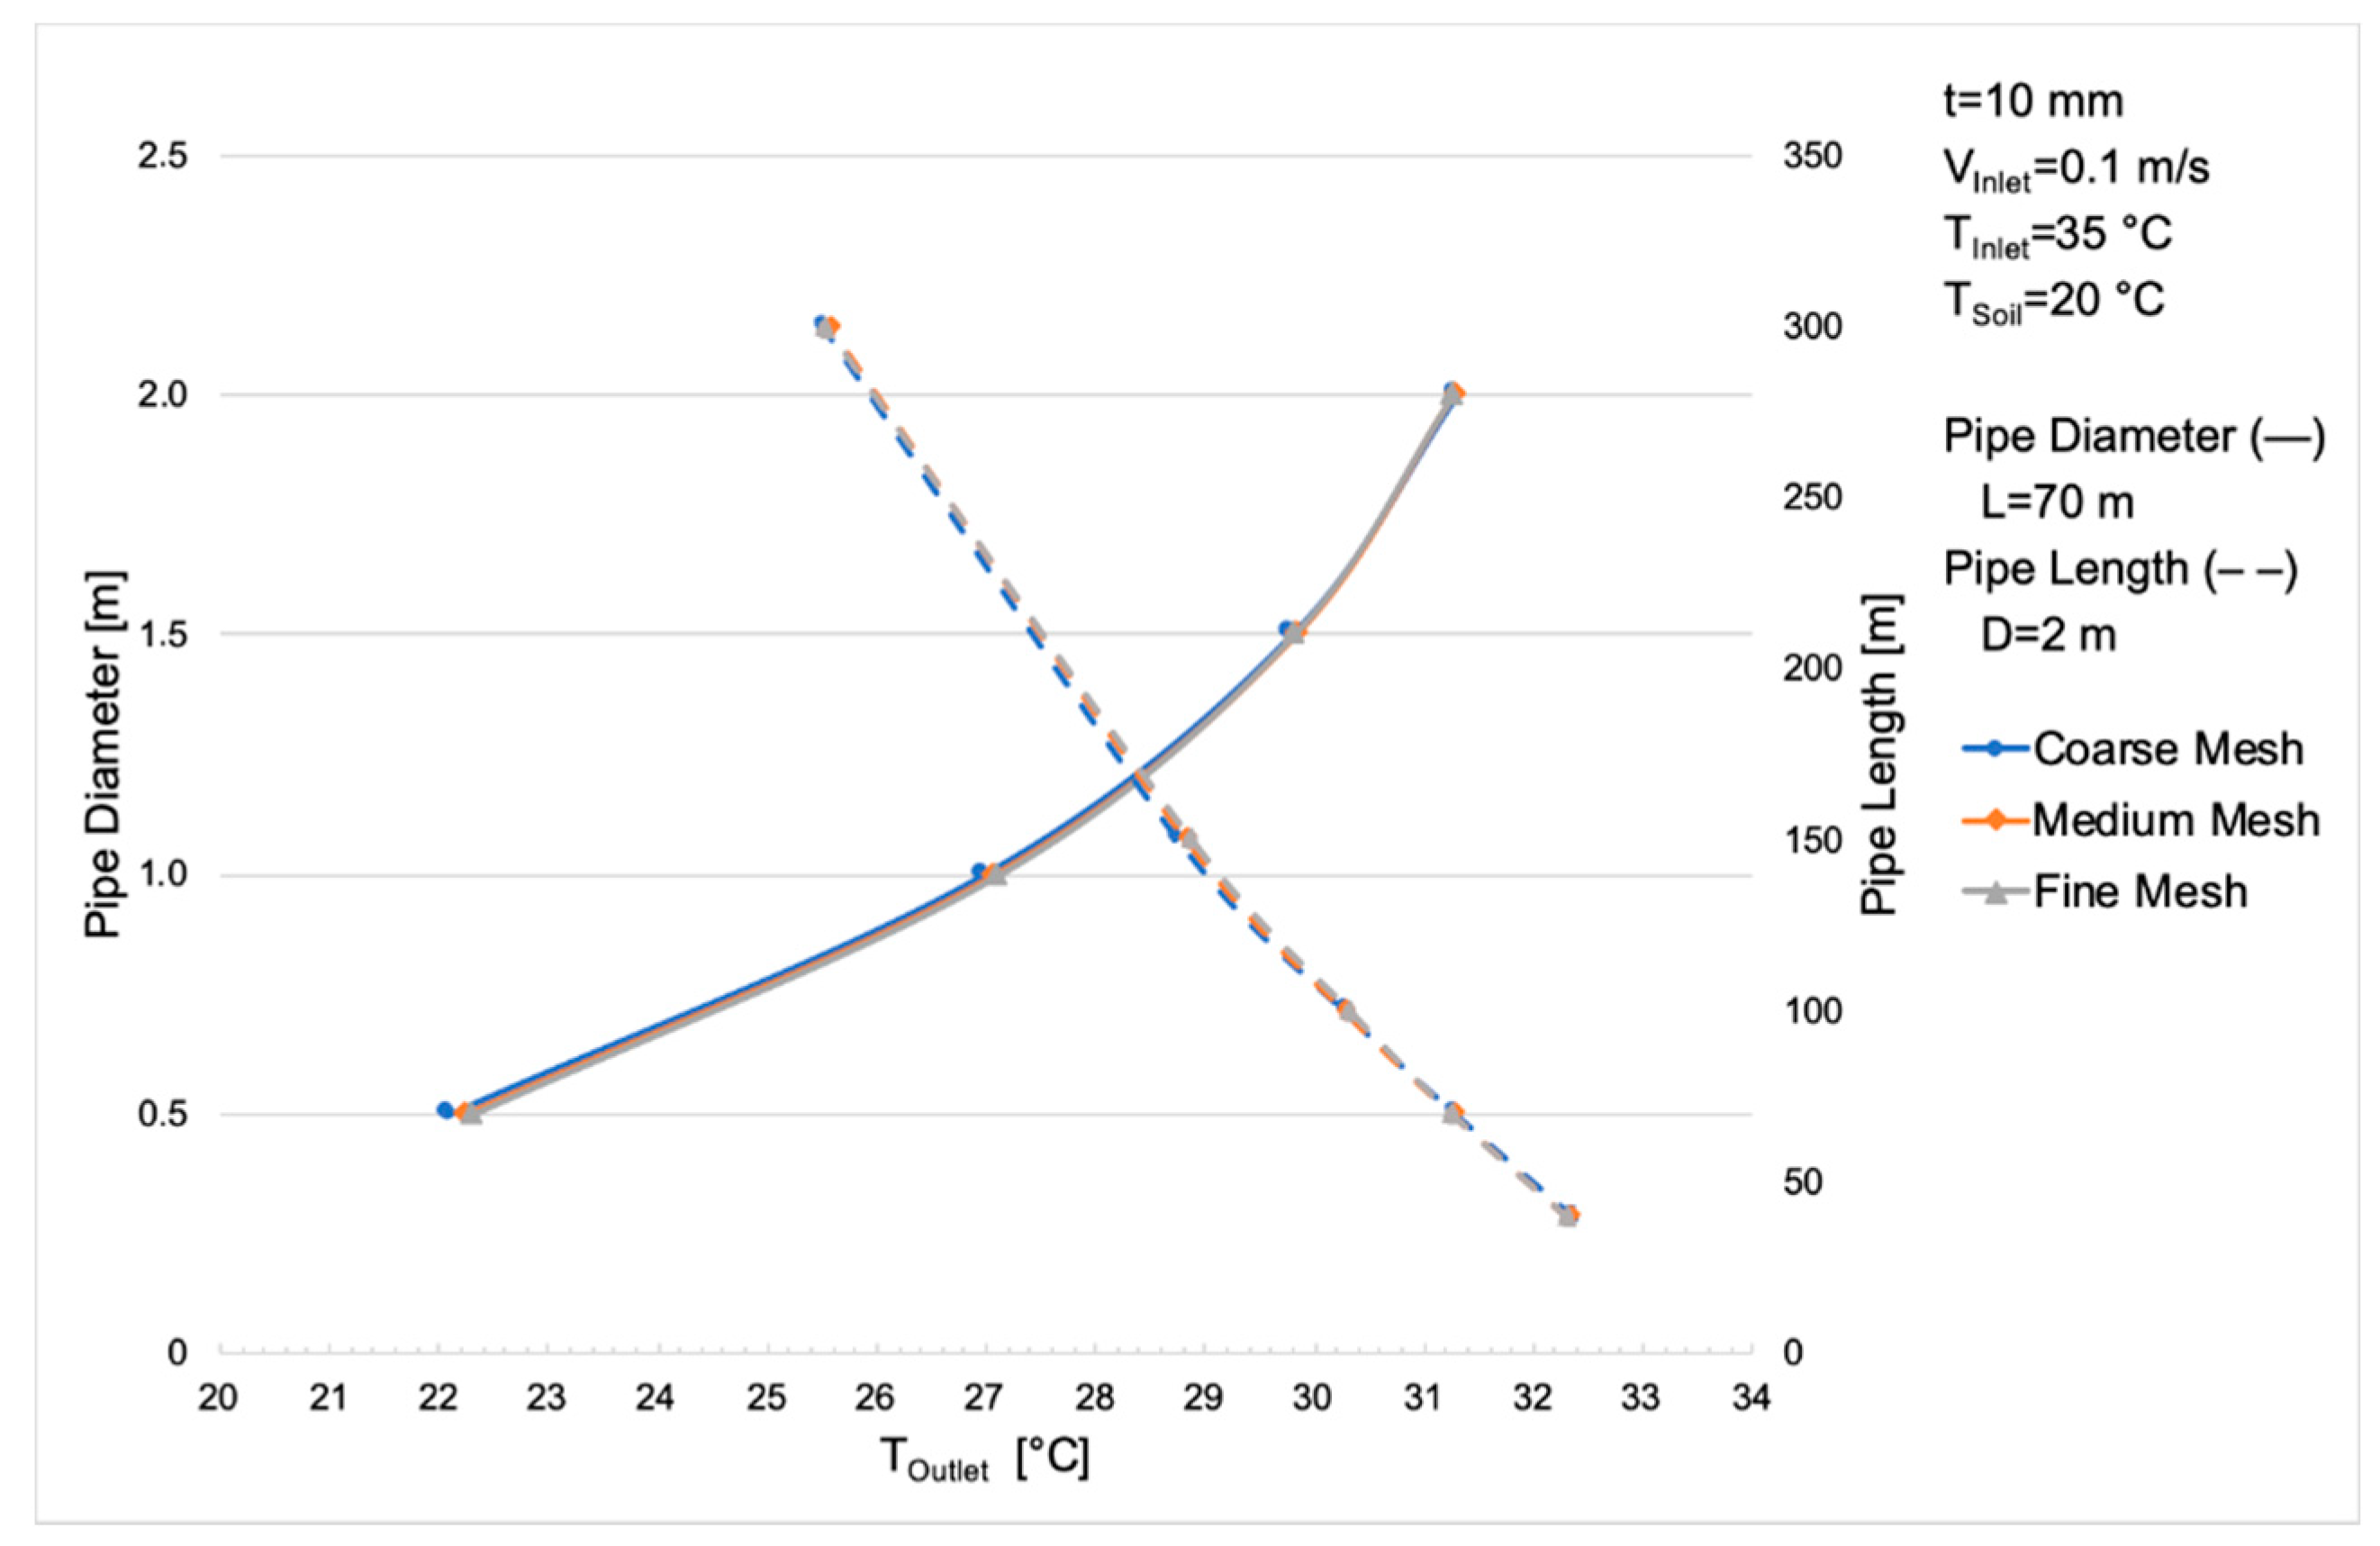
In the present model, a grid study has been developed for different pipe diameters and lengths (Figure 3) in order to ensure that the quality of the mesh is maintained during the sensitivity analyses of Earth CATs. The air temperature at the outlet of the pipe is then analyzed.
A coarse mesh of about 180,000 elements, a medium mesh of about 370,000 elements and a fine mesh of about 500,000 elements have been tested for each geometry. As it can be observed, almost no difference is appreciated in the results, so it is concluded that the model is independent of the mesh. Finally, a mesh of about 460,000 elements (depending on the size of the pipes the number of elements slightly varied) has been used for each geometry, since the computational effort was acceptable and quality parameters are seen to be better than with fewer elements.

2.2.6. Model Validation

Before starting the sensitivity study of Earth CATs, the CFD model has been validated using published studies. Specifically, two model validations were realized:
Model validation 1:
The model is first validated with experimental results published by Bansal et al. (2012) [44] for a pipe with an inner diameter of 0.15 m and a length of 23.42 m. These results were also used by Belatrache et al. (2017) [45], Barakat et al. (2016) [41], and Benhammou et al. (2015) [46] to validate their numerical models. The outlet temperature of the air is then analyzed by calculating the relative error with each reference. In addition, the total pressure drop is compared with the theoretical pressure drop ( Δ p ) along a smooth pipe, according to the following equations [33]:
Δ p = f ( R e )   ×   L P D P   ×   ρ A   ×   V 2 2
f = ( 1.82   ×   log R e 1.64 ) 2
R e = ρ A · V · D P μ A
where L P and D P are the length and the diameter of the pipe, respectively, ρ A is the density of the air considered here equal to 1.225 kg m−3, V is the velocity of the air, f is the Darcy friction factor for a Reynolds number ( R e ) greater than 2300, and μ A is the dynamic viscosity of the air, considered here equal to 1.8 × 10⁻⁵ kg s−1 m−1. For a pipe with a length of L P , the length of the curvature at the inlet and the outlet of the pipe is considered.
A grid study has been previously developed for getting a good quality mesh. Then, four simulations are tested varying both the inlet temperature and the flow velocity of the air, for a soil temperature of 26.70 °C (the material properties are those of Table 2). The results obtained are shown in Table 3.
The results show good agreement with the references, showing a maximum relative error equal to 6.32%. A very good agreement is achieved with the experimental results of Bansal et al. (2012) [44], with the minimum relative error equal to 0.09% and the maximum equal to 5.08%. Slight differences between geometries have to be considered when analyzing the relative errors between results. For the total pressure drop, there is also good agreement with the theoretical values obtained from Equations (1)–(3), with all the differences being less than 10%.
Model validation 2:
In addition to the first model validation, our model is also validated with the results obtained by Barakat et al. (2016) [41]. Their work was selected because they used EAHE systems in a thermal plant, specifically for cooling the air of a gas turbine and because the geometry and flow parameters of the system are presented. Material properties and boundary conditions are summarized in Table 4 and Table 5, respectively.
The published results for different pipe lengths, pipe diameters and inlet velocities have been taken and compared with our model (Table 6). The total pressure drop along the smooth pipe is also analyzed. Differences between our results and those of the model of Barakat et al. are greater than in the first model validation, but almost every result has a relative error less than 10%. Specifically, the minimum difference between calculated temperatures is found to be equal to 0.71% and the maximum equal to 11.70%. For the total pressure drop, we find a maximum difference of 14%. Again, slight differences between geometries have to be considered when analyzing the differences between the obtained results. Overall, it can be concluded that the developed CFD model can properly predict the performance of EAHE systems and can be applied to design Earth CATs in the present study.

2.2.7. Sensitivity Study

The objective of the design presented in this work is to obtain a temperature of 25 °C at the outlet of the Earth-CAT when the incoming ambient air temperature (and the temperature of the air exiting the air condenser) is 35 °C. The total air flow of 3956 kg s−1, required by the scale of the design, is divided among a certain number of parallel pipes according to the following equation:
m ˙ A = N P · π 4 D P 2 · ρ A · V
The relationship between the number of parallel pipes N P , the diameter D P and the flow velocity V is N P · D P 2 · V 4112 . The objective is not only to cool the air down to the desired temperature but to also achieve it with the minimum number of pipes through an optimal diameter and flow velocity, as well as an acceptable length and pressure drop. This will help us to reduce the land space and the economic costs of the overall project.

3. Results and Discussion

Section 3.1, Section 3.2, Section 3.3, Section 3.4 and Section 3.5 show the results of the sensitivity analyses realized, while Section 3.6 discusses the proposed model and its performance.

3.1. Pipe Diameter

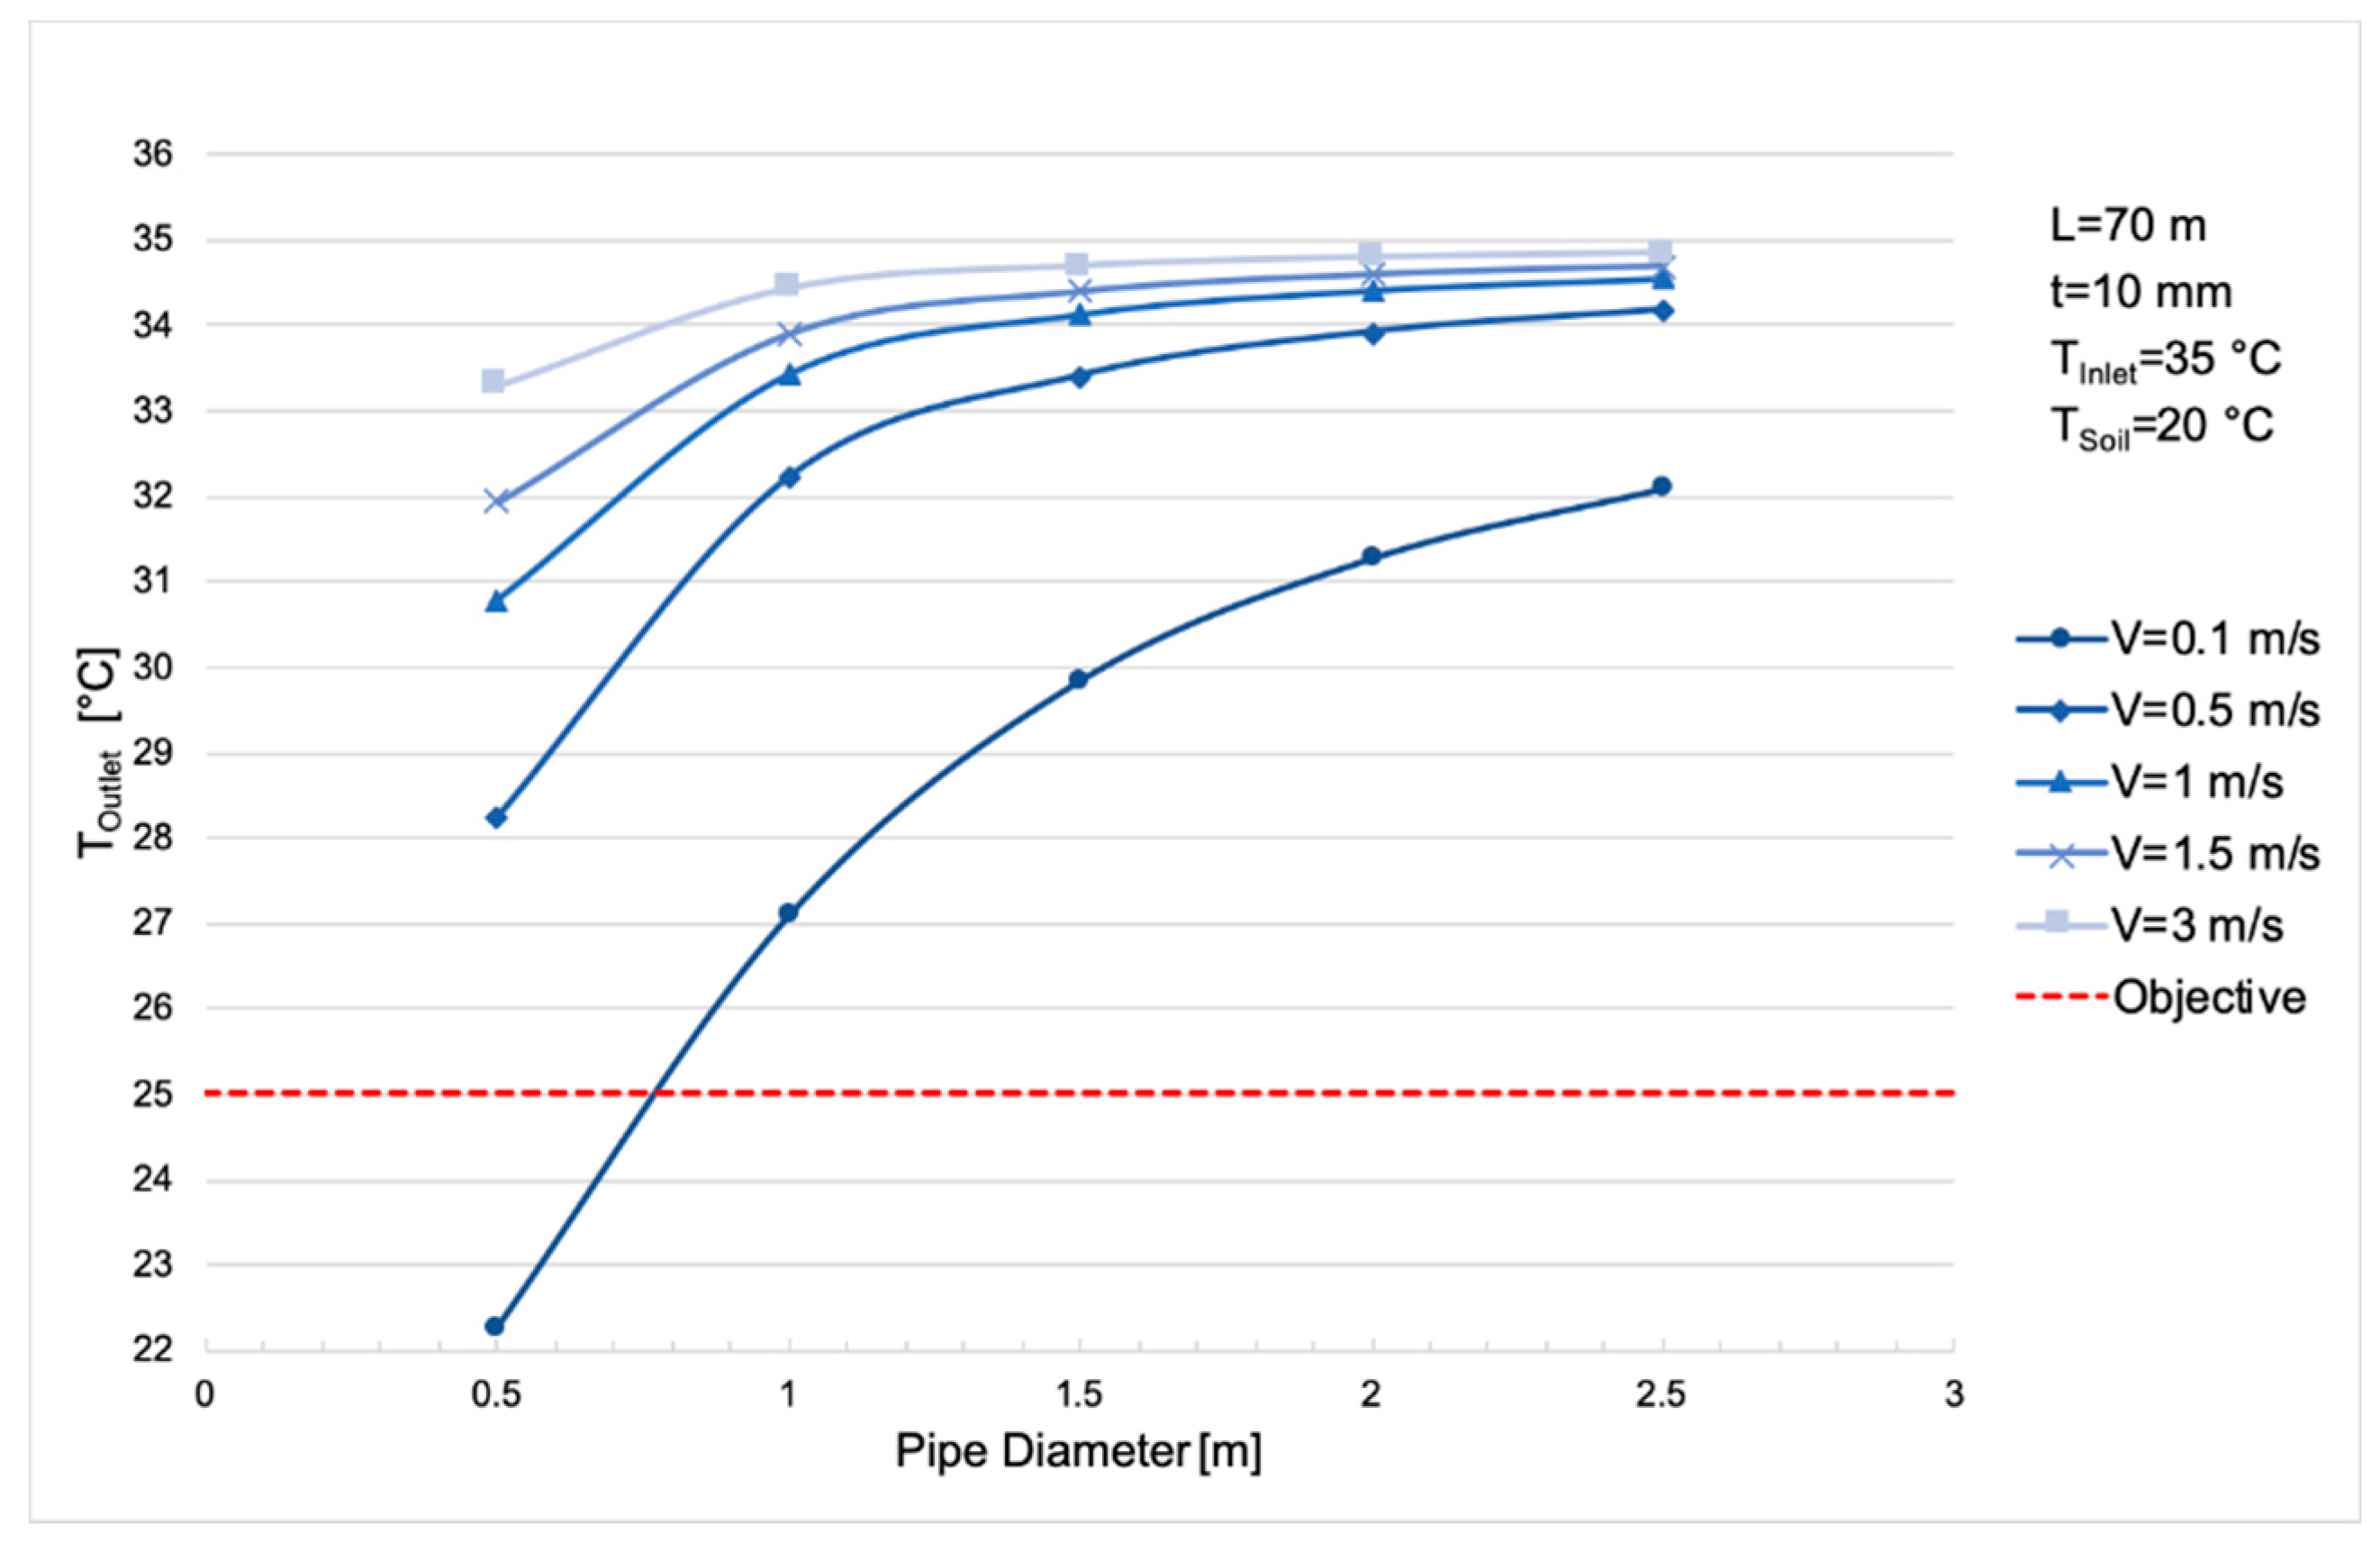
Figure 4 shows the variation of the outlet temperature with the pipe diameter and the flow velocity for a pipe with a length of 70 m and a thickness of 10 mm.
In accordance with published EAHE studies, smaller diameters and lower velocities increase the temperature drop, since less mass of air is flowing through the pipe. In other words, a greater air volume comes into contact with the surface area of the pipes during more time than in the case of bigger diameters and higher velocities. By reducing the diameter of the pipes, the surface area is reduced, but the ratio area-volume of the pipes is higher than with big diameters. Trying to increase the contact surface area between the pipes and the air by, for example, corrugated walls, is an important parameter to be studied for the enhancement of heat transfer. The cooling capacity of the system is very low for velocities from 1 to 3 m s−1 and diameters from 1.5 to 2.5 m. For a pipe diameter of 3 m, there have been convergence problems. Table 7 summarizes the quantitative results.
Based on these results, it is necessary to analyze which design is more effective: small diameters together with high flow velocities or, on the contrary, big diameters together with low flow velocities. The first design will require more pipes, but perhaps less land space and the system might be less complex due to the size of the pipes. Although the best performance would be achieved for small diameters together with low flow velocities, this design has not been considered, as this design would require a very high number of pipes, occupying a large surface area and strongly reducing the overall economic viability of the project. The next step of the design is to analyze how the cooling capacity of Earth CATs can be improved by increasing the pipe length together with the flow velocity.

3.2. Pipe Number and Length

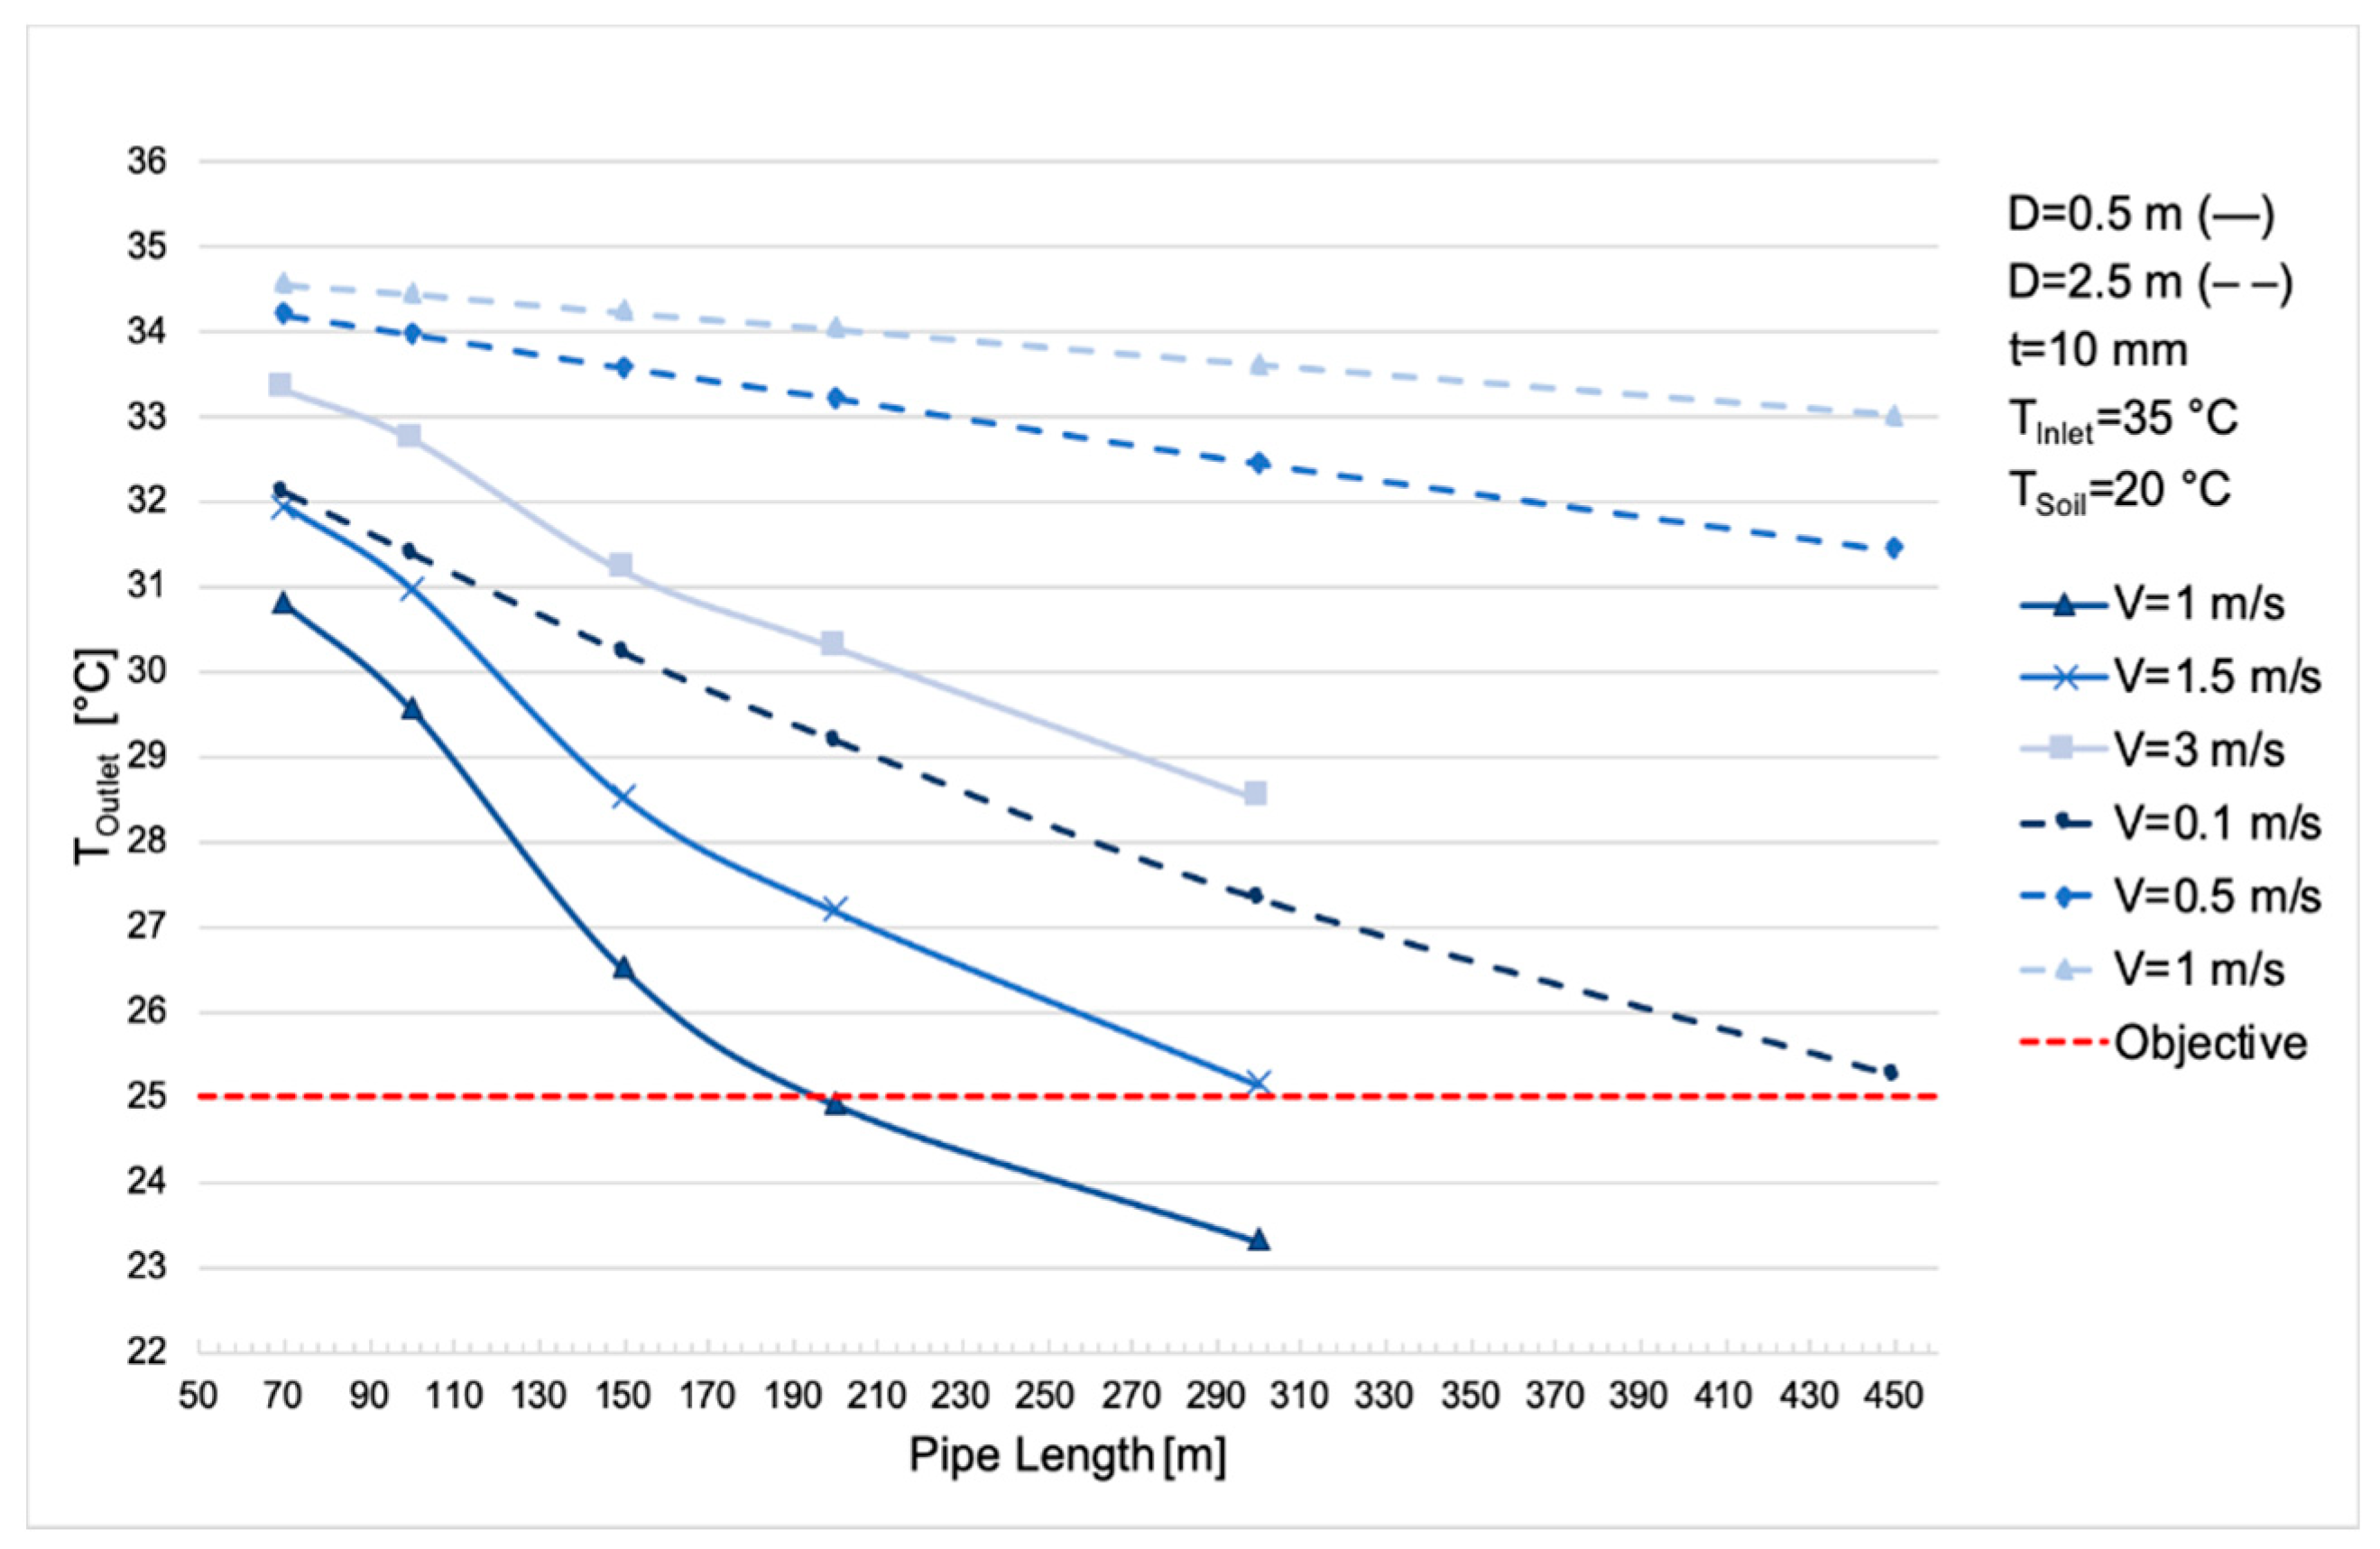
Figure 5 shows the variation of the outlet temperature with the pipe length and the flow velocity for diameters of 0.5 m and 2.5 m.
Longer pipes improve the cooling capacity because the air stays in contact with the surface area of the pipes during more time, as occurs with EAHE systems. Flow velocities of 1, 1.5 and 3 m s−1 are analyzed for a diameter of 0.5 m; the objective of 25 °C is reached for a flow velocity of 1 m s−1 and a 200 m pipe, and for a flow velocity of 1.5 m s−1 and a pipe length of 300 m. This last design of 1.5 m s−1 and 300 m would require 10,965 pipes for the studied 20 MW concentrated solar plant. For the pipe diameter of 2.5 m, the objective is reached by a 450 m length and a flow velocity of 0.1 m s−1, for which 6579 pipes would be required. The pressure drop is increased with the pipe length and the flow velocity.

3.3. Pipe Thickness, Pipe Material, and Distance between Pipes

The influence of the pipe thickness is analyzed for an intermediate pipe with a diameter of 1.5 m and a length of 150 m. Thickness is seen to have a very slight influence on the performance of the system [47]. This is due to its very small magnitude, when compared to the soil surrounding the pipe. For the same reason, the material of the pipe has no influence on the cooling performance and a cheap material like PVC can be used [48].
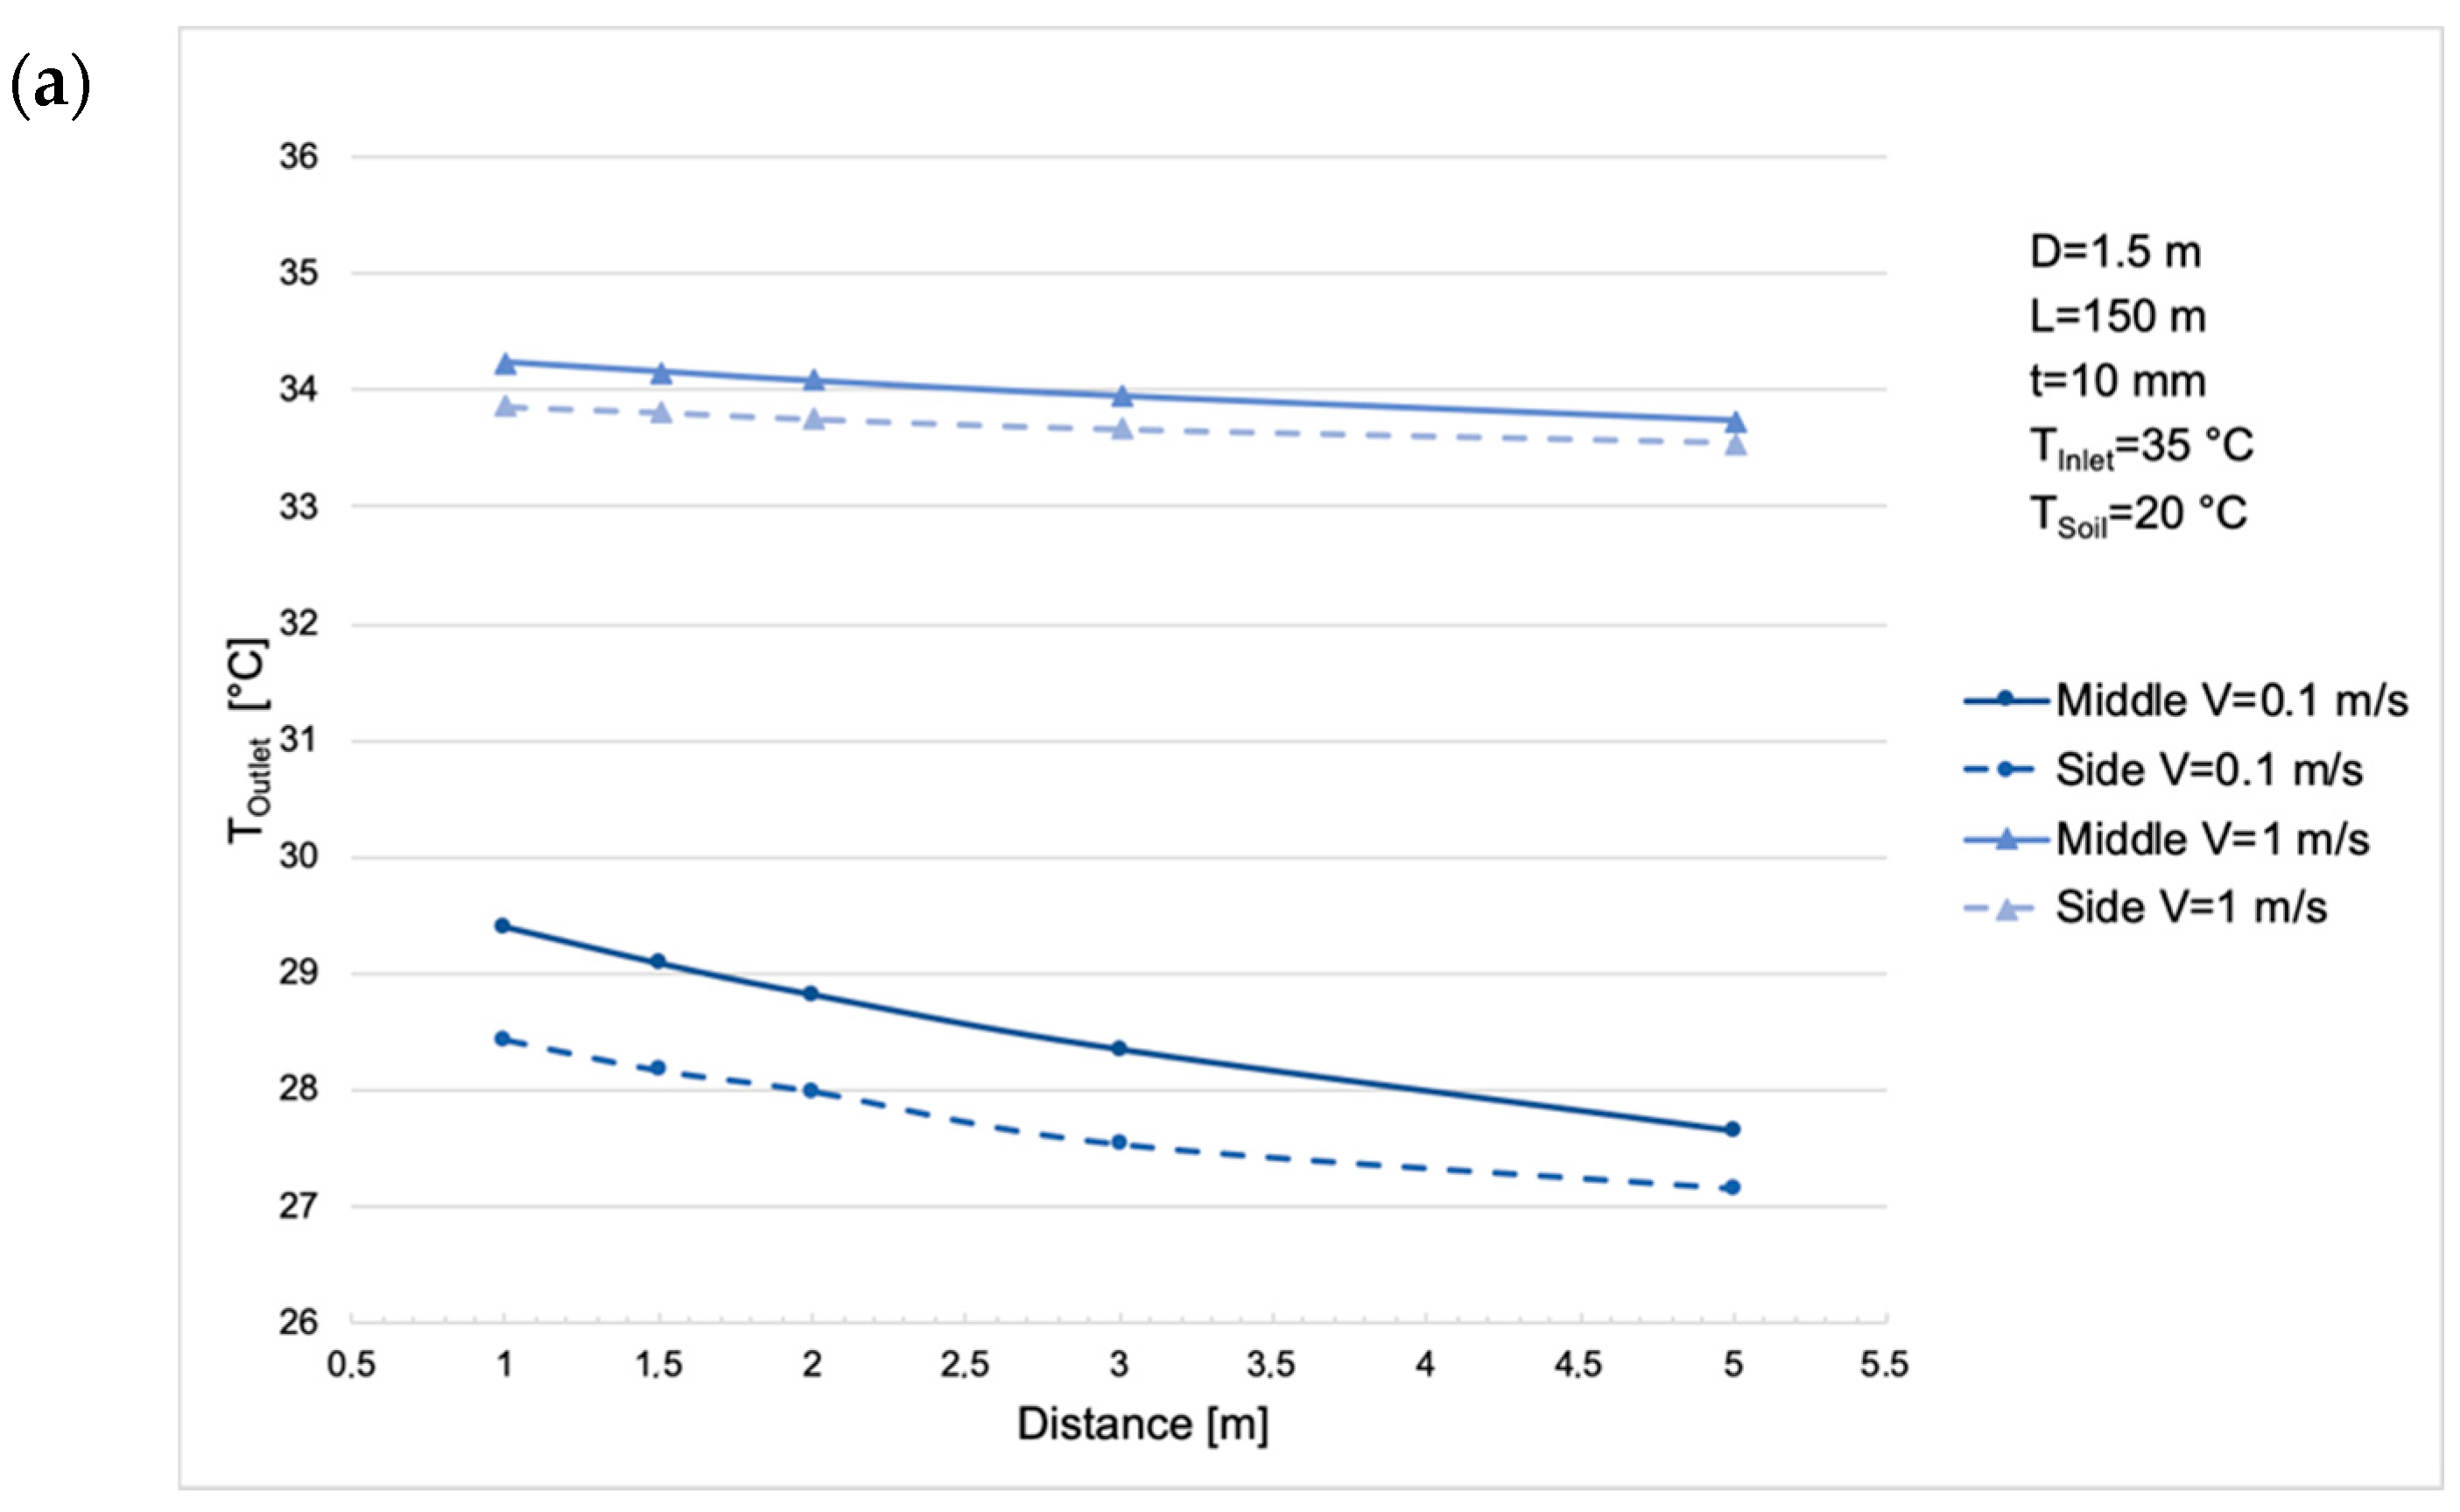
Panel (a) of Figure 6 shows the influence of the distance between three pipes. As previously, an intermediate pipe with a diameter of 1.5 m and a length of 150 m is used. Two flow velocities (0.1 m s−1 and 1 m s−1) and a distance of 1, 1.5, 2, 3, and 5 m are studied. The mean outlet temperature of the three pipes is found to be somewhat higher than before and, at the same time, the middle pipe results in a higher outlet temperature than the side pipes. When the flow velocity is 0.1 m s−1, the outlet temperature decreases by about 1.5 °C when the distance between the pipes is increased from 1 m to 5 m. When the flow velocity is 1 m s−1, the influence of the distance becomes somewhat less noticeable, and the outlet temperature of the middle pipe gets closer to that of the side pipes.

3.4. Inlet and Pipe Wall Temperature

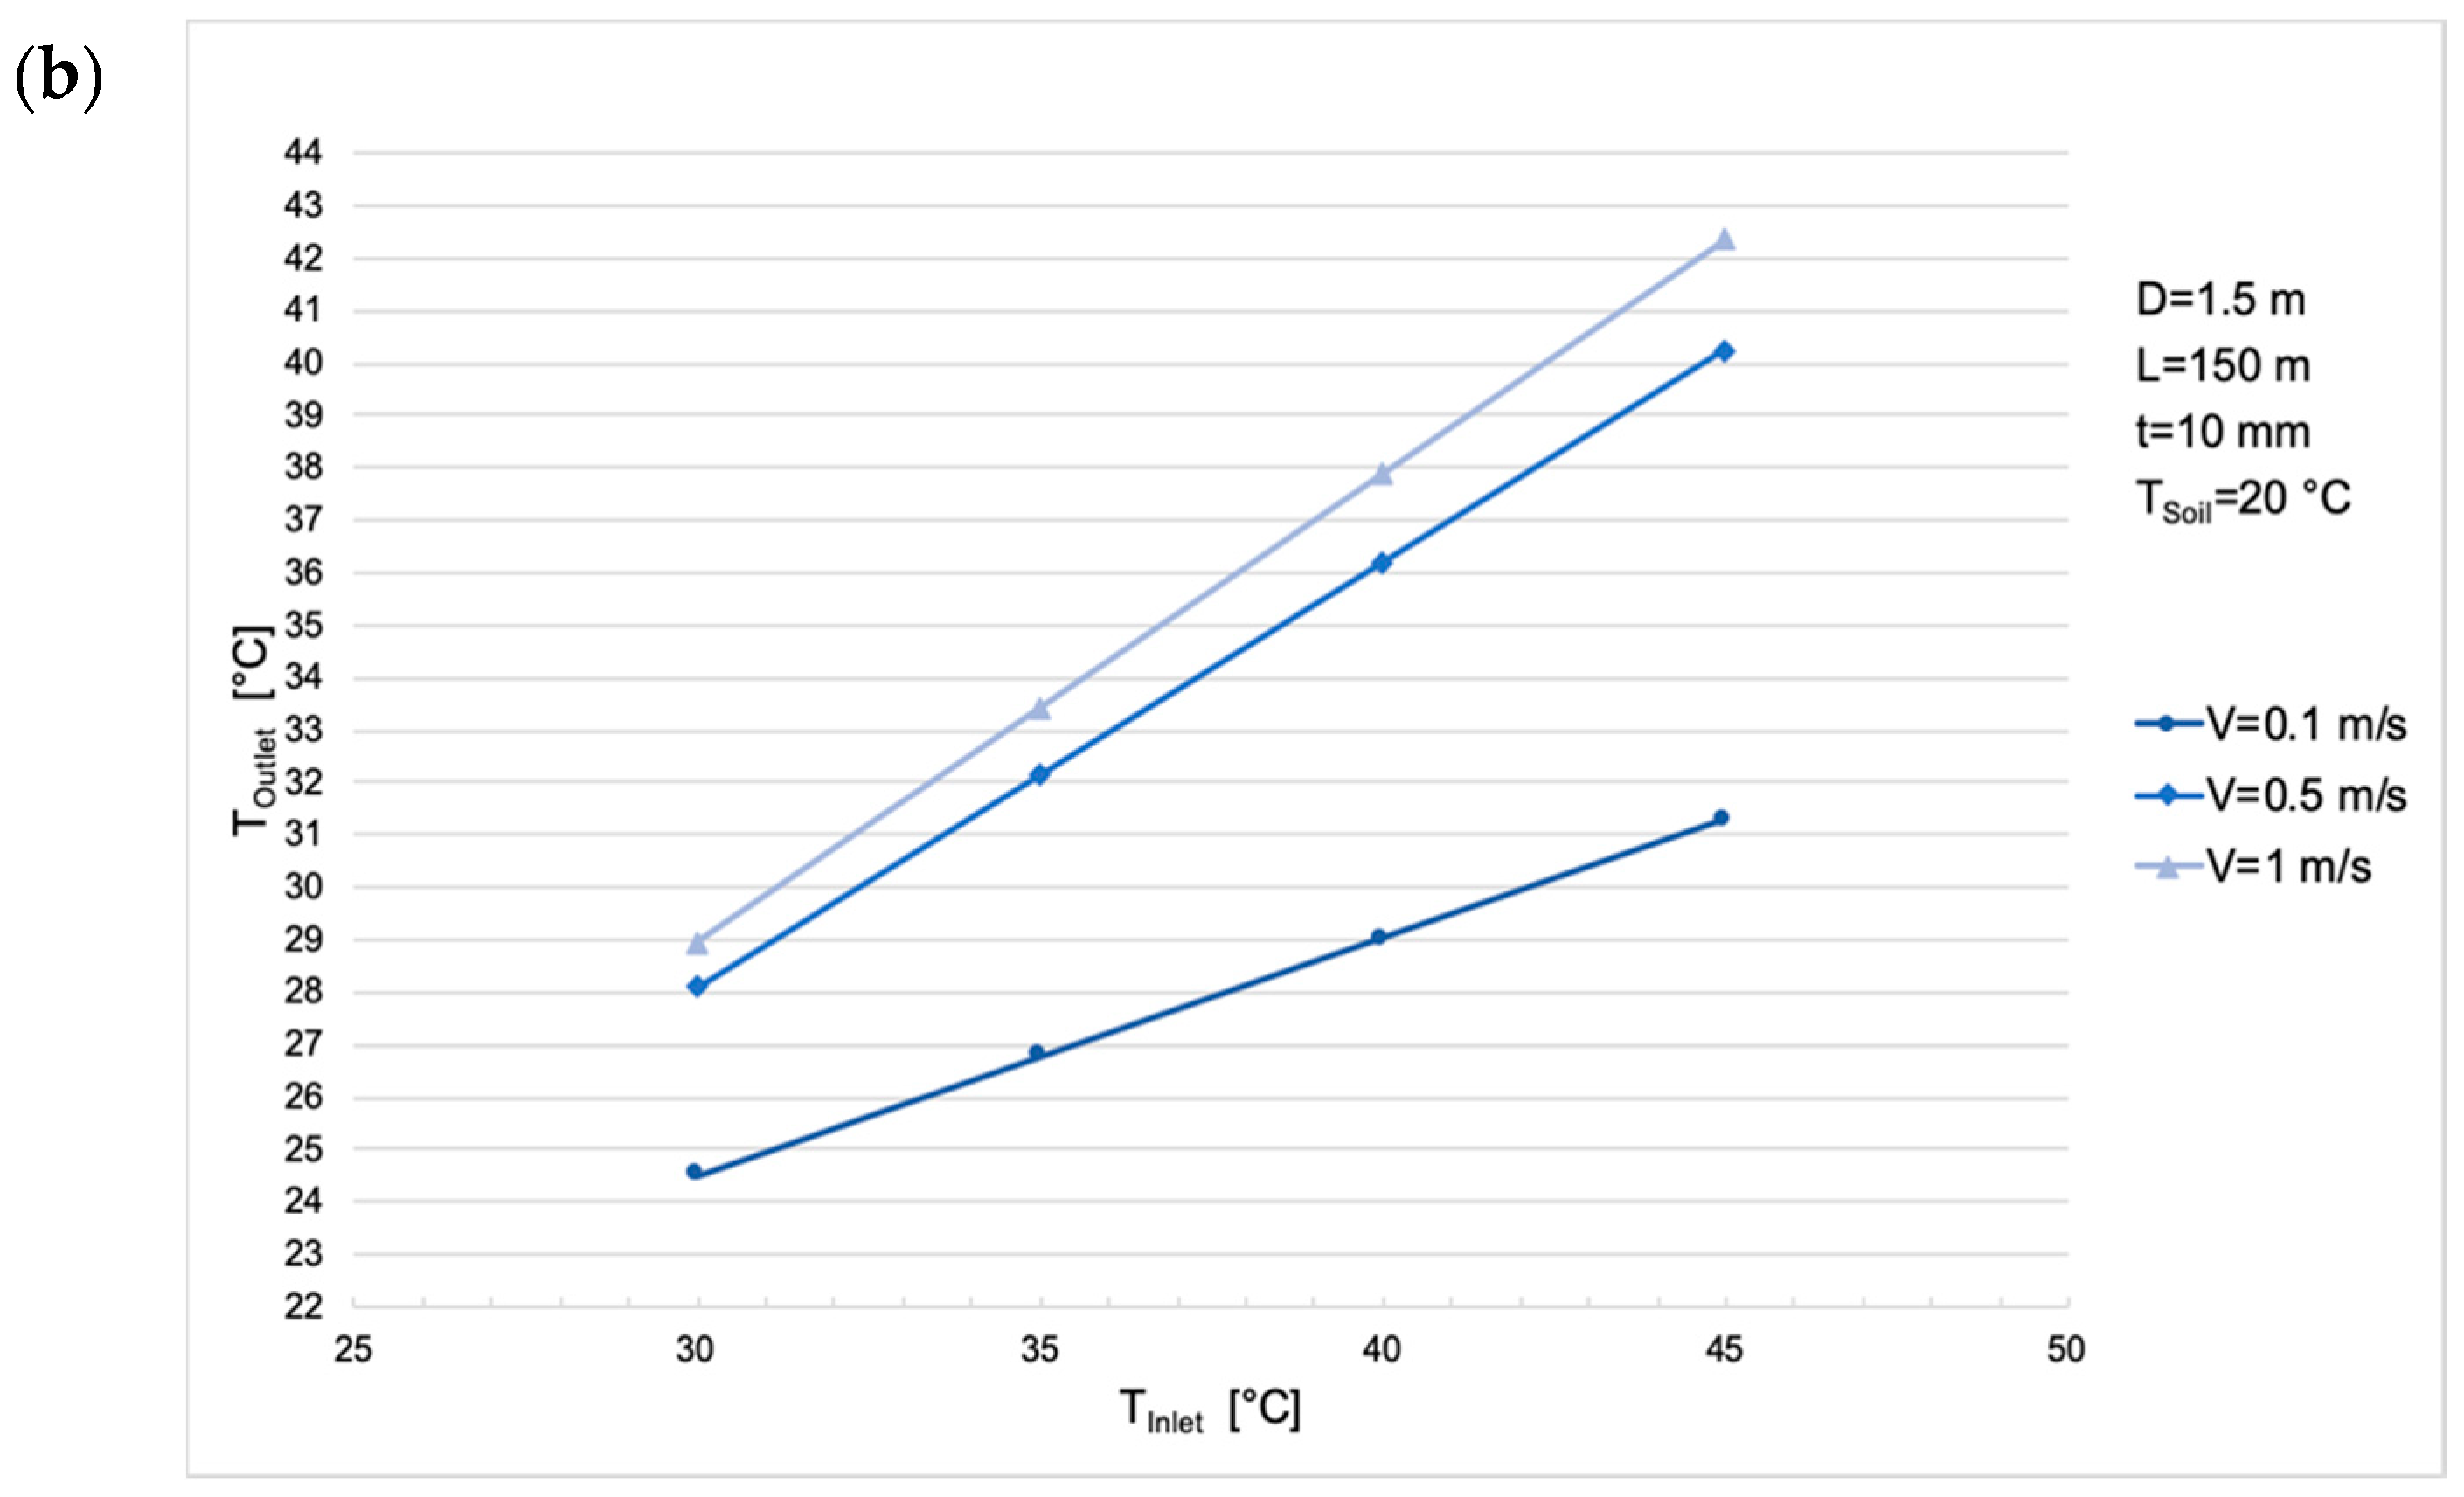
The cooling performance of a pipe based on the inlet air temperature is shown in Panel (b) of Figure 6 for the intermediate pipe with a diameter of 1.5 m and a length of 150 m. When the flow velocity is 0.1 m s−1, the temperature drop is almost 14 °C and 11 °C for inlet temperatures of 45 °C and 40 °C, respectively, while for lower ambient temperatures (30 °C) the objective of 25 °C is reached. For velocities of 0.5 m s−1 and 1 m s−1, the thermal performance is very low, which shows the importance of selecting the appropriate air flow for the designed pipe. In addition, the temperature of the pipe wall is found to have the same temperature as the flowing air, as the air flows through the pipe; warmer at the beginning and colder at the outlet.

3.5. Soil Temperature

The effect of Earth CATs on the soil temperature is qualitatively analyzed. At higher velocities, a larger volume of the soil around the pipe is heated. This is because the air has more thermal energy due to its greater mass flow. In this case, the air is less time in contact with the ground through the pipes and this is why the temperature drop of the air is lower [44]. Figure 7 shows the volume of the soil that reaches a temperature of 21 °C or more around the pipe. The results show that, although the soil close to the pipe is heated and will get warmer for higher flow velocities, most part of the soil volume (i.e., the volume not shown in the figure) remains between 21 °C and the initial 20 °C. Thus, according to the obtained steady-state solution, the soil seems to be able to dissipate the heat overall and the temperature of the soil surrounding the Earth CATs barely increases after a certain distance from the pipes. However, how the temperature of the soil between the parallel pipes is affected must be further analyzed, with the objective of sustaining constant system performance.

3.6. Viability of the Design

An initial Earth-CAT comprised of PVC pipes with a diameter of 0.5 m and a length of 300 m length with flow velocities of 1.5 m s−1 is proposed here for the studied 20 MW concentrated solar power plant. This design is chosen because it requires a relatively smaller surface area around the plant, when compared to other alternatives, and because it achieves its operational objective: with the set parameters, the temperature of the air is decreased from 35 °C to 25.13 °C.
Pipes with a diameter of 0.5 m, length of 300 m and air flow velocity of 1.5 m s−1, would lead to an Earth-CAT including 10,965 pipes. It is seen that the outlet temperature of the air increases when the pipes are arranged in parallel, so an optimal distance between the pipes must be selected. In order to reduce the required space, pipes are also chosen to be arranged in parallel in both the horizontal and vertical directions, increasing the depth of the system to 10–15 m. Five parallel pipes installed vertically with a 1 m distance would need a depth of 10.5 m. A sketch of this piping arrangement is shown in Figure 8 (only three sets of pipes are shown in the horizontal direction). In this case, the total horizontal surface is found to be 3.3 km × 300 m, that is a surface of 99 hectares (assuming a horizontal distance between the pipes of 1 m). Such a horizontal surface is almost half that needed by the 20 MW concentrated solar plant Gemasolar located in Seville (Spain) (the plant covers a horizontal area of about 195 hectares [49]).
The power required by fans to move the air through the pipes can be calculated as follows:
P F a n s = Q ˙ P   ×   Δ P P + C
where Q ˙ P is the volumetric flow of the air and Δ P P + C is the pressure loss in both the Earth-CATs system and the air condenser (considered here equal to 200 Pa). For the total volumetric flow of the plant ( 3956   kg / s 1 / 1.225   kg / m 3   3230   m 3 / s ), together with the total pressure drop for the pipe of 0.5 m diameter and 300 m length with a flow velocity of 1.5 m s−1 (25.99 Pa, obtained from the simulations) and the condenser, the P F a n s would be approximately equal to 0.73 MW, with the power required for each pipe equal to 65 W.
Lastly, the investment cost of the pipes can be estimated based on the price of typical PVC pipes. A 0.5 m long pipe operating at a 6 bar nominal pressure has a cost of about €120 per meter [50]. Each 300 m pipe would thus cost €36,000, which would result in a total cost of about €395 million if 10,965 pipes are installed for the 20 MW plant studied here.
Earth CATs can be considered a technically viable zero-water alternative to existing wet-cooling technologies of thermal power plants if they will be capable to operate effectively and at an acceptable cost. Further analyses are needed to reduce the number of pipes, as well as the required land space. To achieve that, the air mass flow per pipe as well as the length of the pipes must be increased.

4. Conclusions

The presented study proposed the design of a dry-cooling system with earth-cooling air tunnels (Earth CATs), in order to eliminate cooling water use (water withdrawn and consumed for cooling purposes) in a 20 MW solar concentrated power plant in the Iberian Peninsula. The motivation behind the study was to make the power plant work independent of water availability, since future water restrictions in arid regions are expected to lead to substantial power plant efficiency reductions with significant cost and social impact. The proposed tunnels have been tested for cooling down ambient air before that air is used in the air condenser of the plant.
For the initial design presented in this work, a sensitivity study of the geometry of the pipes and the air flow conditions was developed through CFD simulations. The simulations show that pipes with smaller diameters and higher flow velocities require shorter pipe lengths than pipes with greater diameters and lower flow velocities, while the pressure drop is greater in the first case. In addition, for the same temperature drop, smaller diameters and shorter lengths imply the installation of more pipes than in the case of pipes with bigger diameters and longer lengths. Smaller diameters and shorter lengths, however, are associated with less land space and lower costs. Shorter distances between pipes increase the outlet temperature of the air, especially for low-flow velocities. Selecting the appropriate distance between the pipes would depend on the necessity of saving land space. The thickness of the pipes is seen to have a small influence on heat conduction, when compared to the soil surrounding the pipes. Thus, a cheap material like PVC was assumed in the study. With a good design of Earth CATs, the air is cooled down to the required temperature. For larger air flows, a larger volume of soil is heated around the pipe, but the soil surrounding the Earth CATs is not affected after a certain distance. The final design proposed in this work for the 20 MW plant includes 10,965 PVC pipes, each with a diameter of 0.5 m and a length of 300 m, and with a flow velocity of 1.5 m s−1. This design can achieve the desired performance required in this work.
The novelty of the topic leaves much open to future research. Some important topics to consider are the reduction of the required land space and associated costs, as well as the increase of the contact surface area between the pipes and the air, and the air mass flow per pipe and length unit of the proposed system. In addition, the dynamic effect the technology would have on the efficiency of power generation plants needs to be further studied (transient simulations). Future work must also include closed-loop Earth CAT designs that might make the system independent from the ambient temperature and reduce the inlet temperature of the air and the size of the system. Lastly, further feasibility studies should include detailed economic analyses, also accounting for savings due to the reduction of water consumption and social and environmental benefits.

Author Contributions

The manuscript was written through contributions of all authors. All authors have given approval to the final version of the manuscript.

Funding

Fontina Petrakopoulou is funded by the Ramón y Cajal Programme of the Spanish Ministry of Science, Innovation and Universities (Grant no. RYC-2016-20971).

Conflicts of Interest

The authors declare no conflict of interest.

Appendix A. Three-Dimensional Numerical Modelling

The three-dimensional and steady-state fluid dynamic fundamental equations are applied for solving the air flow dynamic and the heat transfer process between the air, the pipe and the soil. Heat transfer occurs by convection between the air and the pipe, and by conduction between the air and the soil through the pipe wall and the soil surrounding the pipe [51]. The air is assumed incompressible [52,53]. These equations are solved using control volumes by the discretization of the geometry (finite volume method, FVM). The fundamental equations are [29,31]:
Continuity equation:
u x + v y + w z = 0
Conservation of momentum equations (Navier-Stokes equations):
u u x + v u y + w u z = 1 ρ p x + ϑ [ 2 u x 2 + 2 u y 2 + 2 u z 2 ]
u v x + v v y + w v z = 1 ρ p y + ϑ [ 2 v x 2 + 2 v y 2 + 2 v z 2 ]
u w x + v w y + w w z = 1 ρ p z + ϑ [ 2 w x 2 + 2 w y 2 + 2 w z 2 ]
Energy equation:
u T x + v T y + w T z = α [ 2 T x 2 + 2 T y 2 + 2 T z 2 ]
where, u , v , and w are the flow velocity components in the x , y and z cartesian directions; p and T are the pressure and temperature of the flowing air; ρ and ϑ are the density and kinematic viscosity of air; and α is the thermal diffusivity of the domain in contact with the air.
The SST k - ω turbulence model:
In this study the shear stress transport (SST) k - ω model has been applied according to the advice of ANSYS®. This model is suitable for the accurate prediction of the separation and the amount of separated fluid from a surface in the turbulent regime. It combines the k -   ε and k - ω models, where k represents the turbulent kinetic energy (L2 T−2 units), ε the turbulent eddy dissipation (L2 T−3 units) and ω the frequency of turbulence (T−1 units). The k - ε model is applied in the flow regions free of frictional shear stresses, while the k - ω model calculates the turbulent behavior inside the bounds of the boundary layer. The k - ω SST model solves two transport equations and relates the Reynolds stresses with the velocity gradients and the turbulent viscosity of the flow. The transport equations are expressed as follows [54]:
( ρ k ) t + x i ( ρ u i k ) = x j [ ( μ + μ t σ k ) k x j ] + G ˜ k Y k + S k
( ρ ω ) t + x i ( ρ u i ω ) = x j [ ( μ + μ t σ ω ) ω x j ] + G ω Y ω + D ω + S ω
where, G ˜ k is the turbulence kinetic energy due to mean velocity gradients, G ω is the generation of ω , σ k and σ ω are the turbulent Prandtl numbers, μ t is the turbulent viscosity, Y k and Y ω are the dissipation of k and ω due to turbulence, D ω is the cross-diffusion term and S k and S ω are source terms. The calculation of these variables is described in the ANSYS® Fluent documentation [54]. Standard settings of the software and standard values for all the constants of the model have been selected: α * is 1, α is 0.52, is 0.09, a 1 is 0.31, β i , 1 is 0.075, β i , 2 is 0.0828, σ k , 1 is 1.176, is 1, σ ω , 1 is 2, σ ω , 2 is 1.168, the energy and wall Prandtl numbers are 0.85, and the Production Limiter Clip Factor is 10.

References

  1. Global Issues: Climate Change. United Nations. Available online: https://www.un.org/en/sections/issues-depth/climate-change/index.html (accessed on 3 April 2019).
  2. Cronin, J.; Anandarajah, G.; Dessens, O. Climate change impacts on the energy system: A review of trends and gaps. Clim. Change 2018, 151, 79–93. [Google Scholar] [CrossRef] [PubMed] [Green Version]
  3. Petrakopoulou, F. Elimination of water use in power plants with Earth cooling air tunnels. Memoria científico-técnica de proyectos explora convocatoria. 2017. Unpublished Work. [Google Scholar]
  4. Olsson, G. Water and Energy: Threats and Opportunities - Second Edition, 1st ed.; IWA Publishing: London, UK, 2015; Volume 14, ISBN 9781780406947. [Google Scholar]
  5. Endo, A.; Burnett, K.; Orencio, P.M.; Kumazawa, T.; Wada, C.A.; Ishii, A.; Tsurita, I.; Taniguchi, M. Methods of the water-energy-food nexus. Water (Switzerland) 2015, 7, 5806–5830. [Google Scholar] [CrossRef] [Green Version]
  6. The United Nations World Water Development Report 2018: Nature-Based Solutions for Water. Available online: https://unesdoc.unesco.org/ark:/48223/pf0000261424 (accessed on 9 March 2019).
  7. Water for Life Cycle-Water Scarcity. United Nations, 2014. Available online: http://www.un.org/waterforlifedecade/scarcity.shtml (accessed on 9 March 2019).
  8. Zhou, Q.; Hanasaki, N.; Fujimori, S. Economic Consequences of Cooling Water Insufficiency in the Thermal Power Sector under Climate Change Scenarios. Energies 2018, 11, 2686. [Google Scholar] [CrossRef] [Green Version]
  9. Macknick, J.; Newmark, R.; Heath, G.; Hallett, K.C. A Review of Operational Water Consumption and Withdrawal Factors for Electricity Generating Technologies. Natl. Renew. Energy Lab. 2011. [Google Scholar]
  10. Packman, A.I.; Pan, S.-Y.; Chiang, P.-C.; Snyder, S.W.; Lin, Y.J. Cooling water use in thermoelectric power generation and its associated challenges for addressing water-energy nexus. Water-Energy Nexus 2018, 1, 26–41. [Google Scholar]
  11. Delgado, A. Water for thermal power plants: Understanding a piece of the water energy nexus. Glob. Water Forum 2015. Available online: http://www.globalwaterforum.org/2015/06/22/water-for-thermal-power-plants-understanding-a-piece-of-the-water-energy-nexus/ (accessed on 13 March 2013).
  12. Kablouti, G. Cost of Water Use: A Driver of Future Investments into Water-efficient Thermal Power Plants? Aquat. Procedia 2015, 5, 31–43. [Google Scholar] [CrossRef]
  13. Lubega, W.N.; Stillwell, A.S. Analyzing the economic value of thermal power plant cooling water consumption. Water Resour. Econ. 2019, 27, 100137. [Google Scholar] [CrossRef]
  14. Turner, S.W.D.; Voisin, N.; Fazio, J.; Hua, D.; Jourabchi, M. Compound climate events transform electrical power shortfall risk in the Pacific Northwest. Nat. Commun. 2019, 10. [Google Scholar] [CrossRef]
  15. Van Vliet, M.T.H.; Yearsley, J.R.; Ludwig, F.; Vögele, S.; Lettenmaier, D.P.; Kabat, P. Vulnerability of US and European electricity supply to climate change. Nat. Clim. Chang. 2012, 2, 676–681. [Google Scholar] [CrossRef]
  16. Lin, L.; Chen, Y. Evaluation of Future Water Use for Electricity Generation under Different Energy Development Scenarios in China. Sustainability 2017, 10, 30. [Google Scholar] [CrossRef] [Green Version]
  17. Stark, A.K.; Klausner, J.F. An R&D Strategy to Decouple Energy from Water. Joule 2017, 1, 416–420. [Google Scholar]
  18. Elberry, M.F.; Elsayed, A.A.; Teamah, M.A.; Abdel-Rahman, A.A.; Elsafty, A.F. Performance improvement of power plants using absorption cooling system. Alexandria Eng. J. 2018, 57, 2679–2686. [Google Scholar] [CrossRef]
  19. Yang, L.; Du, X.; Wu, T.; Ge, Z.; Wei, H. Cooling water mass flow optimization for indirect dry cooling system of thermal power unit under variable output load. Int. J. Heat Mass Transf. 2018, 133, 1–10. [Google Scholar]
  20. Ma, J.; Wang, Y.; Feng, X.; Xu, D. Synthesis cooling water system with air coolers. Chem. Eng. Res. Des. 2018, 131, 643–655. [Google Scholar] [CrossRef]
  21. Liu, H.; Weibel, J.; Groll, E. Performance analysis of an updraft tower system for dry cooling in large-scale power plants. Energies 2017, 10, 1812. [Google Scholar] [CrossRef] [Green Version]
  22. United Nations Environment Programme. Available online: https://www.unenvironment.org/explore-topics/energy/about-energy#ourwork (accessed on 24 March 2019).
  23. CORDIS-EUROPEAN COMISSION. Available online: https://cordis.europa.eu/en (accessed on 24 March 2019).
  24. Materials Technologies for performance improvement of Cooling Systems in Power Plants. CORDIS HORIZON 2020-EUROPEAN COMISSION, 2017. Available online: https://cordis.europa.eu/project/rcn/200817/factsheet/es (accessed on 23 March 2019).
  25. Aresti, L.; Christodoulides, P.; Florides, G. A review of the design aspects of ground heat exchangers. Renew. Sustain. Energy Rev. 2018, 92, 757–773. [Google Scholar] [CrossRef]
  26. Vidhi, R.; Goswami, D.Y.; Stefanakos, E. Supercritical rankine cycle coupled with ground cooling for low temperature power generation. Energy Procedia 2014, 57, 524–532. [Google Scholar] [CrossRef] [Green Version]
  27. Jakhar, S.; Soni, M.S.; Gakkhar, N. Performance Analysis of Earth Water Heat Exchanger for Concentrating Photovoltaic Cooling. Energy Procedia 2015, 90, 145–153. [Google Scholar] [CrossRef]
  28. Vidhi, R. A Review of Underground Soil and Night Sky as Passive Heat Sink: Design Configurations and Models. Energies 2018, 11, 2941. [Google Scholar] [CrossRef] [Green Version]
  29. Bisoniya, T.S.; Kumar, A.; Baredar, P. Study on Calculation Models of Earth-Air Heat Exchanger Systems. J. Energy 2014, 2014, 1–15. [Google Scholar] [CrossRef] [Green Version]
  30. Amaludin, A.; Darius, D.; Misaran, M.S.; Rahman, M.M.; Ismail, M.A. Working parameters affecting earth-air heat exchanger (EAHE) system performance for passive cooling: A review. IOP Conf. Ser. Mater. Sci. Eng. 2017, 217, 012021. [Google Scholar]
  31. Agrawal, K.K.; Bhardwaj, M.; Misra, R.; Das Agrawal, G.; Bansal, V. Optimization of operating parameters of earth air tunnel heat exchanger for space cooling: Taguchi method approach. Geotherm. Energy 2018, 6, 1–17. [Google Scholar] [CrossRef]
  32. Singh, R.; Sawhney, R.L.; Lazarus, I.J.; Kishore, V.V.N. Recent advancements in earth air tunnel heat exchanger (EATHE) system for indoor thermal comfort application: A review. Renew. Sustain. Energy Rev. 2018, 82, 2162–2185. [Google Scholar] [CrossRef]
  33. Bisoniya, T.S. Design of earth–air heat exchanger system. Geotherm. Energy 2015, 3. [Google Scholar] [CrossRef] [Green Version]
  34. Bordoloi, N.; Sharma, A.; Nautiyal, H.; Goel, V. An intense review on the latest advancements of Earth Air Heat Exchangers. Renew. Sustain. Energy Rev. 2018, 89, 261–280. [Google Scholar] [CrossRef]
  35. Bansal, V.; Mishra, R.; Das Agarwal, G.; Mathur, J. Performance analysis of integrated earth-air-tunnel-evaporative cooling system in hot and dry climate. Energy Build. 2012, 47, 525–532. [Google Scholar] [CrossRef]
  36. Chen, J.; Qiao, W.; Xue, Q.; Zheng, H.; An, E. Research on ground-coupled heat exchangers. Int. J. Low-Carbon Technol. 2010, 5, 35–41. [Google Scholar] [CrossRef] [Green Version]
  37. Mathur, A. Comparative study of straight and spiral earth air tunnel heat exchanger system operated in cooling and heating modes. Renew. Energy 2017, 108, 474–487. [Google Scholar]
  38. Soni, S.K.; Pandey, M.; Bartaria, V.N. Ground coupled heat exchangers: A review and applications. Renew. Sustain. Energy Rev. 2015, 47, 83–92. [Google Scholar] [CrossRef]
  39. Petrakopoulou, F.; Robinson, A.; Loizidou, M. Simulation and evaluation of a hybrid concentrating-solar and wind power plant for energy autonomy on islands. Renew. Energy 2016, 96, 863–871. [Google Scholar] [CrossRef]
  40. Phoenix Analysis and Design Technologies ANSYS Meshing Advanced Techniques PADT Lunch & Learn Series. 2016. Available online: https://docplayer.net/48950759-Ansys-meshing-advanced-techniques.html (accessed on 1 July 2019).
  41. Barakat, S.; Ramzy, A.; Hamed, A.M.; El Emam, S.H. Enhancement of gas turbine power output using earth to air heat exchanger (EAHE) cooling system. Energy Convers. Manag. 2016, 111, 137–146. [Google Scholar] [CrossRef]
  42. Márquez, J.M.A.; Bohórquez, M.Á.M.; Melgar, S.G. Ground thermal diffusivity calculation by direct soil temperature measurement. application to very low enthalpy geothermal energy systems. Sensors (Switzerland) 2016, 16. [Google Scholar]
  43. ANSYS Sustainable Design - Excellence in Engineering Simulation. 2011, Volume V. Available online: http://grupossc.com/pdf/publicacion_5611517286.pdf#page=43 (accessed on 14 September 2019).
  44. Bansal, V.; Misra, R.; Agrawal, G.D.; Mathur, J. Performance analysis of earth-pipe-air heat exchanger for summer cooling. Energy Build. 2010, 42, 645–648. [Google Scholar] [CrossRef]
  45. Belatrache, D.; Bentouba, S.; Bourouis, M. Numerical analysis of earth air heat exchangers at operating conditions in arid climates. Int. J. Hydrogen Energy 2017, 42, 8898–8904. [Google Scholar] [CrossRef]
  46. Benhammou, M.; Draoui, B. Parametric study on thermal performance of earth-to-air heat exchanger used for cooling of buildings. Renew. Sustain. Energy Rev. 2015, 44, 348–355. [Google Scholar] [CrossRef]
  47. Hasan, M.I.; Noori, S.W. Numerical Investigation of Earth to Air Heat Exchanger for Cooling and Heating Applications. In Proceedings of the 3rd Int. Sci. Conf. Renew. energy (ISCRE2018), Southreernne Tech. Univ., Basrah, Iraq, 24–25 March 2018; pp. 1–11. [Google Scholar]
  48. Agrawal, K.K.; Agrawal, G.D.; Misra, R.; Bhardwaj, M.; Jamuwa, D.K. A review on effect of geometrical, flow and soil properties on the performance of Earth air tunnel heat exchanger. Energy Build. 2018, 176, 120–138. [Google Scholar] [CrossRef]
  49. TorresolEnergy-Gemasolar. Available online: https://torresolenergy.com/gemasolar/ (accessed on 30 September 2019).
  50. Tarifa de Precios Tuberías plásticas Edición 01-CEMAT Grupo Industrial. Available online: https://cemat.es/wp-content/uploads/2014/01/tarifa-tuberias-plasticas-012014.pdf (accessed on 7 October 2019).
  51. Fazlikhani, F.; Goudarzi, H.; Solgi, E. Numerical analysis of the efficiency of earth to air heat exchange systems in cold and hot-arid climates. Energy Convers. Manag. 2017, 148, 78–89. [Google Scholar] [CrossRef]
  52. Bordoloi, N.; Sharma, A. Performance analysis of EAHE for different pipe geometries and pipe materials using CFD. Indian J. Sci. Res. 2017, 17, 181–189. [Google Scholar]
  53. Kaushal, M.; Dhiman, P.; Singh, S.; Patel, H. Finite volume and response surface methodology based performance prediction and optimization of a hybrid earth to air tunnel heat exchanger. Energy Build. 2015, 104, 25–35. [Google Scholar] [CrossRef]
  54. Shear-Stress Transport (SST) k-w Model - ANSYS FLUENT 12.0/12.1 Documentation. Available online: http://www.afs.enea.it/project/neptunius/docs/fluent/html/th/node67.htm (accessed on 10 September 2019).
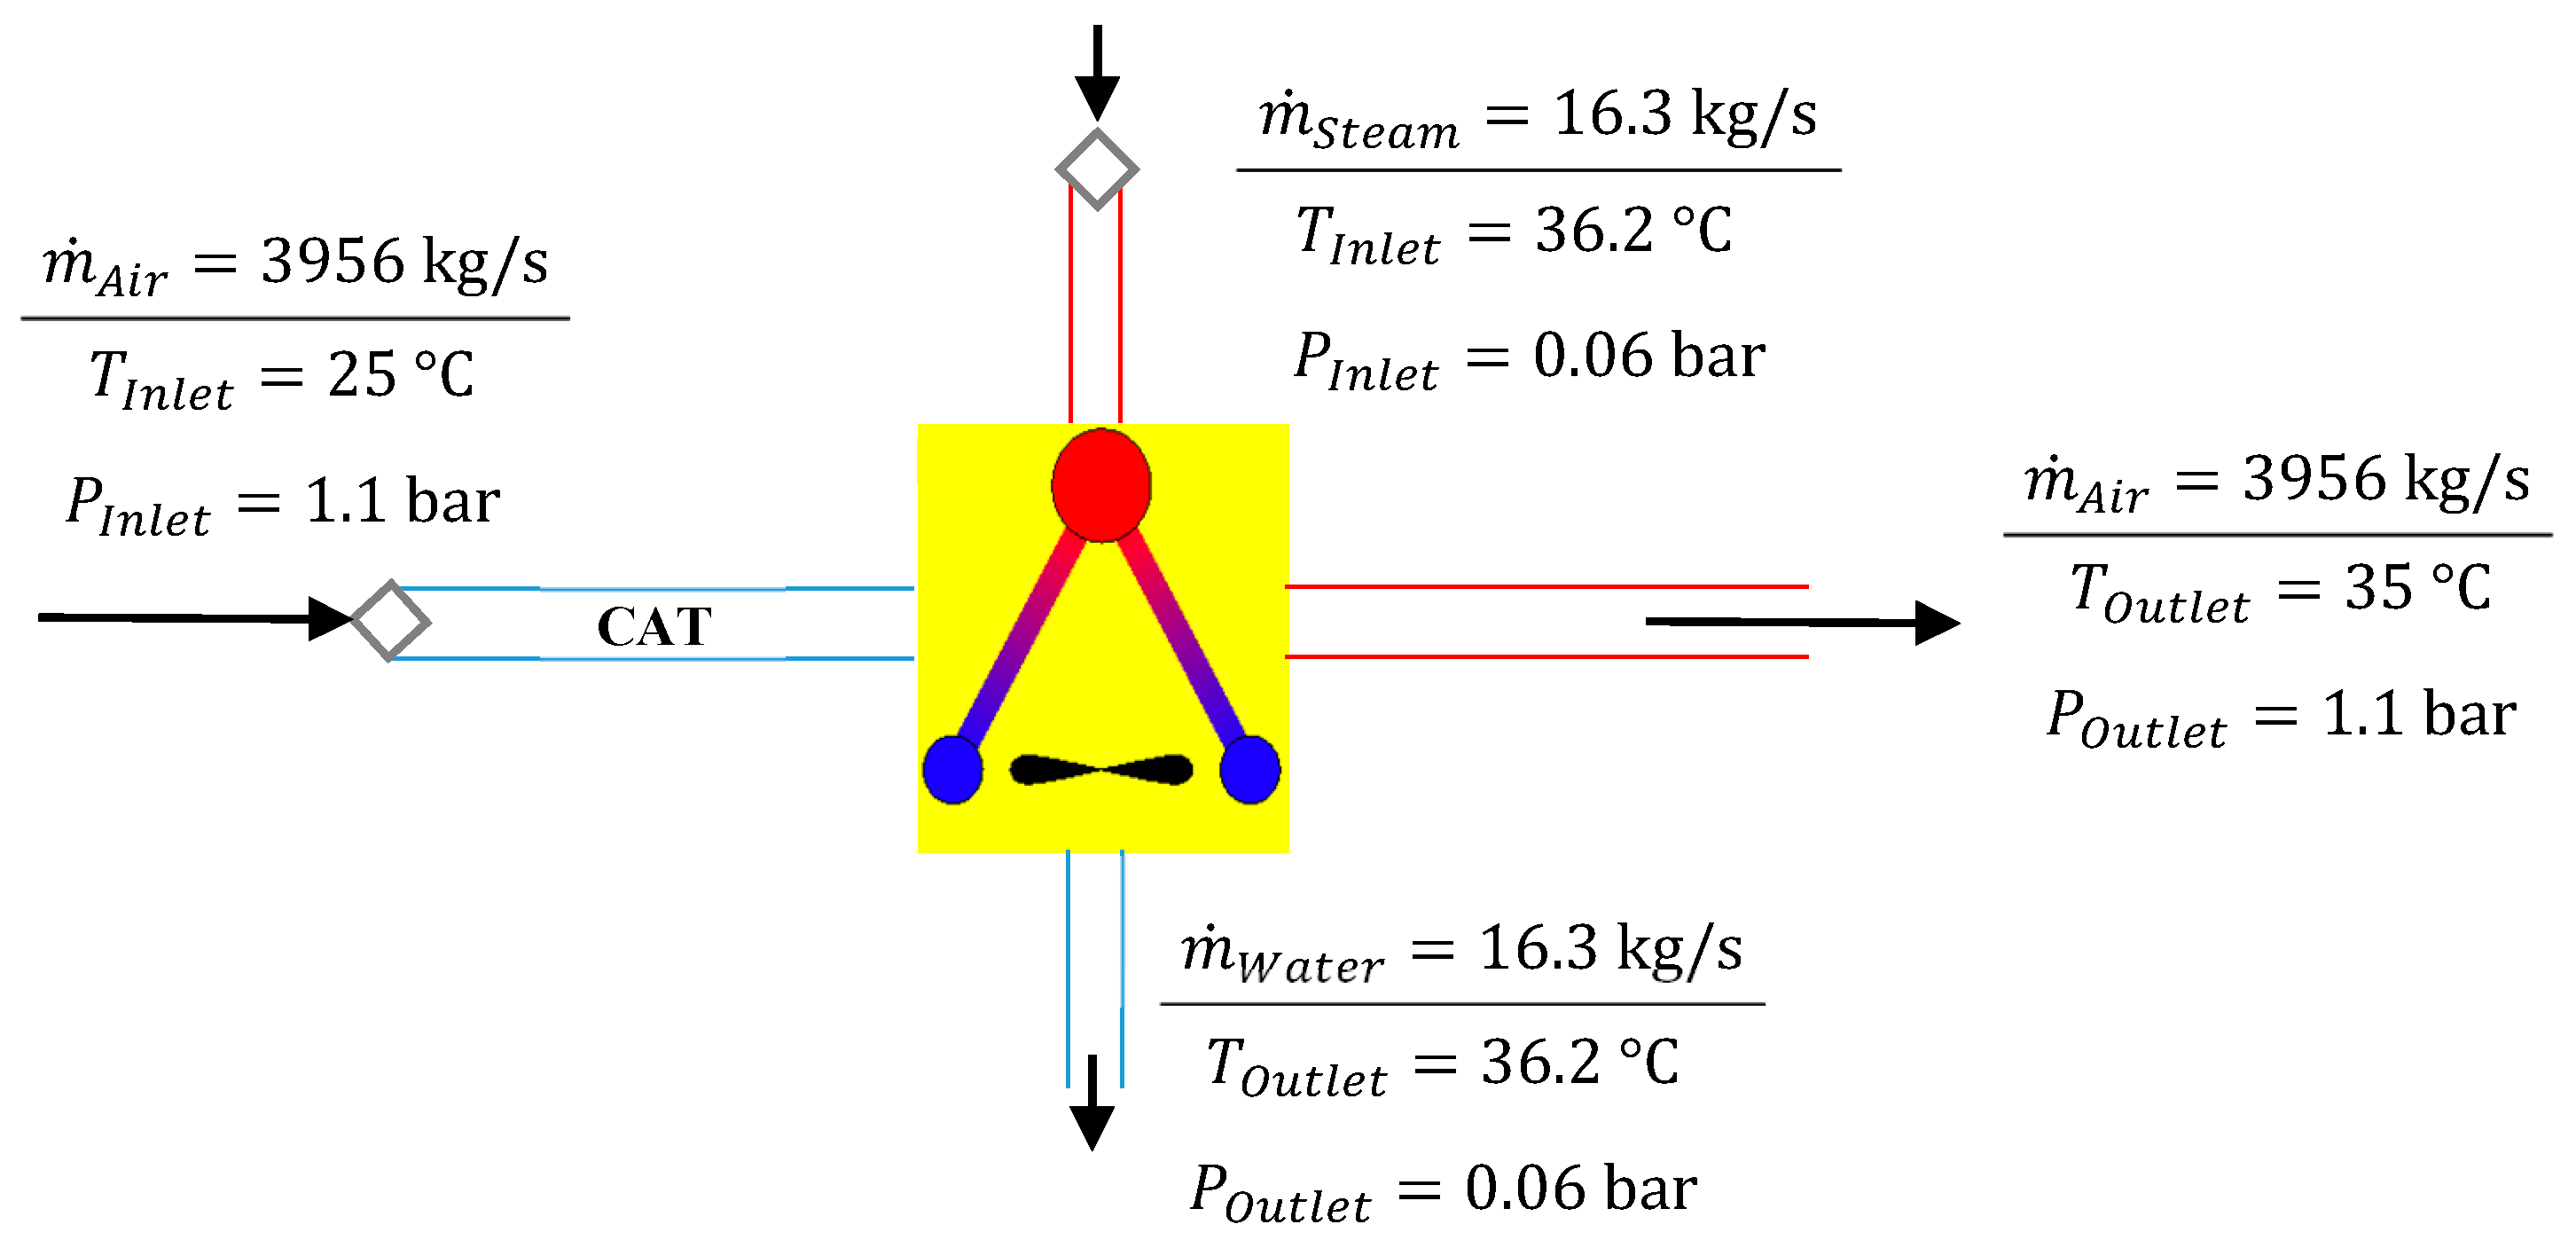
Figure 1. Simplified scheme of a pipe connected to the air condenser with the flow conditions of both incoming and exiting air and steam streams.
Energies 13 00797 g001
Figure 2. Geometry and mesh of the model.
Energies 13 00797 g002
Figure 3. Grid study of the model for different pipe diameters and lengths.
Energies 13 00797 g003
Figure 4. Variation of the outlet air temperature with pipe diameter and air velocity.
Energies 13 00797 g004
Figure 5. Variation of the outlet air temperature with pipe length and air velocity for DP = 0.5 m and DP = 2.5 m.
Energies 13 00797 g005
Figure 6. Variation of the outlet air temperature with distance between three pipes (panel a) and with inlet air temperature (panel b).
Energies 13 00797 g006aEnergies 13 00797 g006b
Figure 7. Soil temperature (shown if it is above 21 °C) for TInlet = 35 °C.
Energies 13 00797 g007
Figure 8. Sketch of the piping arrangement.
Energies 13 00797 g008
Table 1. Material properties [31,44,45].
MaterialDensity [kg m−1]Specific Heat [J kg−1 K−1]Thermal Conductivity [W m−1 K−1]
Air1.22510060.02
PVC13809000.16
Soil205018400.52
Table 2. Boundary conditions of the model.
Boundary ConditionTypeParameterValueMaterial
InletVelocity-InletVelocity
Temperature
0.1–3 m s−1 AmbientAir
AirInterior--Air
Exterior Pipe WallWallThickness
Temperature
10 mm
Ambient
PVC
Pipe WallWall-CoupledThickness10 mmPVC
OutletPressure-OutletGauge pressure8675 PaAir
SoilInterior--Soil
Soil WallWallTemperature20 °CSoil
Table 3. Results of model validation 1.
V I n l e t   [ m   s 1 ] T I n l e t   [ ° C ] Present Model Theoretical   Δ P Bansal et al.
(2012)
Belatrache et al. (2017)Barakat et al.
(2016)
Benhammou et al. (2015)
T O u t l e t   [ ° C ] Δ P   [ Pa ] Δ P   [ Pa ] Relative Error [%] T O u t l e t [°C]Relative Error [%] T O u t l e t   [ ° C ] Relative Error [%] T O u t l e t   [ ° C ] Relative Error [%] T O u t l e t   [ ° C ] Relative Error [%]
243.431.4218.0416.608.6733.105.0833.405.9331.230.6130.054.56
342.533.0736.7733.778.8833.100.0935.306.3232.362.1931.664.45
442.334.3661.1556.069.0833.502.5736.606.1233.353.0333.044.00
542.235.3490.9083.199.2734.203.3337.405.5134.163.7534.103.64
Table 4. Material properties of model validation 2 [41].
MaterialDensity [kg m−1]Specific Heat [J kg−1 K−1]Thermal Conductivity [W m−1 K−1]
Air (30 °C and 60% RH)1.15310210.0265
PVC13809000.16
Soil18681995.41.74
Table 5. Boundary conditions of model validation 2 [41].
ParameterValue
Pipe depth [m]5
Pipe inner diameter [m]0.35
Pipe length [m]85
Air inlet velocity [m s−1]4.5
Soil temperature [°C]25
Air inlet temperature [°C]40
Table 6. Results of model validation 2.
L P   [ m ] D P   [ m ] V I n l e t   [ m   s 1 ] T S o i l   [ ° C ] T I n l e t   [ ° C ] Present Model Theoretical   Δ P Barakat et al. (2016)
T O u t l e t   [ ° C ] Δ P   [ Pa ] Δ P   [ Pa ] Relative Error [%] T O u t l e t   [ ° C ] Relative Error [%]
250.354.4254036.2327.4224.5311.7835.502.06
7532.8959.4554.678.7430.009.63
12529.0694.9284.8111.9227.007.63
850.24.5254025.32142.32124.8414.0025.500.71
0.433.5158.7753.779.3030.0011.70
0.636.1335.3433.027.0333.009.48
850.352254027.3215.7614.925.6326.503.09
430.9754.5751.196.6028.807.53
633.38113.50105.847.2430.3010.17
Table 7. Quantitative results of pipe diameter study.
D P   [ m ] V I n l e t   [ m   s 1 ] m P   [ kg   s 1 ] N P   [ ] T O u t l e t   [ ° C ] Δ P   [ Pa ]
0.50.10.0241164,48022.280.05
0.50.120332,89628.250.81
10.240516,44830.792.71
1.50.360810,96531.935.56
30.7216548333.3119.19
10.10.096241,12027.090.02
0.50.4811822432.220.34
10.9621411233.431.18
1.51.4432274133.902.45
32.8863137134.438.63
1.50.10.216518,27629.840.01
0.51.0824365533.410.23
12.1648182834.130.80
1.53.2471121834.401.67
36.494360934.695.95
20.10.384810,28031.270.01
0.51.9242205633.920.17
13.8485102834.410.59
1.55.772768534.601.24
311.545434334.794.45
2.50.10.6013657932.090
0.53.0066131634.180.14
16.013265834.550.50
1.59.019843934.701.07
318.039621934.843.90