Article

Inter-turn Fault Identification of Surface-Mounted Permanent Magnet Synchronous Motor Based on Inverter Harmonics

1
School of Automation and Electrical Engineering, Lanzhou Jiaotong University, Lanzhou 730070, China
2
School of Electrical Engineering, Southwest Jiaotong University, Chengdu 610031, China
*
Author to whom correspondence should be addressed.
Energies 2020, 13(4), 899; https://doi.org/10.3390/en13040899
Submission received: 6 January 2020 / Revised: 3 February 2020 / Accepted: 12 February 2020 / Published: 18 February 2020

Abstract

:
Inter-turn short-circuit faults can lead to further faults in motors. This makes monitoring and identifying such faults particularly important. However, because of interference in their working environment, fault signals can be weak and difficult to detect in permanent magnet synchronous motors. This paper proposes a method for overcoming this by extracting the inverter harmonics as an excitation source and then extracting characteristic of fault measurements from the negative sequence voltage. First of all, a model of permanent magnet synchronous motor faults is established and a fault negative sequence voltage is introduced to calculate the fault indicators. Then the high frequency harmonic excitation in the voltage is extracted. This is injected into the original voltage signal and the high frequency negative sequence component is separated and detected by a second-order generalized integrator. Simulation results show that the proposed method can effectively identify inter-turn short-circuit faults in permanent magnet synchronous motors while remaining highly resistant to interference. The method is especially effective when the severity of the fault is relatively small and the torque is relatively large.

1. Introduction

Permanent magnet synchronous motors (PMSM) are widely used in modern industrial settings. However, the long-term use of such motors can lead to faults [1], the faults of permanent magnet motors are divided into electrical faults, mechanical faults and magnetic faults. Stator faults in electrical faults have a higher probability, and inter-turn short-circuit faults are the most common. Due to overload and overheating, the stator winding insulation is easily damaged, resulting in a short circuit and a large circulating current in the short path [2]. Among these faults, the early indications of inter-turn short-circuits in the stator winding can be especially hard to detect, but, at the same time, if they are not suppressed, they can cause more serious ground faults and interphase short-circuit faults [3,4]. This makes it very important to monitor and identify inter-turn short-circuit faults quickly before they result in greater harm.
Existing inter-turn short-circuit fault detection methods include using: stator current Park vectors [5]; negative sequence currents [6]; current harmonics [7]; the back electromotive force [8]; motor parameters [9]; high-frequency injection [10]; a zero sequence voltage [11]; and artificial intelligence [12,13]. Each of these methods offer certain advantages. However, current-based methods are easily affected by load, an unbalanced voltage and motor asymmetry. The accuracy of back electromotive force and motor parameter methods depends on the specific motor parameters. The zero-sequence voltage method is not easily affected by load and unbalanced voltage, but it needs appropriate measurement hardware that can introduce measurement errors. Artificial intelligence-based approaches have even higher hardware requirements and need large amounts of data. The eddy current testing method can be used to further accurately locate the fault of the motor [14,15].
To enhance the capacity of diagnosis algorithms to deal with interference, some approaches have tried injecting high-frequency excitation into the voltage to monitor the high-frequency response of motor faults. However, the frequency of the injected excitation is low, which results in high-frequency noise and leaves it susceptible to stator asymmetry [10,16].
Another approach is to switch sequences to monitor transient current changes. This can eliminate the risk of misdiagnosis caused by motor asymmetry [17], but it increases the complexity of the modulation strategy. The effective excitation generated by the inherent high-frequency harmonics of the inverter produces a high-frequency source. The common-mode voltage is then monitored online to detect the zero-sequence voltage generated by the motor when the fault occurs. Although this method avoids motor asymmetry-related issues and has no hardware requirements for measuring the zero-sequence voltage, characteristically, the monitored changes are relatively weak [18].
Under a three-phase static coordinate system, the negative sequence voltage can be divided into the normal negative sequence voltage and the negative sequence voltage caused by inter-turn short-circuit fault. This can effectively eliminate the influence of the negative sequence voltage caused by non-fault factors, with the characteristic quantity for the fault being larger than that extracted from a zero-sequence voltage [19]. However, an actual working environment is typically complex and the early fault characteristics of an inter-turn short-circuit in a permanent magnet synchronous motor are usually weak and easily covered by other signals. The fluctuation of the torque will also produce abnormal vibration and acoustic noise. They can reduce motor performance and efficiency that may result in a negative effect on the normal operation. Variable load, motor asymmetry and an unbalanced voltage can also hamper detection, resulting in misdiagnosis. This makes it important to select a characteristic quantity that is only related to the fault and to enhance the fault characteristic signal as much as possible to avoid the influence of interference. To be able to monitor inter-turn short-circuit faults online and measure their high frequency characteristic signal, it is necessary to have an algorithm with a simple structure that involves minimal calculation.
This paper looks at how to solve the problem of inter-turn short-circuit fault signals in permanent magnet synchronous motors being weak and difficult to detect. Taking into account the potential interference generated by motor asymmetry, unbalanced voltage and the working environment, the proposed method uses inverter harmonic as an excitation source. The high frequency harmonic excitation is then extracted before re-injecting the original voltage signal. As it is difficult to extract a specific high-frequency negative sequence voltage in a three-phase stationary coordinate system, the fault’s negative sequence voltage is introduced in a two-phase stationary coordinate system to calculate its characteristics. Then the high-frequency fault negative-sequence voltage signals are separated out and detected by a double second-order generalized integrator to complete the fault diagnosis. At the end of the paper the results of a simulation are presented that confirm the effectiveness of the proposed method.

2. Mathematical Model of an Inter-Turn Short-Circuit Fault

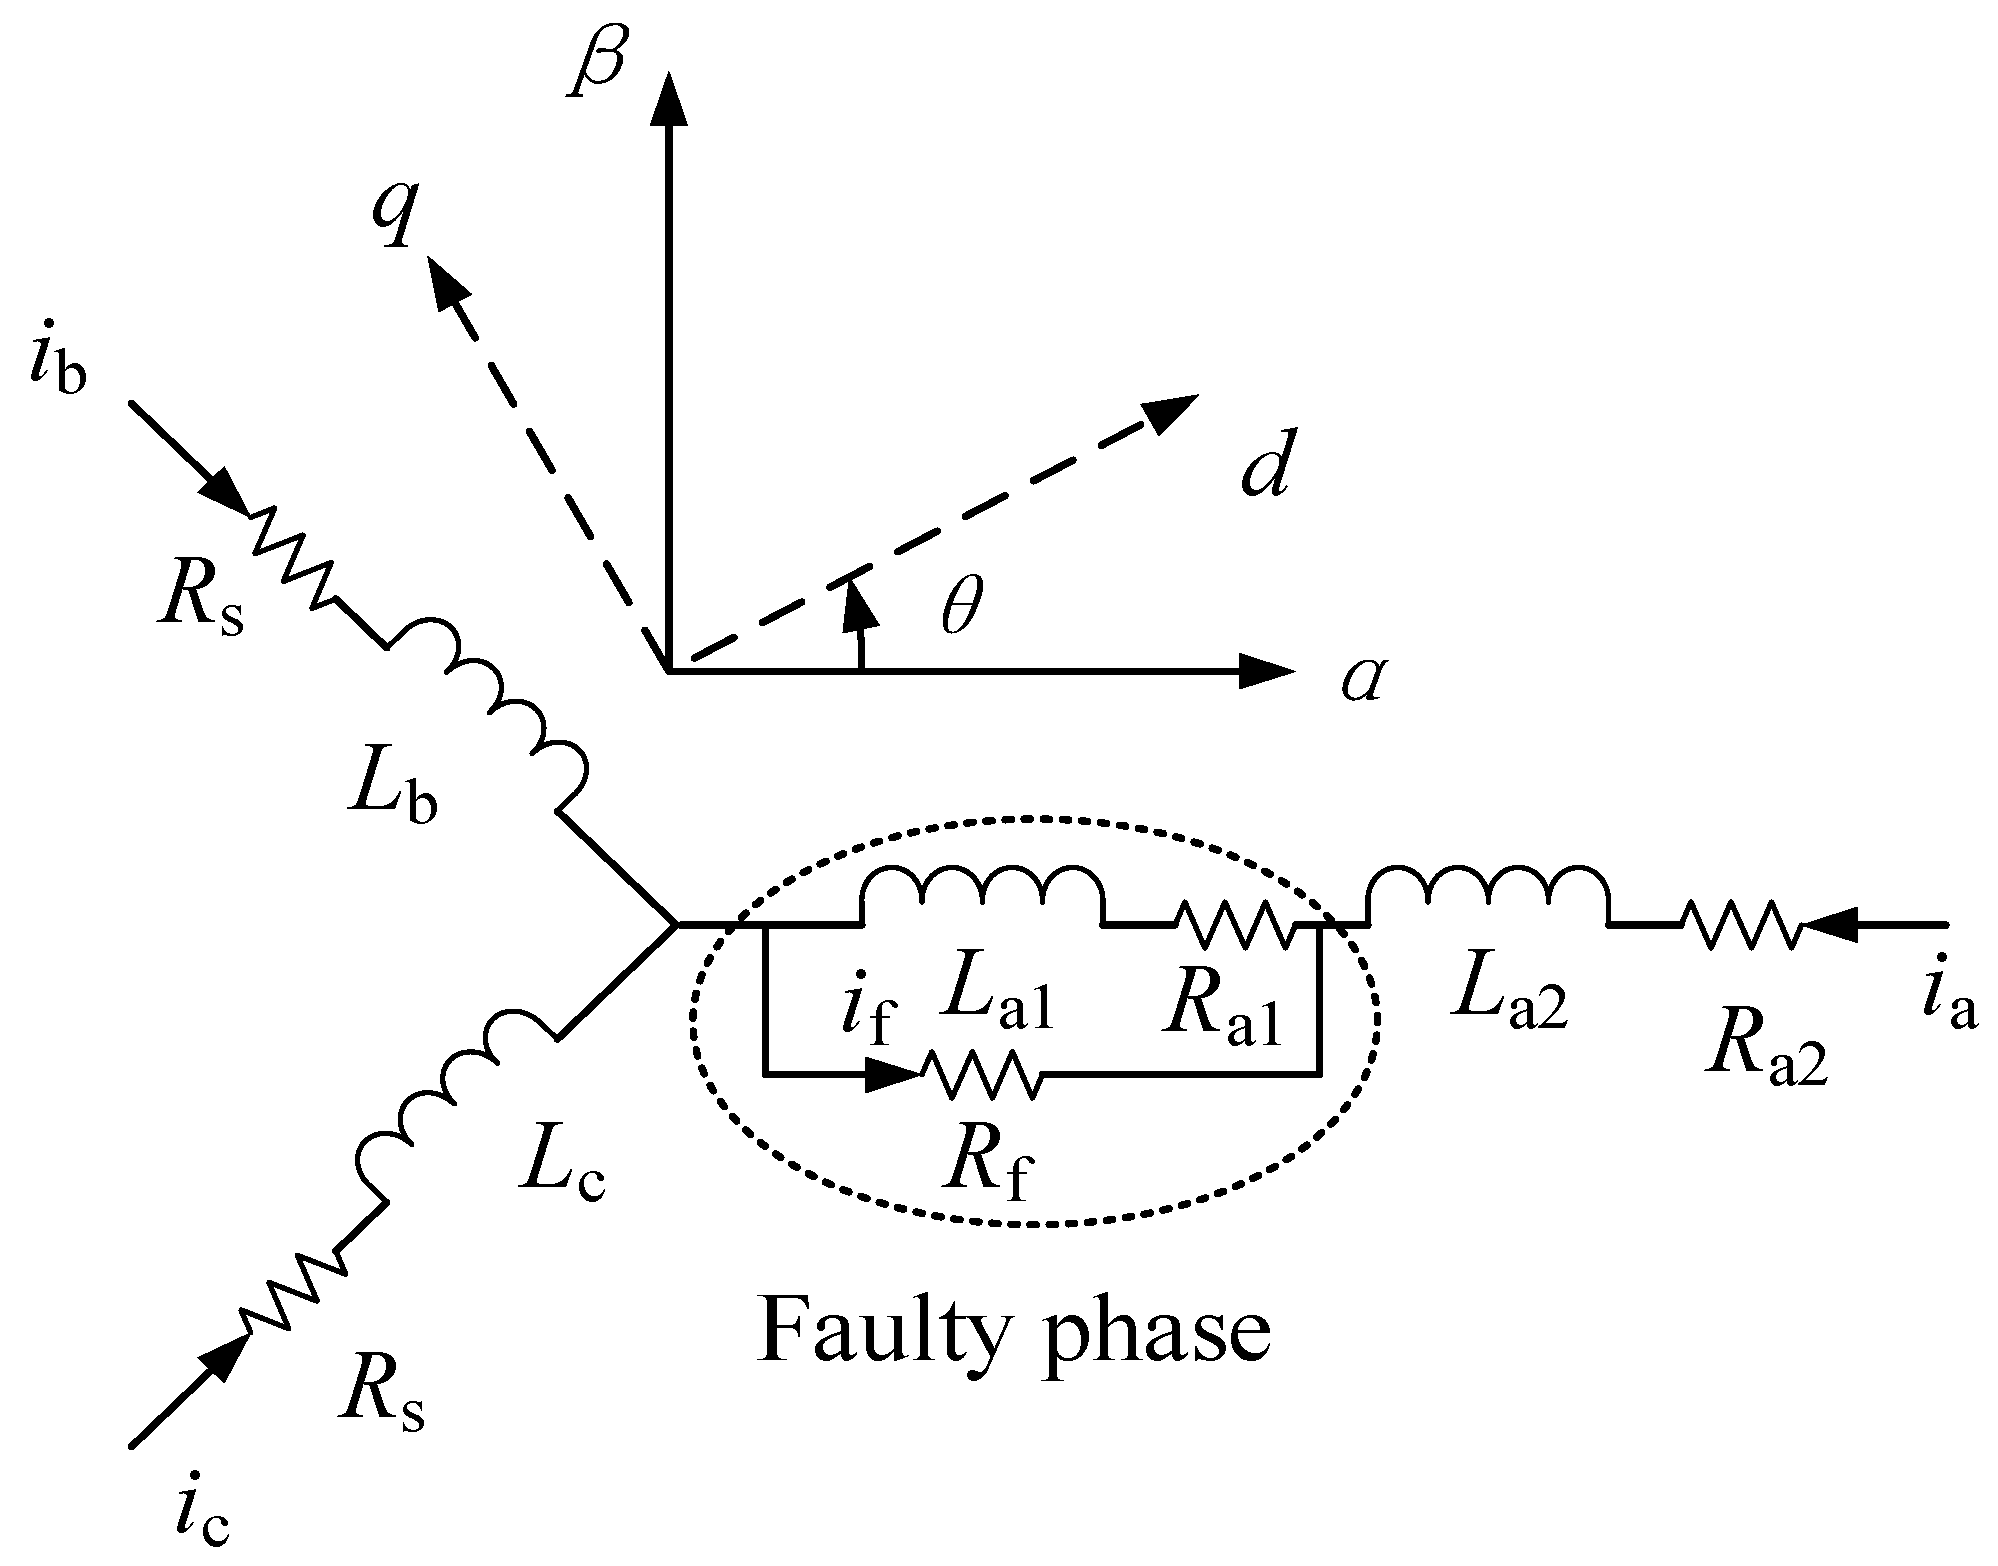
Figure 1 shows a model of an a-phase inter-turn short-circuit fault in a permanent magnet synchronous motor. The short-circuit current, i f , is current generated by the short-circuit loop and R f is the short-circuit resistance. R f is used to model the inter-turn short circuit loop in the windings. The broken winding a is divided into two parts which are the healthy part a1 and the faulty part a2.
The voltage equation for an inter-turn short-circuit fault in a permanent magnet synchronous motor can be expressed in an abc static coordinate system [19,20] as follows:
[ v a b c ] = [ R s 0 ] [ i abc ] + d d t ( [ L s 0 ] [ i abc ] + [ λ PM , abc ] ) [ R s 0 ] [ F P ] u i f d d t ( [ L s 0 ] [ F P ] u i f )
where, [ v abc ] = [ v a v b v c ] T , [ i abc ] = [ i a i b i c ] T , [ R s 0 ] = [ R 0 0 0 0 R 0 0 0 0 R 0 ] , [ F P ] = [ 1 0 0 ] T , [ L s 0 ] = [ L m + L l 1 2 L m 1 2 L m 1 2 L m L m + L l 1 2 L m 1 2 L m 1 2 L m L m + L l ] , [ λ PM , abc ] = λ PM [ cos θ cos ( θ 2 π 3 ) cos ( θ + 2 π 3 ) ] .
[ v abc ] , [ i abc ] are the three-phase voltage and current matrices, respectively, [ R s 0 ] is the stator resistance matrix, R 0 is the stator resistance, [ L s 0 ] is the stator inductance matrix; L m is the self-inductance; L 1 is the leakage inductance; and u is the short-circuit ratio, which can represent the severity of the inter-turn short-circuit. N is the number of coils in the phase winding; n indicates the number of turns in a coil; N f is the number of short-circuited turns in a coil. So, u = N f / ( n N ) . λ PM , abc is the flux matrix. When the fault occurs in phase b or phase c, [ F P ] = [ 0 1 0 ] T or [ F P ] = [ 0 0 1 ] T .
The fault current equation [16] will then be:
i f = u ( v a v n ) u ( 1 u ) R 0 + R f ,
where, v n is the motor’s neutral point voltage.
When the motor is running stably and the speed is constant, the fault phase voltage is:
v a = v d cos θ v q sin θ ,
When the fault initially arises, v a is much larger than v n , so, v n in Equation (2) can be ignored. When this is combined with Equation (3), an accurate i f can be obtained. If the motor is operating at a variable speed and there is an unbalanced voltage, i f will be affected.
By performing a coordinate transformation on the fault model, the voltage equation, dq, can be obtained, as follows [21]:
[ v d v q ω ψ f ] = [ R 0 + p L d ω L q ω L d R 0 + p L q ] [ i d i q ] + [ e df e qf ] ,
where, e df and e qf are disturbances caused by the fault; and p is the differential operator.
[ e df e qf ] = 2 3 u [ R 0 cos θ i f + L d p ( cos θ i f ) + ω L q sin θ i f R 0 sin θ i f L q p ( sin θ i f ) + ω L d cos θ i f ] ,

3. Fault Diagnosis

The effective excitation source of the switching harmonics is analyzed and a corresponding fault negative sequence voltage is used as the response signal to derive the fault indicator expression.

3.1. Effective Harmonic Switching Excitation

Under space vector pulse width modulation (SVPWM), there is a large amount of harmonic in the multiple frequency band of the carrier frequency, fc. As switching between harmonics with frequencies of fc ± 2f1 and fc ± 4f1 can generate rotating voltage vectors and provoke a response in the motor [18], this harmonic can be used as an effective excitation source for fault diagnosis. The fault diagnosis is performed by measuring the corresponding response. This effectively avoid the influence of motor asymmetry on the diagnosis.
By performing a fast Fourier analysis of the output voltage of the inverter, the harmonic content can be obtained, as shown in Figure 2. The ordinate is the ratio of the measured harmonic value to the DC bus voltage. The carrier frequency, fc, is 20 kHz and the fundamental frequency, f1, is 100 Hz. Note that the amplitude of the harmonics at fc ± 2f1 and fc ± 4f1 is large, making these harmonics particularly useful as effective harmonic excitation sources.

3.2. Fault Signal

The voltage in the two-phase stationary coordinate system can be expressed as follows:
[ v α β ] = [ v α v β ] T = [ T α β ] [ v abc ] [ T α β ] = 2 3 [ 1 1 2 1 2 0 3 2 3 2 ] } ,
where, [ v α β ] is the voltage matrix.
The positive and negative sequence voltages in stationary coordinates can be expressed as follows:
[ v α β + ] = [ T α β ] [ v abc + ] = 1 2 [ 1 q q 1 ] [ v α β ] ,
[ v α β ] = [ T α β ] [ v abc ] = 1 2 [ 1 q q 1 ] [ v α β ] ,
where, q denotes a 90 degree lag in phase q = e j π 2 . [ v abc + ] and [ v abc ] are the positive and negative sequence voltage matrices in the abc static coordinate system, respectively.
Similarly, the following can also be obtained:
[ i α β + ] = 1 2 [ 1 q q 1 ] [ i α β ] ,
[ i α β ] = 1 2 [ 1 q q 1 ] [ i α β ] ,
By combining Equations (1), (6), (7), (8), (9) and (10), one gets:
v α , a = 1 2 R 0 i α + 3 4 ( 3 2 L m + L 1 ) d i α d t 1 3 R 0 u i f 1 3 ( 3 2 L m + L 1 ) d ( u i f ) d t ,
v β , a = 1 2 ( R 0 i β + 3 2 ( 3 2 L m + L 1 ) d i β d t ) ,
To obtain the negative sequence voltage caused by the inter-turn short-circuit fault, the overall negative sequence voltage can be divided into a normal negative sequence voltage and a fault negative sequence voltage, as follows:
[ v α β , a ] = [ v α β , h , a ] + [ v α β , f , a ] ,
where, [ v α β , h , a ] is the normal negative sequence voltage; and [ v α β , f , a ] is the fault negative sequence voltage.
Similarly, if there are faults in the other two phases, the negative sequence voltage can be obtained in the two-phase stationary coordinate system. It will be found that the normal negative sequence voltage across all three fault phases is equal. It can be expressed as:
v α , h , a b c = 1 2 ( R 0 i α + 3 2 ( 3 2 L m + L l ) d i α d t ) v β , h , abc = 1 2 ( R 0 i β + 3 2 ( 3 2 L m + L l ) d i β d t ) } ,
where v α , h , abc , v β , h , abc are the normal negative sequence voltage when there is a fault on the α β axis for all three phases.
The fault negative sequence voltage for α β axis can be obtained from Equation (13).
v α , f , a = 1 2 ( 2 3 R 0 u i f 2 3 ( 3 2 L m + L l ) d ( u i f ) d t ) v α , f , b = 1 2 ( 1 3 R 0 u i f + 1 3 ( 3 2 L m + L l ) d ( u i f ) d t ) v α , f , c = 1 2 ( 1 3 R 0 u i f + 1 3 ( 3 2 L m + L l ) d ( u i f ) d t ) } ,
v β , f , a = 0 v β , f , a = 1 2 ( 3 3 R 0 u i f 3 3 ( 3 2 L m + L l ) d ( u i f ) d t ) v β , f , a = 1 2 ( 3 3 R 0 u i f + 3 3 ( 3 2 L m + L l ) d ( u i f ) d t ) } ,
where v α , f , a , v α , f , b , v α , f , c , v β , f , a , v β , f , b , v β , f , c are the fault negative sequence voltage when there is a fault on the α β axis for all three phases respectively.

3.3. Fault Indicator

In this research, only specific high-frequency harmonics and the negative sequence voltage of α axis are considered. Let us set the fault current as:
i f = I f sin ( θ h + θ n ) ,
where, I f is the amplitude of the fault current θ n is the initial phase angle of the fault current; and θ h is the electrical angular position of the specific high-frequency harmonics.
The amplitude of the fault negative sequence voltage for phase a is:
v n f , a = 1 3 u I f R 0 2 + ω h 2 ( 3 2 L m + L l ) 2 ,
where, ω h is the angular velocity of the specific high-frequency harmonics.
Similarly, the amplitude of the fault negative sequence voltage for phases b and c can be obtained. These are equal to and half of phase a, respectively.
When the fault first arises, I f is proportional to the rotational speed ω m [21]. To reduce the influence of the rotational speed on the fault indicator, the fault indicator, FI, for phase a can be obtained as follows:
F I = u I f ω m = 3 v n f , a ω m R 0 2 + ω h 2 ( 3 2 L m + L l ) 2 ,
As there is a zero-sequence voltage, the fault indicator measurement can vary greatly according to the load and the rotational speed. Any voltage imbalance can also have an effect on the fault indicator. It is therefore necessary to use the variation of the fault indicator Δ F I is used to reduce the impact of factors that are not related to the fault. Δ F I is the difference between the present fault indicator measurement and the fault indicator measurement that is obtained when the motor is in a healthy condition:
Δ F I = F I f F I h ,

4. Fault Signal Measurement and Diagnosis

In the initial stages, the characteristics of an inter-turn short-circuit are weak. Therefore, it is necessary to amplify the fault negative sequence voltage. First, a coordinate transformation has to be carried out for the input voltage, then the specific high-frequency components of v d and v q can be extracted. As these high-frequency components can produce a response in the motor and increase the corresponding high-frequency fault current, the extracted high-frequency components are injected into the original voltage signal to increase its excitation. In the two-phase stationary coordinate system, the high-frequency fault negative sequence voltage signal is separated and detected by the double second-order generalized integrator and the fault index is calculated finally. Figure 3 shows the basic structure of the integrator.
A double second-order generalized integrator with a simple structure was employed to separate the positive and negative sequence components [22], thus minimizing the amount of calculation necessary. Figure 4 shows the basic structure of the integrator. The phases of the outputs y and q are orthogonal, and ω 0 is the angular frequency of the strobe signal.
The transfer functions for the two outputs to the input x, are:
Y ( s ) = y ( s ) x ( s ) = k ω 0 s s 2 + k ω 0 s + ω 0 2 ,
Q ( s ) = q ( s ) x ( s ) = k ω 0 2 s 2 + k ω 0 s + ω 0 2 ,
where, k is the damping factor and can be used to adjust the bandwidth; Taking ω0 to be 40,400 Mrad/s, the Bode diagram of the transfer function, Y(s), is shown in Figure 5.
It can be seen from Figure 5 that the second-order generalized integrator can effectively extract the high-frequency component ω 0 at 40,400 Trad/s to realize the bandpass filter function [23,24,25]. The function Y(s) exhibits a band-pass filtering characteristic, and the amplitude gain at ω 0 is 0, indicating that Y(s) has no attenuation on the input signal at ω 0 ; The phase frequency characteristics of Y(s)’ at ω 0 pass from positive 90 degrees to negative 90 degrees indicates that Y(s) has no phase delay to the input signal at ω 0 . By increasing the value of k, the bandwidth of the bandpass filter can be increased, but the ability to suppress other harmonics is reduced. To ensure a suitable speed for diagnosis, the bandwidth was set at k   =   0.1 .
The diagram of using the double second-order generalized integrator to separate the positive and negative sequence are shown in Figure 6. As the integrator has the function of a bandpass filter, a positive and negative sequence voltage with specific high-frequency components can be selected. The high-frequency negative sequence current can be extracted using the same method. Thus, it can be substituted into Equation (14) to obtain the normal negative-sequence voltage. The normal negative sequence voltage will change according to the negative sequence current. When there is an unbalanced input voltage or motor asymmetry, there will be a negative sequence voltage and negative sequence current, at which point the corresponding normal negative sequence voltage can be calculated. The fault negative sequence voltage can then be obtained by subtracting the normal negative sequence voltage from the separated negative sequence voltage. The fault negative sequence voltage is only related to the corresponding inter-turn short-circuit fault, so, there is no risk of the voltage imbalance and motor asymmetry influencing the fault diagnosis.

5. Experimental Simulation

A simulated model of a surface-mounted three-phase permanent magnet synchronous motor was built in MATLAB/Simulink to explore the possibility of obtaining an early fault diagnosis of an inter-turn short-circuit. The motor parameters are listed in Table 1 [26].
The self-inductance, L m , can be calculated by using the equation L m = ( L d + L q 2 L l ) / 3 [17]. Normally, in surface-mounted permanent magnet synchronous motors, i q is proportional to the electromagnetic torque, T e . As i d is zero, the change of torque will affect v d and v q . When the fault first arises, i q will affect the fault current, thus increasing the torque and making the fault current increase as well.
Figure 7 shows fault indicators under different working conditions. In Figure 7a, the motor starts at a constant torque, uniformly accelerates to its rated speed, and then operates at a uniform speed. The inter-turn short-circuit fault occurs after 0.5 s. As the fault current of the model is affected by the zero-sequence voltage of the inverter, any non-uniform motion and change in torque will result in a significant change in the fault negative sequence voltage, even if there is no fault. Note from Figure 6 that, when the fault happens, the fault indicator amplitude is larger than the normal state of 0.01. The average value at this point is 0.018 and Δ F I is 0.008. During the uniform acceleration stage, when the speed approaches the rated speed, the fault indicator reaches 0.035. In Figure 7b, the inter-turn short-circuit fault occurs at 0.2 s while the motor is in a state of uniform acceleration. The fault indicator is 0.06 and Δ F I is 0.03. Note that the fault indicator is again noticeably higher than the normal value. Although the fault indicator increases with the increase in rotational speed, its amplitude changes little. The motor reaches its rated speed and continues at a uniform speed at 0.3 s. At this point, the fault indicator is consistent with when the fault occurred at the uniform speed stage. Comparing the uniform acceleration stage in Figure 6a,b, Δ F I is 0.03 and the increase in amplitude is significantly higher than it was in the uniform speed stage, so it is easier to diagnose the fault. In Figure 7c, the motor is in a constant torque start-up stage from 0 to 0.2 s and the rotational speed reaches 800 r/min at 0.2 s. The motor rotates at a uniform speed from 0.2 to 0.3 s and the fault indicator value is lower than it was during the acceleration stage, at 0.01. The inter-turn short-circuit fault occurs at 0.3 s, the fault indicator increases to 0.03 and Δ F I is 0.02. However, the average value is not significantly different from the average value during the acceleration stage, so, at this point misdiagnosis may occur. At 0.5s, the rotational speed is 1000 r/min and the torque increases to 130 N m . The fault indicator now increases rapidly to 0.25 during the uniform acceleration stage. After the rotational speed reaches 1000 r/min, the fault indicator decreases to 0.12, but the value is still significantly higher than it was during the 0.2–0.3 s stage. Here, Δ F I is 0.11. It can be seen that during both the uniform acceleration stage and the uniform speed stage, after the torque increases, Δ F I increases noticeably as well, which is helpful for diagnosing the fault. So, at higher torques, the fault detection accuracy is also higher.
Figure 8 shows the fault indicators for different degrees of fault. Among them, the fault indicators at three different fault levels are Δ F I , and fault indicator FI is adopted in healthy state. Figure 8a,b show the fault indicators for different rotational speeds and different torques. It can be seen that the fault indicator is less affected by the rotational speed. When u is 0.05, the fault indicator Δ F I is still higher than the normal F I . With an increase in fault severity, the fault indicator noticeably increases. The fault indicators for the three different degrees of severity are quite different, which obviously helps with diagnosis of the fault and being able to determine its severity. In Figure 8b, the fault indicator clearly increases with the increase of torque. When the degree of the fault is larger, the influence of the increase of torque on the fault indicator weakens. In the experiment, when the torque was known, the difference in the fault indicators enabled a judgment as to whether it was a light fault, less serious fault, or serious fault.
Figure 9 shows the fault indicators when the voltage is balanced and when there is a voltage imbalance for a fault degree of 0.05, with the fault indicator being Δ F I . Figure 9a shows the maximum fault indicator for different rotational speeds when the torque is 50 N m . Figure 9b shows the fault indicators for different torques when the rotational speed is 800 r/min. A resistance of 0.5 Ω was connected in series in Phase B. This made the three-phase voltage for the motor unbalanced. Under the fixed torque of 50 N m , when the fault indicator was greater than or equal to 0.02 and less than 0.06, it was determined to be a light fault. If the fault indicator was greater than or equal to 0.06 and less than 0.15, it was determined to be a less serious fault. If the fault indicator was greater than 0.15, it was determined to be a serious fault. In Figure 9a, the degree of fault is a light fault, which is in accordance with the experimental conditions. When the fault appears, there is little difference in the fault indicator for the two conditions of balanced and unbalanced voltage. As the unbalanced voltage is compensated for by the normal negative sequence voltage, it does not have a serious effect on the fault indicator. Thus, it is clearly the inter-turn short-circuit fault that has the greatest effect on the fault indicator.
Figure 10 shows the fault indicators under conditions of motor symmetry and motor asymmetry, with the fault indicator being Δ F I . Figure 10a shows the maximum fault indicators for different given rotational speeds, with a torque of 50 N m . Figure 9b shows the fault indicators for different torques when the rotational speed is 800 r/min. Note that, under the two conditions of motor symmetry and motor asymmetry, in comparison to the indicators for different torques, the indicators for different speeds have a larger difference, with the maximum difference being 0.012. However, this is still less than the minimum fault indicator of 0.02 and the fault indicator falls within the range of a light fault. As the normal negative sequence voltage and higher frequency injection method compensate for and restrict the motor asymmetry, it does not have a serious effect on the fault indicator. Once again, then, it is the inter-turn short-circuit fault that has the greatest effect on the fault indicator.

6. Conclusions

This paper has proposed a fault diagnosis method where high-frequency harmonic excitations in a voltage are extracted and injected back into the original voltage signal. A fault negative sequence voltage is obtained using a two-phase stationary coordinate system. A high-frequency fault negative sequence voltage signal is then separated out and detected by a second-order generalized integrator. This enables fault indicators to be obtained and a fault diagnosis to be undertaken. On the basis of the experimental simulation, the following main conclusions can be drawn:
(1)
The proposed method can diagnose inter-turn short-circuit faults in permanent magnet synchronous motors and identify weak signals with high degrees of sensitivity and reliability.
(2)
The proposed method is highly resistant to interference and is largely unaffected by variations in speed or torque, voltage imbalances, or motor asymmetry.
(3)
It is easier to detect faults with relatively large torques, especially when the severity of the fault is less.
In this paper, the diagnosis was conducted using an SVPWM strategy. Both the applicability of the method to other modulation strategies and the location of the fault phase remain in need of further research. The artificial intelligence may be used to enhance the precision by selecting the threshold to assess fault severity.

Author Contributions

F.G. planned the work. G.Z. and M.L. drafted the main part of the paper and implemented the experiment. Y.G. and S.Z. contributed to the error analysis. All authors have read and agreed to the published version of the manuscript.

Funding

This research was funded by the National Key Research and Development Program of China (Grant No. 2017YFB1201003-020 and No. 2018YFB1201602-06).

Conflicts of Interest

The authors declare no conflict of interest.

References

  1. Ding, S.; Wang, Q.; Hang, J. Inter-turn Fault Diagnosis of Permanent Magnet Synchronous Machine Considering Model Predictive Control. Proc. CSEE 2019, 39, 3697–3708. [Google Scholar]
  2. Chen, Y.; Liang, S.; Li, W.; Liang, H.; Wang, C. Faults and Diagnosis Methods of Permanent Magnet Synchronous Motors: A Review. Appl. Sci. 2019, 9, 2116. [Google Scholar] [CrossRef] [Green Version]
  3. Zheng, D.; Zhang, P. A Review of Fault Diagnosis and Online Condition Monitoring of Stator Insulation in AC Electrical Machine. Proc. CSEE 2019, 39, 395–406. [Google Scholar]
  4. LI, H.; Sun, L. A Novel Detection Method of Stator Winding Inter-turn Short Circuit Fault in Induction Motors. Proc. CSEE 2008, 28, 73–79. [Google Scholar]
  5. Cruz, S.M.A.; Cardoso, A.J.M. Stator winding fault diagnosis in three-phase synchronous and asynch-ronous motors, by the extended Park’s vector approach. LEEE Trans. Ind. Appl. 2001, 37, 1233. [Google Scholar]
  6. Bouzid, M.B.K.; Champenois, G. New Expressions of Symmetrical Components of the Induction Motor Under Stator Faults. LEEE Trans. Ind. Electron. 2013, 60, 4093–4102. [Google Scholar] [CrossRef]
  7. Wu, Q.; Nandi, S. Fast Single-Turn Sensitive Stator Interturn Fault Detection of Induction Machines Based on Positive- and Negative-Sequence Third Harmonic Components of Line Currents. LEEE Trans. Ind. Appl. 2010, 46, 974–983. [Google Scholar]
  8. Leboeuf, N.; Boileau, T.; Nahid-Mobarakeh, B. Real-Time Detection of Interturn Faults in PM Drives Using Back-EMF Estimation and Residual Analysis. LEEE Trans. Ind. Appl. 2011, 47, 2402–2412. [Google Scholar] [CrossRef]
  9. Cheng, S.; Zhang, P.; Habetler, T.G. An Impedance Identification Approach to Sensitive Detection and Location of Stator Turn-to-Turn Faults in a Closed-Loop Multiple-Motor Drive. LEEE Trans. Ind. Electron. 2011, 58, 1545–1554. [Google Scholar] [CrossRef]
  10. Briz, F.; Degner, M.W.; Diez, A.B. Online diagnostics in inverter-fed induction machines using high frequency signal injection. LEEE Trans. Ind. Appl. 2004, 40, 1153–1161. [Google Scholar] [CrossRef]
  11. Julio-César, U.; Riba, J.R.; Luís, R. Application of the zero-sequence voltage component to detect stator winding inter-turn faults in PMSMs. Electr. Power Syst. Res. 2012, 89, 38–44. [Google Scholar]
  12. Das, S.; Purkait, P.; Koley, C. Performance of a load-immune classifier for robust identification of minor faults in induction motor stator winding. LEEE Trans. Dielectr. Electr. Insul. 2014, 21, 33–44. [Google Scholar] [CrossRef]
  13. Yang, T.; Gui, W. Research on fault diagnosis of induction motor based KPCA and RVM. Electr. Mach. Control 2016, 20, 89–95. [Google Scholar]
  14. Yin, L.; Ye, B.; Rodriguez, S.; Leiva, R.; Meng, X.; Akid, R.; Lu, M. Detection of corrosion pits based on an analytically optimised eddy current sensor. Insight Non Destr. Test. Cond. Monit. 2018, 60, 561–567. [Google Scholar] [CrossRef]
  15. Lu, M.; Meng, X.; Yin, W.; Qu, Z.; Wu, F.; Tang, J.; Xu, H.; Huang, R.; Chen, Z.; Zhao, Q.; et al. Thickness measurement of non-magnetic steel plates using a novel planar triple-coil sensor. NDT&E Int. 2019, 107, 102148–102157. [Google Scholar]
  16. Du, B.; Wu, S.; Han, S. Interturn Fault Diagnosis Strategy for Interior Permanent-Magnet Synchronous Motor of Electric Vehicles Based on Digital Signal Processor. LEEE Trans. Ind. Electron. 2016, 63, 1694–1706. [Google Scholar] [CrossRef]
  17. Sumner, M.; Arellano-Padilla, J.; Gerada, C. Evaluation of saliency tracking as an alternative for health monitoring in PMSM-drives under non-stationary conditions. IET Electr. Power Appl. 2016, 10, 284–293. [Google Scholar]
  18. Liu, H.; Huang, J.; Hou, Z. Stator inter-turn fault detection in closed-loop controlled drive based on switching sideband harmonics in CMV. IET Electr. Power Appl. 2016, 11, 178–186. [Google Scholar] [CrossRef]
  19. Jeong, H.; Moon, S.; Kim, S.W. An Early Stage Inter-turn Fault Diagnosis Method for PMSMs by using Negative-Sequence Components. LEEE Trans. Ind. Electron. 2017, 64, 5701–5708. [Google Scholar] [CrossRef]
  20. Luís, R.; Julio, C.U.; Ruiz, J.R.R. Modeling of Surface-Mounted Permanent Magnet Synchronous Motors with Stator Winding Interturn Faults. LEEE Trans. Ind. Electron. 2011, 58, 1576–1585. [Google Scholar]
  21. Urresty, J.C.; Riba, J.R.; Romeral, L. Diagnosis of Interturn Faults in PMSMs Operating Under Nonstationary Conditions by Applying Order Tracking Filtering. LEEE Trans. Power Electron. 2013, 28, 507–515. [Google Scholar] [CrossRef]
  22. Hongpeng, L.; Jiajie, Z.; Pengfei, L. An improved droop control strategy of three-phase inverter for grid voltage unbalance compensation. In Proceedings of the 2017 IEEE 3rd International Future Energy Electronics Conference and ECCE Asia (IFEEC 2017—ECCE Asia), Kaohsiung, Taiwan, 3–7 June 2017; pp. 110–115. [Google Scholar]
  23. Liu, B.; Zhou, B.; Ni, T. A Novel Position Observer for SPMSM Sensorless Control Based on Second-Order Generalized Integrators. Trans. Electr. Eng. 2017, 32, 23–33. [Google Scholar]
  24. Minakshi, M.; Higley, S.; Baur, C.; Mitchell, D.R.; Jones, R.T.; Fichtner, M. Calcined chicken eggshell electrode for battery and supercapacitor applications. Rsc. Adv. 2019, 9, 26981–26995. [Google Scholar] [CrossRef] [Green Version]
  25. Barmi, M.J.; Minakshi, M. Tuning the redox properties of the nanostructured CoMoO4 electrode: Effects of surfactant content and synthesis temperature. ChemPlusChem 2016, 81, 964–977. [Google Scholar] [CrossRef]
  26. Bose, B.K. Modern Power Electronics and AC Drives; Prentice-Hall: Englewood Cliffs, NJ, USA, 1986. [Google Scholar]
Figure 1. Model of an a-phase inter-turn short-circuit fault in a permanent magnet synchronous motors (PMSM).
Energies 13 00899 g001
Figure 2. Inverter voltage spectrum under space vector pulse width modulation (SVPWM).
Energies 13 00899 g002
Figure 3. Basic structure of fault diagnosis.
Energies 13 00899 g003
Figure 4. Basic structure of the second-order generalized integrator.
Energies 13 00899 g004
Figure 5. Bode diagram of the transfer function, Y(s).
Energies 13 00899 g005
Figure 6. Positive and negative sequence separation generated by the double second-order generalized integrator.
Energies 13 00899 g006
Figure 7. Fault indicators for different working conditions.
Energies 13 00899 g007
Figure 8. Fault indicators for different degrees of fault.
Energies 13 00899 g008
Figure 9. Fault indicators when the voltage is balanced and when there is a voltage imbalance.
Energies 13 00899 g009
Figure 10. Fault indicators under conditions of motor symmetry and motor asymmetry.
Energies 13 00899 g010
Table 1. Three phase permanent-magnet synchronous motor parameters.
ParametersValues
Rated power/kW120
Rated frequency/Hz100
Rated speed/(r/min)1500
Pole pairs4
Stator resistance/Ω0.2
Inductance of d axis/mH8.5
Inductance of q axis/mH8.5
Leakage inductance/mH0.7

