1. Introduction
The proliferation of small-scale rotary machines and distributed generation (DG) units within distribution networks (DNs) has brought new opportunities in the diversification of the energy basket and a better use of natural resources which promotes sustainability. Microgrids are a powerful alternative to satisfy the growing energy demand with a positive impact in power networks improving the overall efficiency. However, the high penetration of DG causes bidirectional power flows and currents that change the traditional dynamic interaction between loads and generators [
1,
2,
3,
4]. Such interaction makes the problem of protection coordination even more complex.
Protection systems in microgrids must deal with the following two aspects: (a) the dynamic behavior that is usually presented due to intermittent energy resources and (b) the microgrid operation mode which can be connected or disconnected from the main power grid [
5,
6]. Microgrids are reconfigurable electric power systems with variable levels of current fault and bidirectional power flows [
7]. Microgrids have changed the traditional paradigm of radial DNs into non-radial and flexible systems. Therefore, finding a protection scheme that ensures speed, selectivity and reliability has become one of the most challenging tasks in microgrids operation planning [
8].
Overcurrent relays (OCRs) are the most extended protection systems due to their efficiency, simplicity, and ease of installation. Nevertheless, their proper incorporation and coordination in microgrids is still an emerging research topic [
1,
2,
9,
10]. Selection and design of coordination protection schemes are essential for appropriate control and reliable operation of microgrids [
6]. Recently, many researchers have focused their efforts in implementing optimization techniques to find an appropriate protection coordination scheme that features minimum operation time while guaranteeing reliability and security [
11,
12].
In [
13], the authors proposed an index to measure the impact on OCRs coordination when DG units are included. The directional OCRs coordination problem is also analyzed in [
14] in DNs with high participation of DG. The authors of [
15] proposed a methodology for OCRs coordination which includes the N-1 security criterion. In [
16], a multi-objective swarm optimization algorithm for OCRs coordination in microgrids was presented. In [
17], the authors proposed an online adaptive coordination protection scheme for directional OCRs. Such a scheme uses smart electronic devices and a communication channel to obtain real time information for updating the relays configuration. This approach was intended for DNs with dynamically changing operating conditions which includes loss of loads, generations, and lines. In [
18], the authors proposed an adaptive coordination protection scheme. In this case, a hybrid artificial neural network and a support vector machine model were used for the state recognition of the microgrid. Based on the state recognition, the protective settings of the network were dynamically modified to enhance the reliability of the network. However, the schemes presented in [
17,
18] are usually expensive and their implementation tends to be complex [
19].
In [
20], the concept of non-standard features for overcurrent protection coordination in power systems is described. Non-standard features are those not described neither in IEEE nor in IEC (international electrotechnical commission) standards. Technological advances in protective equipment have formed the basis for the new generation of digital overcurrent relays that allow alternative approaches to the standard protection schemes. The continuous growth of power systems makes the protection coordination an increasingly complex problem. Then, non-standard features arise as an alternative to improve the safety and reliability of electrical power systems. In [
21], the authors presented a protection coordination approach taking into account the installation of future photovoltaic systems with any penetration level and different locations along the distribution feeder. Basically, the authors of [
21] modified the existing characteristic curve of the overcurrent protection. The characteristic curve can be modified by varying the constants of the curve while keeping the time multiplying setting (TMS) and pick up current fixed.
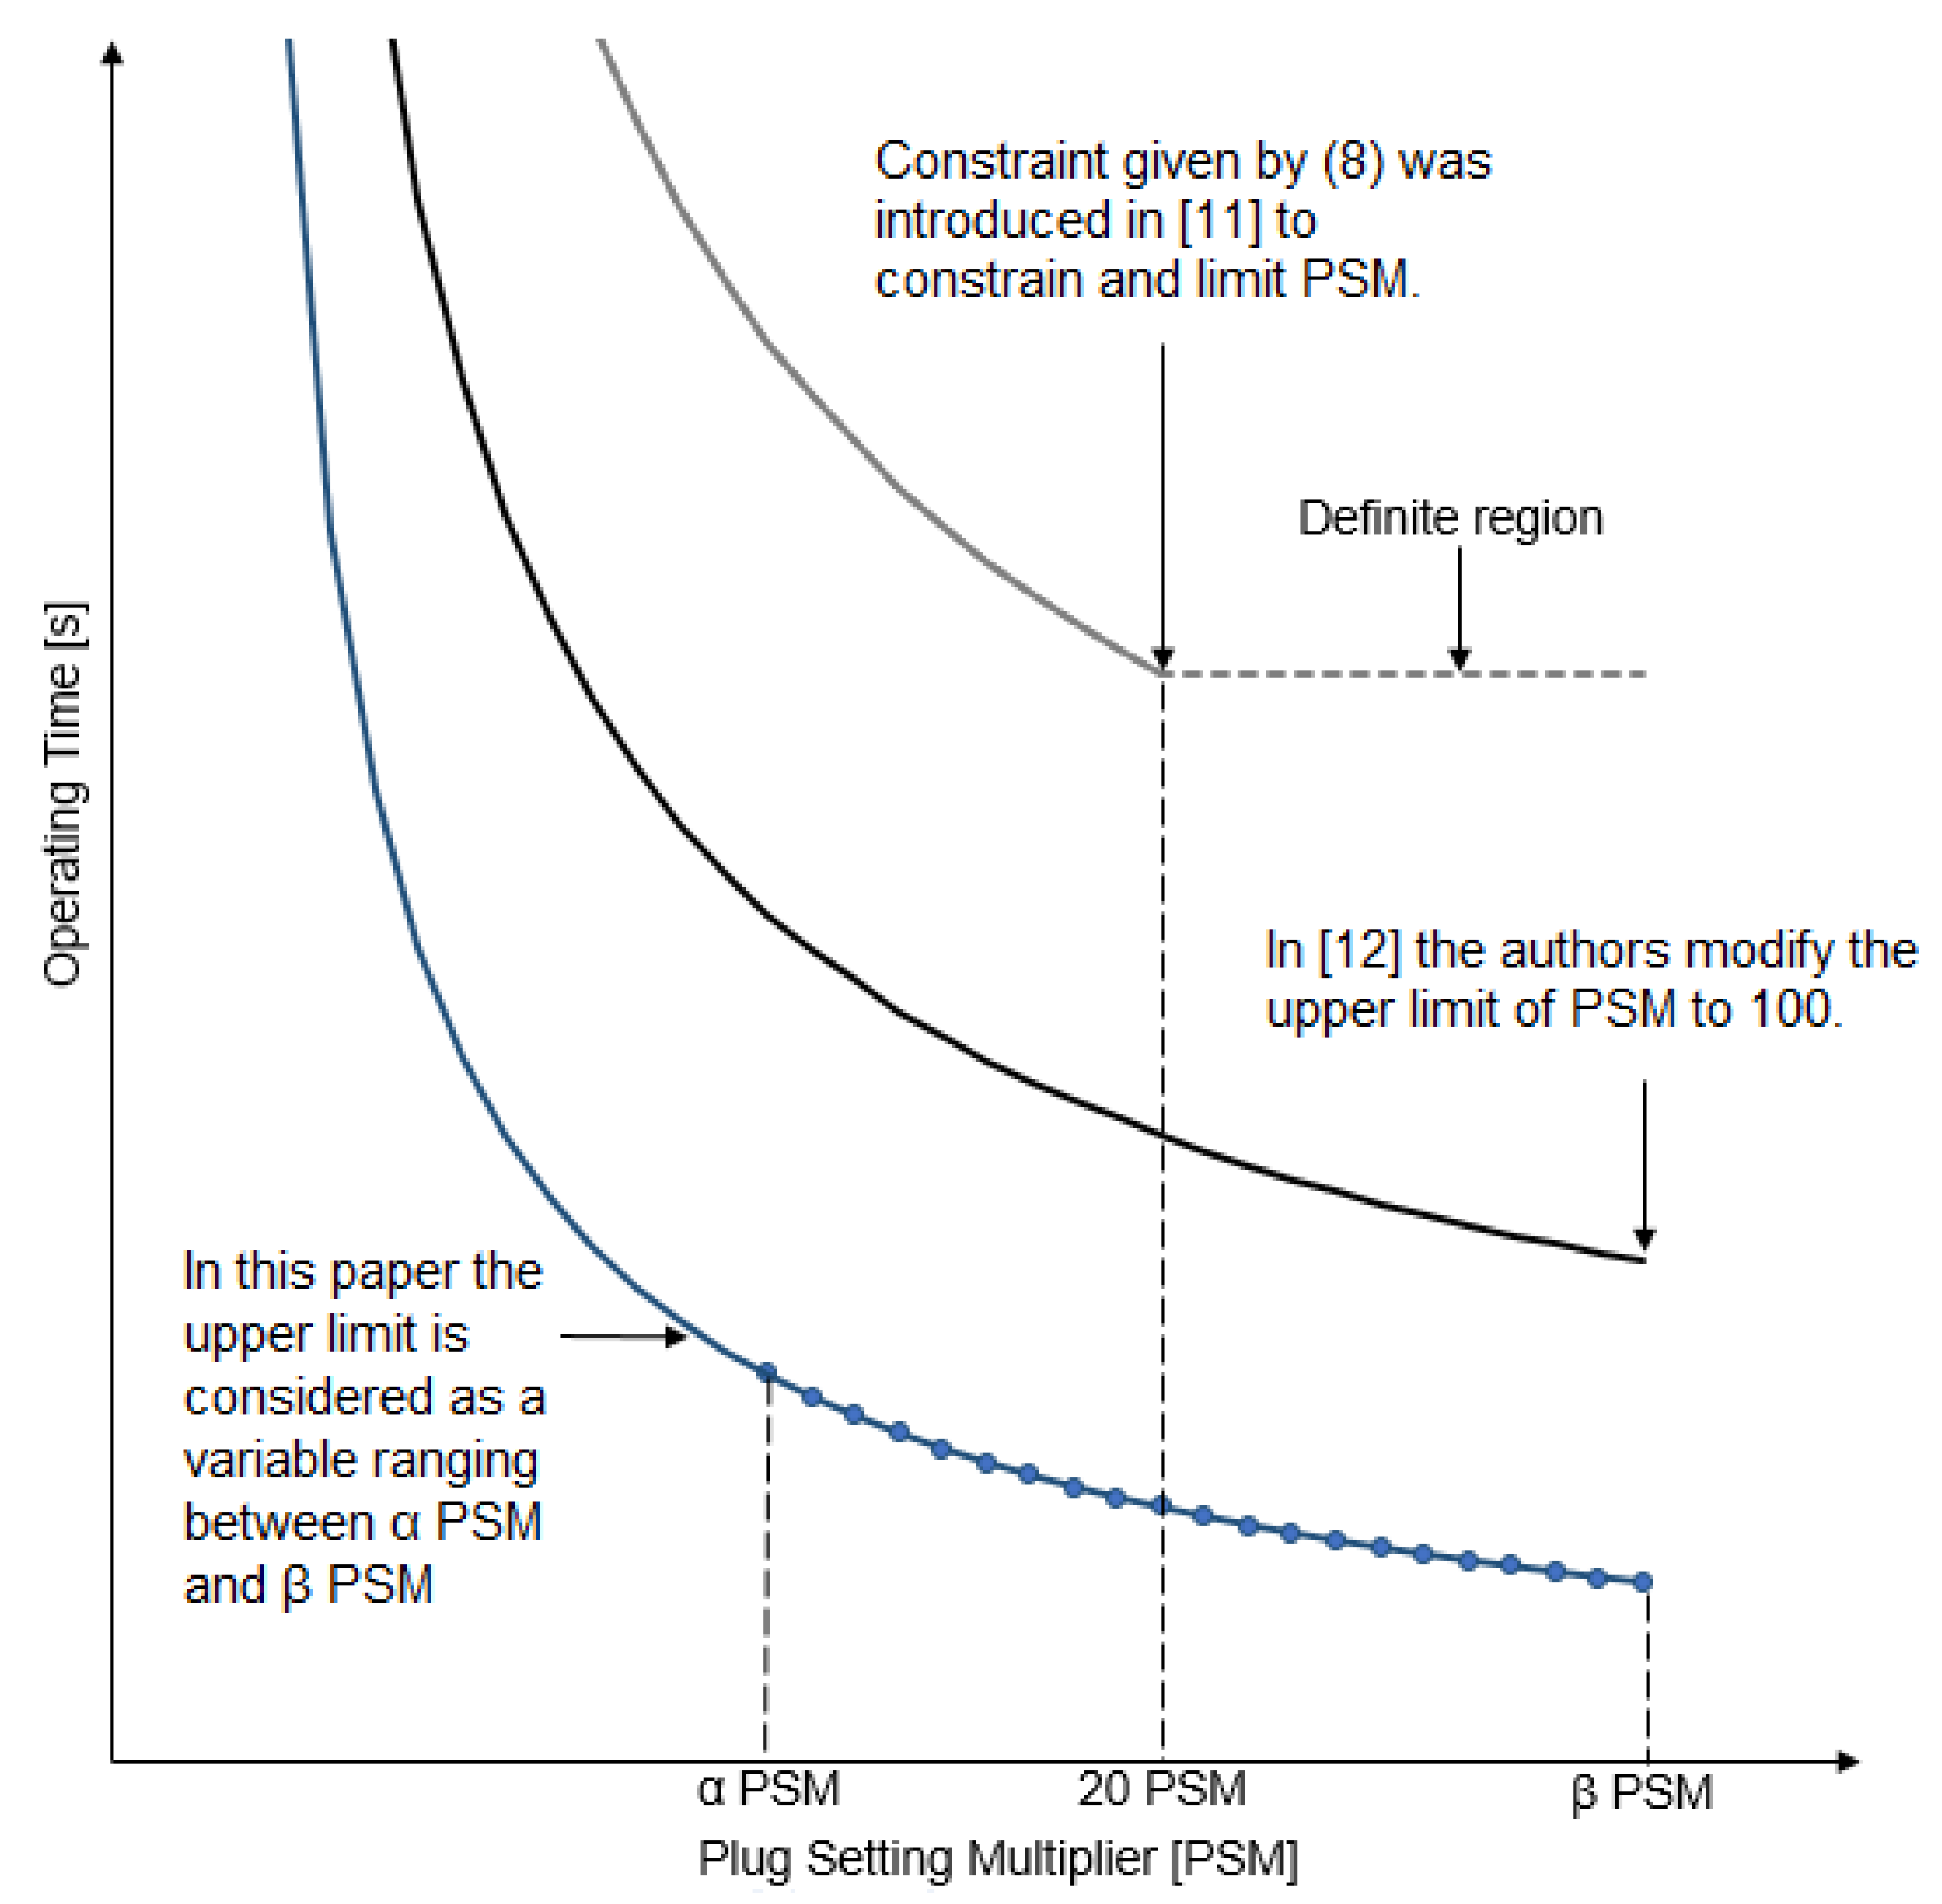
Modern DNs present changeable operational modes that increase the complexity to obtain the optimal settings of directional OCRs. To tackle this problem, the authors of [
11] proposed an alternative to the conventional protection coordination approach, adding a new constraint that takes into account the Plug Setting Multiplier (PSM). PSM is the ratio between the fault current seen by the relay and the pick up current. The tripping characteristic of overcurrent relays is limited by the PSM value. The standard characteristic curves of commercial relays are generally defined in a region where the minimum value is 1.1 times the PSM, whereas the maximum value is 20 times the PSM value. The DG units in microgrids considerably increase the short circuit level. Therefore, for different faults, this maximum value defined for PSM might be exceeded, affecting the sensitivity of the protections and causing loss of the coordination protection scheme. The new constraint introduced in [
11] considers the above-mentioned conditions by setting the maximum value of 20 times the PSM.
In [
12], the authors considered the constraint proposed in [
11] and also used a non-standard curve for improving the performance of the OCRs protection. Such a non-standard curve modifies the region defined by the characteristic curve. In this case, they considered a value of 100 times the PSM for its maximum value which allows improving the performance of the protection coordination.
Modern DNs require more intelligent and adaptive protection schemes. In this context, non-standard and user-defined characteristics of directional OCRs must be explored aiming to find coordination schemes adaptable to the new challenges imposed by modern DNs. This paper is aligned with this trend by proposing a novel approach for the coordination of directional OCRs in microgrids. The proposed approach improves and complements the non-standard characteristic described in [
11,
12]. In this case, the maximum limit of the PSM is treated as a variable instead of a parameter, as usually considered in conventional approaches. Although considering the PSM as a variable makes the coordination process more complex, it also expands the search space of coordination alternatives and improves the performance of the overall protection scheme, being applicable to DNs with high penetration of intermittent DG and several operational modes. Results obtained with the proposed methodology are compared with those reported in [
11,
12] using an IEC microgrid benchmark network. In all scenarios analyzed, the proposed methodology presented a better performance of the protection scheme.
This paper is organized as follows.
Section 2 presents the mathematical model for coordination of directional OCRs in microgrids.
Section 3 describes the methodology for obtaining the limits of the non-standard characteristic curve.
Section 4 presents the results and a comparative analysis. Finally,
Section 5 presents the conclusions and highlights the most relevant aspects of our research work.
3. Methodology
The model given by (
1)–(
9) was solved using a genetic algorithm (GA) implemented in Matlab. Genetic algorithms are metaheuristics that mimic Darwinian evolution in which the fittest individuals have greater chance to transmit their genes into the next generation. Other metaheuristic techniques have also been used for solving the optimal coordination of protections, such as particle swarm optimization [
22,
23] and differential evolution [
24]. GAs have shown to be effective in tackling the overcurrent protection coordination problem as indicated in [
25,
26,
27]. The flowchart of the GA procedure is depicted in
Figure 2.
The process that was implemented to solve the problem of directional OCRs coordination is as follows. Step 1: The test network is modeled using the Digsilent Power Factory software. Step 2: Several operational modes (OMs) are configured in the test network. Step 3: Short-circuit currents are calculated for different fault locations for every OM, using the Digsilent Power Factory software. Step 4: The short-circuit currents obtained in Step 3 are used as input parameters to the GA for the protection coordination. Step 5: The protection coordination model (Equations (
1)–(
9)) is solved for each OM using the proposed GA approach. Step 6: A set of parameters for the OCRs coordination is obtained for each OM. Alternatively, it is possible to modify Step 5 and obtain a single set of coordination parameters suitable for all OMs.
3.1. Initial Population
The GA starts with an initial set of candidate solutions known as population. Each individual within the population is represented by a vector that codifies a possible solution to the problem. In this case, every element of the vector corresponds to a setting of
and
for each relay. In the proposed protection coordination model,
and
are the decision variables. The length of the vector corresponds to twice the number of relays present in the test network. The GA implemented generates the initial population randomly considering the minimum and maximum limits of the decision variables.
Figure 3 depicts an example of a candidate solution. In this case, the candidate solution indicates that the TMS of relays 1, 2, and
n must be set to 0.05, 1, and 0.9, respectively. Also, the maximum PSM limits for the same relays must be set to 16, 20, and 40, respectively.
3.2. Fitness Evaluation
Each solution candidate has an associated cost or value of the objective function. In the GA, this value is referred to as the fitness of the individual. Once a given number of solution candidates are proposed, their associated costs or fitness are evaluated. In this case, the objective function given by Equation (
1) represents the operation time of the OCRs. The objective function is evaluated for each individual and these are classified from best to worst. To enforce constraints, the objective function of unfeasible candidate solutions is penalized. The best solution candidates are those with the lowest value of the objective function.
3.3. Tournament Selection
After the evaluation of the objective function, some individuals are chosen among the best to generate new possible solutions. For this case, a selection by tournament is implemented which consists of randomly selecting two pairs of individuals and choosing the individual with the best fitness. There are as many tournaments as individuals. The best individuals go through the next stages of crossover and mutation.
3.4. Crossover
The crossover or recombination is the stage of the algorithm in which parents exchange their genetic material to generate new individuals. In this case, the crossover is performed over two winners of the tournament (parents), then their bits are crossed at a random position of the vectors generating two new individuals (offspring). In this case, each new individual preserves part of the genetic material of both parents.
Figure 4 illustrates the crossover stage.
3.5. Mutation
Mutation consists of small variation of the new individuals, performed with a given probability. The mutation stage introduces diversification and allows the algorithm to eventually escape from local optimal solutions. In the mutation process, one of the offspring is randomly selected with a given probability, then one of its bits is changed. In this case, the current value of the bit is randomly changed within its limits.
3.6. New Generation
Once the recombination and mutation processes are finished, the population of offspring and parents is grouped together. The fitness of each individual is then used for selecting the new population. As the new population will be twice the initial one, half of the individuals are discarded (those with the poorest performance) and a new generation is ready for the next iteration of the algorithm.
3.7. Stopping Criteria
Two stopping criteria are considered in the GA: (1) a predefined maximum number of iterations, and (2) a maximum number of iterations without an improvement of the objective function. If either of these two criteria occurs, the algorithm stops.
4. Tests and Results
To prove the effectiveness of the proposed approach, a benchmark IEC microgrid that integrates different DG technology types was considered. The parameters of the microgrid, depicted in
Figure 5, can be consulted in [
28]. Four OMs, as described in
Table 1 were analyzed. In the first operational mode, the DG units are disconnected from the microgrid and the load is supplied through the main grid. In the second one, all DG units operate along with the main source of the grid. In the third operational mode, the demand of the microgrid is fed via the main grid along with DG1 and DG2. Finally, in the fourth operational mode, the microgrid is operated in islanded mode, employing all DG units and disconnected from the main utility.
The test system was implemented in DIgSILENT PowerFactory. Five three-phase faults at lines DL-1, DL-2, DL-3, DL-4, and DL-5 were considered. The short circuit levels for these faults are illustrated in
Figure 5. F1 represents a fault at line DL-5, and F2 and F3 are faults at lines DL-4 and DL-2, respectively. F4 represents a fault at line DL-1 and F5 represents a fault at line DL-3. Note that every system operator determines the types of faults and locations to be evaluated in order to establish the protection coordination. In this case, the aforementioned faults were selected for comparative purposes with [
11,
12]. Nevertheless, any other set of faults can be considered. Calculations and tests were performed according to the recommendations of the IEEE Standard 242 which is widely used for overcurrent protections coordination [
29].
The results obtained with the proposed approach regarding the coordination of the directional OCRs, were compared with the ones reported in [
11,
12]. The transformation ratios of current transformers
and pickup currents
are shown in
Table 2.
IEEE Standard 242 [
29] recommends that the coordination time between the main relay and the backup relay
must be equal or greater than 0.2 seconds. This paper considers a
of 0.3 seconds for comparative purposes. For the operation time of the OCRs, the IEC Normal Inverse curves with constants
A and
B of 0.14 and 0.02, respectively, were considered. Relays are labeled with numbers ranging from 1 to 15 preceded by the letter R.
Figure 6 shows the location of each relay. For the fault cases analyzed, letter “P” was assigned for main relays, whereas letter “B” was assigned to for backup relays.
Several tests were performed for the parameter tuning of the GA. The combination of parameters that presented the best results were population of 100, number of generations of 1000, crossing rate of 0.7, and mutation rate of 0.3. In all scenarios under analysis, CB-LOOP1 was considered to be open (see
Figure 6).
4.1. Results for Operational Mode 1
In this operational mode, the microgrid is connected to the main grid while all DG units are disconnected (see
Table 1). In this case, simulations were performed for the five different faults previously described.
Table 3 presents the results obtained with the proposed model and the ones reported in [
11,
12]. The
and
is presented for each relay as well as the sum of operating times for all relays
(objective function). Note that the proposed model presents faster operating times guaranteeing coordination of backup and main OCRs. All relays presented different
values. Particularly, relay R7 has a
lower than the
obtained in [
11,
12]. This allows improving the operating times of all relays.
Table 4 presents the operation times of the main and backup relays for each fault. Note that in all cases the proposed approach presents lower operation times than those reported in [
11,
12].
4.2. Results for Operational Mode 2
In this operational mode, all DG units operate in the microgird along with the main source of the grid. The coordination parameters of the OCRs obtained with the GA for this operational mode are shown in
Table 5. The
and
values for each relay, along with the sum of operating time of all relays
, are presented. Note that with the proposed coordination approach, all relays presented different
values, and the operation time
is lower than the one reported in [
11,
12], which consider a fixed
. Results presented in
Table 6 show the operation times of main and backup relays for each fault. Note that lower operation times are also obtained with the proposed model, guaranteeing coordination among main and backup relays.
4.3. Results for Operational Mode 3
In this operational mode, the microgrid is connected to the main network, DG1 and DG2 units are connected, and DG3 and DG4 units are disconnected. The parameters of the OCRs coordination, obtained with the GA, are presented in
Table 7 indicating
and
for each relay, as well as the total operation time
. It can be observed that implementing the proposed approach reduces the total operation times from 14.04 and 12.67 seconds (with the methodologies reported in [
11,
12], respectively) to 10.71 seconds. Also, all relays present different
values. Particularly, relay R7 has a
lower than the one obtained in [
11,
12], which allows improving the operating times of all relays and maintains the coordination times of main and backup relays.
Results presented in
Table 8 show the operating times of main and backup relays for each fault. Note that operation times of main and backup protections were lower in all cases with the proposed approach.
4.4. Results for Operational Mode 4
In this case, the microgrid is operating in islanded mode and the load is supplied by the DG units.
Table 9 presents the results of the OCRs coordination obtained with the GA. As with the previous operational modes, the proposed approach results in lower total operation time
when compared to the results presented in [
11,
12]. Also, all relays have different
values. Results presented in
Table 10 show the operation times of main and backup relays for each fault.
4.5. Results Considering All Operational Modes Simultaneously
So far, a different set of coordination parameters for the OCRs has been obtained for each OM in
Section 4.1,
Section 4.2,
Section 4.3 and
Section 4.4. However, the proposed approach can also be used to obtain a single set of coordination parameters suitable for all OMs.
Table 11 shows a set of coordination parameters, obtained with the proposed GA, that is suitable for all OMs. Note that all relays also present a different
.
Table 12 presents the operation times of the main and backup relays for each fault. In this case, the coordination between main and back up relays is also guaranteed.
A comparison of operation times for different OMs using multiple and a single set of coordination parameters is presented in
Table 13. Operation times reported in columns 2 through 4 in
Table 13 consider an independent set of parameters for each OM as described in
Section 4.1,
Section 4.2,
Section 4.3 and
Section 4.4. Note that for all OMs the proposed approach presents lower operation times (column 4). On the other hand, the operation times presented in column 5 are computed considering a single set of parameters suitable for all OMs. Such a single set of parameters results in different operation times depending on the OM of the microgrid. As expected, obtaining a single set of coordination parameters suitable for all OMs results in higher operation times, as shown in column 5 of
Table 13. Note that the works in [
11,
12] do not present a single set of coordination parameters suitable for all OMs, which does not allow a direct comparison with the results of the proposed approach. Despite this, note that the proposed approach outperforms the results of [
12] in OM1 and OM2 and the ones of [
11] in OM1 even when considering a single set of coordination parameters for all OMs.
4.6. Results Considering a Meshed Topology
To show the versatility of the proposed approach a meshed topology was also considered. In this case, switches CB-LOOP1 and CB-LOOP2 were closed to obtain a loop in the microgrid.
Table 14 presents the coordination parameters and the total operation time
for each OM, whereas
Table 15 presents the operation time of the main and backup relays. Protection coordination of OCRs in a meshed topology is a more complex task; therefore, higher operation times where obtained when compared to the previous results that considered a radial configuration.


