Article

Numerical Investigation on Instability Flow Behaviors of Liquid Oxygen in a Feeding Pipeline with a Five-Way Spherical Cavity

1
Institute of Refrigeration and Cryogenic Engineering, Xi’an Jiaotong University, Xi’an 710049, China
2
State Key Laboratory of Technologies in Space Cryogenic Propellants, Beijing 100028, China
3
Beijing Institute of Astronautical System Engineering, Beijing 100076, China
*
Author to whom correspondence should be addressed.
Energies 2020, 13(4), 926; https://doi.org/10.3390/en13040926
Submission received: 19 January 2020 / Revised: 10 February 2020 / Accepted: 15 February 2020 / Published: 19 February 2020

Abstract

:
The hydrodynamic information of liquid oxygen in the conveying pipeline of cryogenic launch vehicles directly determines the reliability of the operation of the turbopump. A 0.09 MPa anomalous pressure fall phenomenon in the feeding system has been observed during the flight and run test of a cryogenic rocket with four parallel engines. In previous work, we set up a full-scale experimental system with liquid oxygen as media. The anomalous pressure fall was successfully reproduced. Experimental studies of this phenomenon suggest that the problem might be associated with vortices into the five-way spherical cavity structure. The objective of this study was to determine the three-dimensional instability flow by computational methods to identify and better understand the anomalous pressure fall phenomenon. A numerical model developed by the turbulent conservation equations was validated by experimental data. The generation and evolution of vortices into the five-way spherical cavity of feeding pipelines was captured. It was found that the root cause of the instability flow causing the unusual pressure fall is the formation of a spindle-like vortex into the five-way spherical cavity due to disturbance of the inlet liquid oxygen. The results showed that there is a mirror-symmetrical four-vortices structure in the absence of disturbance, in which the liquid oxygen pressure fall with the rise of the Reynolds number is in good agreement with the predicting values calculated by a set of traditional empirical correlations. In the case of the specific operating conditions, it is also consistent with the experimental results. When the disturbance occurs at the inlet of the spherical cavity, the mirror-symmetrical four-vortices structure gradually evolves into the mirror-symmetrical two-vortices structure. When the disturbance is further enhanced, the mirror-symmetrical two-vortices structure merge with each other to form a spindle-like vortex, which is similar to the Rankine vortex structure. The pressure fall on the corresponding side of the spindle-like vortex core reduces abnormally, and is about 0.07 MPa, which is consistent with the experimental data under certain disturbance conditions. Moreover, it was found that the spindle-like vortex is a stable eddy structure, and would continue to exist once it is formed, which could also not disappear with the removal of the disturbance.

1. Introduction

The distribution behavior of flow in a pipeline system is vital for fluid transportation, especially in cryogenic rockets, which require liquid oxygen oxidizer to be fed from a propellant tank into multiple engines in parallel during flight with a constant mass flow rate. Flow pressure loss must be small enough to maintain net positive suction pressure (NPSP) requirements at the inlet of turbopumps, thereby preventing cavitation damage to the engine turbopumps. In order to achieve even distribution, a spherical cavity structure is usually used at the junction between a main pipeline and multiple branch pipelines. Nevertheless, for a cryogenic launch vehicle with four engines in parallel, there is an anomalous pressure fall in the symmetrical side of the branch pipeline with a five-way spherical cavity structure during numerous flight and test runs. Although there was no accident, the reliability of the rocket system was reduced. Since the cryogenic propellants are prone to cavitation with the decrease of pressure, which brings failure risk to the turbopump of the engine, the anomalous pressure fall phenomenon needs to be focused on. In our previous work [1], we set up an experimental verification system of a 1:1 actual size. The tests of liquid oxygen were conducted to explore the flow instability characteristics. It was found that the pressure loss exists inherently, and changed regularly (about 0.07 MPa), which is much greater than the normal pressure loss. However, a study on the root cause of the anomalous pressure fall has not been conducted.
For flow distribution problems in engineering applications, many researchers [2,3,4,5,6,7,8,9,10,11,12,13,14,15,16] have conducted studies on the flow characteristics of a typical parallel branch pipeline system, and put forward a large number of semi-theoretical and semi-empirical mathematical models. Acrivos [2] established a one-dimensional flow equation based on a constant cross-section pipeline. He believed that the pressure fall in the branch pipeline was caused by the wall friction and fluid momentum dissipation. Bajura [3,4] conducted an analytical study on the flow performance of distributing systems for both inlet and outlet manifolds. He gave a performance parameter to conduct a quick assessment of the flow distribution in a defined manifold system, which included three typical characteristics of the manifold: Namely, a momentum change, a lateral flow resistance, and the area ratio. Meanwhile, he also studied the flow distribution in the lateral branches of dividing, combining, reverse, and parallel flow manifold systems both analytically and experimentally, and obtained the flow rates and pressures in the headers of any of the above four basic manifold configurations. Bassiouny [5,6] calculated the axial velocity and pressure distributions in both the inlet and outlet conduits of plate heat exchangers, the flow distribution in the channels between the plates, and the total pressure fall. It was found that there is a general characteristic parameter for all the plate heat exchangers, which determines the flow behaviors. Liu [8] addressed a general problem in the uniform distribution of a single-phase flow into a number of flow channels. They developed four tee-type flow distributors, which work for four different inlet flow conditions, and concluded that the flow distributors developed in this work could satisfy the industrial needs for a uniform flow distribution. Rahmeyer [12] tested the reducing pipe and diffuser pipe, regular large diameter elbow, and reducible elbow, and found that there was an obvious relationship between the loss coefficient and velocity. Sethuraman [13] studied the loss coefficient for a single elbow and two coupled elbows. The results showed that when the distance between the two elbows is greater than or equal to 12 times the diameter of the pipe, the pressure loss coefficient will not change. Reimann [14] quantitatively studied the pressure fall characteristics of the T-junction through experiments, and put forward a theoretical analysis method, which is still widely used to date. Costa [16] carried out measurement of the pressure fall for the flow of a Newtonian fluid in 90-degree tee junctions with sharp and round corners. It was found that rounding the corners decreased the energy losses by between 10% and 20%, relying on the flow rate ratio, due to the reduction in the branching flow loss coefficient, whereas the straight flow basically remained unaffected.
Much work has been carried out on vortex flow behaviors [17,18,19,20,21,22,23,24,25]. Luo [17] studied the flow characteristics of a single-phase fluid in the parallel branch pipes of a header. It was found that there is a vortex zone in the T-shaped area, which would change the flow distribution of branch pipes sharply. Yang [18] introduced a new Omega vortex identification method to perform vortex analysis in a liquid rocket engine oxygen turbopump. The results showed that the new Omega method could effectively remove the non-vortical vorticity and better capture the vortex structures in the flow filed. The SST k-w model was chosen to model the evolution of the vortices in the impeller–diffuser interaction region. Oevelen [19] developed a numerical method to model two-phase flow distributions in parallel-channel systems, which was combined with the pressure fall model for individual parallel channels with a pump curve in a system flow network. The results showed that below some critical inlet, the uniform flow distribution is always stable, and maldistribution does not occur, regardless of the heat flux and flow rate. Chen [20] derived and compared vortex identification methods for detecting vortices in planar velocity fields. It was found that while all methods (△, Q, λci, λ2 criteria) are able to extract strong vortices, their efficiencies in identifying weaker vortices are not necessarily the same. Zhou [21,22] studied the viscous evolution of a single hairpin vortex-like structure with strength and a core diameter in a mean turbulent field of a low Reynolds number channel flow using direct numerical simulation. It was found that the initial vortical structure always develops into a classical hairpin-shaped vortex with a Ω-shaped head and a pair of counter-rotating long quasi-streamwise vortex legs. Roth [23] presented a novel method to extract vortical structures from 3D CFD vector fields automatically. He distinguished locating the core line from calculating attributes of the strength and quality. Jeong [24] proposed a definition of a vortex in an incompressible flow in terms of the eigenvalues of the symmetric tensor S2 + Ω2; here S and Ω are respectively the symmetric and antisymmetric parts the velocity gradient tensor, u. The definition could capture the pressure minimum in a plane perpendicular to the vortex axis at high Reynolds numbers.
For the propellant feeding system of cryogenic launch vehicles, much work has been performed on the optimal design and unsteady flow characteristics [26,27,28,29,30,31,32,33,34,35,36,37,38]. For H-IIB launch vehicles in Japan, both liquid hydrogen (LH2) feed lines and liquid oxygen (LOX) feed lines each consist of two independent feed pipes from a tank [26]. This configuration was selected to avoid interference between two feed lines. Ahuja [28] reported that conveying components could experience cavitation-based instability flow, thus leading to large-scale shedding of vapor clouds and pressure oscillations. They presented simulations of the diverse unsteady phenomenon associated with the valve and feed systems that included a valve stall, valve timing studies, as well as two different forms of cavitation instabilities. For the propulsion feeding system of Korea Sounding Rocket-III, a feeding pipeline was designed to feed a certain amount of propellant from the propellant tank to the turbopump manifold inlet during combustion [29]. They found that the pressure in the combustion chamber changed abruptly from ambient to 200 psi during the ignition period. The propellant flow rate that flowed into the combustor could be changed greatly in this period according to the pressure difference, which might cause feeding system instability. For X-34 managed by Marshall Space Flight Center, which is a single-stage LOX/rocket propellant 1(RP-1)-fueled launch vehicle, the LOX feed subsystem design is an Inconel tube with two dual axis gimbals, a z-axis pinned gimbal, and a pressure-compensating elbow [30]. Vu [31] illustrated the X-34 main propulsion system configuration, which included liquid oxygen and rocket propellant #1 feedlines. They conducted a CFD analysis to determine the flow field in the new feedlines. The results showed that the new duct design does not have a dramatic effect on the flow at the outlet of the feedline. The introduction of the neck-down and the tighter bend did not grossly affect the flow and since the flow is fully developed at the engine interface, there is no need to use the flow straighteners at the engine inlet. Dill [35] discussed the LOX feed system of the National Launch System-2 vehicle, which has dual LOX primary feedlines. Each line feeds three space transportation main engines. They developed six preliminary designs for a single LOX primary feedline configuration, and discovered that the spider concept is promising. Chen [36] observed a 4000 Hz vibration phenomenon during the test firings of several space shuttle main engines. They suggested that the typical phenomenon might relate to vortex shedding from the vanes within the LOX tee manifold.
Although many investigators have studied the optimal design of the feeding pipeline in cryogenic rockets, instability flow features in the feeding pipeline with the five-way spherical cavity structure are barely reported in public references. In order to better understand the instability flow and reveal the root reason causing the anomalous pressure to fall in the feedline, a 3D numerical model for the 1:1 full-scale feeding pipeline with the five-way spherical cavity structure was established. The validity of the numerical calculation model was verified by the experimental results of our previous study. By much trial calculation, the generation and evolution of the vortex into the five-way spherical cavity were accurately captured. The pressure decrease along the flow direction in the feedline and physical field were analyzed. These results will help to the fault location of the anomalous pressure decrease in the feeding systems of cryogenic multiple engines in parallel.

2. Description of Instability Flow Phenomenon in LOX Feedlines

According to the telemetry data, it was found that during the operation of cryogenic rockets, the outlet pressure of symmetrical two-branch pipelines suddenly falls abnormally at a certain time, as shown in Figure 1. Before falling down in Figure 1, the outlet pressure of four-branch pipelines remained stable basically. At the moment corresponding to the blue circle, an anomalous pressure decrease of about 0.09 MPa occurred at the inlet of engine II/IV, which was arranged symmetrically. The pressure differences would continue until the four-branch pipelines are shut down, then the outlet pressure of each branch pipeline is restored to the same level.
To address the problem and achieve fast fault location, in a previous study [1], we reproduced the anomalous pressure fall phenomenon using full-scale liquid oxygen experiments. The experimental results indicated that the pressure fall under certain conditions exists objectively, and is regular. To further understand the instability flow behaviors causing the anomalous pressure fall, the numerical simulation presented in this paper was conducted.

3. Computational Methodology
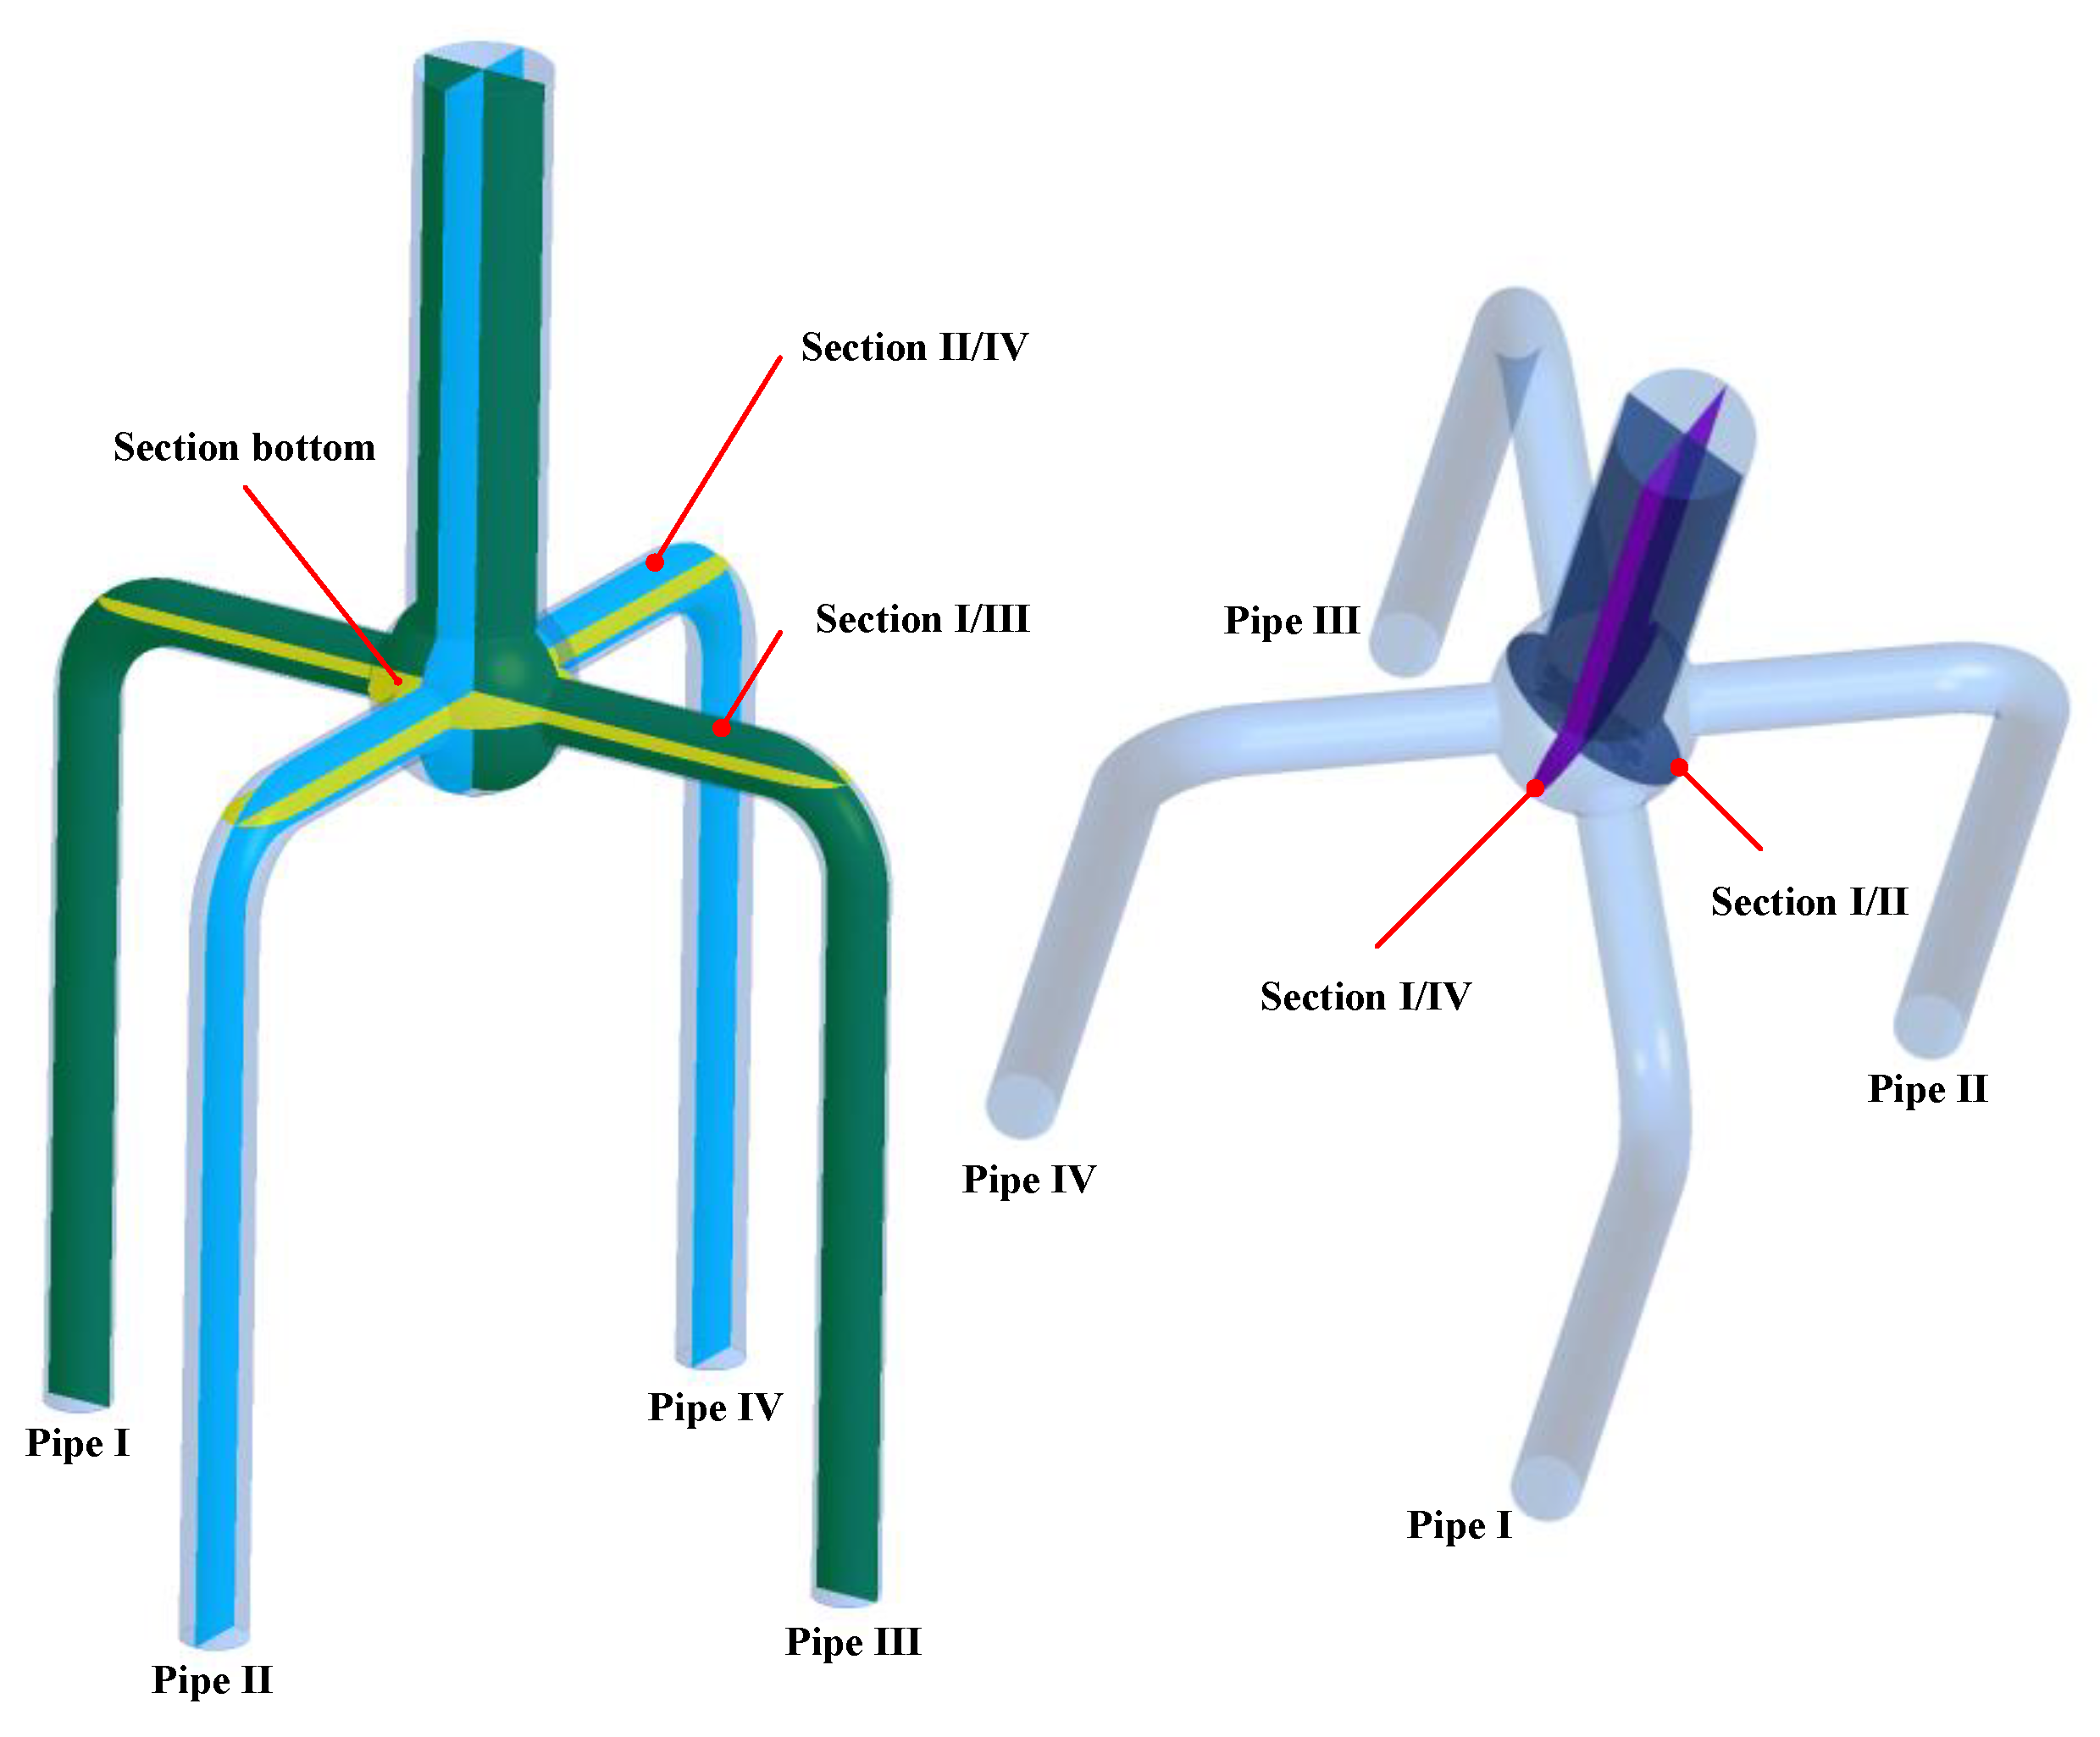
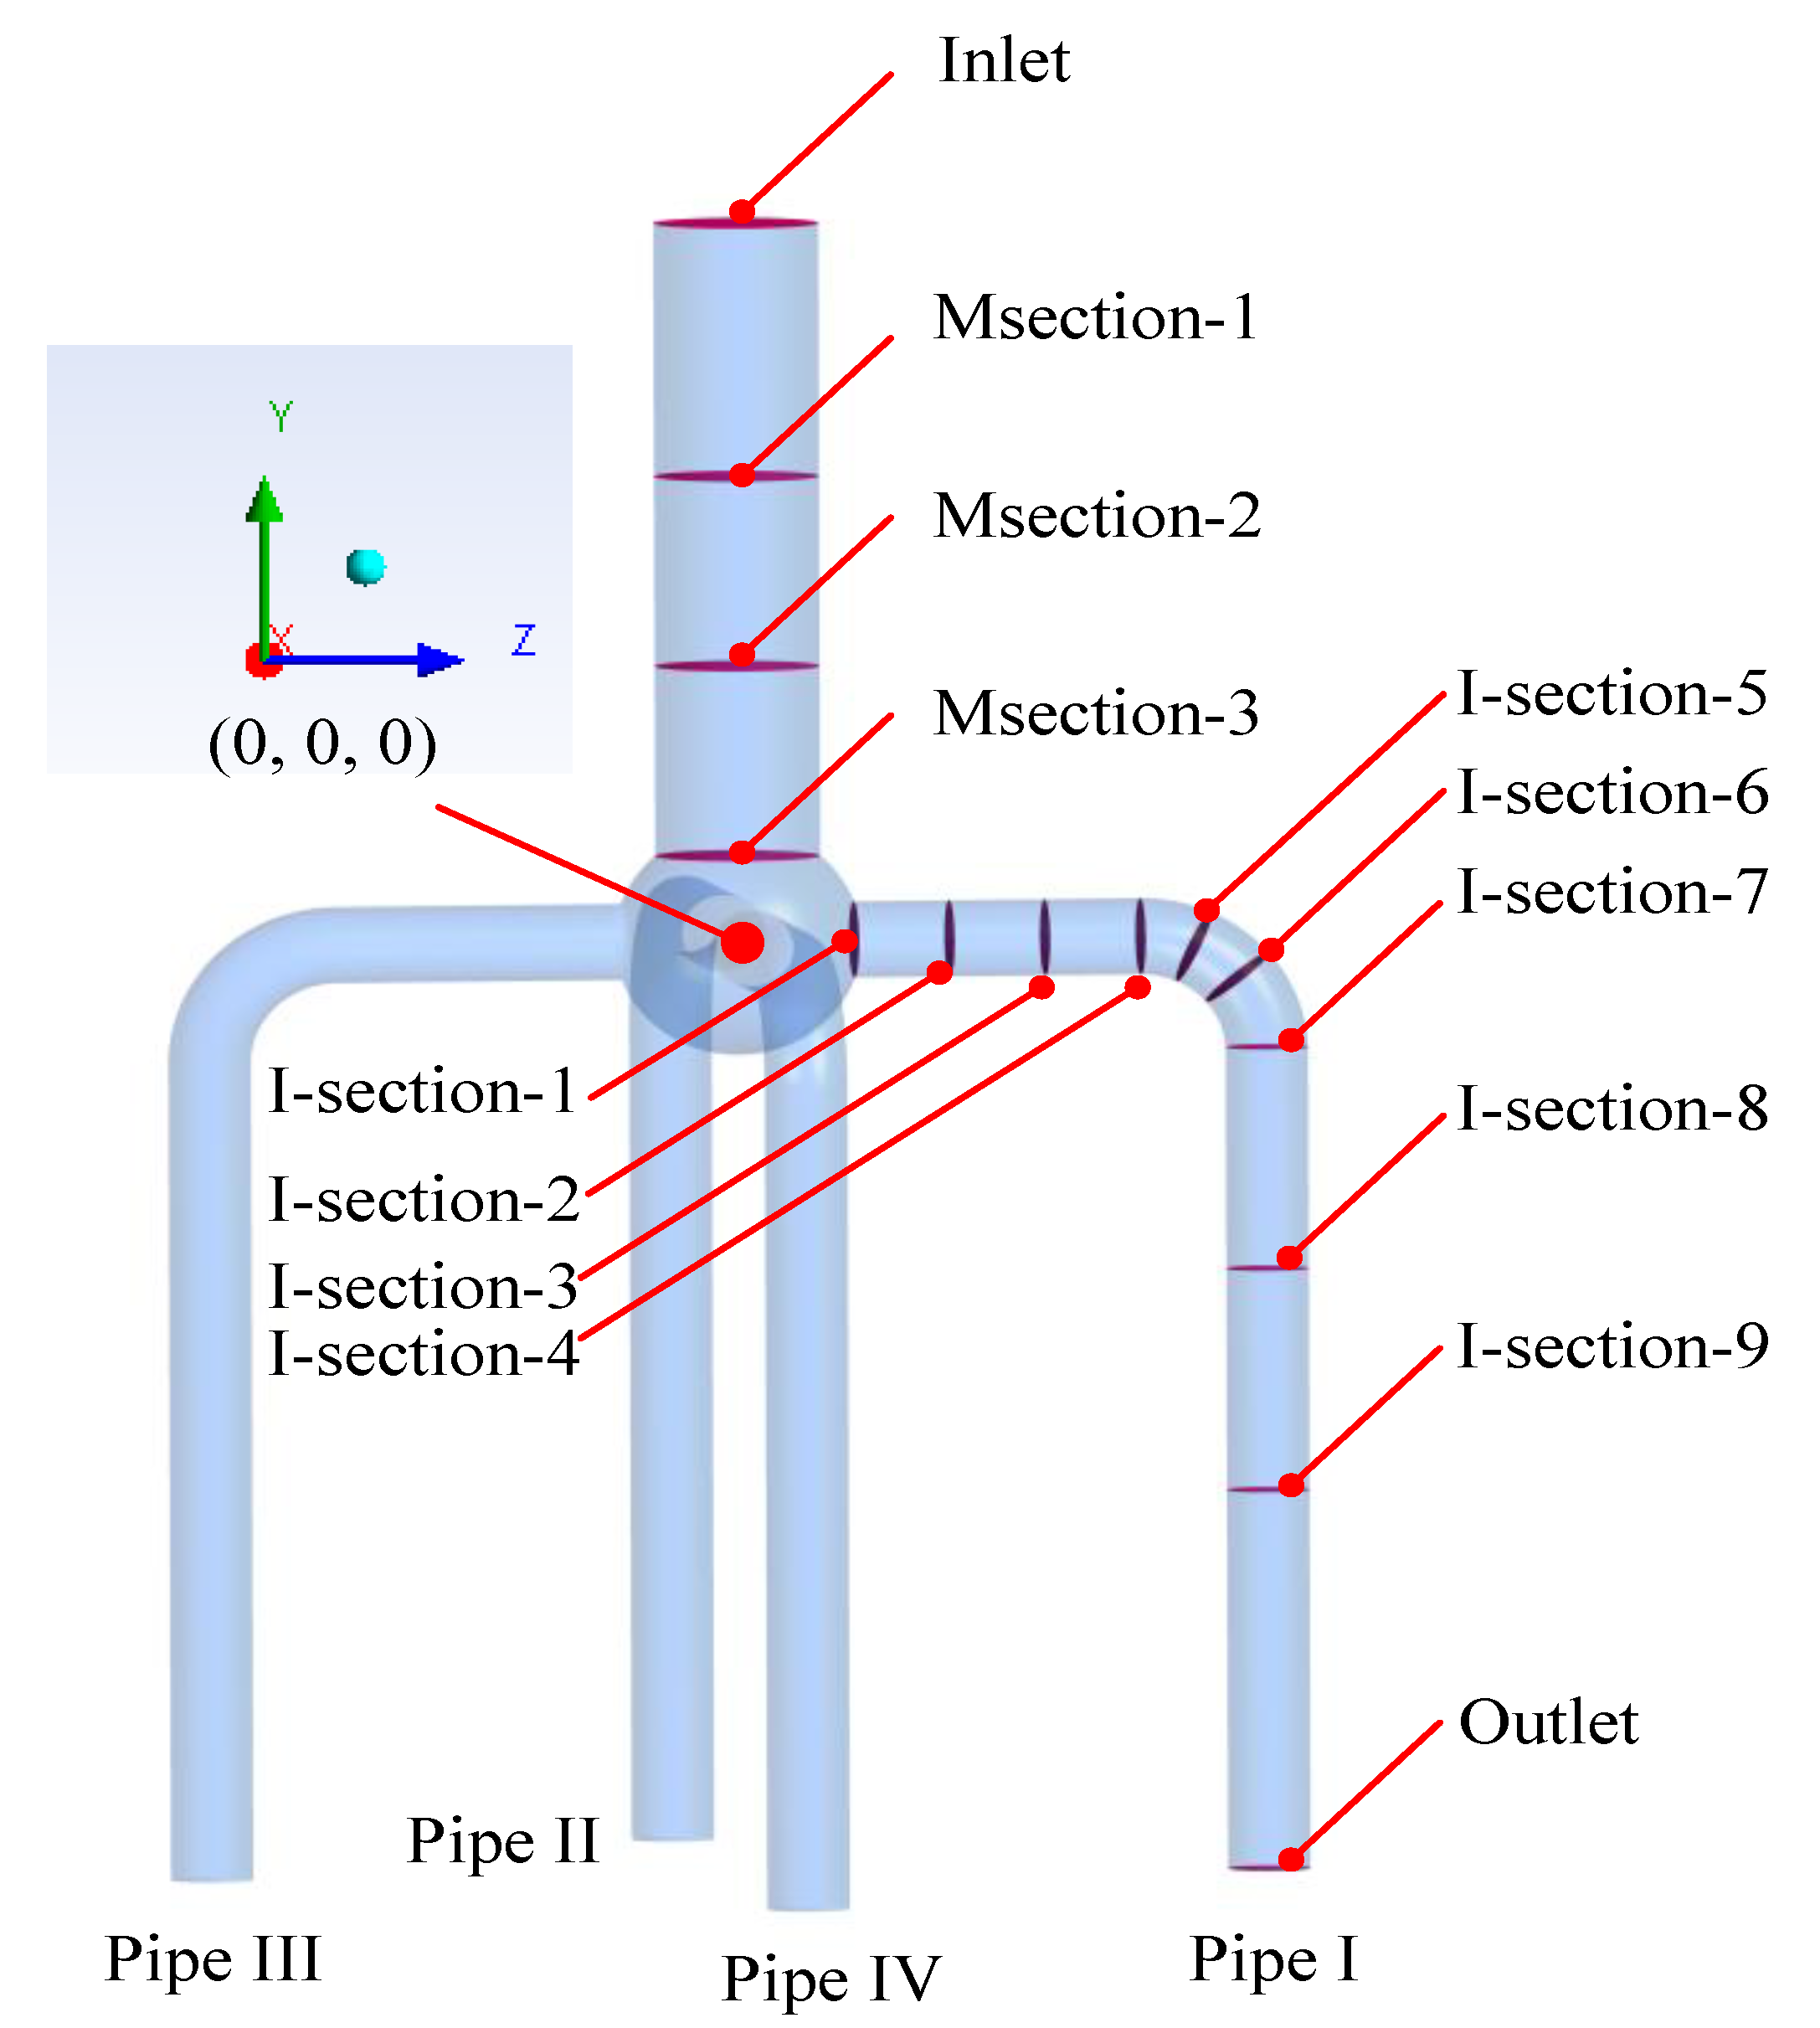
3.1. Physical Model

The actual feeding system consisted of a main pipeline, a flowmeter, a five-way spherical cavity, four-branch pipelines, valves, pressure sensors, temperature sensors, and the corrugated structure of each branch pipeline, which was to evenly feed liquid oxygen from a tank to four engines in parallel. Considering the complexity of the system, the geometry structure needed to be simplified to better study the instability flow of liquid oxygen, and capture the evolution of vortex in the flow field, so the physical object was simplified, including a main pipe, a five-way spherical cavity, and four branch pipes, as shown in Figure 2. The main geometric dimensions remained unchanged, such as the diameter, pipe length, five-way spherical cavity size, elbow size, etc., as shown in Table 1. Moreover, the corrugated pipes were simplified as straight pipes equivalently.

3.2. Governing Equations

The phenomenon of flow instability of liquid oxygen in the feeding system with the five-way spherical cavity was governed by the continuity, momentum, and turbulence equations. The Reynolds-averaged Navier–Stokes equations of the incompressible steady state could be expressed here in Cartesian tensor form as follows [39,40]:
Continuity equation:
x i ( ρ u i ) = 0 .
Momentum equation:
x j ( ρ u i u j ) = p x i + x j [ μ ( u i x j + u j x i ) ρ u i u j ¯ ] + ρ a i ,
where ρ is the liquid oxygen density; ui is the mass-averaged velocity; u i u j ¯ is the specific Reynolds stress tensor; and ρai is the gravitational body force:
ρ u i u j ¯ = μ t ( u i x j + u j x i ) 2 3 δ i j ( ρ k + μ t u k x k ) ,
μ t = ρ k ω ,
where μ t is the turbulent viscosity, k is the turbulence kinetic energy, and ω is the turbulence frequency.

3.3. Turbulence Model (SST k-ω)

The k-ω based on the shear stress transport (SST) model takes into account the transport effects of the turbulent shear stress into the formulation of the eddy viscosity, so it provides highly accurate predictions at the onset or flow separation under adverse pressure gradients [41,42]. For this reason, the SST k-ω model was used in the present paper to accurately predict the formation and evolution of vortices in the feedline with the five-way spherical cavity.

3.4. Boundary Conditions

During the flight of cryogenic rockets, in order to ensure that the inlet pressure of the turbopump is greater than the saturation pressure corresponding to the local temperature, the ullage pressure of the tank is kept constant by pressurization. The outlet of each branch pipeline is connected to the inlet of the turbopump, which maintains a constant flow. Therefore, considering actual working conditions, the boundary condition of the total pressure was specified at the main pipeline inlet for the feedline with the five-way spherical cavity, the boundary condition of the mass flow rate was set in each branch pipeline outlet, and the rest was set as the boundary condition of the wall, as shown in Figure 2.

3.5. Solution Strategy

Considering the flow process of the complex structure for liquid oxygen, an element-based finite volume method was used, which adopted a mesh to discretize the spatial domain first. A coupled solver ANSYS CFX was selected, which consisted of Navier–Stokes equations (for u, v, w, p). In the solution approach, a fully implicit discretization of the equations was used at any given time step. The advection scheme was set as the high-resolution scheme without introducing new extrema. The timescale control was set as the physical timescale, which was about 0.01. For the initial conditions of domain, the Cartesian velocity components, u, v, and w, were given as 1 × 10⁻⁵ m/s, 1 × 10⁻⁵ m/s, and 1 × 10⁻⁵ m/s, respectively. The relative static pressure was designed as 0 Pa, and The turbulence option was set as medium (intensity = 5%). The convergence was judged by the root-mean-square residual value, which was 10−6, satisfying the requirements of the convergence criteria.
Considering that an automatic near-wall treatment method provides a gradual switch between low-Reynolds number grids and wall functions without a loss in accuracy for the SST k-ω mode, it was used in the present paper.
In practical working conditions, there are varying degrees of disturbance upstream or downstream of the five-way spherical cavity structure, which leads to the fact that although the geometry is symmetrical, the flow field might be asymmetric. The most typical case is that the flow field of liquid oxygen flowing out from the bottom of the tank may not be symmetrical. Especially under the condition of high pressure and high Reynolds number in the cryogenic rockets, the turbulent flow field is more easily disturbed. Obviously, the disturbance is random. Therefore, in order to study the effect of disturbance on the flow field in the feeding pipelines, the numerical technique applying an artificial disturbance at the inlet of feeding pipelines was adopted.

4. Verification of Numerical Computation

4.1. Grid Generation

The mesh quality has a notable influence on the accurate numerical solution of the liquid oxygen flow and calculating time. In this study, all hexahedral mesh was generated by ANSYS ICEM CFD’s mesh generation tools. A 3D block topology model was created to generate Ogrids to ensure good quality meshes for very complex geometry, as shown in Figure 3. Moreover, the wall grid near the pipeline surface should be densified to accurately resolve the velocity without a loss of efficiency. To better capture the vortex, the computational domain of the five-way spherical cavity was densified.

4.2. Y+ Independence Study

The near-wall treatments for wall-bounded turbulent flows are very important for the fidelity of the numerical solution. A fine mesh with y+ around 1 for highly accurate simulations was recommended in some literature. Nevertheless, in complex practical geometry, a too small Y+ could bring fatal damage to the stability and convergence of the numerical calculation, and the calculating time could be greatly increased. Taking the case of the research object in this paper, in order to achieve the requirement of a Y+ about 1 in typical conditions, the distance between the first and second mesh pointing off the wall needed to be reduced to 1 × 10⁻⁷ mm. The convergence of the calculation might be very unstable, and it is difficult to reduce the residual to below the expected value, even resulting in the calculated divergence. In order to verify the influence of Y+ on the results of this paper, the controlling method of Y+ was adopted by changing the distance of the first grid layer to conduct the independent verification. The distance of the first grid layer was set as 1 × 10⁻³ mm, 1 × 10⁻⁴ mm, 5 × 10⁻⁵ mm, 1 × 10⁻⁵ mm, 5 × 10⁻⁶ mm, 1 × 10⁻⁶ mm, and 1 × 10⁻⁷ mm, and the corresponding maximum Y+ value in the typical condition was 8626, 653, 320, 65, 33, 9, and 1, respectively. It can be clearly seen from Figure 4 that with the decrease of Y+, the values of the four outlet pressures were basically unchanged, and the maximum relative error was within ±1%, indicating that Y+ was insensitive to the calculation results in this paper. Therefore, the distance close to the wall was set as 1 × 10⁻⁴ mm, and the corresponding average Y+ was 160, which was used as the wall grid treatment scheme for subsequent calculation.

4.3. Mesh Independence Study

To check the mesh independence and the self-consistency of the present problem, the grid nodes were gradually increased before the numerical calculation, keeping Y+ unchanged, Y+ about 153, and the number of grids was generated from 0.42 million to 17.2 million. The numerical results with the change of grid number are shown in Figure 5. It is clearly seen from this figure that the calculating results remain unchanged basically after the mesh increases to 9.3 million. The maximum relative deviation between 9.3 million and 17.2 million was less than 0.05%. Taking into account the requirements of both mesh independence and computation time, the scheme of 9.3 million was used to calculate the flow instability into the five-way spherical cavity in the present paper.

4.4. Validation of Results

According to the numerical model of the liquid oxygen instability flow established above, numerical simulation was carried out under the experimental conditions, and the predicted numerical calculation results were compared with the calculated results of traditional empirical correlations with the increase of the Reynolds number, as shown in Figure 6. The inlet pressure of the pipeline remained unchanged, which was 0.375 MPa. The inlet flow rates were 150, 200, 250, 300, 350, and 400 L/s, respectively, and the Reynolds number ranged from 3.53 × 10⁶ to 1.28 × 10⁷. It can be seen from Figure 6 that the calculated values between the numerical calculation and the empirical correlation were in good agreement, and the maximum error between them was less than 1%.
At the same time, the results of the numerical calculation and empirical correlation calculation had good regularity and consistency with the change of the Reynolds number, which indicated that the numerical model developed in this paper, including the geometry simplification, turbulence model selection, setting of boundary conditions and initial conditions, solver strategy, and so on, was reasonable and reliable.
The structure of the feeding pipeline with the five-way spherical cavity could be divided into five parts, as shown in Figure 6. The first part, the third part, and the fifth part were regarded as circular straight pipes. The calculation correlation of the pressure fall of the straight pipe was given as follows:
p z = λ l d ρ u 2 2 ,
where λ is the friction factor, l is the length of the pipeline, d is the inner diameter of the pipe, ρ is the liquid oxygen density, and u is the average velocity in the pipe. The friction factor, λ, was calculated by the Karman–Prandtl formula [40]:
1 λ 1 / 2 = 2 lg ( Re λ 1 / 2 ) 0.8 .
The five-way spherical cavity could be simplified as a combination of a sudden expansion section and a sudden reduction section. The pressure fall of this section was calculated as follows [40]:
p s = ( ζ 1 + ζ 2 + ξ 3 ) ρ u 2 2 ,
ξ 1 = 1.05 ( 1 A 1 / A 2 ) 2 ,
ξ 2 = ( 1 A 3 A 1 ) 2 ,
where ξ1 and ξ2 are the local loss coefficient of the sudden expansion and the sudden reduction of the five-way spherical cavity, respectively; A1, A2, and A3 are the cross-sectional areas of the first straight pipe, corresponding to the diameter of the five-way spherical cavity and the third straight pipe, respectively; and ξ3 is the correction coefficient of the five-way spherical cavity, and the value of ξ3 is considered as 0.61.
The calculation correlation for the local loss of the 90° elbow was written as follows [40]:
p w = ( ζ 90 ) ρ u 2 2 ,
ξ 90 = 0.131 + 0.163 ( d / R ) 3.5 .
Therefore, the total pressure loss of the pipeline might be predicted through a set of empirical correlations developed in this paper, as follows:
Δ p = p z 1 + p s + p z 3 + p w + p z 5 .

5. Results and Discussion

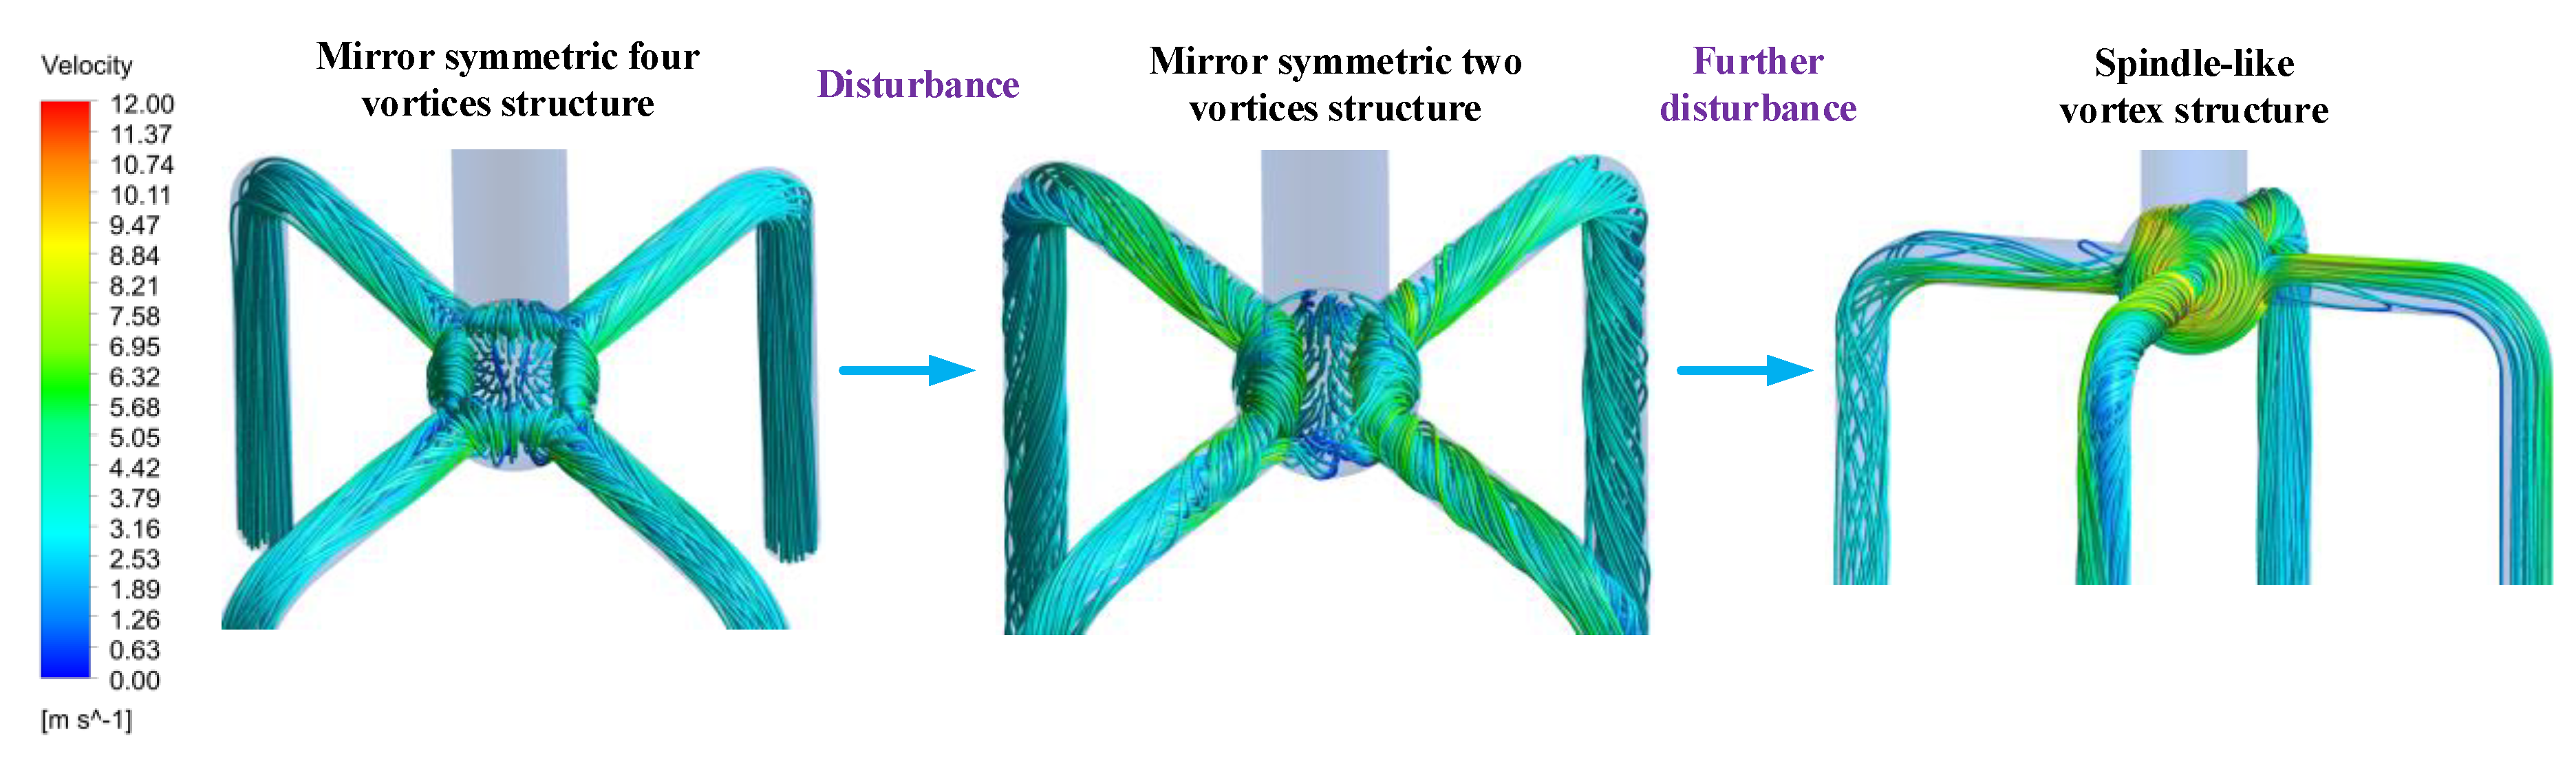
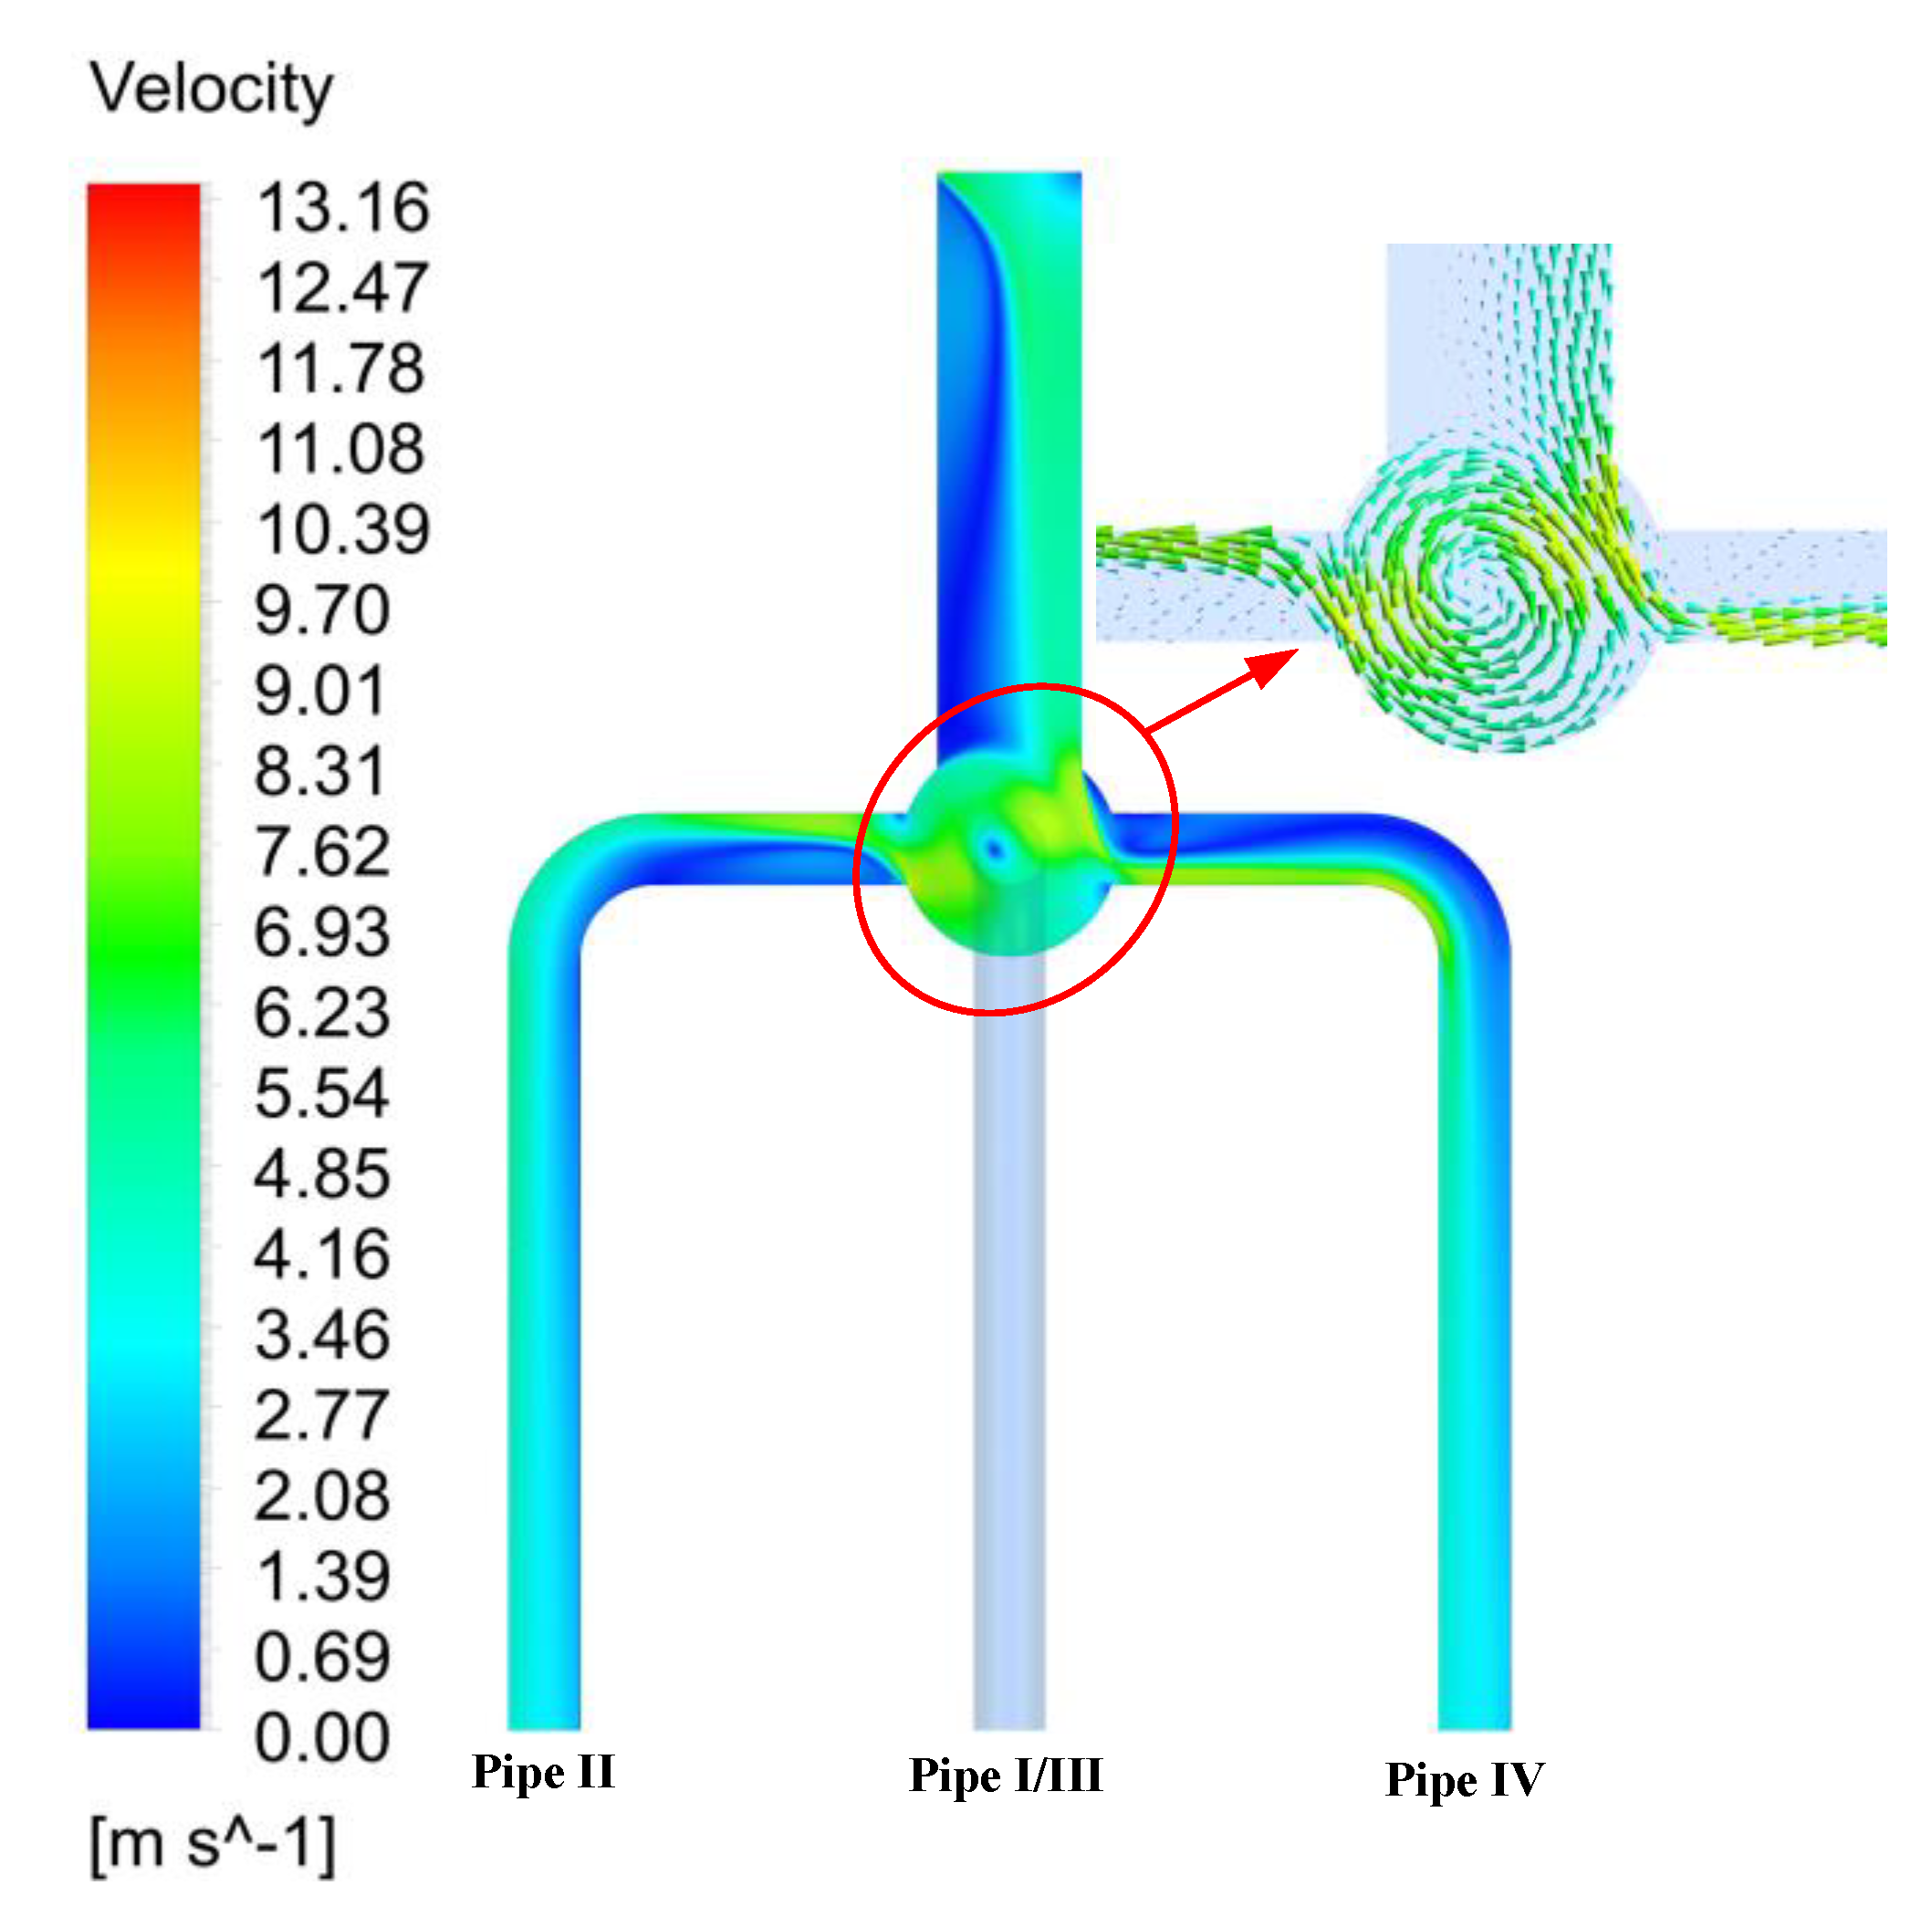
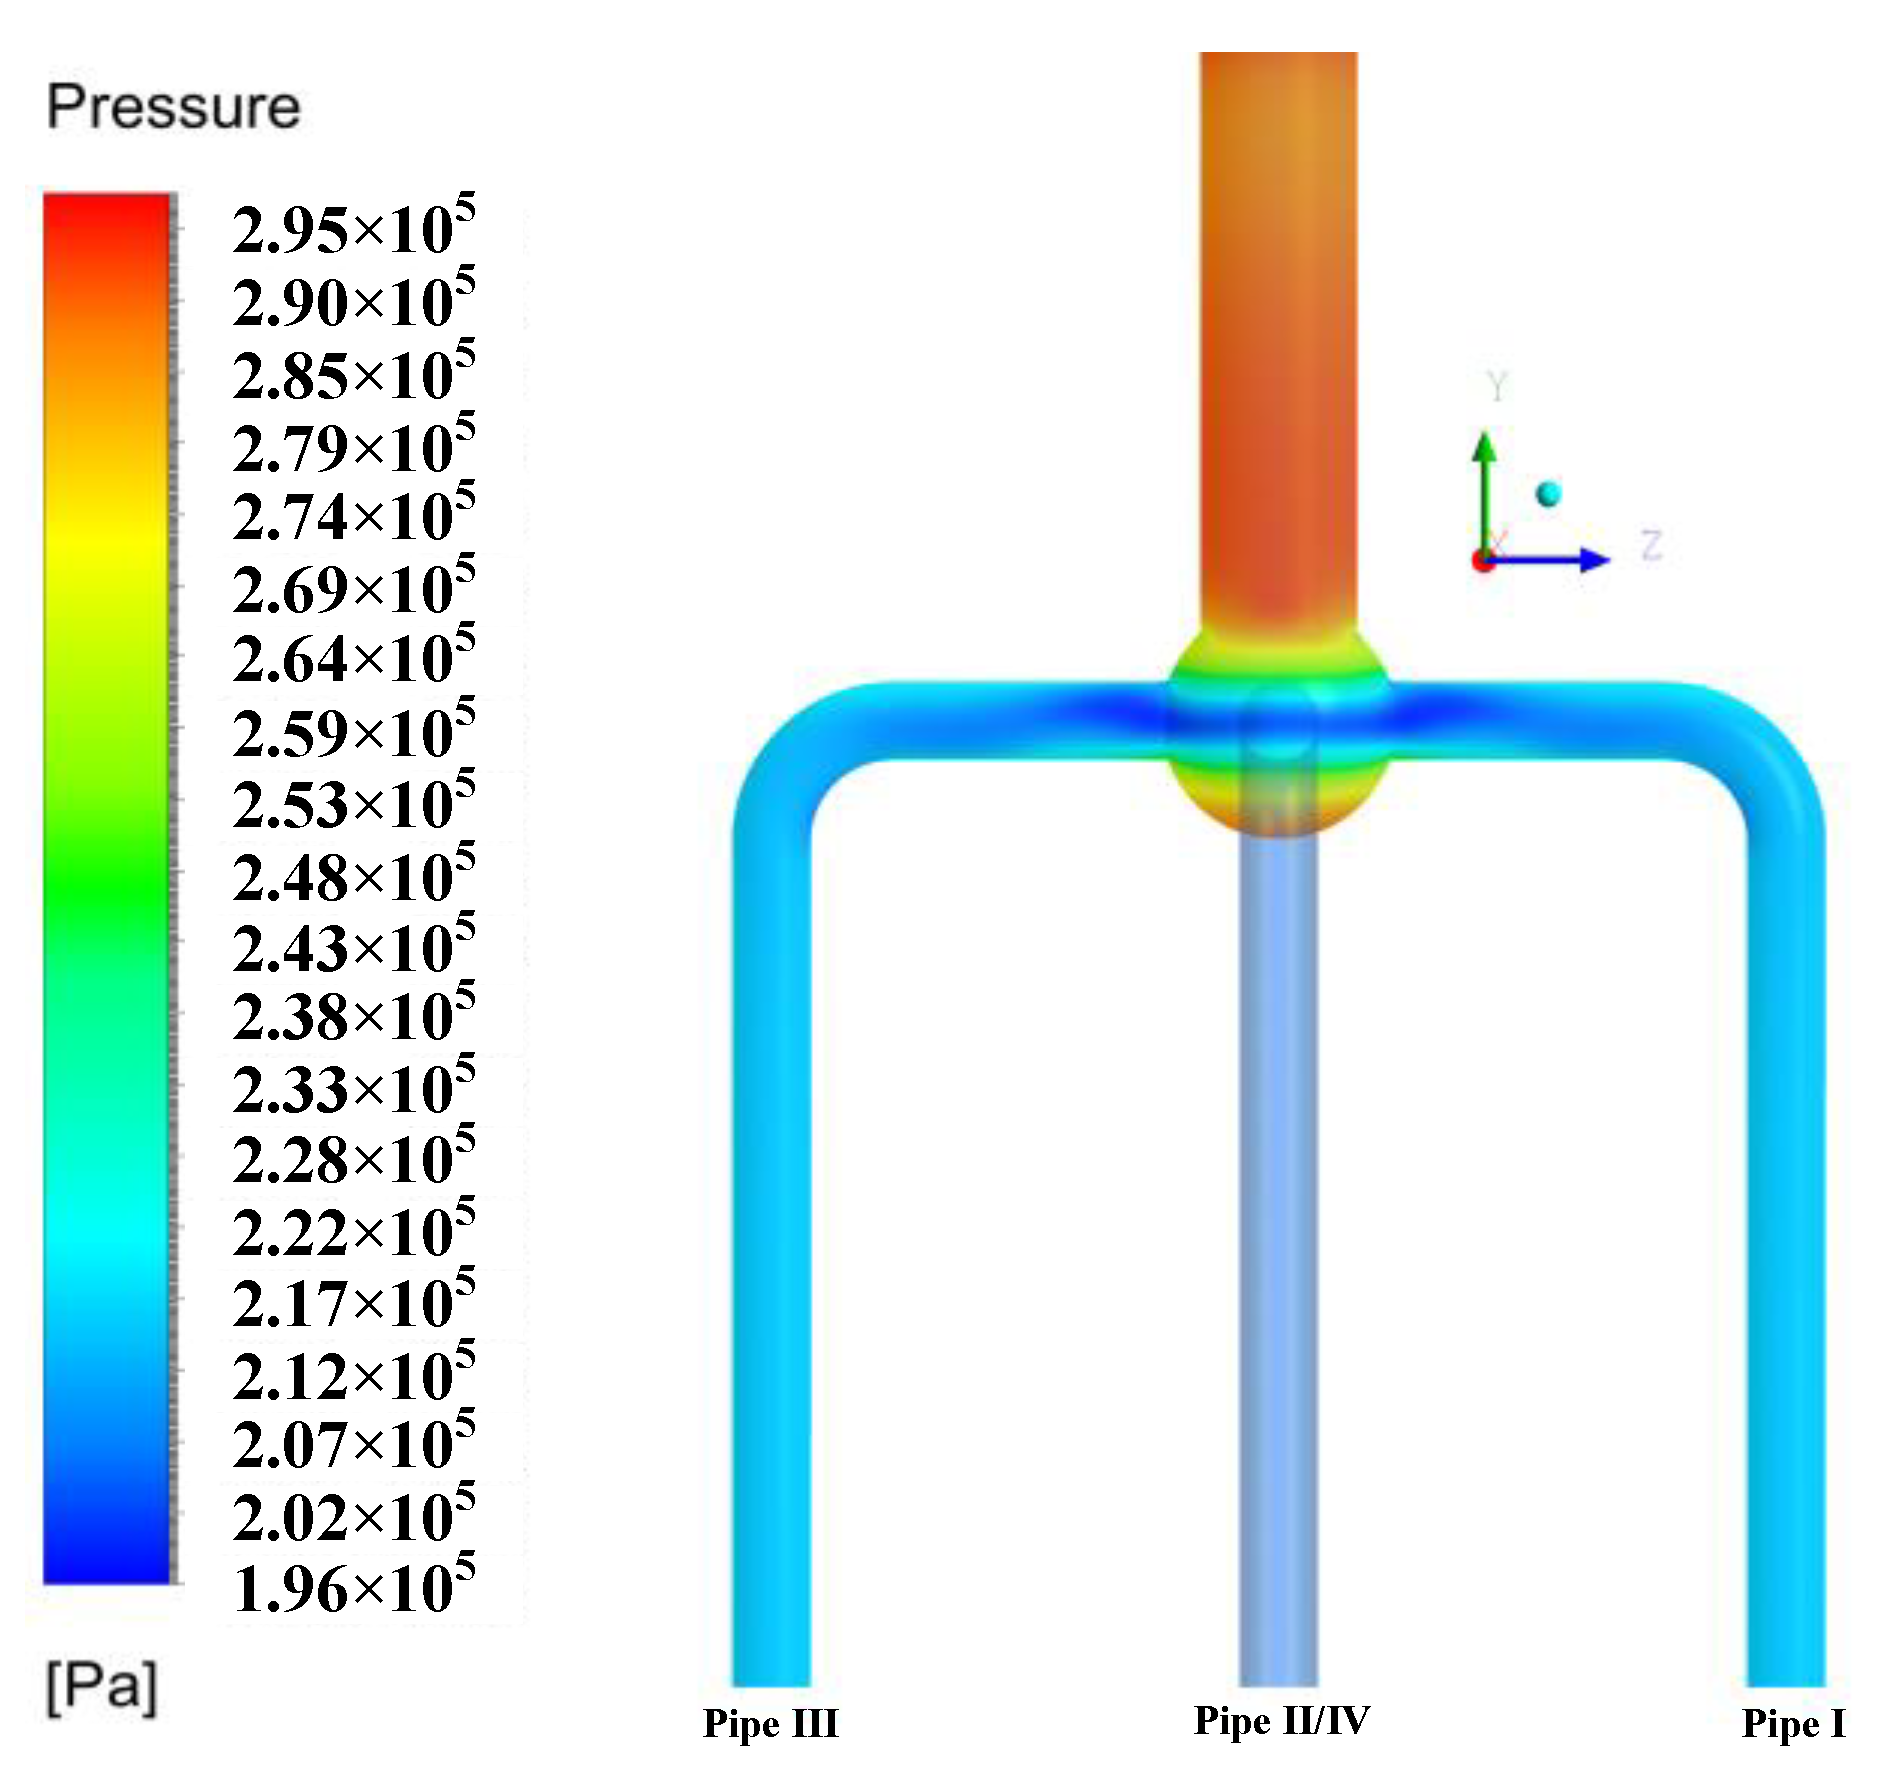
5.1. Evolution Process of Flow Field Inside the Feedline

Through a large number of numerical calculations, it was found that there are three typical flow fields, mirror-symmetric four-vortices structure, mirror-symmetric two-vortices structure, and spindle-like vortex structure, under different perturbations inside the five-way spherical cavity, as shown in Figure 7. It is clearly seen from this figure that the velocity in the flow field could increase with the vortex merging, so the energy loss would rise accordingly.
In order to describe the physical field in the feedline with the five-way spherical cavity more clearly, some sections were defined as shown in Figure 8. Section I/III and section II/IV consisted of the central sections of pipe I and III, and central sections of pipe II and IV, respectively. Section I/II and section I/IV were the faces formed by section I/III rotating 45 degrees to the direction of pipe II, and section I/III rotating 45 degrees to the direction of pipe IV, respectively. The velocity field of the mirror-symmetric four-vortices structure and mirror-symmetric two-vortices structure are shown in Figure 9.
When the incoming fluid was in a uniform and undisturbed condition, the flow field reached a stable state. The four-vortices structure was formed inside the five-way spherical cavity, which presented a mirror-like symmetry. The most significant feature of the four-vortices flow field was the existence of four complete vortex cores in the five-way spherical cavity. It can be observed from Figure 7 and Figure 9 that two sets of spindle-shaped vortices formed in the direction of 45° of each two branch pipes in the five-way spherical cavity structure, which have the same shape and size. At this time, the outlet pressures of four branch pipes were the same, and there was no pressure difference between the four branch pipes.
When there was a disturbance of the incoming flow, a set of spindle-shaped vortices that were mirror symmetrical formed in the spherical cavity in the direction of rotating 45° for the central section of the branch pipes. The characteristic of this type of flow field was similar to that of the mirror-symmetric four-vortices structure, and the difference was the number of vortices. It can be clearly observed from Figure 9b that the four vortices evolve into a two-vortices structure, which is still mirror symmetrical on section I/IV. Nevertheless, after the merging of four vortices, the velocity field around a pair of vortices cores increased obviously. The velocity field at the bottom of the five-way spherical cavity was also affected, and enhanced sharply.
When the disturbance further increased, and reached a certain level, the flow field of the mirror-symmetric two-vortices structure will be transformed into the spindle-like vortex structure, causing an obvious phenomenon of an unstable pressure decline. In the state of the spindle-like vortex, the pressure effect was different for each branch pipe outlet. The outlet pressures of two branch pipes corresponding to the vortex core was reduced abnormally, since the spindle-like vortex moved to two branch pipes in a spiral way, and the static pressure was converted into dynamic pressure.

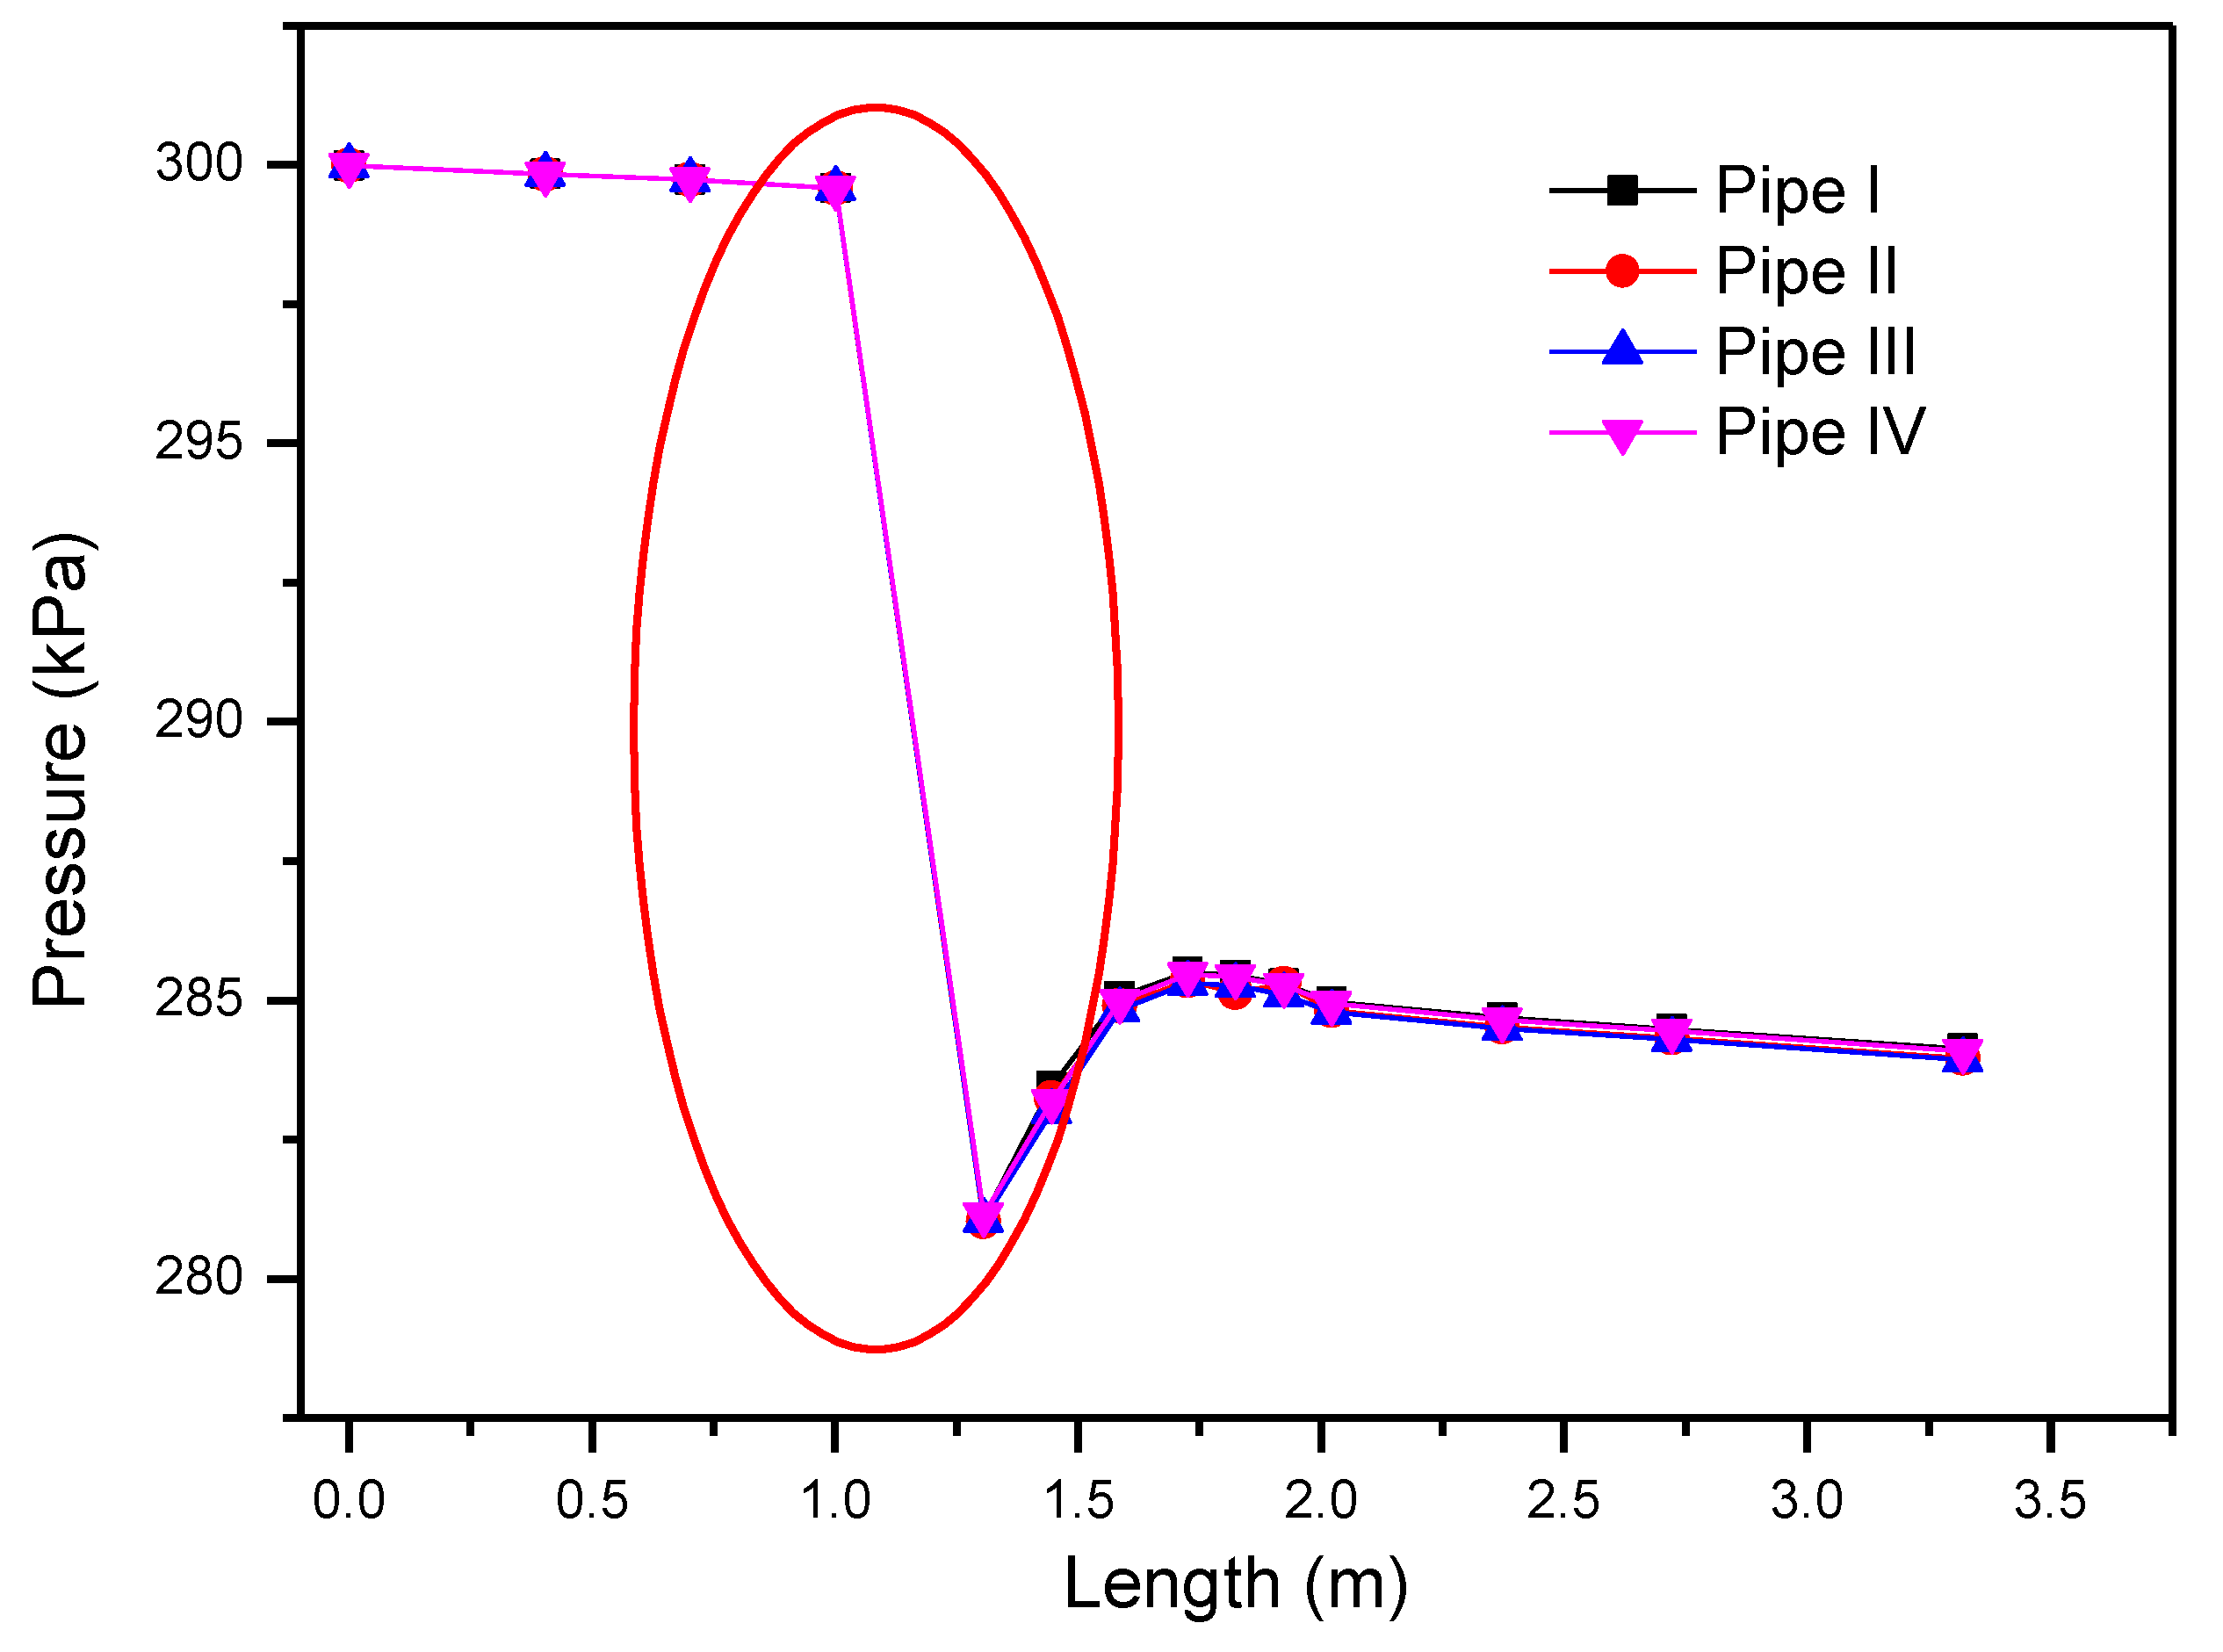
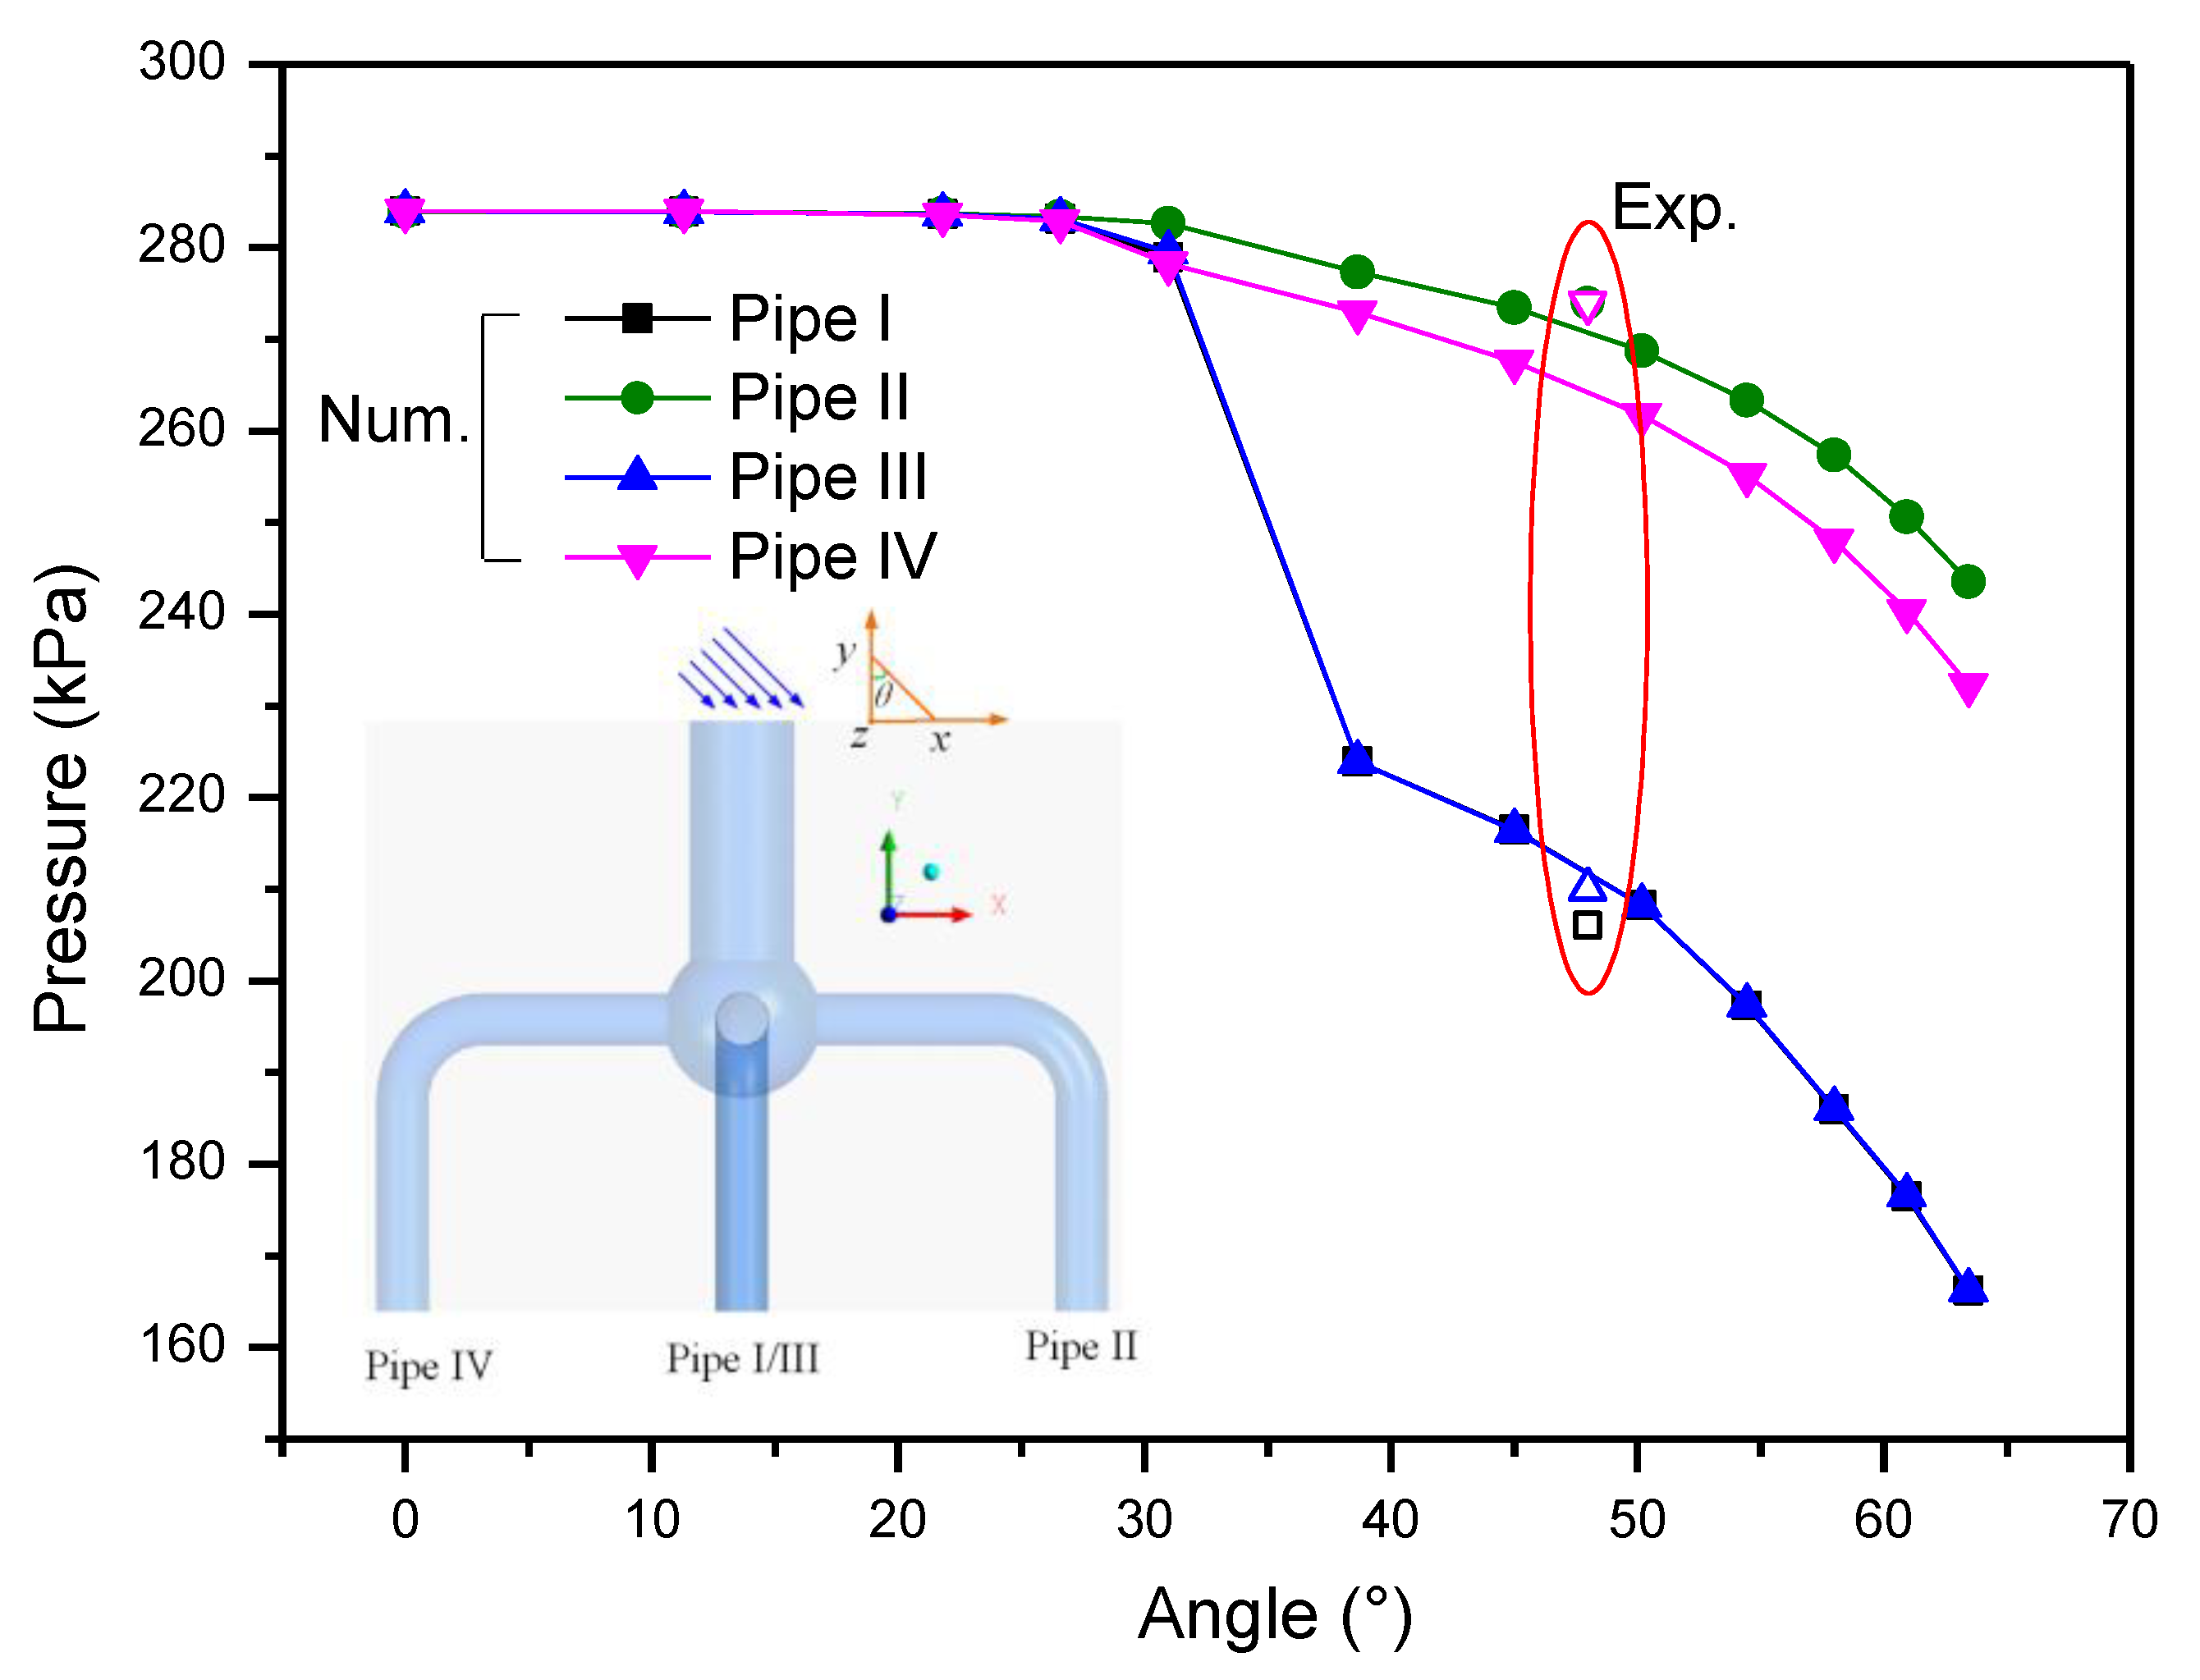
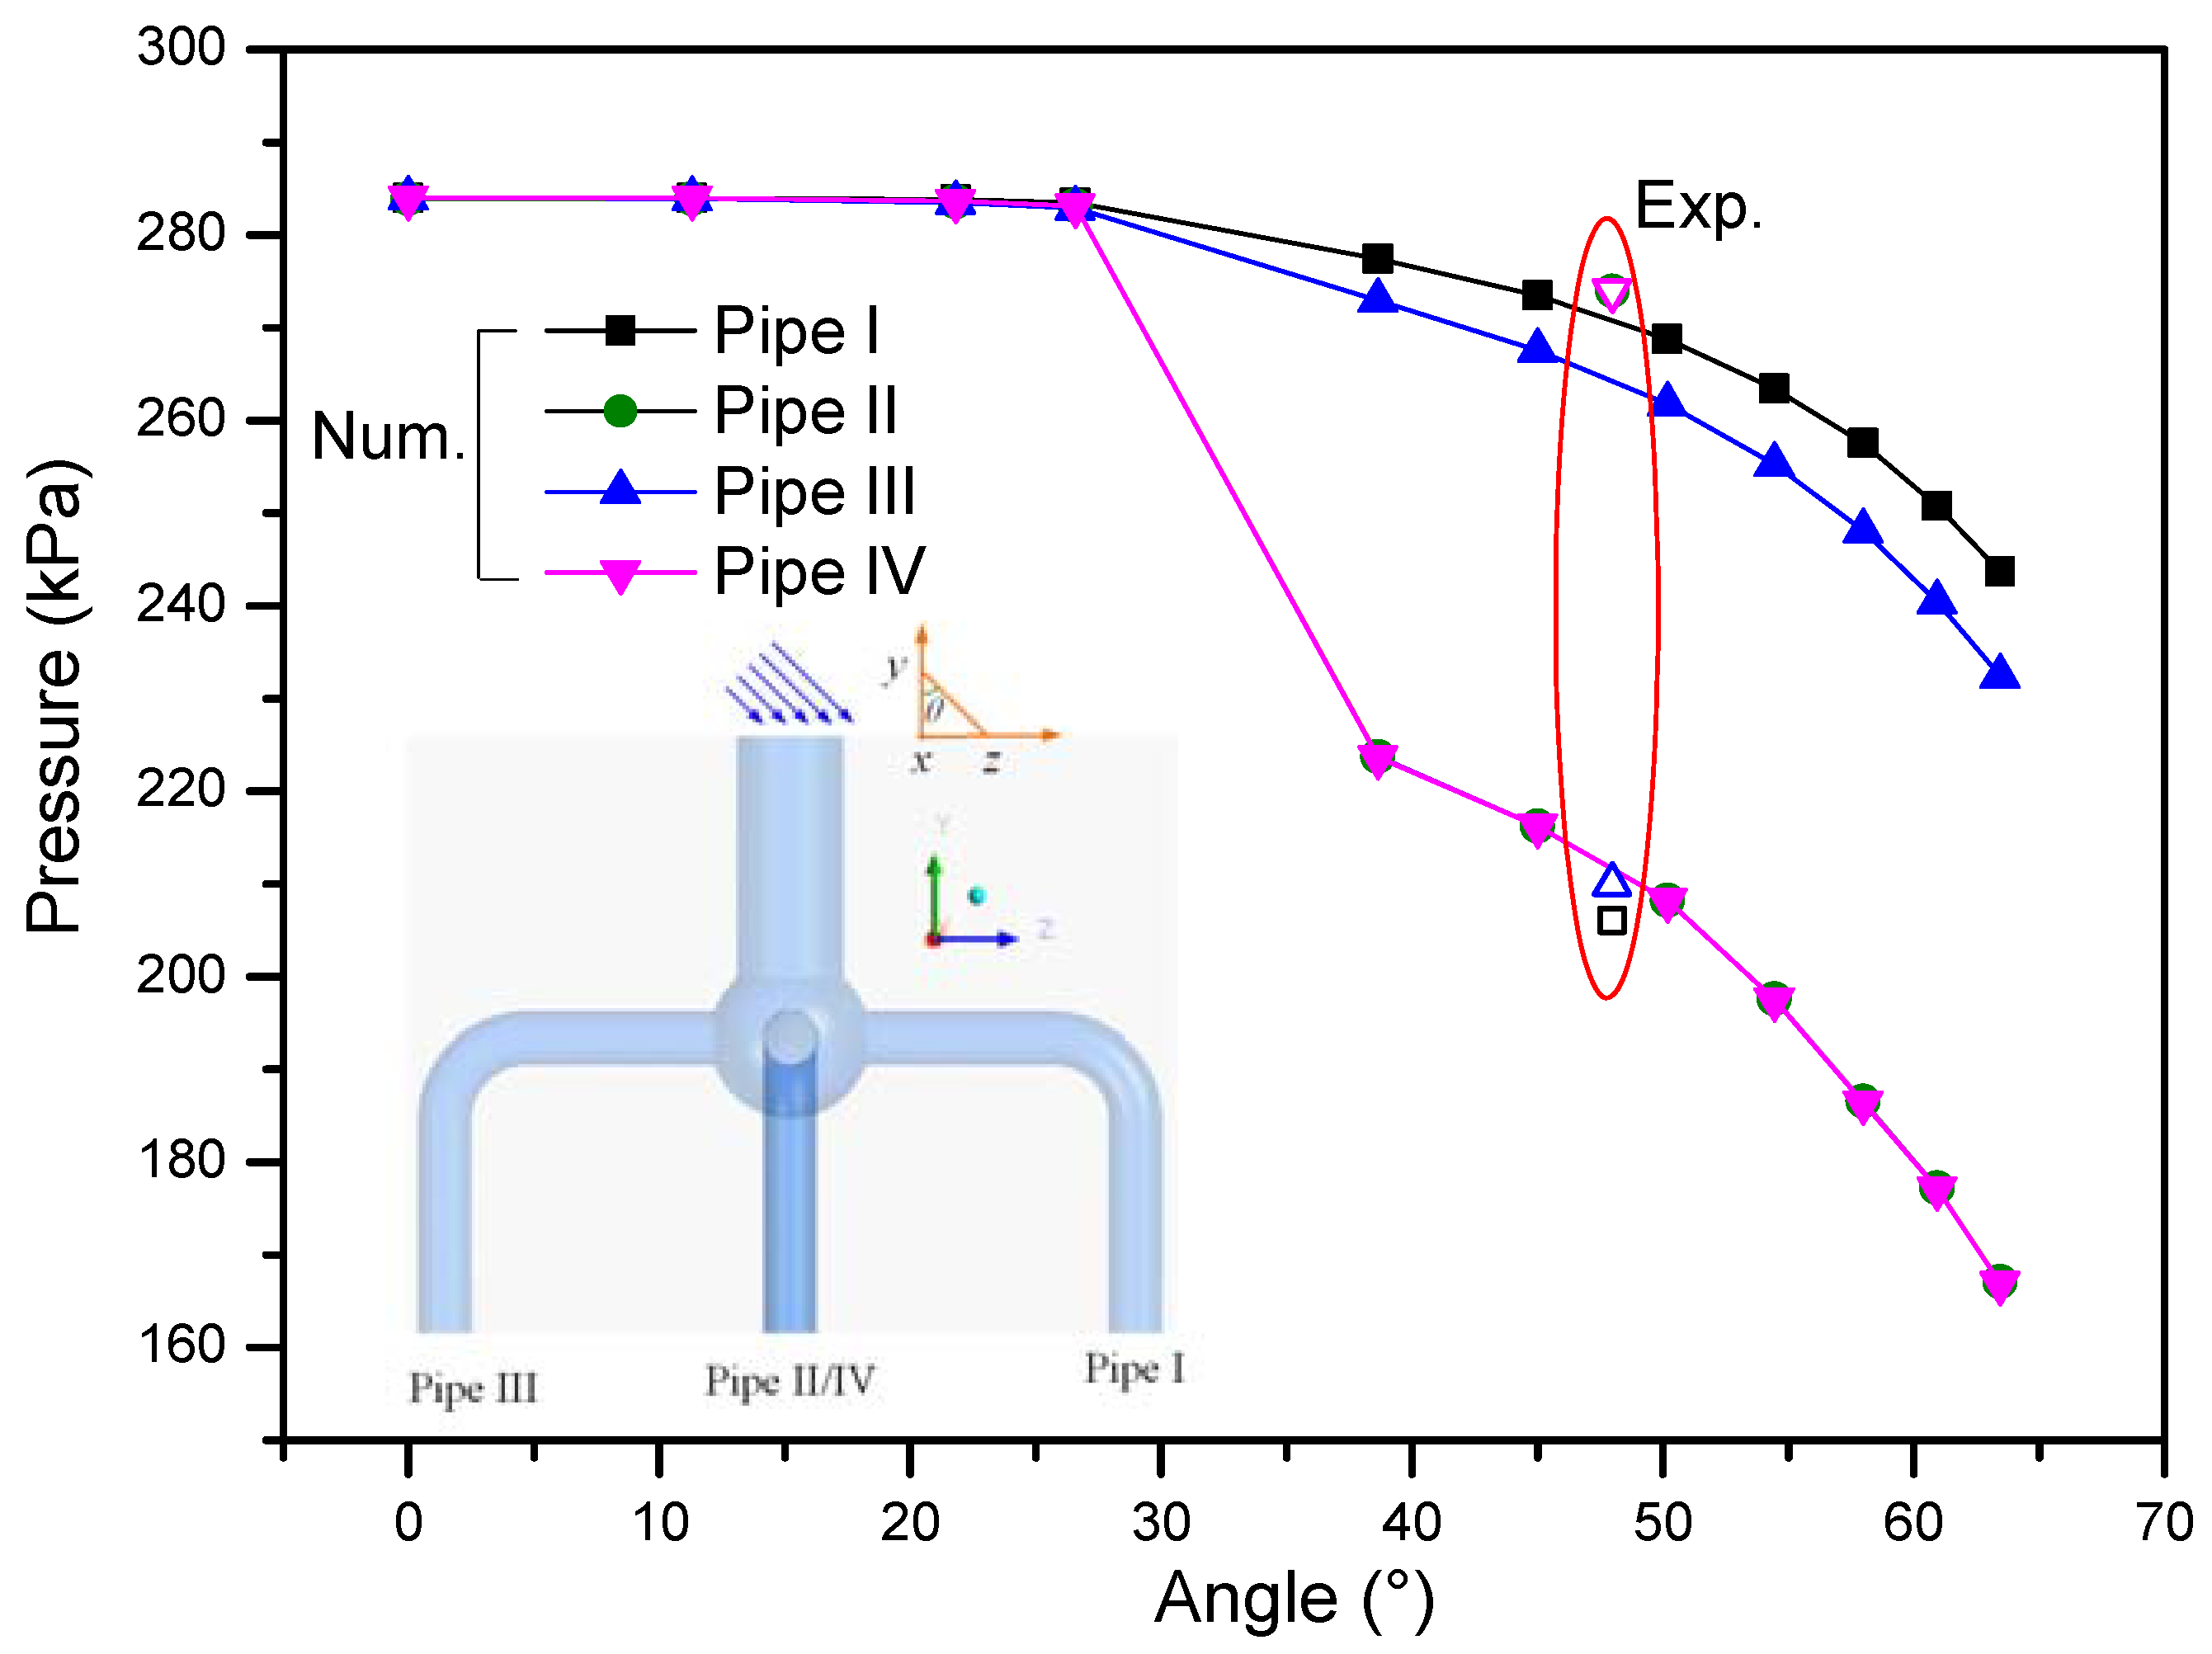
5.2. Pressure Change Along Flow Direction Under Different Disturbances

In order to describe the change of pressure in the process of flow along the feedline, several sections were defined in the feeding line, as shown in Figure 10. Table 2 shows the specific coordinates of each section. Taking the flow from the main pipe to branch pipe I as an example, 14 sections were defined from the inlet to the outlet, of which the main pipe section, including four sections, the horizontal straight pipe section and the vertical straight pipe section of the branch pipeline included four sections, respectively, and the elbow section of the branch pipe had two sections.
The pressure changes along the feedline are shown in Figure 11 when there was no disturbance. It can be seen obviously from the figure that the pressure fall of each branch pipe is basically consistent, about 16 kPa. The pressure drops between section-3 and section-1 of the branch pipes reached 19 kPa, indicating that the maximum pressure fall occurs in the five-way spherical cavity. When the liquid oxygen flowed through section-1 of the branch pipe, the average pressure started to recover and reached about 285 kPa. This is because there were two spiral vortices at the inlet of the branch pipe, which disappeared gradually along the flow direction, and the circumferential velocity of the flow was converted into static pressure energy. After the spiral vortices disappeared completely, the pressure decreased gradually due to the resistance in the flow process. Meanwhile, it can be clearly observed from this figure that the pressure fall slope along the main pipeline and the branch pipeline is almost identical, which means that the flow field in the main pipeline is almost coincident with that in the branch pipeline.
In order to further study the influence of disturbance on the pressure fall, the angle, θ, of disturbance was defined on the XOY plane and the YOZ plane, respectively. Figure 12 and Figure 13 display the change of the outlet pressure with the angle of disturbance, which rotates in the counterclockwise direction with reference to the negative direction of the Y axis. Figure 12 shows that before the angle, θ, less than 31 degrees, there was only a very small change of four outlet pressures. When the angle, θ, was greater than 31 degrees, the outlet pressure of pipe I and pipe III had a significant pressure fall compared with that of pipe II and pipe IV, since the spindle-like vortex was formed. Additionally, once the spindle-like vortex was generated, the pressure fall increased with the rise of the disturbance angle. Figure 13 exhibits a similar trend compared with Figure 12. Nevertheless, the anomalous pressure fall distribution was different at the outlet of four branch pipes. The anomalous pressure fall in Figure 12 was in pipe I and pipe III, and that in Figure 13 was in pipe II/pipe IV. It is indicated that the position of the pressure jump was related to the direction of the inlet disturbance, since the direction of the disturbance was always in the same direction as the spindle-like vortex core.
It can be also observed from the two figures that the numerical simulation results are in good agreement with the experimental data when there was a disturbance of about 45 degrees. The results further indicated that the numerical model developed in this paper was reliable, and could accurately predict the instability flow features of liquid oxygen in the feeding pipe with the five-way spherical cavity. Before the anomalous pressure fall, the flow pressure decreased linearly with the enhancement of the disturbance. Once the anomalous pressure fall occurred, the pressure declined exponentially with the enhancement of the disturbance. This is because the flow field structure in the five-way spherical cavity changed from the mirror-symmetrical four-vortices structure to the spindle-like vortex structure.

5.3. Contours of Spindle-Like Vortex

Figure 14 and Figure 15 show the velocity distribution and streamline structure of the spindle-like vortex, respectively. The disturbance of 45 degrees was added to the YZX plane. It can be seen from the two figures that the liquid oxygen velocity gradually increases first and then decreases to zero from the inlet of the spherical cavity to the vortex core, which is similar to the characteristics of the Rankine vortex. The spindle-like vortex revolved around the vortex core into the five-way spherical cavity, part of the liquid was thrown out from the top of the branch pipe II inlet, and the other liquid flowed out from the bottom of the branch pipe IV inlet due to the influence of the incoming flow, except for the outflow along the branch pipe I/III corresponding to the vortex core.
Figure 16 and Figure 17 display the distribution of the pressure on the front side and on the side of the spindle-like vortex, respectively. Meanwhile, the disturbance of 45 degrees was added to the YZX plane. When the spindle-like vortex structure was generated in the five-way spherical cavity, the pressure gradually decreased from the outside to the inside. There was a low-pressure region in the center of the vortex core of the spindle-like vortex, which was distributed along the axis of the vortex core. This was also the cause of the anomalous pressure fall in the branch pipelines on the symmetrical side. In addition to the five-way spherical cavity, the pressure fall of other parts conformed to the characteristics of the basic flow dynamics. That is, the pressure declined gradually along the flow direction in the feeding pipeline.

5.4. Stability Analysis of the Flow Field Structure

To further observe the flow stability of the spindle-like vortex, the disturbance of the incoming flow was removed in the numerical calculation, and the outlet pressures of four branch pipelines were monitored, as shown in Figure 18. It is observed evidently that although the outlet pressures of the four branch pipelines recover, the anomalous pressure fall of pipe I/III still exists. The results indicated that the spindle-like vortex still existed, and Figure 19 also confirmed this.
The pressure fall remained unchanged basically after removing different disturbances, as shown in Figure 20. It is indicated that the disturbance of the initial field had little effect on the pressure fall, and once the spindle-like vortex was formed, it is hard to disappear. Nevertheless, there was a certain error between the numerical results and the experimental results. The maximum outlet pressure calculated by the numerical model was 238 kPa, and the maximum outlet pressure measured by the test was 210 kPa. We suggest that this was due to the removal of the disturbance. In practical flight, the disturbance might exist objectively. For instance, the flow from the bottom of the tank was usually swirling. Although it was not observed in the experiment, there are many related reports in the literature [43,44].

5.5. Effect of the Five-Way Spherical Cavity Structure on Pressure Loss

To study the effect of five-way spherical cavity structure for the pressure loss, the numerical calculation considering the change of the diameter of the five-way spherical cavity was conducted. In the numerical calculation, the scaling ratio was defined as the ratio of the current sizes to the original sizes, which were the spherical cavity with a diameter of 360 mm and the branch pipeline with a diameter of 120 mm. The scaling ratio was varied from a value of 0.01 to 100. That is to say, the two geometric parameters were enlarged or reduced at the same time based on the original size. The angle of disturbance was given as 45 degrees on the YZX plane. The average pressure fall for four branch pipelines in different sizes is shown in Figure 21. The numerical calculation showed that when the size of the five-way spherical cavity was too small (the scaling ratio is less than 0.01), the spindle-like vortex structure in the five-way spherical cavity would disappear. When the scaling ratio was greater than 0.01, the pressure fall increased with the enhancement of the scaling ratio of the five-way spherical cavity structure. When the scaling ratio was greater than 10, the pressure fall remained unchanged substantially. The results showed that the spindle-like vortex entered a fully developed stage, which makes the low-pressure region in the center of the spindle-like vortex core attain a stable state.

6. Conclusions

For the anomalous pressure fall phenomenon in the feeding system of four parallel engines of a cryogenic vehicle, a 3D numerical model considering a full-scale structure was developed to accurately capture the formation and evolution of vortices in the multi-branch pipeline with a five-way spherical cavity. Based on the numerical results presented in this paper, the following conclusions could be drawn:
(1) The numerical results developed in the present paper were consistent with the experiment results. It was indicated that the established model describes the instability flow features of liquid oxygen reliably and robustly, including geometry simplification, initial condition setting, boundary condition setting, solution strategy, mesh generation, turbulence model selection, and near wall treatment.
(2) It was found that the primary reason of the anomalous pressure was that the spindle-like vortex structure formed due to disturbance of the inlet boundary condition, and there were minimum pressure and velocity values at the vortex core.
(3) With the enhancement of the disturbance, the flow field structure in the five-way spherical cavity evolved from the mirror-symmetrical four-vortex structure to the spindle-like vortex. There was a mirror-symmetrical four-vortex structure in the absence of disturbance, and the outlet pressure of the four branch pipelines was equal. The pressure loss in the spherical cavity was about 19 kPa. When disturbance was added at the entrance of the main pipeline, the mirror symmetrical four vortices gradually merged into the mirror symmetrical two vortices until the disturbance was enhanced to a certain extent, and the mirror-symmetric two-vortex structure was rapidly transformed into the spindle-like vortex. The pressure loss in the feedline on the side corresponding to the vortex core was about 90 kPa when there was about a 45-degree disturbance, and on the other side was about 20 kPa. The numerical results were in agreement with the experimental data.
(4) The change of the flow field was an irreversible behavior. The spindle-like vortex flow field was more stable than the symmetric vortex flow field, and could not change with the disturbance once it was formed. When removing the disturbance, the spindle-like vortex structure still remained stable. Although the outlet pressure of four branch pipeline picked up, the pressure loss on the side corresponding to the spindle-like vortex was still maximum.

Author Contributions

Conceptualization, F.X., Y.L. and E.C.; methodology, F.X.; software, F.X.; validation, F.X., H.M. and S.X.; formal analysis, F.X.; investigation, F.X.; resources, F.X.; data curation, F.X.; writing—original draft preparation, F.X.; writing—review and editing, F.X. and Y.M.; visualization, F.X.; supervision, Y.L.; project administration, F.X. and Y.M.; funding acquisition, F.X. All authors have read and agreed to the published version of the manuscript.

Funding

This work was supported by National Natural Science Foundation of China (51906184, 51876153), China Postdoctoral Science Foundation(2018M633505), Postdoctoral Science Foundation of Shaanxi province and Research Fund of State Key Laboratory of Technologies in Space Cryogenic Propellants (SKLTSCP 1905, SKLTSCP 1914).

Conflicts of Interest

The authors declare no conflict of interest.

References

  1. Xie, F.S.; Li, Y.Z.; Wang, X.B.; Chen, E.F.; Wang, L.; Xia, S.Q. Experimental investigation of abnormal pressure drop in branch feedlines with a five-Port spherical cavity in liquid oxygen engines. Cryogenics 2019, 104, 102994. [Google Scholar] [CrossRef]
  2. Acrivos, A.; Babcock, B.D.; Pigford, R.L. Flow distributions in manifolds. Chem. Eng. Sci. 1959, 10, 112–124. [Google Scholar] [CrossRef]
  3. Bajura, R.A. A model for flow distribution in manifolds. J. Eng. Gas Turbines Power 1971, 93, 7–12. [Google Scholar] [CrossRef]
  4. Bajura, R.A.; Jones, E.H.J. Flow distribution manifolds. ASME Trans. J. Fluids Eng. 1976, 98, 654–665. [Google Scholar] [CrossRef]
  5. Bassiouny, M.K.; Martin, H. Flow distribution and pressure drop in plate heat exchangers—I U-Type arrangement. Chem. Eng. Sci. 1984, 39, 693–700. [Google Scholar] [CrossRef]
  6. Bassiouny, M.K.; Martin, H. Flow distribution and pressure drop in plate heat exchangers—II Z-Type arrangement. Chem. Eng. Sci. 1984, 39, 701–704. [Google Scholar] [CrossRef]
  7. Marchitto, A.; Devia, F.; Fossa, M.; Guglielmini, G.; Schenone, C. Experiments on two-Phase flow distribution inside parallel channels of compact heat exchangers. Int. J. Multiph. Flow 2008, 34, 128–144. [Google Scholar] [CrossRef]
  8. Liu, H.; Li, P. Even distribution/dividing of single-Phase fluids by symmetric bifurcation of flow channels. Int. J. Heat Fluid Flow 2013, 40, 165–179. [Google Scholar] [CrossRef]
  9. Fan, Z.; Zhou, X.; Luo, L.; Yuan, W.K. Experimental investigation of the flow distribution of a 2-Dimensional constructal distributor. Exp. Therm. Fluid Sci. 2008, 33, 77–83. [Google Scholar] [CrossRef]
  10. Ramos-Alvarado, B.; Li, P.; Liu, H.; Hernandez-Guerrero, A. CFD study of liquid-Cooled heat sinks with microchannel flow field configurations for electronics, fuel cells, and concentrated solar cells. Appl. Therm. Eng. 2015, 31, 2494–2507. [Google Scholar] [CrossRef]
  11. Sepsy, C.F.; Jones, C.D. An experimental study of losses in round mitered elbows, mitered tees and capped crosses. ASHRAE J. 1970, 12, 39–45. [Google Scholar]
  12. Rahmeyer, W.J. Pressure loss coefficients of threaded and forged weld pipe fittings for ells, reducing ells, and pipe reducers. ASHRAE Trans. 1999, 105, 334–354. [Google Scholar]
  13. Sethuraman, S. Laboratory Study to Determine the Loss Coefficient of Two Close-Coupled Fittings; Tennessee Technological University: Cookeville, TN, USA, 2000. [Google Scholar]
  14. Reimann, J.; Seeger, W. Two-Phase flow in a T-junction with a horizontal inlet. Part II: Pressure differences. Int. J. Multiph. Flow 1986, 12, 587–608. [Google Scholar] [CrossRef]
  15. Chen, Z.H.; Zhao, Z.S. Theory and calculation of flow distribution and thermal deviation of single-Phase fluid in parallel tubes. Boiler Technol. 1974, 10, 2–22. [Google Scholar]
  16. Costa, N.P.; Maia, R.; Proenca, M.F.; Pinho, F.T. Edge effects on the flow characteristics in a 90 deg tee junction. Trans. ASME 2006, 128, 1204–1216. [Google Scholar]
  17. Luo, Y.H. Study on Flow and Heat Transfer Characteristics of Parallel Tube Group Heat Exchanger; Shanghai Jiao Tong University: Shanghai, China, 1997. [Google Scholar]
  18. Yang, B.F.; Li, B.; Chen, H.; Liu, Z.Y. Application of new omega vortex identification method in a liquid rocket engine oxygen pump. J. Propuls. Technol. 2019, 40, 2105–2112. [Google Scholar]
  19. Oevelen, T.V.; Weibel, J.A.; Garimella, S.V. Predicting two-Phase flow distribution and stability in systems with many parallel heated channels. Int. J. Heat Mass Transf. 2017, 107, 557–571. [Google Scholar] [CrossRef] [Green Version]
  20. Chen, Q.G.; Zhong, Q.; Qi, M.; Wang, X.K. Comparison of vortex identification criteria for planar velocity fields in wall turbulence. Phys. Fluids 2015, 27, 085101. [Google Scholar] [CrossRef]
  21. Zhou, J.; Adrian, R.J.; Balachandar, S. Mechanisms for generating coherent packets of hairpin vortices in channel flow. J. Fluid Mech. 1999, 387, 353–396. [Google Scholar] [CrossRef]
  22. Zhou, J.G.; Adrian, R.J.; Balachandar, S. Autogeneration of nearwall vortical structures in channel flow. Phys. Fluids 1996, 8, 288–290. [Google Scholar] [CrossRef]
  23. Roth, M.; Peikert, R. A higher order method for finding vortex core lines. In Proceedings of the IEEE Visualization, Research Triangle Park, NC, USA, 18–23 October 1998; pp. 143–160. [Google Scholar]
  24. Jeong, J.; Hussain, F. On the identification of a vortex. J. Fluid Mech. 1995, 285, 69–94. [Google Scholar] [CrossRef]
  25. Hunt, J.C.R.; Wray, A.A.; Moin, P. Eddies, streams, and convergence zones in turbulent flows. In Proceedings of the Summer Program in Center for Turbulence Research, Stanford University, Stanford, CA, USA, 1 December 1988; pp. 193–208. [Google Scholar]
  26. Kobayashi, K.; Oowada, Y.; Arita, M.; Nakatsuji, H. Development status of H-IIB Launch vehicle propulsion system. In Proceedings of the 43rd AIAA/ASME/SAE/ASEE Joint Propulsion Conference & Exhibit, Cincinnati, OH, USA, 8–11 July 2007. [Google Scholar] [CrossRef]
  27. Kiris, C.C.; Kwak, D.; Chan, W.; Housman, J.A. High-Fidelity simulations of unsteady flow through turbopumps and flow liners. Comput. Fluids 2008, 37, 536–546. [Google Scholar] [CrossRef] [Green Version]
  28. Ahuja, V.; Hosangadi, A.; Cavallo, P.A. Analyses of transient events in complex valve and feed systems. AIAA 2005. [Google Scholar] [CrossRef]
  29. Cho, I.H.; Jung, T.K.; Jung, Y.S.; Kwon, O.S.; Oh, S.H.; Lee, D.S. Development of Korea sounding rocket–III propulsion feeding system. AIAA 2003. [Google Scholar] [CrossRef]
  30. Brown, T.M.; McDonald, J.P.; Knight, K.C. X-34 main propulsion system-Selected subsystem analysis. In Proceedings of the 10th PERC Propulsion Symposium, Huntsville, AL, USA, 26–27 October 1998. [Google Scholar]
  31. Vu, B.T.; Garcia, R. Flow Analysis of X-34 Main Propulsion System Feedlines; AIAA: Huntsville, AL, USA, 2000; p. 3722. [Google Scholar] [CrossRef] [Green Version]
  32. Fisher, M.F.; Ise, M.R. Low-Cost propulsion technology at the Marshall space flight center fastrac engine and the propulsion test article. AIAA 2012. [Google Scholar] [CrossRef]
  33. Champion, R.H.; Darrow, R.J. X-34 Main Propulsion System Design and Operation. AIAA 2012. [Google Scholar] [CrossRef]
  34. McDonald, J.P.; Headyat, A.; Brown, T.M.; Knight, K.C.; Champion, R.H. Subsystem analysis/optimization for the X-34 main propulsion system. AIAA 2012. [Google Scholar] [CrossRef] [Green Version]
  35. Dill, K.; Davis, D.; Bates, R.; Tarwater, R. One vs Two Primary LOX Feedline Configuration Study for the National Launch System; AIAA: Huntsville, AL, USA, 1992. [Google Scholar] [CrossRef] [Green Version]
  36. Chen, Y.S. LOX Manifold Tee Analysis NSASA-CR-183994; Marshal Space Flight Center: Huntsville, AL, USA, 1990. [Google Scholar]
  37. Muller, P.L. Propellant Feed Ducting and Engine Gimbal Lines for the Saturn Vehicles X-53532; Marshal Space Flight Center: Huntsville, AL, USA, 1967. [Google Scholar]
  38. Kitsche, W. Operation of a Cryogenic Rocket Engine; Springer: New York, NY, USA, 2011. [Google Scholar]
  39. ANSYS User Manual Release 20.0; ANSYS, Inc.: Pittsburgh, PA, USA, 2020.
  40. Cengel, Y.; Cimbala, J. Fluid Mechanics Fundamentals and Applications, 4th ed.; McGraw-Hill Education: New York, NY, USA, 2020. [Google Scholar]
  41. Sujan, S.; Jie, C. Numerical study of pressure losses in close-Coupled fittings. HVAC R Res. 2004, 10, 539–552. [Google Scholar]
  42. Huang, R.; Ji, B.; Luo, X.; Zhai, Z.H.; Zhou, J.J. Numerical investigation of cavitation-Vortex interaction in a mixed-Flow waterjet pump. J. Mech. Sci. Technol. 2015, 29, 3707–3716. [Google Scholar] [CrossRef]
  43. Yang, H.Q.; Peugeot, J.W.; West, J.S. A Computational Fluid Dynamics Study of Swirling Flow Reduction by Using anti-Vortex Baffle; AIAA: Grapevine, TX, USA, 2017. [Google Scholar] [CrossRef] [Green Version]
  44. Huang, S.L.; Chen, H.C.; Chu, C.C.; Chang, C.C. On the transition process of a swirling vortex generated in a rotating tank. Exp. Fluids 2008, 45, 267–282. [Google Scholar] [CrossRef]
Figure 1. Pressure profile of liquid oxygen in each engine inlet.
Energies 13 00926 g001
Figure 2. Object of the numerical calculation.
Energies 13 00926 g002
Figure 3. Mesh of the computational domain and local zoomed view.
Energies 13 00926 g003
Figure 4. Y+-independent verification.
Energies 13 00926 g004
Figure 5. Grid independence study.
Energies 13 00926 g005
Figure 6. Verification of the numerical simulation.
Energies 13 00926 g006
Figure 7. Evolution of the flow field inside the spherical cavity.
Energies 13 00926 g007
Figure 8. Schematic diagram of defined sections.
Energies 13 00926 g008
Figure 9. Contours of velocity field of the mirror symmetric structure.
Energies 13 00926 g009
Figure 10. Schematic diagram of cross sections in the feeding pipeline.
Energies 13 00926 g010
Figure 11. Pressure change along the feedline without the disturbance.
Energies 13 00926 g011
Figure 12. Outlet pressure change with the angle, θ, of disturbance on the YZX plane.
Energies 13 00926 g012
Figure 13. Outlet pressure change with the angle, θ, of disturbance on the YXZ plane.
Energies 13 00926 g013
Figure 14. Velocity distribution contour of section II/IV.
Energies 13 00926 g014
Figure 15. Streamline of the spindle-like vortex.
Energies 13 00926 g015
Figure 16. Distribution of the pressure field on the front side of the spindle-like vortex.
Energies 13 00926 g016
Figure 17. Distribution of the pressure field on the side of the spindle-like vortex.
Energies 13 00926 g017
Figure 18. Outlet pressure change of each branch pipe before and after removing disturbance.
Energies 13 00926 g018
Figure 19. Flow field structure in the pipeline before and after removing disturbance.
Energies 13 00926 g019
Figure 20. Outlet pressure change after removing different disturbances.
Energies 13 00926 g020
Figure 21. Effect of the spherical cavity structure on the pressure fall.
Energies 13 00926 g021
Table 1. Geometry parameters of the numerical calculation object.
NamesUnitValue
Main pipeDiameter (D1)mm240
Length (L1)mm1000
Five-way spherical cavityDiameter (D2)mm360
Branch pipesDiameter (D3)mm120
Horizontal length (L2)mm410
Radius of bend pipe (R)mm185
Angle of bend pipe (θ)°87
Vertical length (L3)mm1300
Table 2. Specific coordinates of defined sections.
NameLocation (mm)NameLocation (mm)
Inlet(0, 1135, 0)I-Section-4(0, 0, 590)
Msection-1(0, 734.16, 0)I-Section-5(0, −20, 665)
Msection-2(0, 434.16, 0)I-Section-6(0, −68, 729)
Msection-3(0, 134.16, 0)I-Section-7(0, −177, 770)
I-Section-1(0, 0, 170)I-Section-8(0, −527, 770)
I-Section-2(0, 0, 310)I-Section-9(0, −877, 770)
I-Section-3(0, 0, 450)Outlet(0, −1475, 770)

