Article

Computational Modeling and Empirical Analysis of a Biomass-Powered Drinking Water Pasteurization Technology

1
School of Mechanical, Industrial, and Manufacturing Engineering, Oregon State University, Corvallis, OR 97331, USA
2
School of Chemical, Biological, and Environmental Engineering, Oregon State University, Corvallis, OR 97331, USA
*
Author to whom correspondence should be addressed.
Energies 2020, 13(4), 936; https://doi.org/10.3390/en13040936
Submission received: 8 January 2020 / Revised: 11 February 2020 / Accepted: 14 February 2020 / Published: 19 February 2020
(This article belongs to the Section A4: Bio-Energy)

Abstract

:
While filtration, chlorination, and UV drinking water treatments are commonplace, globally an estimated 1.2 billion people continue to boil their drinking water over inefficient biomass fires instead because it allows them to use available resources paired with a time-tested and trusted method. Although boiling water is culturally well-established, there is vast potential to improve human health, environmental impact, and efficiency by leveraging the fact that a significant reduction in pathogenic microorganisms occurs at temperatures well below boiling through a process known as pasteurization. This paper presents the evaluation of a community-scale, biomass-powered, flow-through water pasteurization system that was designed to heat water to the temperature required for pasteurization to occur before recuperating heat while cooling treated water down to a safe-to-handle temperature. The system is then compared to other common thermal treatment methods including batch-boiling over open fires and improved cookstoves. Results from computational modeling and empirical analysis show that the water pasteurizer significantly increases the overall water treatment capacity (from 7.9 to 411 L/h, adjusted for one hour of treatment via household boiling and operation of the water pasteurizer at steady-state, respectively) and uses far less biomass fuel (from 22 to 5.5 g/L, adjusted for treatment of 1 L of water via household boiling and operation of the water pasteurizer at steady-state, respectively). Notable comparisons to the batch-boiling of water over institutional-sized traditional and improved cookstoves are also demonstrated. Further, the results of fecal indicator reduction through the system (8 log and 6 log reduction of E. coli and bacteriophage MS2, respectively) suggest compliance with US-EPA (6 log and 4 log reduction of E. coli and bacteriophage MS2, respectively) and WHO requirements (effluent concentrations below the detection limit, specified as <1 E. coli CFU/100 mL and <10 bacteriophage MS2 PFU/mL) for the reduction in and effluent concentration of E. coli and bacteriophage for water treatment processes. It is recommended that engineers continue to explore the use of heat transfer and microorganism reduction theory to design technologies that increase the capacity and efficiency for thermal water purification that uses locally-available biomass resources.

1. Introduction

There are a variety of water treatment methods used at household and community scales globally, including filtration, chlorination, and thermal treatment, or any combination thereof [1]. For the 2.2 billion people worldwide who do not have access to an improved water source or reliable piped water scheme, household (point-of-use), point-of-collection scale treatment methods are needed [2]. However, despite decades of efforts to implement various forms of water treatment technologies in rural developing communities, the dominant accessible and trustworthy treatment method for 1.2 billion people is still boiling water in pots over open biomass cooking fires or other cooking stoves, a process that is both energy intensive and time consuming [3,4]. The objective of this research is to computationally and empirically evaluate the capacity, fuel usage, and fecal indicator reduction of a system designed to increase the efficiency of the traditional water treatment process while continuing to utilize locally-available and renewable biomass energy resources.

1.1. Thermal Drinking Water Treatment

Thermal treatment by boiling water is widely recognized as an effective water treatment method, killing all major pathogens of concern, and is successful regardless of turbidity or pH levels [1]. Because of this, the boiling of drinking water is a point-of-use drinking water treatment method used globally by 1.2 billion people [3,4]. Although boiling is identified by the WHO as the simplest and most effective way to purify drinking water at home, it can be an extremely inefficient and wasteful process in terms of time and resources [1,5,6]. In many parts of the world, water is traditionally boiled over a three-stone fire which requires large quantities of biomass fuels (mainly dried and semi-dried firewood) and introduces a variety of health and environmental hazards due to unclean combustion [7]. One study found that boiling 5 L of water on an open fire takes 40 min and requires over 1 kg of wood fuel [8]. The increasing cost and difficulty in procuring biomass fuels in areas with deforestation is also a common reason that households may not be able to treat their water for drinking [9]. Allowing water to boil is recommended because users can visually see the water bubbling or steaming. A study of households in urban Zambia found that individual definitions of “boiling” varied from “steam rises from the surface” (39%), “tiny bubbles rise from base to surface” (8%), and “until surface boil starts” (53%) [10].
While water reaching nucleate boiling provides a clear indication that purification has occurred to the user, the deactivation of the microorganisms that cause illness actually occurs at much lower temperatures. Using lower levels of heat to inactivate microorganisms and preserve food and drink has been well known since the second century in China [11]. Centuries later, this process was formally named pasteurization after Louis Pasteur, who performed a series of thermal experiments in nineteenth century France [12]. When microorganisms, such as viruses and bacteria, are exposed to high temperatures for specific amounts of time, they begin to lose their ability to replicate and eventually destruct. Based on their chemical and material properties, the reduction in microbial concentrations via heat treatment can be predicted as a function of time and temperature through a quantity known as the D value [13]. The D value is the time it takes for a decimal reduction or 1 log (i.e., 90%) reduction in viable counts of a microorganism [14]. For example, E. coli has a D value of 2.4 s at 70 °C and therefore experiences a greater than 6 log reduction when held at 70 °C for about 15 s [15]. Of more than 140 different viruses known to infect humans, the vast majority are inactivated at temperatures around or below 60 °C [16]. At temperatures above 70 °C, some of the more thermotolerant viruses, such as poliovirus and hepatitis A, have a greater than 5 log reduction achieved in less than one minute [17]. Similarly, for parasites, Cryptosporidium has a greater than 3 log reduction at 71.7 °C for 5 to 15 s [18], Giardia cysts inactivate at temperatures ranging from 50 °C to 70 °C [17,19], and Legionella inactivates above 60 °C with an unspecified D value of much less than one minute at 70 °C [20,21]. Thus, WHO and US-EPA guidelines for drinking water quality can potentially be met by holding water at temperature of at least 70 °C for 15 s. Although users are typically encouraged to bring water to a full boil, based on the D values of pathogens described above, the pasteurization and inactivation of pathogens can actually occur at 70 °C. This requires significantly less heat input than achieving nucleate boiling at nearly 100 °C, which is done simply to provide a visual indicator that thermal treatment has occurred.
Therefore, thermal pasteurization can serve as a potentially culturally appropriate solution to purify water. Recently the use of solar-thermal pasteurization is on the rise, using methods such as the systems discussed in the review by Thirugnanasambandam et al. (2010) [22]. In these systems, water in clear containers exposed to the sun may experience both solar-thermal pasteurization and UV treatment simultaneously [1,22], however, a common disadvantage of these methods is unreliable access to sunlight and uncertainty regarding the amount of time water spends at elevated temperatures. Unlike thermal pasteurization, UV treatment alone does not eliminate cysts or worms [1].
Despite the well-documented reliance of these target communities on biomass as an energy source, few products have been designed to improve the efficiency of the ubiquitous biomass-powered boiling process. One example is the Chulli Water Purifier, developed in Bangladesh, which is a biomass-powered clay oven modified with an enclosed coiled aluminum pipe [23]. When the oven is warm, water is gravity-fed through the aluminum pipe where it is pasteurized before exiting through a tap at an average effluent temperature of 70–76 °C. Although the system is inexpensive (roughly 6 USD), a study of users in Bangladesh found that 80 of 101 households stopped using the Chulli Water Purifier, mainly due to mechanical problems and inconvenience [24]. The system also lacks automation that prevents water from flowing through if the oven is at lower temperatures, potentially allowing pathogens through before they have been inactivated. Another product developed to improve the efficiency of thermal water treatment is the Water Pasteurization Indicator (WAPI). This device is made of a clear plastic tube containing wax that melts at 70 °C, indicating when pasteurization temperature has been achieved. The WAPI is submerged in water by a thin wire hanging from the side of a pot. Once the wax melts and falls from the top of the plastic tube to the bottom, the user knows that pasteurization has occurred [6]. Although this device is a simple and inexpensive tool to indicate lower-temperature pasteurization, the process of heating small quantities of water over a biomass fire or cookstove is still costly to human health and the environment. While these solutions provide improvements to thermal water treatment, neither use heat from an efficient source, have temperature and/or time regulation to ensure pasteurized water, or have the high-throughput capacity to function as a community-based or point-of-collection solution.

1.2. Other Water Treatment Processes

Although thermal water treatment is the most globally adopted water purification method, engineered products often focus on other treatment processes, such as filtration, chlorination, and UV [1]. Each of the available options have advantages and disadvantages, which are discussed here and summarized in Table 1. Filtration is a popular option for projects seeking to provide household and community-scale treatment, with methods such as ceramic pot or activated charcoal filters becoming widespread in households. These typically require consumable parts that rely on a continuous supply chain in the community. Locally-made slow and rapid sand filters, such as the Biosand filter, may be relatively inexpensive and simple to construct, however, their ability to remove bacteria and viruses varies dramatically. While laboratory studies have shown a reduction in E. coli between 94% and 99% [25], Biosand filter performance in the field has varied widely, from 48% to 98.5%, in various studies [26,27,28]. The variance in Biosand filter performance is largely due to lack of maintenance, incorrectly installed sand, and lack of user education [29]. Other forms of filtration units, such as ceramic, pressure filters, and synthetic mesh also range in cost, performance, and appropriateness in the local community [30,31].
Chlorine is commonly used worldwide at the household and state level because it is inexpensive, available in both liquid and tablet form, and can disinfect large quantities of water [30]. Although chlorine is available globally, it does not always have a reliable supply chain in rural regions and may be costly or simply unavailable for low-income households and institutions [32]. Using chlorine also requires precise dosage and timing to be effective and palatable. Insufficient doses of chlorine may not kill all the bacteria, while excess doses may leave poor-tasting or foul-smelling water. In addition, chlorine requires roughly 30 min to fully kill microorganisms in water—an essential step that may be ignored by the user.

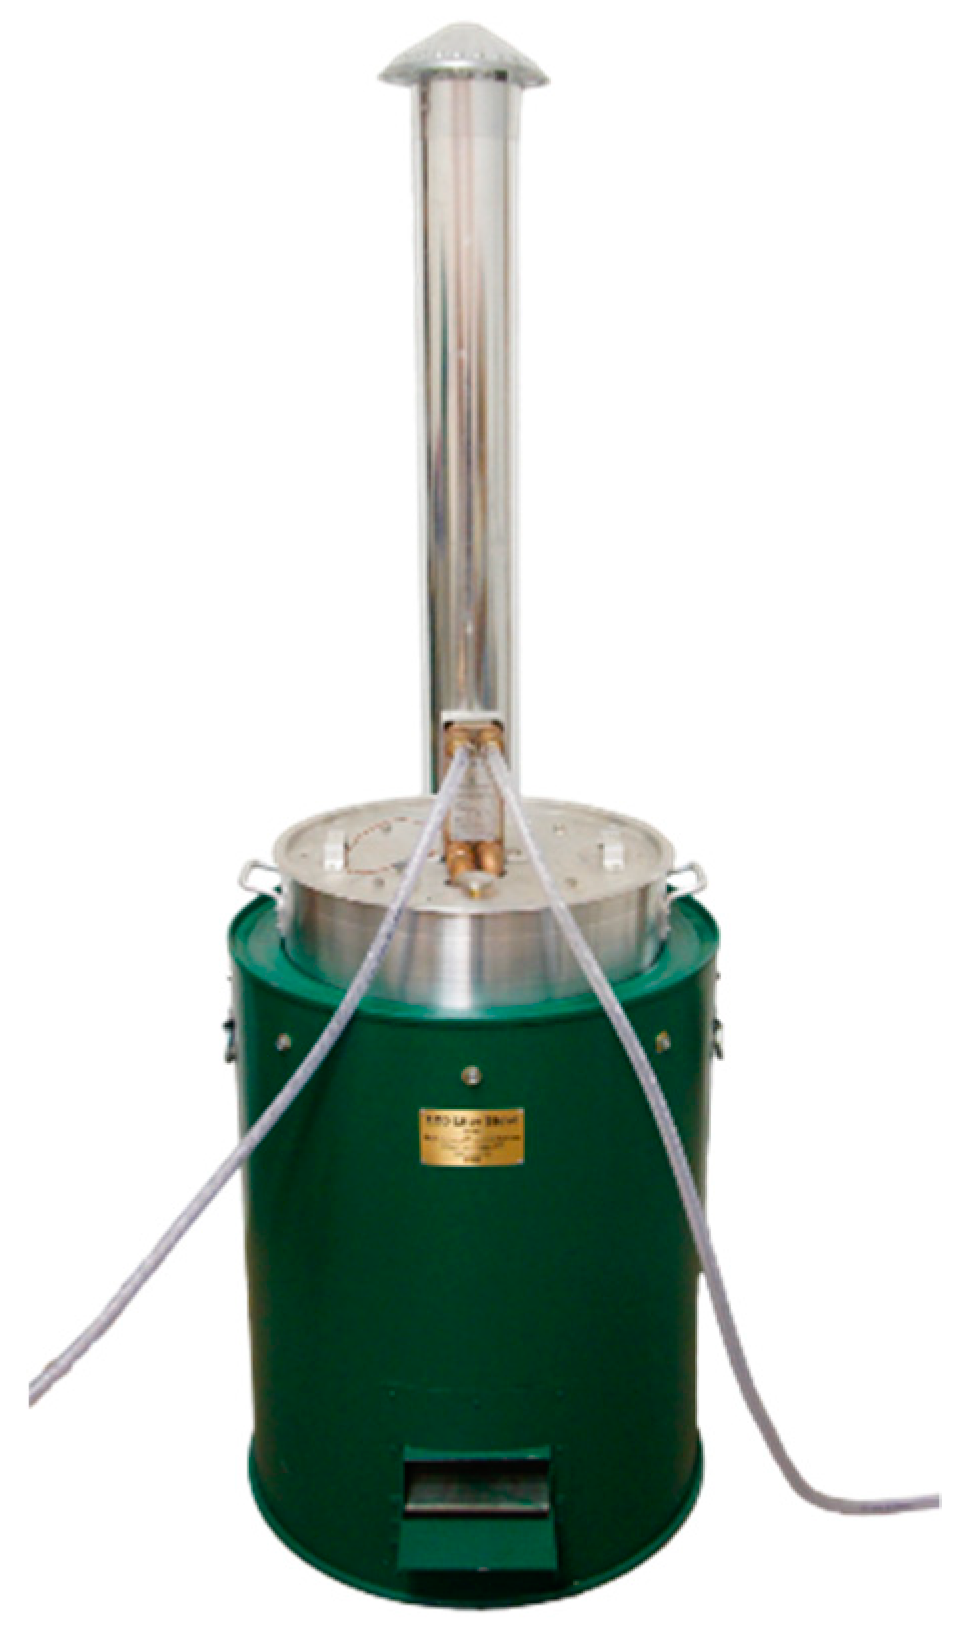
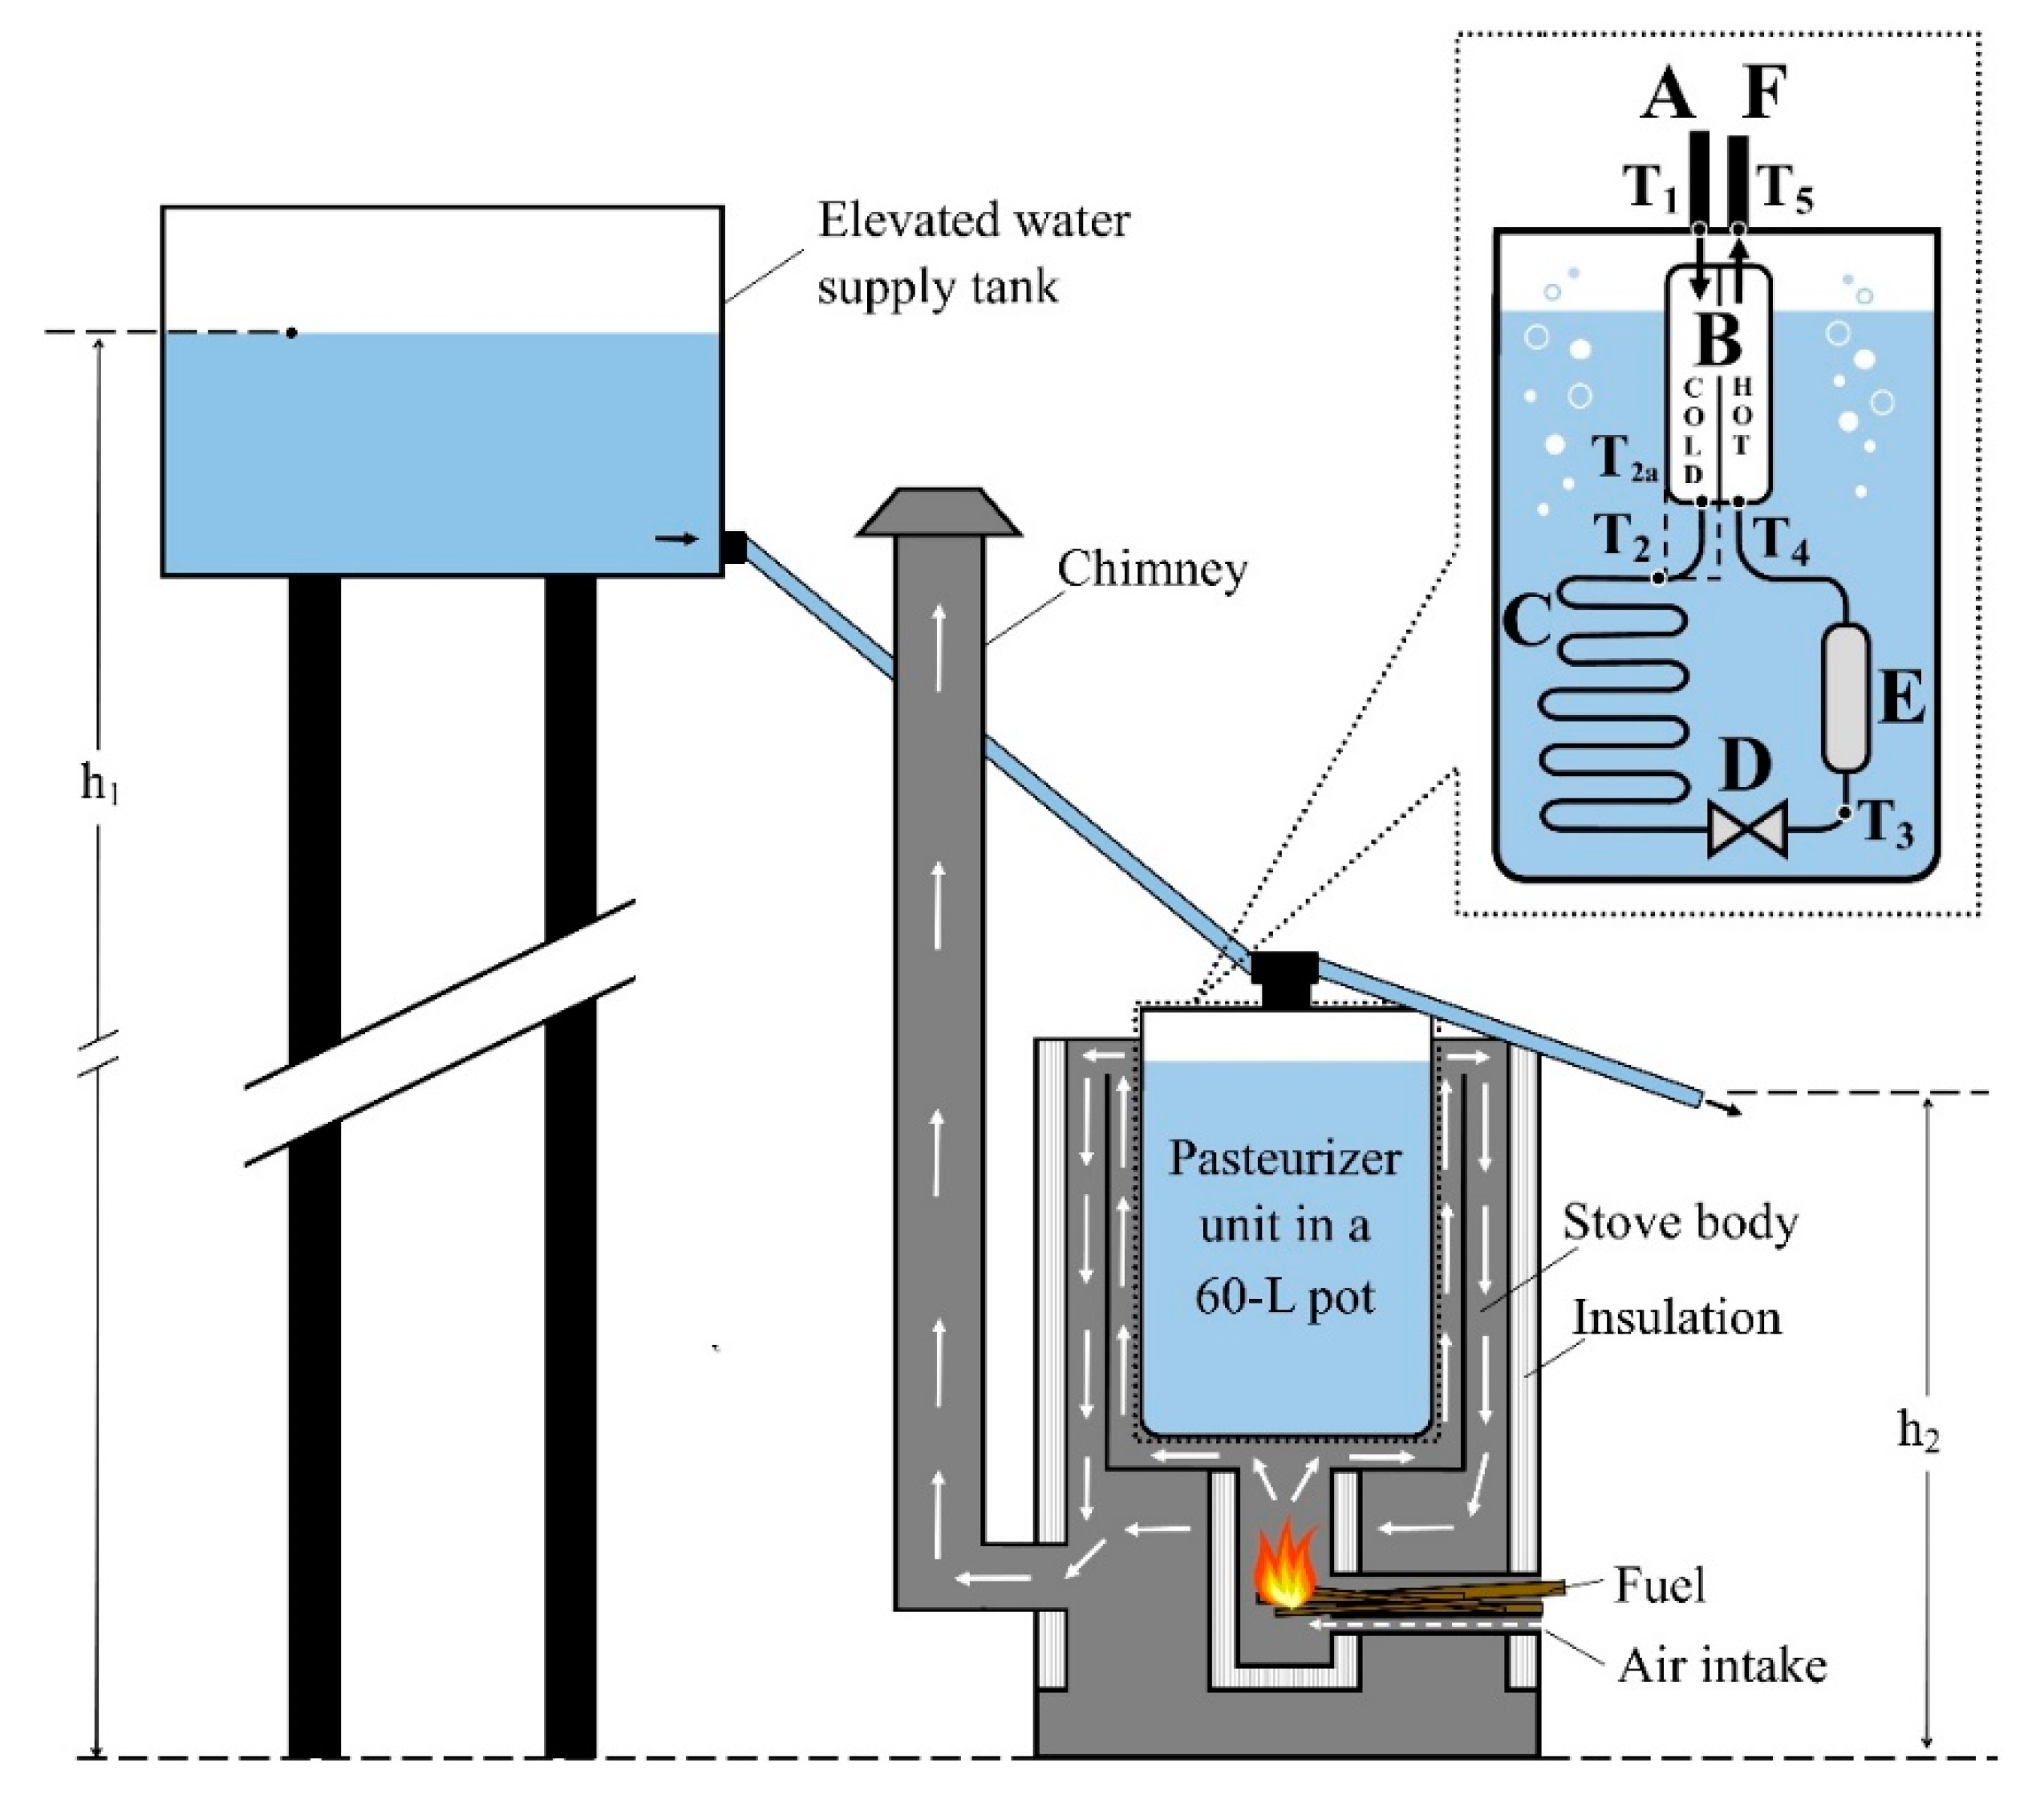
1.3. Water Pasteurizer Design

Since there is vast room for improvement in the engineering of biomass-powered thermal water treatment systems, a system (so-called “water pasteurizer”) was designed by a U.S.-based cookstove manufacturing company to improve fuel efficiency while providing community-scale capacity. The water pasteurizer presented in this study, shown in Figure 1, is a continuous-flow, self-regulating system designed to meet WHO and EPA standards by heating water to an established state defined by the combination of time and temperature (70 °C for 15 s) needed to reduce E. coli concentrations by at least 6 log.
During operation of the water pasteurizer (Figure 2), cold, untreated water first enters the pasteurizer from a pressurized source, such as an elevated tank, and passes through a compact heat exchanger (Duda Diesel Model number B3-36A), where it collects waste heat from the hot water stream exiting the system. The water then flows through a copper coil and collects additional heat from a reservoir of hot water in a large stockpot, which is heated externally by the biomass cookstove or other concentrated heat source. Next, water flows through an automatic, mechanical thermostatic valve (Thermomegatech 3/4″ HAT-RA 170 Part Number 145-502100-170), which remains closed if the water temperature is below 160 °F (71 °C), ensuring that only water that has reached the pasteurization temperature for a 6 log reduction of E. coli passes through the valve. Once water is at 71 °C, triggering the valve to open, the water then enters a copper pipe with an increased diameter, labeled as the “kill chamber,” which serves to hold the water at the pasteurization temperature for an additional amount of time, depending on the flow rate. Water then flows through the hot side of the heat exchanger where heat is recuperated to the incoming (cold) stream, before exiting the system at a safe handling temperature ready for storage or consumption.
This system has advantages and disadvantages relative to other methods, and is appropriate in some applications and not others. It is a community-scale system that purifies water at the point of collection rather than the point of use and most effectively serves approximately 200–1000 people per day. This requires a single practitioner or community institution to oversee the operation and maintenance of the system and distribution to local residents, potentially providing an income-generation opportunity for those individuals. It can also provide a cost-saving opportunity for the many institutions such as schools, hospitals, and displaced persons camps who are already purifying water by boiling. A single local source of clean water saves the time, labor, and energy resources of individuals in the community. Purification at the point of collection also necessitates a clean downstream distribution network to the point of use to prevent recontamination, so container cleaning and contamination prevention protocol should also be followed in this case. The use of thermal treatment over other methods such as filtration or chlorination may be more cumbersome and energy-intensive, but in some communities the reliable supply chain and adoption rates of these alternatives may not be sufficient. Thus, the pasteurizer system is relevant to explore as a potential solution.

2. Materials and Methods

The objective of this study was to analytically model and empirically test the pasteurizer system to determine the thermal and microbial reduction performance of the components and the system, compare with other thermal treatment methods, and provide recommendations for design optimization. To account for differences in anticipated operational parameters, various flow rates were compared.

2.1. Computational Model

A one-dimensional steady-state heat transfer model, described in Appendix A, was created to determine the effects of water inlet pressure, flow rate, temperature, and stockpot temperature on the time spent at 71 °C or above, required heat input, and outlet temperature. The Engineering Equation Solver code to run this model is available in the Supplementary Materials.

2.2. Empirical Data Collection

Empirical data collection included measurements of temperature at various points in the system, and pressure drop, flow rate, heat exchanger effectiveness, fuel usage, and inactivation of fecal indicators.

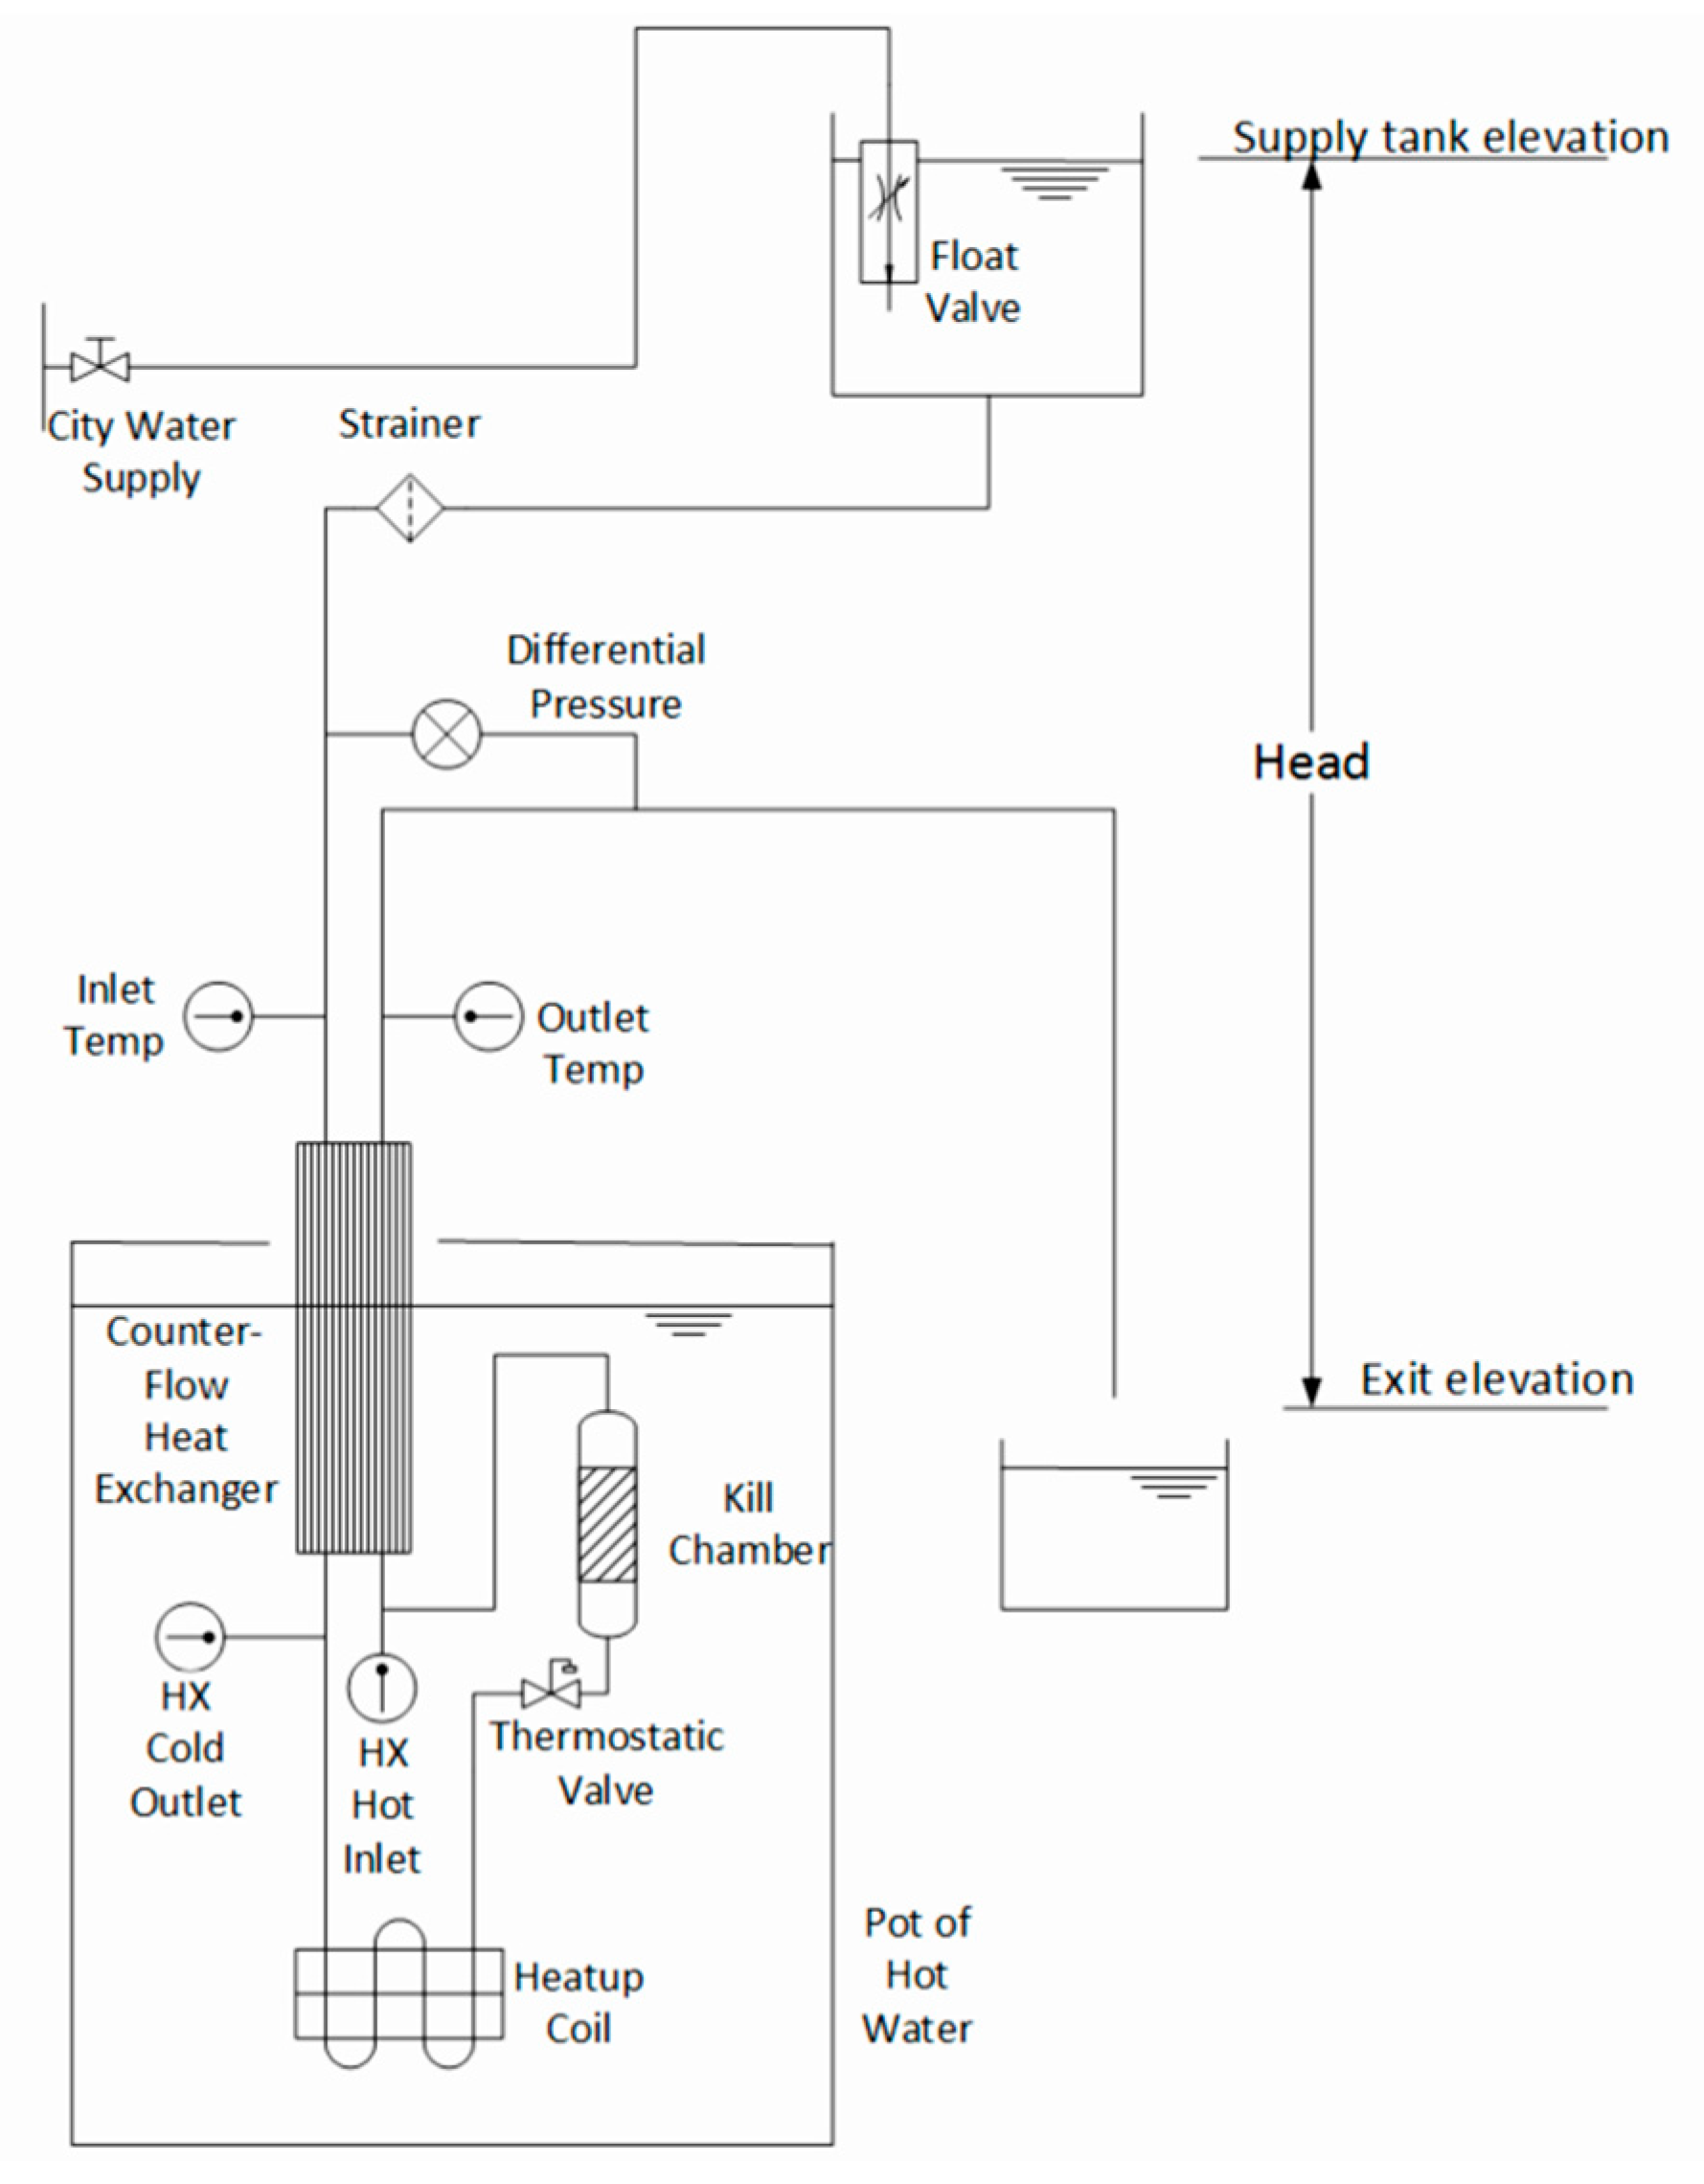
2.2.1. Temperature, Pressure Drop, and Flow Rate

Temperature, pressure drop, and flow rate were monitored during system operation using a data acquisition system (Figure 3). To measure these and other temperatures needed for calculation and validation, five Omega K-type thermocouples were installed at the five state points labeled in Figure 1. An Omega PX26-005DV differential pressure transducer was coupled to the system via water-filled tubes connected to the inlet and outlet of the system used to measure the pressure loss between state points 1 and 5. The measurement tubes were connected to linear sections of system pipes to minimize the effects of impinging fluid momentum on the pressure measurements. Data from the thermocouples and the pressure transducer were measured using a DAQ NI-9212 Simultaneous Temperature Input Module and a NI-9207 Voltage and Current Input Module, respectively. Lastly, volumetric flow rates were measured using a catch-and-weigh method which involved measuring the time taken to collect approximately 18 L of water and dividing the water mass by the collection time.
The system was operated over a range of conditions to characterize system parameters according to Table 2. Identically-cut pieces of kiln-dried Douglas fir provided a consistent fuel source, and a water supply tank was set to the desired height above the outlet of the system. Once the fire was lit and the system reached operational temperatures, the thermostatic valve opened automatically and water began flowing. A period of 15 min was allowed to pass for the system to reach equilibrium. Data were then collected at six different supply tank head levels (1.32, 2.06, 3.53, 4.19, 4.90, and 5.00 m) on the same day during one continuous operation cycle. Experiments were performed in random order and a pause in data collection of at least 5 min was allowed for the system to reach equilibrium after each change in head level. Experimental uncertainty was calculated based on manufacturer-specified accuracy and precision for the sensors and the DAQ system. Where multiple instruments were used for a single measurement, the Kline–McClintock method is used to combine the uncertainties into a single value.
Heat exchanger effectiveness was calculated according to Equation (1) as a required input to the model [33]. Because the mass and volumetric flow rate is equal on both sides of the heat exchanger, and the temperatures are close enough that the specific heat can also be assumed to be equal on both sides (varying only from 4.1844 at ambient to 4.1902 kJ/kgK at pasteurization temperatures), the heat exchanger effectiveness is a function only of the inlet and outlet temperatures. However, since the heat exchanger is submerged in a pot of near-boiling water and is therefore nonadiabatic in this system, the effectiveness for each side was calculated separately and compared.
ε = q H   o r   C q m a x = m ˙ c p ( Δ T H   o r   C ) m ˙ c p ( T H i T C i ) = Δ T H   o r   C T H i T C i

2.2.2. Fuel Usage

The fuel requirements for the system were evaluated as a design parameter and for comparison to those of various traditional boiling practices from the literature. While operating the pasteurizer in a 60 L, biomass-powered institutional cookstove (Figure 1), the fuel required to treat 30 gallons (113.5 L) of water from a supply tank situated 3.8 m above the system’s outlet was measured [34]. To determine energy usage, identically-cut pieces of kiln-dried Douglas fir (a biomass fuel used in prior cookstove benchmarking studies [8]) with dimensions of 30 × 5 × 1.25 cm, predicting a higher heating value (HHV) of 20,634 kJ/kg and a lower heating value (LHV) of 19,314 kJ/kg, were used [35]. To determine the moisture content of the fuel, a 473 g sample of wood was placed into the oven at 220 °F for 7 h until it reached a dry weight of 404 g. The reduction in weight determined a measured as-received moisture content (MC) of 14.6%, which was used to calculate the equivalent dry fuel usage. Before each of the three trials, the weight of the supply of wood fuel was measured on a calibrated scale. The stove was then ignited and the initial time was recorded. Once water began to flow through the system, indicating that the thermostatic valve had reached at least 71 °C, the time was recorded and the unburned wood was weighed. When 30 gallons (113.5 L) of water was pasteurized, the final time was noted and wood mass and temperature measurements were taken again. All wood was removed from the stove and the pasteurizer was allowed to cool until outlet flow stopped, indicating that the water temperature had decreased below 71 °C and the thermostatic valve had closed. Using the weight of the burnt wood and volumetric flow rate of water through the system, the average fuel consumption was calculated and reported in grams equivalent of dry wood per liter pasteurized. Available energy in the form of equivalent dry wood was determined by subtracting the energy required to evaporate the moisture contained in the fuel used for experimentation.

2.2.3. Inactivation of Fecal Indicators

To evaluate the reduction in fecal indicators through the pasteurization system, as recommended by the WHO, the reduction in E. coli and bacteriophage MS2 was assessed in laboratory experiments. For the detection and enumeration of E. coli, a 75 L tank of untreated groundwater was inoculated with E. coli ATCC 25922 to reach a target concentration of 6 log colony-forming units (CFU) per mL. Three separate trials, each pasteurizing 75 L of inoculated ground water, were performed. One sample was collected from the inoculated source water, and a total of five 100 mL samples of the treated water were collected from the outflow and final collection tank. E. coli concentrations in the untreated water were determined by serial dilutions and spread-plating of 100 μL volumes on MacConkey agar (Criterion™, Hardy Diagnostics, Santa Maria, CA, USA). The 100 mL treated water samples were filtered through a 0.47 µm mixed cellulose membrane filter (Advantec MFS, Inc., Dublin, CA, USA) and placed on MacConkey agar plates, following ISO 9308-1:2000. Negative controls for membrane filtration were ran between every five samples. Plates were incubated at 36 °C for 18–24 h. Plates with 20–200 colonies were quantified and results were reported as CFU/100 mL. The lower detection limit was 1 CFU/100 mL.
To detect and enumerate bacteriophage MS2 (ATCC 15597-B1), ISO 10705-3:2003 protocol was followed using E. coli (ATCC 700891) as the host. A 75 L tank was inoculated with the bacteriophage MS2. Three separate trials, each pasteurizing 75 L of inoculated ground water, were performed. One sample was collected from the inoculated source water, and two 100 mL samples of the treated water were collected from the treated outflow water. A double agar overlay method was used to quantitatively enumerate the concentration of the samples. For this method, 5 mL of a 0.7% Tryptic Soy Agar (TSA) mixture was inoculated with 50 µL of log phase ATCC 700891 E. coli and poured onto a petri dish containing 1.5% TSA. A sample of 100 µL of the inoculated tank was spotted on the surface, covered and allowed to sit 10 min to absorb. A negative control was ran with each trial. Plates were then incubated at 36 °C for 16–24 h. Plates with 20–200 plaque-forming units (PFU) were used in reporting concentrations in PFU/mL. The lower limit of detection was 10 PFU/mL.

3. Results

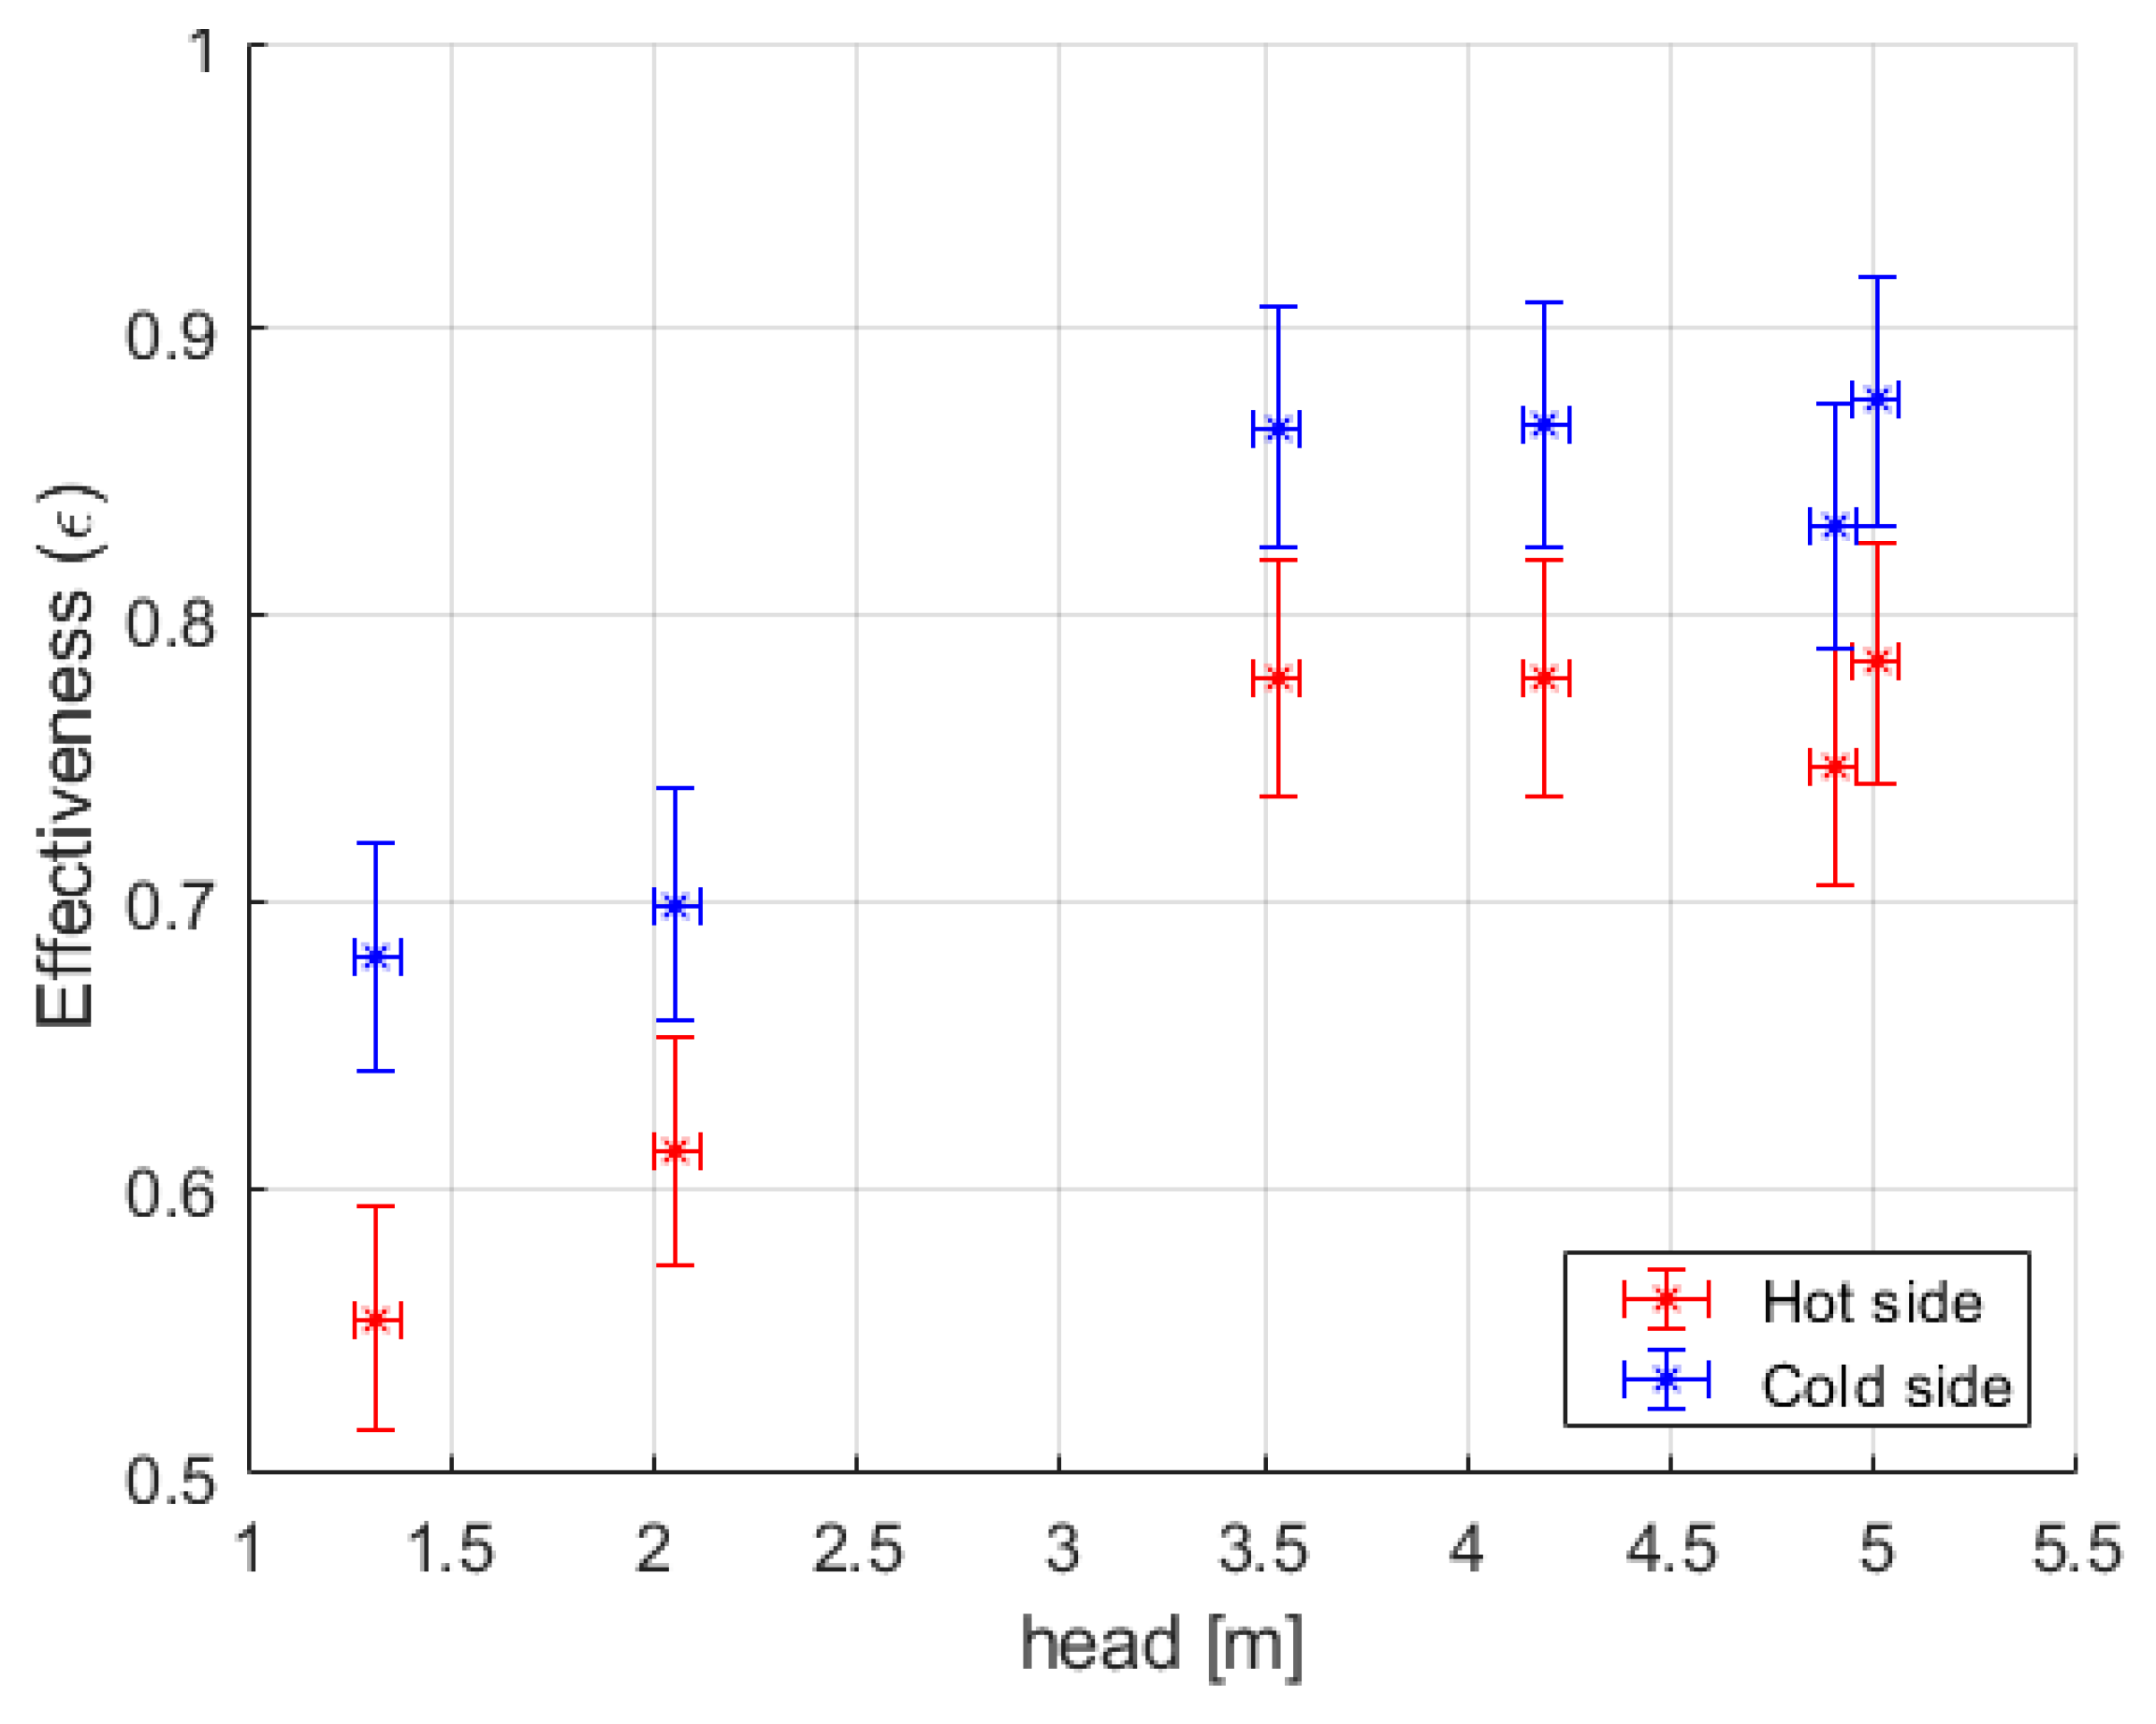
3.1. Heat Exchanger Effectiveness

The effectiveness of the heat exchanger was quantified based on temperature measurements at the entrance and exit of both the cold and hot side of the counter flow heat exchanger at six different flow rates. As shown in Figure 4, the effectiveness is different on each side of the heat exchanger, demonstrating its nonadiabatic characteristic. As described previously, partial submersion of the heat exchanger in the stockpot of heated water means that additional heat added to the heat exchanger (qadd) increases the effectiveness in the cold side while lowering the effectiveness on the hot side. At flow rates above 6 L/min, the heat exchanger’s hot side effectiveness is about 78%, compared to 60% for flow rates below 3.6 L/min. Thus, the system is most thermally efficient at flow rates above 6 L/min, corresponding to an inlet pressure of 3.5 m of head or higher.
A curvefit from the data in Figure 4 for the heat exchanger effectiveness as a function of flowrate is shown in Figure 5. A transition point occurs when the flow rate reaches 5.5 L/min, most likely due to a change in flow regime such as a transition from laminar to turbulent flow. However, this has not been characterized in the Duda Diesel heat exchanger because the transition point(s) is/are dependent on the working fluid and, due to the honeycomb flow path within the plates, are subject to harmonics as well as turbulence. The relationship between flow rate and ε was incorporated into the computational model.

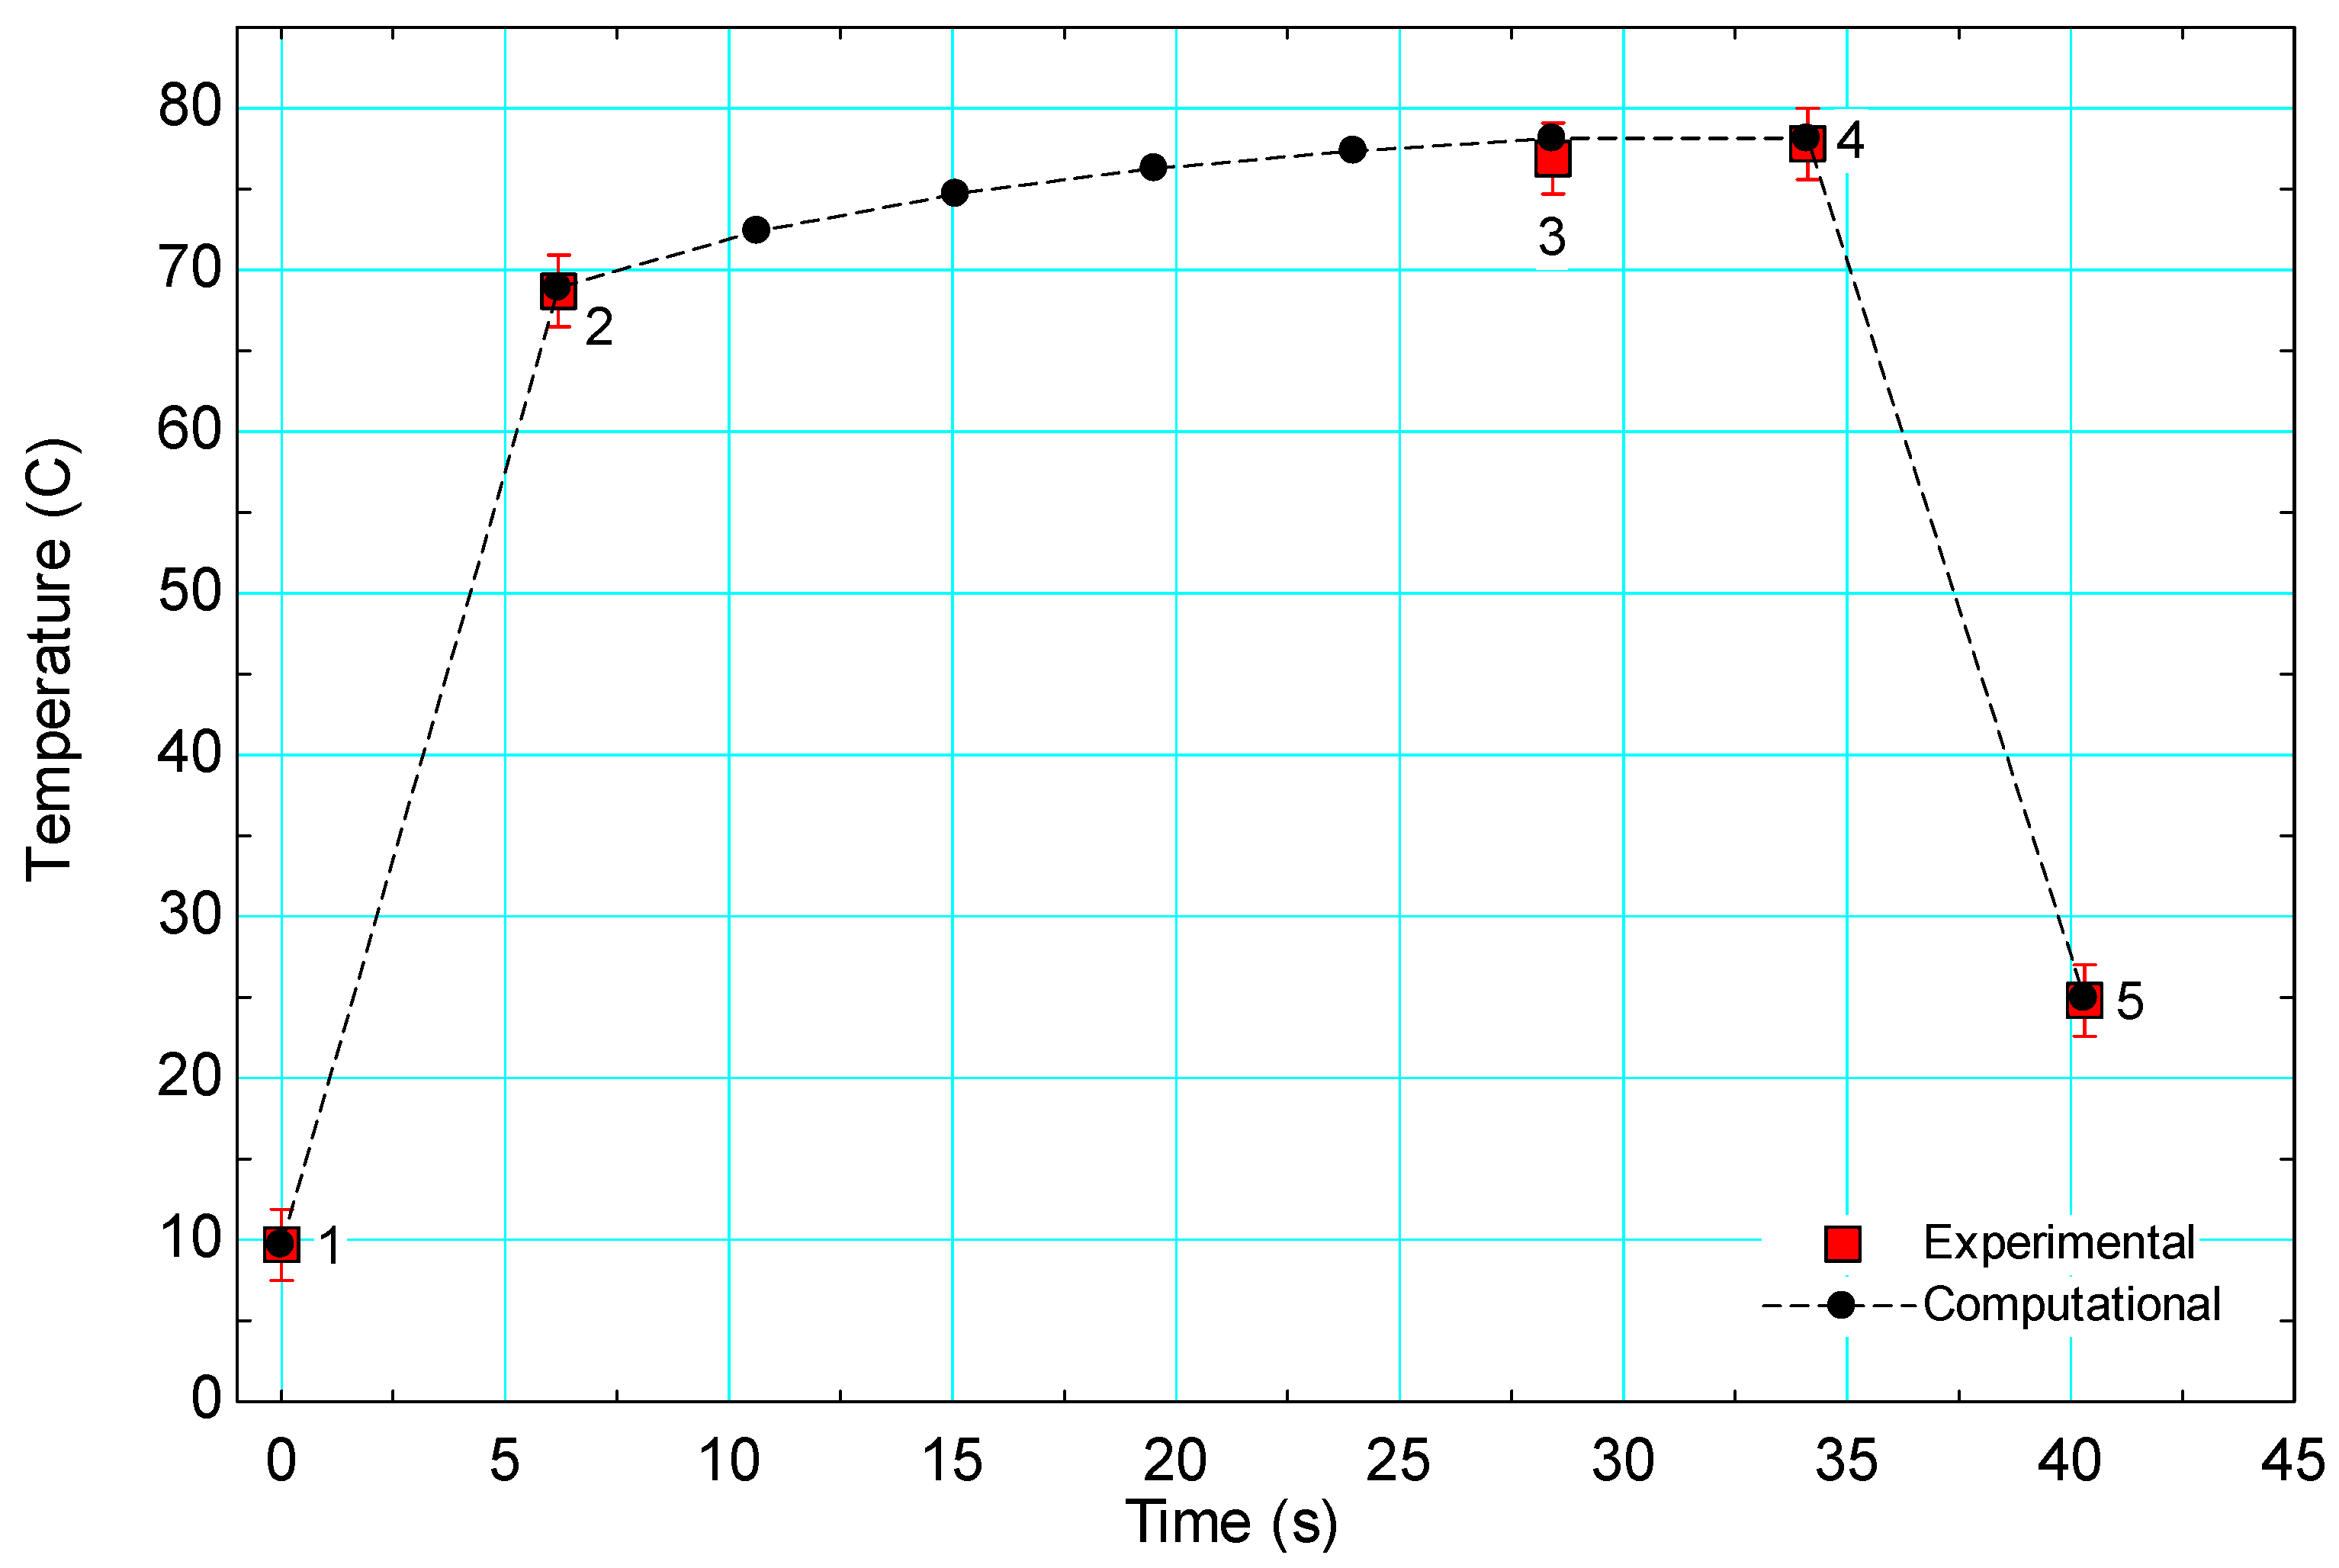
3.2. Model Validation

Temperatures at five locations throughout the system, as shown in Figure 2, were evaluated at six different flow rates. As shown in Table 3, the difference between experimental and predicted temperatures were small, with an R2 value of 0.9992, validating the model. Figure 6 compares the predicted and experimental treatment water temperature profile as it passes through the system as a function of time for a specific experimental trial with an inlet temperature of 9.7 °C, stockpot temperature of 80.6 °C, and flow rate of 6.43 L/min. Experimental data are overlaid in red square datapoints.

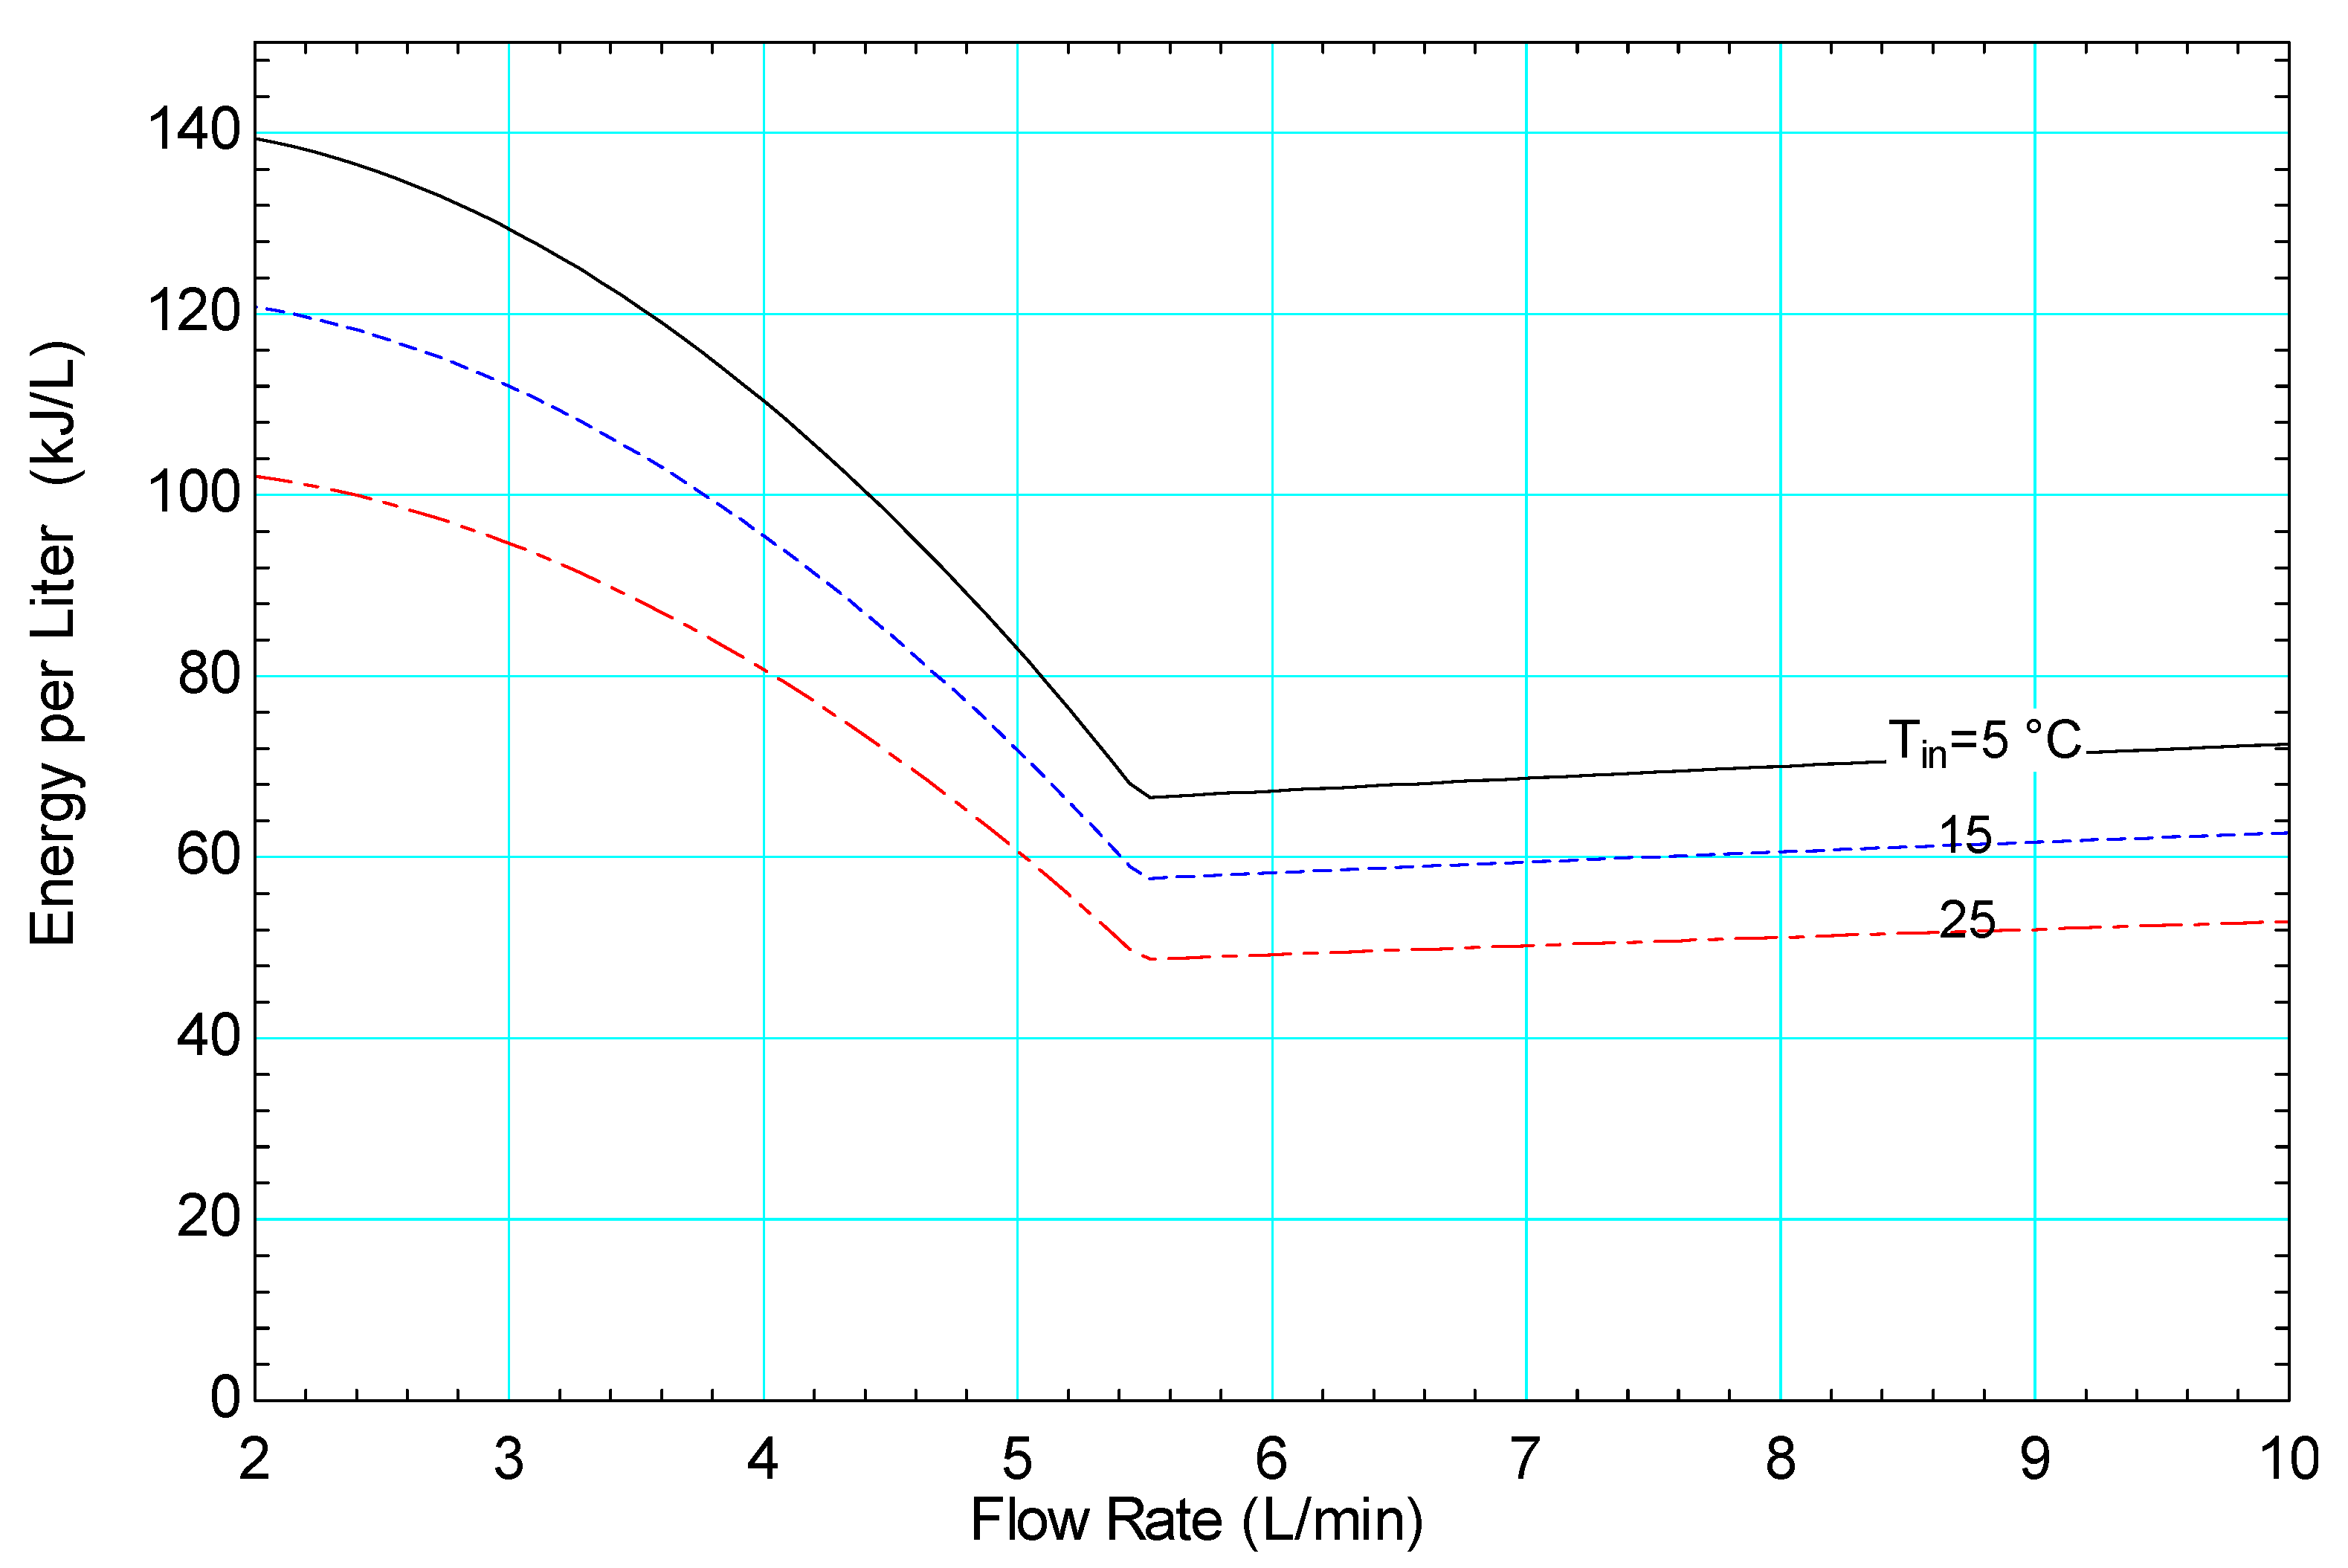
3.3. Computational System Performance
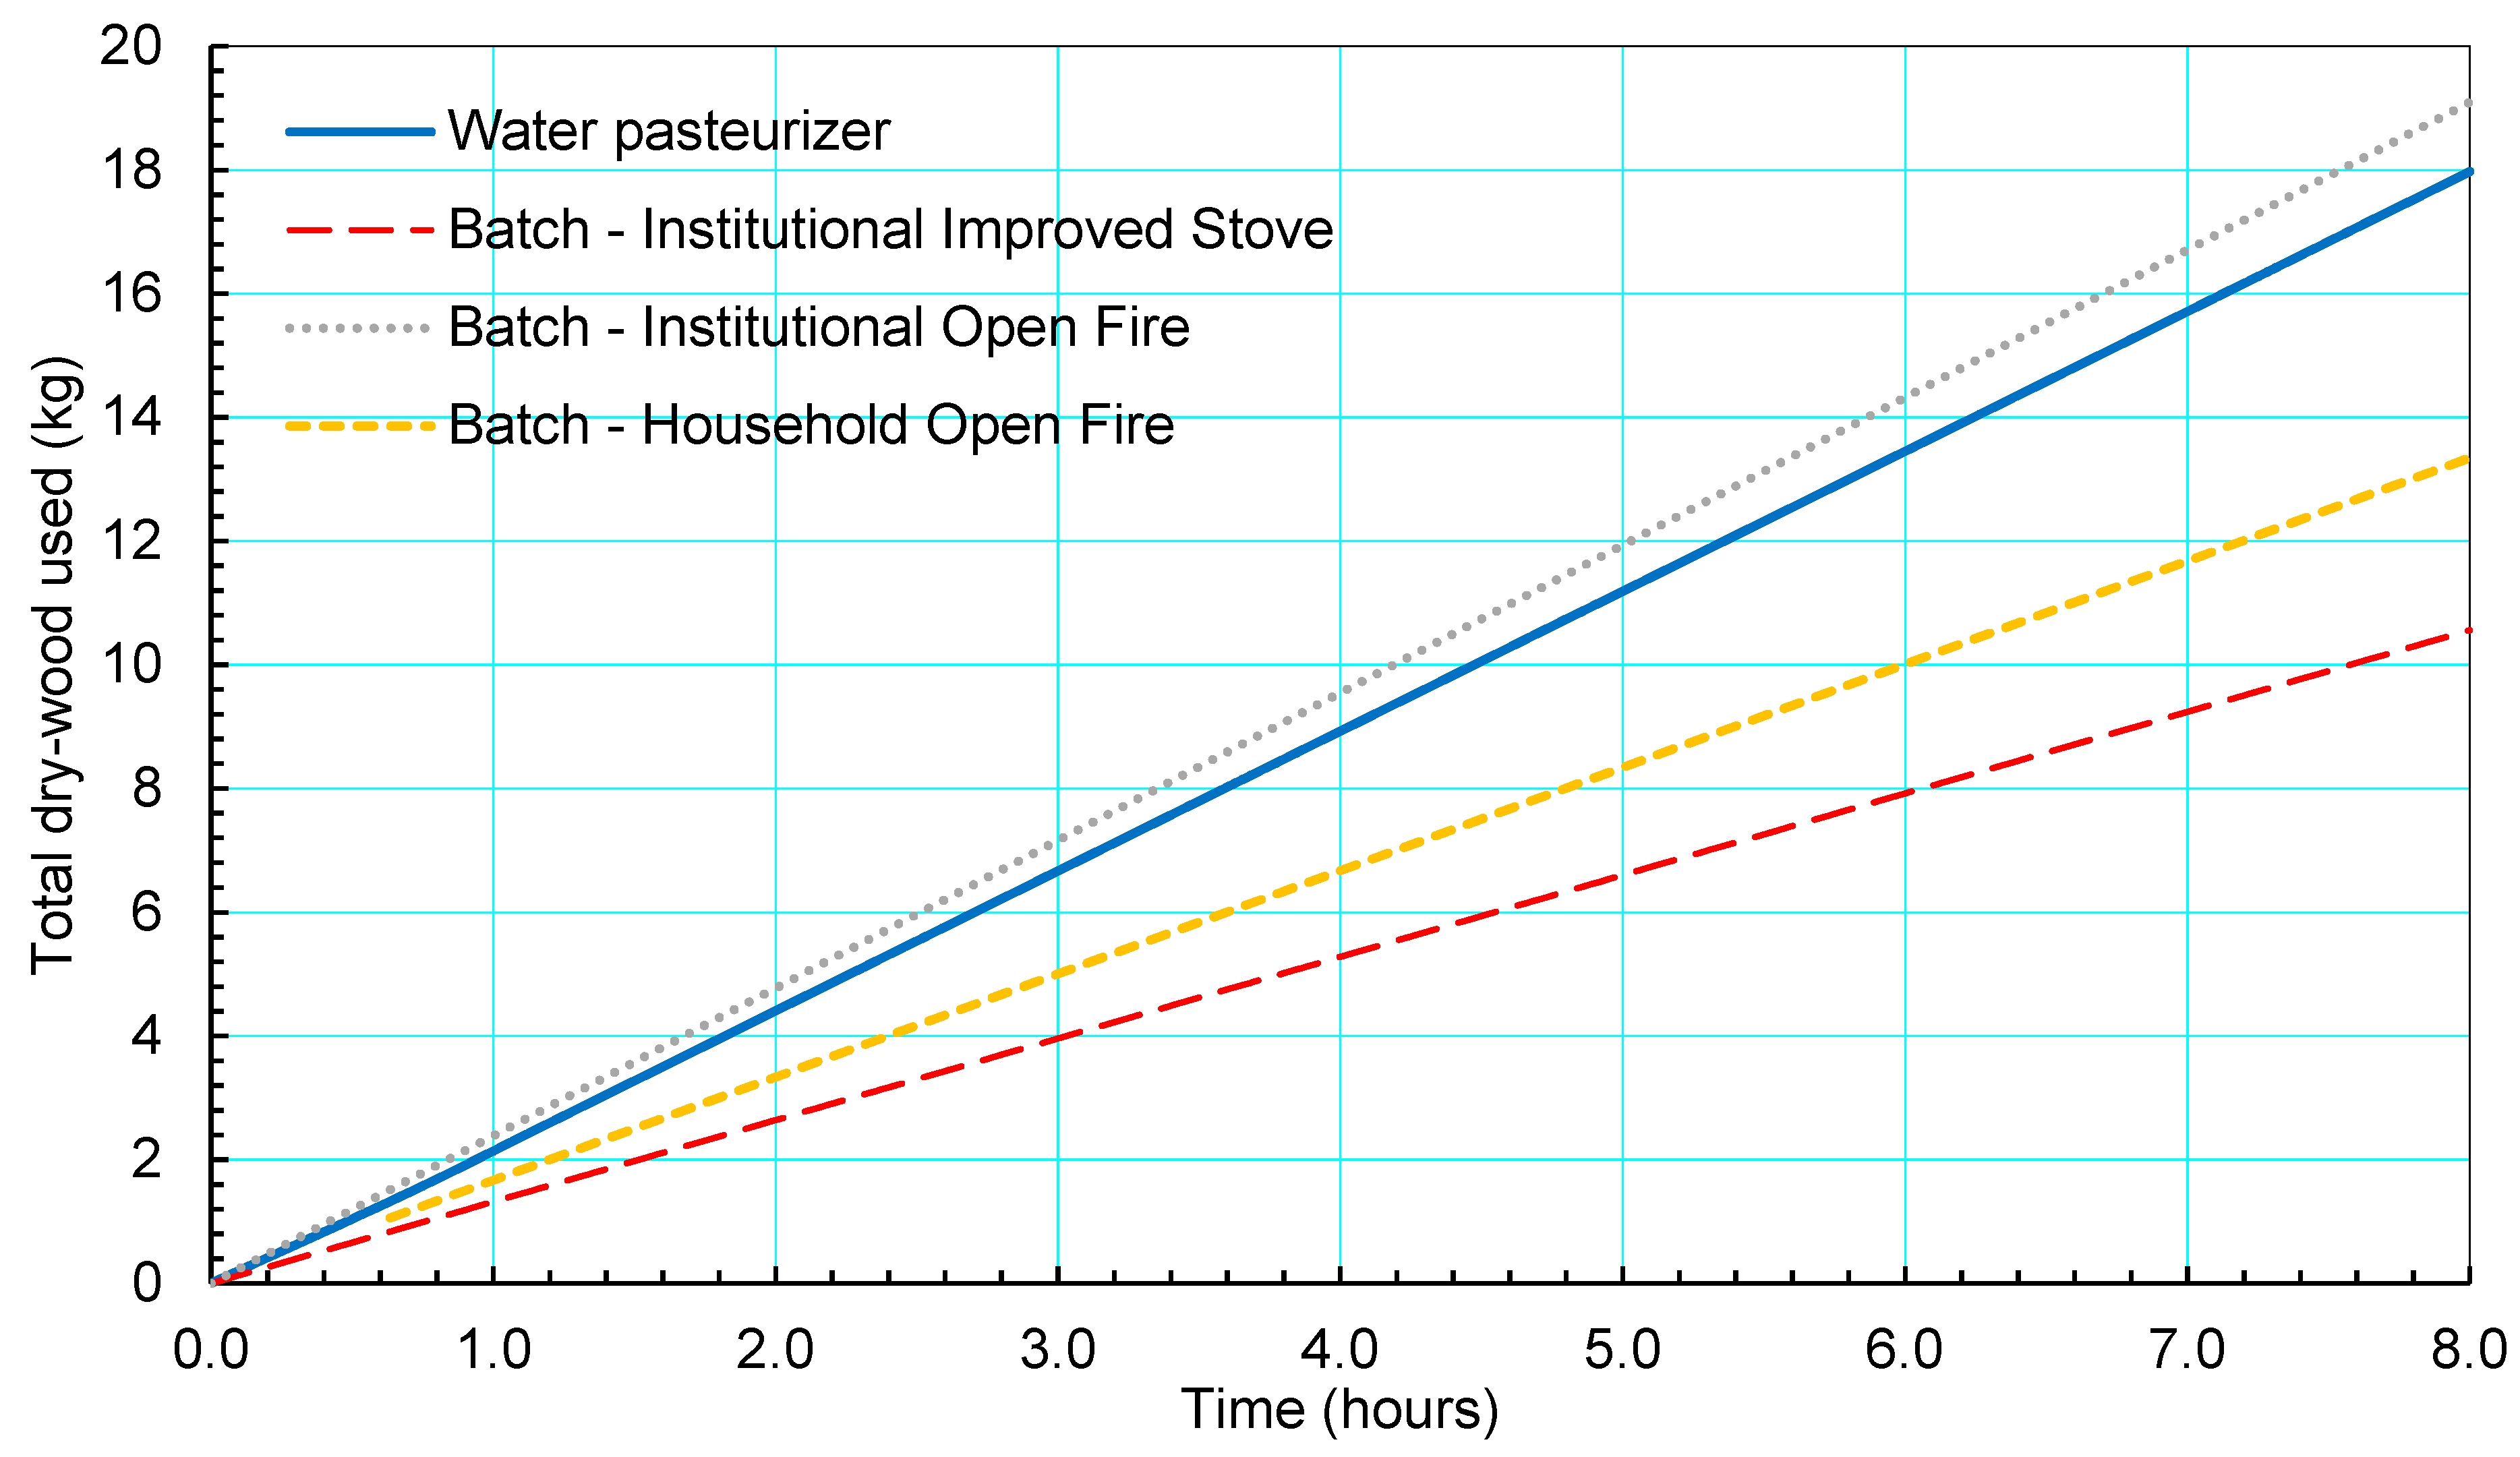
The model was used to simulate the effects that volumetric flow rate of treatment water, water inlet temperature, atmospheric pressure, and pot water temperature have on required heat input to maintain the water in the pot at a constant temperature, and the total time the water is at or above 71 °C. Thus, the model can be used to quantify the effect of in-field operating parameters on system performance. Data are presented as a function of volumetric flow rate in the range of 2 to 10 L per minute, as flow less than this would not be sufficient and flow rates any higher will not effectively pasteurize the water, as discussed in the following sections.
Required heat input to the pot of water (with no losses) is shown as a function of flow rate, both as the total heat input required from the fire (Figure 7) and per liter of water produced (Figure 8). As expected, the required total and per liter heat input required increases, with corresponding increases in volumetric flowrate and decreasing inlet temperature. Note that this is the amount of useful energy required by the pasteurizer system, and does not include any inefficiencies associated with the device heating the pot or evaporation losses from the water in the pot.
A discontinuity is noted around a volume flowrate of 5.5 L per minute in all of the calculated results. This is associated with a change in the relationship between flow rate and heat exchanger effectiveness, which is attributed to a flow regime change such as a transition from laminar to turbulent in the heat exchanger, as discussed in Section 4.1 and shown in Figure 7 and Figure 8.
Results from the model also show the effects of flow rate, inlet temperature, and pot temperature on the time spent above 71 °C in the heating coil, in the kill chamber, and in total (heating coil plus kill chamber) (Figure 9), thus indicating the efficacy of pasteurization. As the flowrate increases, the total time spent above 71 °C decreases. The horizontal dotted line in Figure 9 indicates the time required for a 6 log reduction in E. coli bacteria and indicates that flow rates above 9 L/min will not meet US-EPA requirements for 6 log reduction at a low-end pot temperature of 80 °C.

3.4. Fuel Usage

From three separate experimental trials, an average of 42 min and 1.5 kg of dry wood was required to raise approximately 50 L of water in the stock pot to the operating temperature of 80 °C from an ambient temperature of 2 °C to begin the flow of pasteurized water. After this steady-state operation was reached, the average flow rate was measured at 6.85 ± 0.72 L/min (average ± standard error) and the steady-state production of treated water required an average 5.5 ± 0.23 g of dry wood equivalent per liter of water pasteurized, or 113 ± 4.7 kJ of energy per liter, roughly the weight and energy contained in a wooden pencil.

3.5. Inactivation of Fecal Indicators

The initial concentration of the E. coli and bacteriophage MS2 in the inoculated untreated water in the tank was 6.1 ± 0.05 (average ± standard error) log CFU/mL and 6.5 ± 0.01 log PFU/mL; respectively. During both the E. coli and bacteriophage MS2 testing, all effluent samples from each trial run showed concentrations below the detection limit (i.e., <1 E. coli CFU/100 mL and <10 bacteriophage MS2 PFU/mL). These experimental results indicated an over 8-log reduction in E. coli and 6-log reduction in bacteriophage MS2 at a supply tank level of 3.04 m (flow rate approximately 7 L/min), meeting and surpassing both WHO and US-EPA guidelines for these indicators [36,37].

4. Discussion

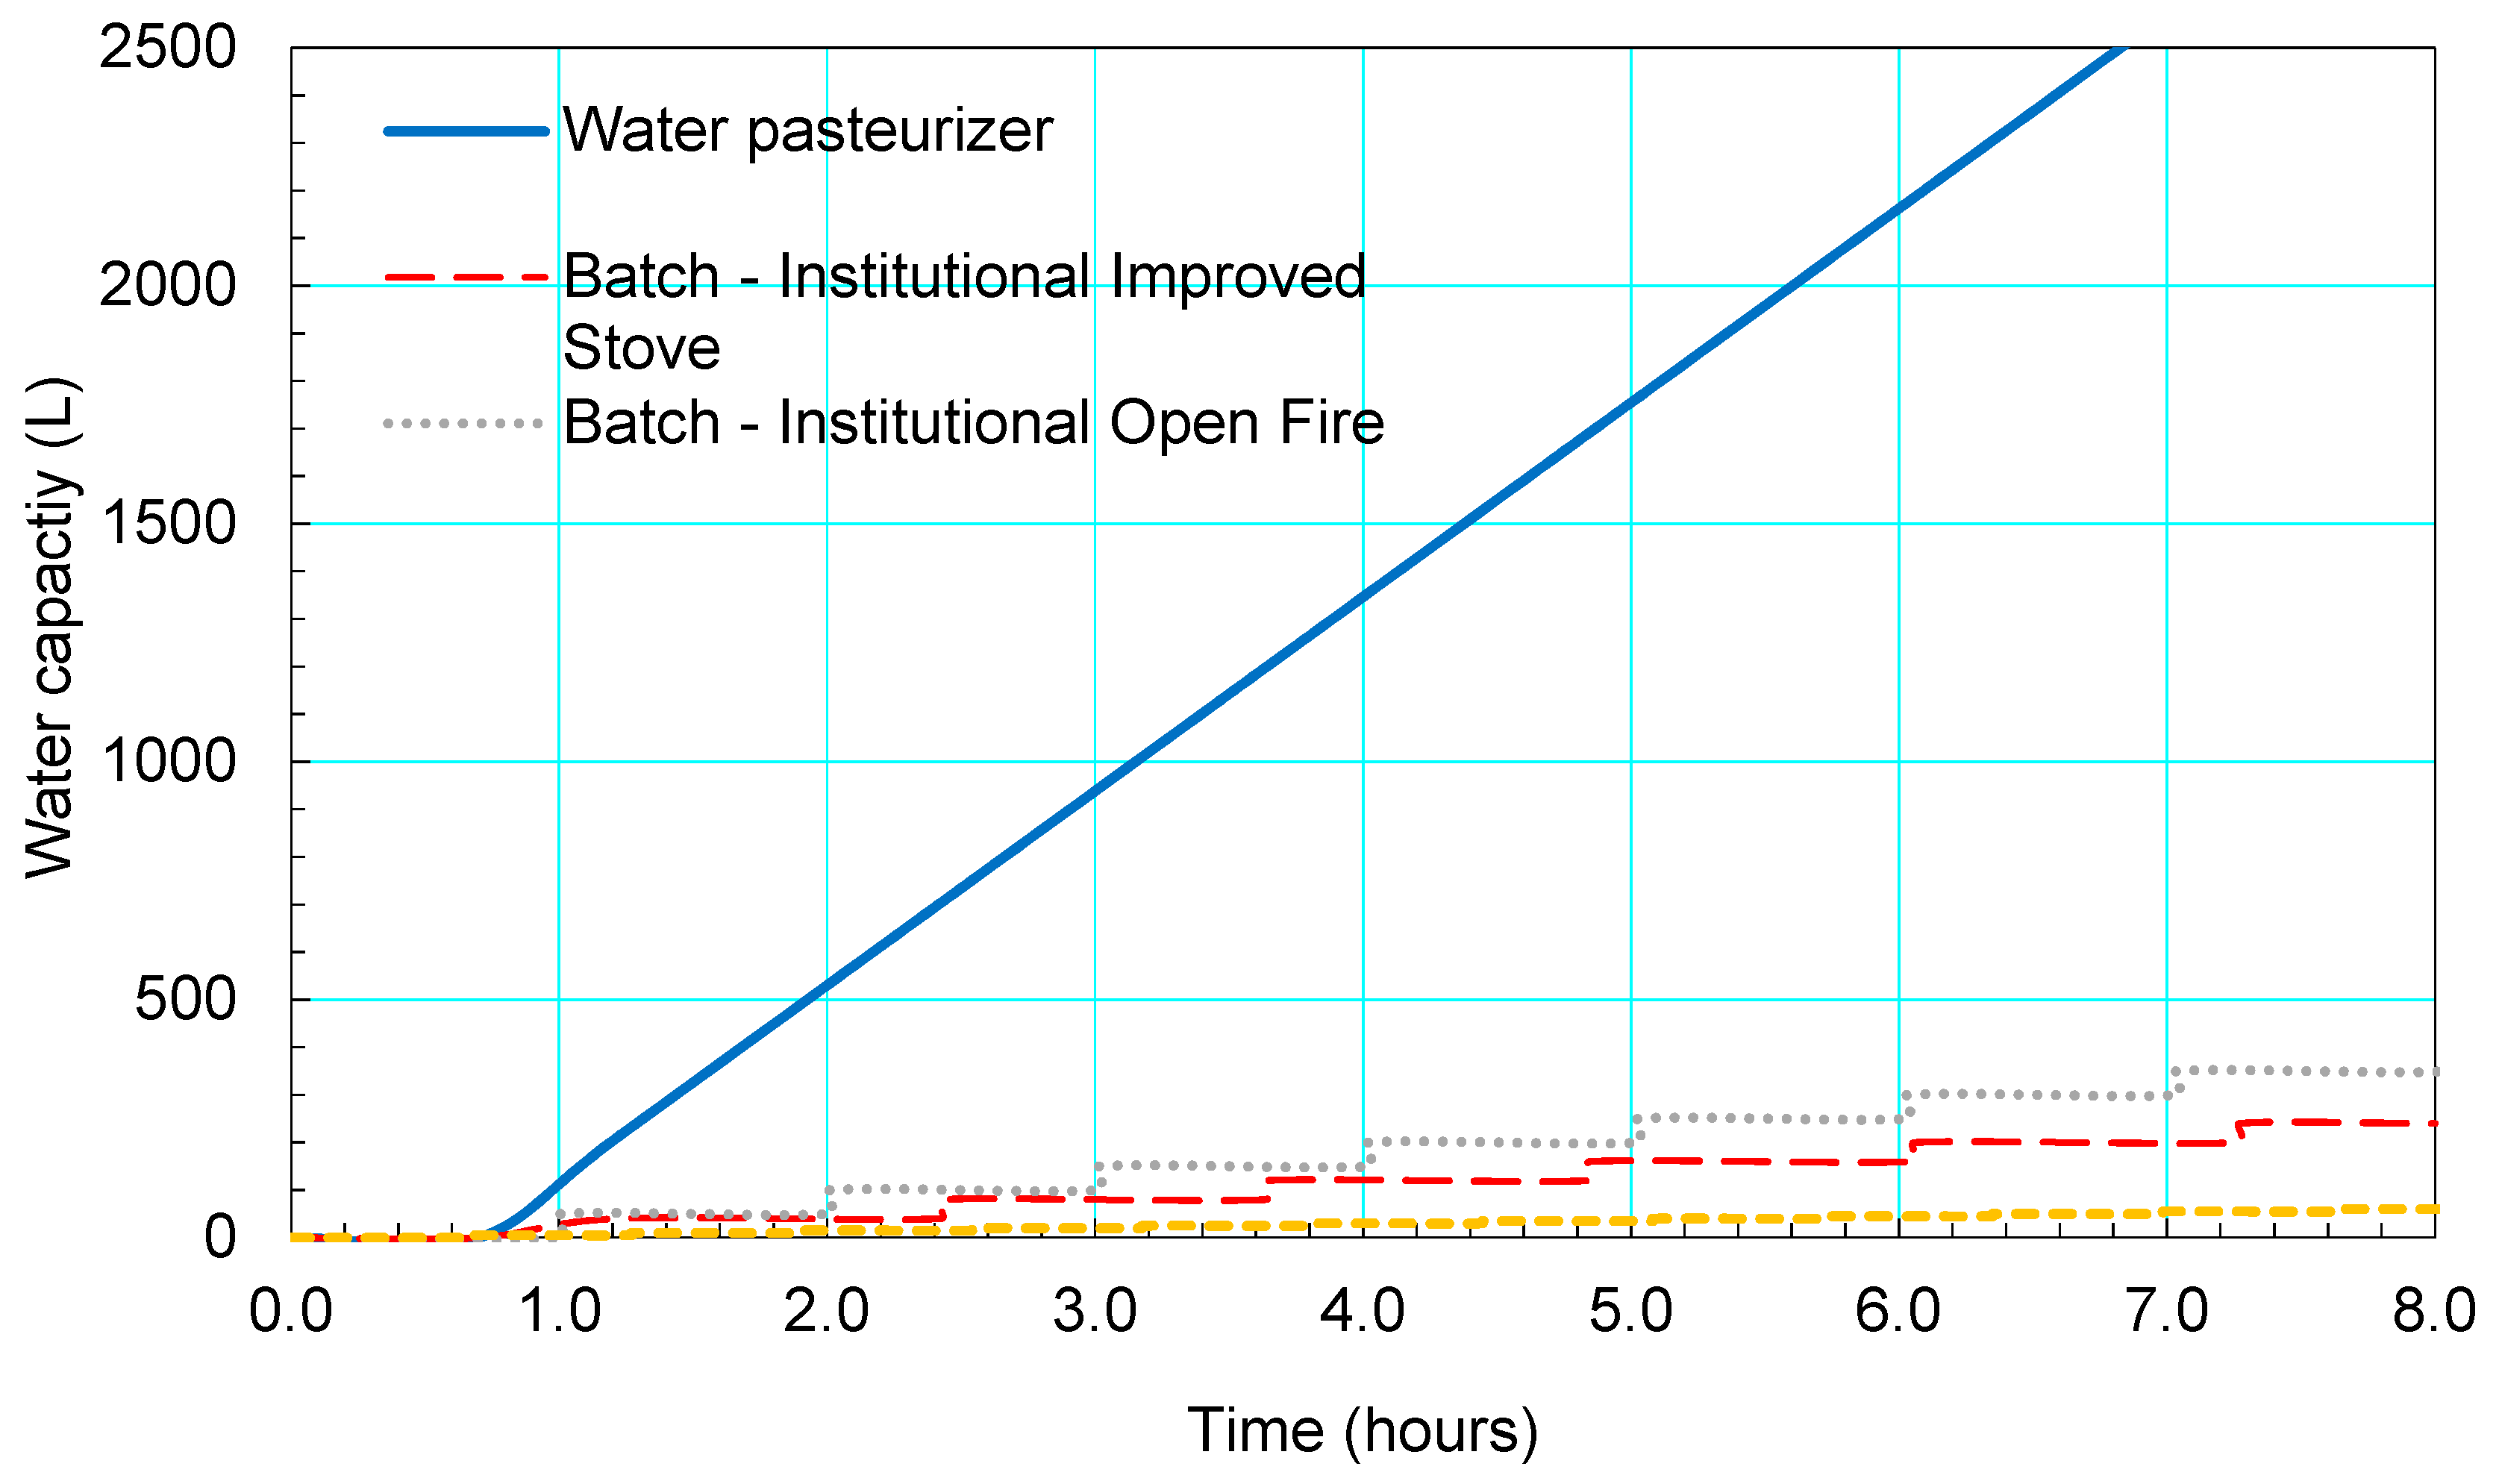
4.1. Comparison to Traditional Purification Methods

To assess capacity and fuel usage, the performance of the water pasteurizer is compared to three common biomass-powered water treatment processes, presented in Table 4. It should be noted that in all cases, kiln-dried Douglas fir was used as the testing fuel, which may not always be representative of real-world scenarios but is an acceptable measure within the cookstove literature [8]. The data used for benchmarking the water pasteurizer include:
(1)
batch-boiling a 50 L pot of water over the same heating element (data from [38]);
(2)
batch-boiling a 5 L pot of water over a household-sized open fire (data from [8]);
(3)
batch-boiling a 40 L pot of water over an institutional-sized open fire (data from [39]).
In 2016, the EPA evaluated the 60 L improved cookstove that used to heat the pasteurizer presented in this paper [38], following the Water Boiling Test (WBT) Version 4.2.3 [40] and the ISO International Workshop Agreement (IWA) 11-2012 Guidelines for Evaluating Cookstove Performance [41]. The results from the test found that the average equivalent dry fuel required to boil 40 L of water was 1.607 kg with a fuel burning rate of 22.2 g per min and a thermal efficiency of 55%.
Figure 10 compares the measured capacity of batch boiling over the traditional and improved cookstoves with the water pasteurizer. Due to the continuous nature of the water pasteurizer, the water capacity increases linearly while the batch boiling increases in a step function. Due to the continuous and rapid flow rate through the pasteurizer, relatively large volumes of water can be purified in a short time compared to any of the batch methods. Figure 11 compares the measured fuel usage of batch-boiling for various stove types against the water pasteurizer, showing relatively similar rates of fuel consumption for the pasteurizer and institutional open fire, despite significantly higher water production rates in the pasteurizer. To combine these two metrics, Figure 12 shows the fuel use per liter of treated water produced, highlighting how the longer the pasteurizer operates, the more efficient its rate of production becomes relative to other options.

4.2. Use of the Model to Inform Design and Operation

Flow rates above 5.5 L/min significantly increase the efficiency of the heat exchanger due to a turbulent flow, directly affecting the overall energy required per liter of water. Thus, it is recommended that the current system design be operated above 5.5 L/min to reduce the amount of firewood or other energy required to pasteurize a liter of water. If lower flow rates are expected, a different heat exchanger with smaller flow channels could be used to transition to turbulent flow at lower flow rates. As flow rates increase, however, the amount of total time the water spends at pasteurization temperature (71 °C) or higher decreases. To ensure at least a 6 log reduction in E. coli, flow rates through the system should not surpass 9 L/min with the current design, since there is only an automatic regulator for temperature, not flow rate. To ensure that the flow rate remains below 9 L/min, a flow regulator should be installed, or the water supply tank can be installed at a fixed height where the water pressure does not result in a flow rate greater than 9 L/min. To accommodate higher flowrates, the system should be redesigned with a larger kill chamber and a heating coil long enough to heat water to 71 °C.
Results also indicate that, for the present design, most of the time spent pasteurizing occurs in the heating coil, rather than the kill chamber, as shown in Figure 13. In an optimized and more robust design the coil should be designed such that it and the heat exchanger bring the water to pasteurization temperature so that the valve can open and activate, but then most of the pasteurizing time should occur after the regulating thermostatic valve in the kill chamber, rather than before it. This would ensure that, even at higher flow rates, sufficient pasteurization time could occur. Extending the kill chamber and shortening the heating coil will ensure that the valve is regulating the system in the appropriate location. This is especially important since the heat input cannot be easily mandated or regulated by users due to the inevitable variation in fire tending, while the geometry of system components can be. To improve the design, the thermostatic valve can be placed after a calculated length of coil designed such that water reaches 71 °C for just a few seconds upstream of the thermostatic valve (enough to account for slight flow rate fluctuations). Subsequently, the kill chamber would be designed to hold the water at a minimum of 15 s. Since the residence time in the coil and kill chamber is flow-rate-dependent, as shown in Figure 13, the product should be designed with a specific target flowrate (or range of flow rates) in mind. Note that Figure 13 does not account for potential fluctuation in flow rates.
The heat exchanger is a critical element of the system and has a direct impact on both performance and cost. The current model does not incorporate fouling on either side of the heat exchanger. In reality, significant fouling can be expected when processing contaminated water from sources such as surface water. In addition, since the heat exchanger is the most expensive component of the system, it is worthwhile to explore the effects of heat exchangers that are less expensive, whether they are less effective or of a shorter length. Both of these situations can be modeled as reductions in heat exchanger effectiveness on the cold and hot sides. Because heat transfer is a linear function of effectiveness, heating coil length will be inversely proportional to changes in effectiveness. Thus, the system should be designed with a margin of safety to ensure that the water does reliably reach pasteurization temperature even after fouling is present.
Finally, the strong correlation between the experimental and computational results suggests that the same methods could be used to model these or other design changes to assist with the improvement to the system.

5. Conclusions

With nearly 1.2 million people worldwide boiling their drinking water on a daily basis, improving the time and resource efficiency of this process has great potential to improve both human and environmental health. This study presented the thermal and microbiological performance of a biomass-powered water pasteurizer in comparison to the efficiency and capacity of other water boiling processes and suggested methods to optimize the current design. This work highlights the capability of biomass-powered systems to achieve pasteurization targets in low-cost, highly efficient, and accessible ways that may be more appropriate replacements for boiling than other methods, such as chemical or UV treatment. These improvements in pasteurization theory and technology can lead to decreased requirements for biomass resources and increased capacity for water purification.
This study focused on the performance of the water pasteurizer, however, future work should include evaluating the effects of other important water quality parameters, such as pH and total dissolved solids in the system. Additionally, work should be completed to understand the required maintenance and long-term usage effects on the technology and components, including how byproducts of incomplete combustion and interior scaling affect the overall performance and longevity. Strategies for product maintenance and availability of component replacement parts in regions where the water pasteurizer will be implemented are also necessary.

Supplementary Materials

The following are available online at https://www.mdpi.com/1996-1073/13/4/936/s1, Engineering Equation Solver code for the model.

Author Contributions

Conceptualization, G.B., N.M. (Nicholas Moses), T.N.-D., K.S. and N.M. (Nordica MacCarty); data curation, G.B.; formal analysis, G.B.; funding acquisition, K.S. and N.M. (Nordica MacCarty); investigation, G.B. and C.M.; methodology, G.B., C.M., N.M. (Nicholas Moses), T.N.-D. and N.M. (Nordica MacCarty); project administration, G.B. and N.M. (Nordica MacCarty); resources, N.M. (Nicholas Moses) and T.N.-D.; software, D.C.; Supervision, K.S. and N.M. (Nordica MacCarty); validation, G.B. and N.M. (Nicholas Moses); visualization, G.B.; writing—original draft, G.B. and N.M. (Nordica MacCarty); writing—review & editing, G.B., T.N.-D., K.S. and N.M. (Nordica MacCarty). All authors have read and agreed to the published version of the manuscript.

Funding

Funding for this project was provided by Oregon State University’s School of Mechanical, Industrial, and Manufacturing Engineering, Venturewell E-teams program, the Evans Family, InStove, and the Ogle Family.

Acknowledgments

The authors recognize Damon Ogle and Dale Andreatta as the original designers of this technology and thank them for their ongoing advice. The authors thank Fred Colgan and Damon Ogle from InStove for support with equipment and testing. The authors thank Ahmad Bukshaisha, Quao Chen, Joshua Johnson, and Elizabeth Andreyka for their participation in data collection at various stages of this project. The authors than Tom Carter for support and advice on bacterial and viral testing during the early stage of this project. The authors are grateful to David Blunck for use of his laboratory space and experimental testing advice.

Conflicts of Interest

The co-author Nicholas Moses has a conflict of interest due to his leadership in a company that manufactures the cookstove and pasteurizer system studied here. The funders had no role in the design of the study; in the collection, analyses, or interpretation of data; in the writing of the manuscript, or in the decision to publish the results.

Abbreviations

Nomenclature
Aarea
DTD value
Ddiameter
cpspecific heat at constant pressure
ffriction factor
h ¯ heat transfer coefficient
hheight
kthermal conductivity
m ˙ mass flow rate
mmass
Llength
Ppressure
Pperimeter
qheat
Rresistance
ttime
tthickness
Ttemperature
Uoverall heat transfer coefficient
Vmean velocity
xdistance
βthermal expansion coefficient
εheat exchanger effectiveness
NuNusselt number
PrPrandtl number
RaRayleigh number
Subscripts
atmatmospheric
ccold
condconduction
hhot
iinner
killkill by maintaining at required temperature for required time
oouter
ssurface
LMlog-mean
potstockpot

Appendix A. Heat Transfer Model

A one-dimensional steady-state heat transfer model was created in Engineering Equation Solver (EES) version 10 to determine the effects of inlet pressure, flow rate, temperature, and stockpot temperature on the time spent at 71 °C or above, required heat input, and outlet temperature. The schematic for the model is presented in the call-out box of Figure 1. The model accounts for an external heat source providing energy to the stockpot of hot water, a counter-flow heat exchanger (B), heat-up coil (C), and kill chamber (E). Each component was analyzed individually to establish the inputs, outputs, and equations needed for integration into the model of the whole system and related to the temperature profile through the system. The governing equations for each component were coded in subroutines that return output values based on specified input values. These subroutines are called by a main program, where the overall system parameters are defined. The computer program, ran through Engineering Equation Solver (EES), iterates until convergence occurs. The system parameters in the main program are then altered parametrically to simulate different environmental conditions corresponding to expected operational conditions.
The default model input values are based on the configuration of the current system design. The geometrical and standard operating variables for these are as shown in Table A1. The current heat exchanger for the system is the Duda Diesel compact counterflow plate heat exchanger model B3-36A.
Table A1. Baseline geometrical and system operational parameters.
Geometrical ParametersOperational Parameters
Do,coil12.7 mmElevation0 m
tcoil0.63 mmTpot80 °C
Lcoil15.24 mTin10 °C
Do,kill53.85 mmTpasteurize71 °C
tkill1.7 mm
Lkill0.305 m
The model is then used to simulate the effects that variation in these parameters, as well as input variables including volumetric flow rate of treatment water, water inlet temperature, atmospheric pressure, and pot water temperature, have on key output variables, including the required heat input to maintain the water in the pot at a constant temperature, indicating the energy required to pasteurize the water, and the total time the water is at or above 71 °C, indicating the success of pasteurization.

Appendix A.1. Overall System

Assuming no significant losses from evaporation or radiation, the energy balance for the entire system assumes that energy is transferred from the pot of water heated by the stove to heat the flowing water in the pasteurizer from the inlet temperature (T1) to the outlet temperature (T5) (Figure 1).
q p o t =   m ˙ c p ( T 5 T 1 )
Heat losses from the pot are neglected, since these are expected to be heavily dependent on the stove itself, and consideration of inefficiencies for different stoves is beyond the scope of this article. Rather, this analysis focuses solely on the useful heat requirements for the water pasteurizer. Evaporation has not been evaluated but is expected to be minor since minimal water loss from the pot was observed during experimental testing. Within the system, the heat supplied from the reservoir of water in the pot is divided between the heat-up coil ( q c o i l .), the kill chamber ( q k i l l c h ), and the nonadiabatic heat exchanger ( q a d d )
q p o t = q c o i l + q k i l l c h + q a d d
The total time that the water is at or above 71 °C is the sum of the time the water spends in the kill chamber ( t 71 ) and the time the water spends in the heat-up coil after reaching 71 °C ( t c o i l , 71 )
t 71 = t c o i l , 71 + t k i l l c h

Appendix A.2. Heat Exchanger

The heat exchanger was modeled using the effectiveness-number of transfer units (NTU) method. Because the heat exchanger is submerged in hot water (Tpot), and is therefore nonadiabatic, the exchanger was evaluated from the perspective of both the cold and hot sides. The actual heat gained between the cold side inlet ( T 1 ) and cold side outlet ( T 2 ) was modeled as the sum of the heat transferred from the hot-side ( q H ) and the additional heat gained from the pot ( q a d d ). Therefore, a state point 2a was added (Figure 1) to represent the point at which the cold side water reaches the temperature it would exit at if the exchanger was adiabatic. The dotted section of the cold side in Figure 1 represents an imaginary section of the heating coil into which q a d d is transferred. The cold-side temperature inlet ( T 1 ) is an input variable and the hot-side inlet temperature ( T 4 ) is equal to the temperature leaving the kill chamber. The heat exchanger effectiveness for both the hot and cold sides are input variables, where the effectiveness on the cold side is higher than the hot side due to the nonadiabatic condition. Effectiveness for both sides are characterized empirically as a function of volumetric flowrate in Section 3.2.
The heat transferred from the hot side to the cold side of the heat exchanger, q H , is based on the log mean temperature difference,
q h = U A Δ T L M
where the log mean temperature difference is defined as
Δ T L M = ( T 5 T 1 ) ( T 4 T 2 a ) ln ( T 5 T 1 T 4 T 2 a ) .
This heat transferred across the heat exchanger is applied toward heating the water on the cold-side to state point 2a
q h = m ˙ c p , c ( T 2 a T 1 ) .
Because the effectiveness of the cold-side is greater than that of the hot-side, the heat added from state point 1 and 2 is the sum of the heat across the heat exchanger and the additional heat from the pot
q c = q h + q a d d
where the heat added from the pot is defined as
q a d d = m ˙ c p ( T 2 T 2 a ) .
The heat effectiveness of the cold-side is defined as
ε c = q c q m a x
and the heat effectiveness of the hot-side is defined as
ε h = q h q m a x
where q m a x is the maximum possible heat transfer rate defined as
q m a x = C m i n ( T 4 T 1 )
and
C m i n = M I N ( m ˙ c p ) c   o r   h
to represent the side with the lowest heat capacity.

Appendix A.3. Heating Coil and Kill Chamber

The heating coil and kill chamber were each modeled as a single horizontal cylinder with free convection to the outside surface, conduction through the thickness of the pipe, and internal forced convection on the water flowing through the inside. A schematic of a segment is presented in Figure A1. The temperature of the outside surface of the pipe ( T s , o ) is modeled as natural convection from the temperature and pressure in the pot ( T p o t and P p o t , respectively). The heat transferred through the pipe is modeled as conduction through the wall thickness ( q c o n d ), followed by internal forced convection ( q f o r c e d c o n v . ) on the water flowing though the copper tubing at the specified mass flow rate ( m ˙ ). The heat-up coil is discretized into five segments of equal length and the temperature of each segment, T m , is calculated as the average of T i n and T o u t for each segment length. Each segment is treated as a tube with constant surface temperature for the internal forced convection.
Figure A1. Schematic of a segment of the heat-up coil and kill chamber used in the model.
Energies 13 00936 g0a1
In calculating the heat transfer from the water in the pot to the exterior of the heating coil, natural convection on a single horizontal tube is assumed. In actuality, the coil more resembles a bank of tubes, which would decrease the heat transfer of the lower coils due to the surrounding water cooling as it sinks. However, the pot itself is heated from the bottom and the sides, which would create an opposing effect, with hotter water on the bottom rising to the surface. Therefore, it is assumed that these two effects cancel each other out, and a single tube with natural convection is used to provide a median solution.
To determine the heat transfer into the tube in the heating coil, the heat transferred to the outer surface is determined with the Rayleigh and Nusselt number. The Nusselt number is defined by the Prandtl number according to the Churchill–Chu correlation for natural convection around an isothermal cylinder
N u ¯ o = [ 0.6 + 0.387 ( R a o ) 1 / 6 ( 1 + ( 0.559 Pr o   ) 9 / 16 ) 8 / 27   ] 2
and
N u ¯ o = h ¯ o D o k o
where k is the fluid thermal conductivity at the outer surface and
β = 1 T f
where T f is the fluid temperature at the outer surface.
The kill chamber surface is assumed to undergo forced convection at the average temperature between the water in the kill chamber and the surrounding pot
T s , o ( k i l l c h ) = T 3 + T p o t 2
Therefore, the heat transferred to the surface of the kill chamber and the coil is determined by
q = h ¯ o A s , o ( T p o t T s , o )
where A is the surface area. The inner surface temperature is determined based on conductive resistance from
q = T s , o T s , i R c o n d
where s refers to the surface and i and o refer to the inner and outer points, respectively, and
R c o n d = ln ( D o D i ) 2 π L k t
where Do and Di are the outer and inner diameters respectively, L is the axial length of the tube, and kt is the thermal conductivity of the tube material. The outlet temperature of the tube is calculated from
T s , i T o u t T s , i T i n = exp ( P L h ¯ m ˙ c p )
where P is the inner tube perimeter and h ¯ is the convective heat transfer coefficient. The convective heat transfer coefficient was determined from
N u D ¯ = h ¯ D i k f
where the Nusselt number is determined from the Gnielinski correlation for flow in circular tubes:
N u D ¯ = ( f 8 ) ( R e D 1000 ) P r 1 + 12.7 ( f 8 ) 1 2 ( P r 2 3 1 )
and the friction factor is determined from
f = ( 0.79 ln ( Re ) 1.64 ) 2
The heat transfer rate into the fluid in the tube is related to the change in temperature by
q = h ¯ P L Δ T L M
where the log mean temperature difference is defined as
Δ T L M = ( T s , i T o u t ) ( T s , i T i n ) ln ( T s , i T o u t T s , i T i n )
The time the water was at or above 71 °C is found from
t 71 = L 71 V
where V is the mean velocity in the tube and L 71 is the distance the water traveled while at or above 71 °C. For the kill chamber, the water enters above the minimum temperature, so this distance is the length of the chamber. In the heat-up coil, this distance is the difference between the coil length and the location where the water reaches 71 °C, found by substituting x for L and 71 °C for Tout:
T s , i 71 T s , i T i n = exp ( P x 71 h ¯ m ˙ c p )

References

  1. Burch, J.D.; Thomas, K.E. Water disinfection for developing countries and potential for solar thermal pasteurization. Sol. Energy 1998, 64, 87–97. [Google Scholar] [CrossRef]
  2. WHO. Progress on Household Drinking Water, Sanitation and Hygiene 2000–2017: Special Focus on Inequalities. 2019. Available online: https://washdata.org/reports (accessed on 9 June 2018).
  3. Ojomo, E.; Elliott, M.; Goodyear, L.; Forson, M.; Bartram, J. Sustainability and scale-up of household water treatment and safe storage practices: Enablers and barriers to effective implementation. Int. J. Hyg. Environ. Health 2015, 218, 704–713. [Google Scholar] [CrossRef] [PubMed] [Green Version]
  4. WHO. Household Water Treatment and Safe Storage Technologies. 2007. Available online: http://www.wpro.who.int/environmental_health/documents/docs/Household_Water_Treatment_Safe_Storage_PARTICIPANT.pdf (accessed on 9 June 2018).
  5. WHO. Guidelines for Drinking-Water Quality: Fourth Edition Incorporating the First Addendum; World Health Organ: Geneva, Switzerland, 2017. [Google Scholar]
  6. Macdougall, P.; Milburn, M.P. Using solar energy to treat microbiologically contaminated water: A multidisciplinary approach to public health and aboriginal science education. Environ. Health Rev. 2004, 38–43. [Google Scholar]
  7. Okpara, C.G.; Oparaku, N.F.; Ibeto, C.N. An overview of water disinfection in developing countries and potentials of renewable energy. J. Environ. Sci. Technol. 2011, 4, 18–30. [Google Scholar] [CrossRef] [Green Version]
  8. MacCarty, N.; Still, D.; Ogle, D. Fuel use and emissions performance of fifty cooking stoves in the laboratory and related benchmarks of performance. Energy Sustain. Dev. 2010, 14, 161–171. [Google Scholar] [CrossRef]
  9. Olago, D.; Marshall, M.; Wandiga, S.O. Climatic, socio-economic, and health factors affecting human vulnerability to cholera in the Lake Victoria basin. East Africa Ambio 2007, 36, 350–358. [Google Scholar] [CrossRef]
  10. Psutka, R.; Peletz, R.; Michelo, S.; Kelly, P.; Clasen, T. Assessing the microbiological performance and potential cost of boiling drinking water in urban Zambia. Environ. Sci. Technol. 2011, 45, 6095–6101. [Google Scholar] [CrossRef] [Green Version]
  11. Hornsey, I.S. The History of Beer and Brewing; Royal Society of Chemistry: London, UK, 2004. [Google Scholar]
  12. Madigan, M.T.; Martinko, J.M.; Stahl, D.A.; Clark, D.P. Brock Biology of Microorganisms; Benjamin Cummings: San Fransisco, CA, USA, 2012. [Google Scholar] [CrossRef]
  13. Ray, C. Drinking Water Treatment Focusing on Appropriate Technology and Sustainability; Springer Publishing Company: Berlin/Heidelberg, Germany, 2011. [Google Scholar]
  14. Spinks, A.T.; Dunstan, R.H.; Harrison, T.; Coombes, P.; Kuczera, G. Thermal inactivation of water-borne pathogenic and indicator bacteria at sub-boiling temperatures. Water Res. 2006, 40, 1326–1332. [Google Scholar] [CrossRef]
  15. Osaili, T.; Griffis, C.L.; Martin, E.M.; Beard, B.L.; Keener, A.; Marcy, J.A. Thermal inactivation studies of Escherichia coli O157:H7, Salmonella, and Listeria monocytogenes in ready-to-eat chicken-fried beef patties. J. Food Prot. 2006, 69, 1080–1086. [Google Scholar] [CrossRef]
  16. Thermal Inactivation of Viruses. 1977. Available online: http://www.dtic.mil/dtic/tr/fulltext/u2/a048068.pdf (accessed on 9 June 2018).
  17. WHO. Technical Brief: Boil Water. 2011. Available online: http://www.who.int/water_sanitation_health/dwq/Boiling_water_01_15.pdf (accessed on 9 June 2018).
  18. Harp, J.A.; Fayer, R.; Pesch, B.A.; Jackson, G. Effect of pasteurization on infectivity of Cryptosporidium parvum oocysts in water and milk. Appl. Environ. Microbiol. 1996, 62, 2866–2868. [Google Scholar] [CrossRef] [Green Version]
  19. Laurent, P. Household Drinking Water Systems and Their Impact on People with Weakened Immunity, World Health Organ. 2005. Available online: http://www.who.int/household_water/research/HWTS_impacts_on_weakened_immunity.pdf (accessed on 9 June 2018).
  20. Kim, B.R.; Anderson, J.E.; Mueller, S.A.; Gaines, W.A.; Kendall, A.M. Literature review—Efficacy of various disinfectants against Legionella in water systems. Water Res. 2002, 36, 4433–4444. [Google Scholar] [CrossRef]
  21. Lin, Y.E.; Stout, J.E.; Yu, V.L.; Vidic, R.D. Disinfection of water distribution systems for Legionella. Semin. Respir. Infect. 1998, 13, 147–159. [Google Scholar] [PubMed]
  22. Thirugnanasambandam, M.; Iniyan, S.; Goic, R. A review of solar thermal technologies. Renew. Sustain. Energy Rev. 2010, 14, 312–322. [Google Scholar] [CrossRef]
  23. Islam, M.F.; Johnston, R.B. Household pasteurization of drinking water: The Chulli Water-Treatment System. J. Health Popul. Nutr. 2006, 24, 356–362. [Google Scholar]
  24. Gupta, S.K.; Islam, M.S.; Johnston, R.; Ram, P.K.; Luby, S.P. The Chulli Water Purifier: Acceptability and effectiveness of an innovative strategy for household water treatment in Bangladesh. Am. J. Trop. Med. Hyg. 2008, 78, 979–984. [Google Scholar] [CrossRef] [Green Version]
  25. Stauber, C.E.; Elliott, M.A.; Koksal, F.; Ortiz, G.M.; DiGiano, F.A.; Sobsey, M.D. Characterisation of the biosand filter for E. coli reductions from household drinking water under controlled laboratory and field use conditions. Water Sci. Technol. 2006, 54, 1. [Google Scholar] [CrossRef] [Green Version]
  26. Stauber, C.E.; Ortiz, G.M.; Loomis, D.P.; Sobsey, M.D. A randomized controlled trial of the concrete biosand filter and its impact on diarrheal disease in Bonao, Dominican Republic. Am. J. Trop. Med. Hyg. 2009, 80, 286–293. [Google Scholar] [CrossRef]
  27. Kikkawa, I. Modification of a Biosand Filter in the Northern Region of Ghana. Master’s Thesis, Massachusetts Institute of Technology, Cambridge, MA, USA, 2008. [Google Scholar]
  28. Duke, W.F.; Nordin, R.N.; Baker, D.; Mazumder, A. The use and performance of BioSand filters in the Artibonite Valley of Haiti: A field study of 107 households. Rural Remote Health 2006, 6, 570. [Google Scholar]
  29. Ngai, T.K.K.; Coff, B.; Baker, D.; Lentz, R. Global Review of the Adoption, Use, and Performance of the Biosand Filter. In Progess in Slow Sand and Alternative Biofiltration Processes; Nakamoto, N., Graham, N., Collins, M.R., Gimbel, R., Eds.; IWA Publishing: London, UK, 2014; pp. 309–317. [Google Scholar]
  30. Loo, S.-L.; Fane, A.G.; Krantz, W.B.; Lim, T.-T. Emergency water supply: A review of potential technologies and selection criteria. Water Res. 2012, 46, 3125–3151. [Google Scholar] [CrossRef]
  31. Thompson, M. A critical review of water purification technology appropriate for developing countries: Northern Ghana as a case study. Desalin. Water Treat. 2015, 54, 3487–3493. [Google Scholar] [CrossRef]
  32. Sobsey, M.D.; Stauber, C.E.; Casanova, L.M.; Brown, J.M.; Elliott, M.A. Point of use household drinking water filtration: A practical, effective solution for providing sustained access to safe drinking water in the developing world. Environ. Sci. Technol. 2008, 42, 4261–4267. [Google Scholar] [CrossRef] [PubMed]
  33. Bergman, T.L.; Lavine, A.S.; Incropera, F.P.; DeWitt, D.P. Fundamentals of Heat and Mass Transfer, 7th ed.; Wiley: Hoboken, NJ, USA, 2011. [Google Scholar]
  34. MacCarty, N.; Burleson, G.; Moses, N.; Johnson, J.; Andreyka, E.; Ogle, D.; Colgan, F.; Creighton, A.; Carter, T.; Andreatta, D. Design and testing of a high-efficiency rapid throughput community-scale water pasteurization system. In Proceedings of the ASME 2017 International Design Engineering Technical Conferences and Computers and Information in Engineering Conference, Cleveland, OH, USA, 6–9 August 2017. [Google Scholar]
  35. Cheremisinoff, N. Properties of Wood: Wood for Energy Production; Ann Arbor Science Publishers: Ann Arbor, MI, USA, 1980. [Google Scholar]
  36. US-EPA. National Primary Drinking Water Regulations. 2018. Available online: https://www.epa.gov/ground-water-and-drinking-water/national-primary-drinking-water-regulations (accessed on 9 Jun 2018).
  37. WHO. Guidelines for Drinking-Water Quality, 4th ed.; WHO: Geneva, Switzerland, 2017; pp. 117–153. ISBN 978 92 4 154815 1. [Google Scholar]
  38. Jetter, J.; Ebersviller, S.; Williams, C.; Faircloth, J. Test Report: InStove 60-Liter Institutional Stove with Wood Fuel, U.S Environ. prot. Agency. 2016. Available online: http://www.instove.org/sites/default/files/InStove%25test%25report.pdf (accessed on 9 June 2018).
  39. Burleson, G.; Tilt, B.; Sharp, K.; MacCarty, N. Reinventing boiling: A rapid ethnographic and engineering evaluation of a high-efficiency thermal water treatment technology in Uganda. Energy Res. Soc. Sci. 2019, 52, 68–77. [Google Scholar] [CrossRef]
  40. Global Alliance for Clean Cookstoves. The Water Boiling Test Version 4.2.3. 2014. Available online: http://cleancookstoves.org/technology-and-fuels/testing/protocols.html (accessed on 9 June 2018).
  41. International Organization for Standardization. International Workshop Agreement 11: 2012 Guidelines for Evaluating Cookstove Performance, IWA 11 2012. Available online: http://www.iso.org/iso/catalogue_detail?csnumber=61975 (accessed on 9 June 2018).
Figure 1. The water pasteurizer installed in the 60 L stock pot of an institutional cookstove.
Energies 13 00936 g001
Figure 2. Schematic of the water pasteurizer inserted into a 60 L stove, highlighting key components including (A) water inlet, (B) counter flow heat exchanger, (C) heat-up coil, (D) thermostatic valve, (E) kill chamber, and (F) water outlet. Black arrows represent water flow, white arrows represent combustion gas flow, and Tn represents temperatures at various locations.
Energies 13 00936 g002
Figure 3. System schematic and sensor placement.
Energies 13 00936 g003
Figure 4. Heat exchanger effectiveness at different flow rates, with experimental uncertainty.
Energies 13 00936 g004
Figure 5. Heat exchanger effectiveness as a function of flow rate.
Energies 13 00936 g005
Figure 6. Treated water temperature profile as a function of duration of time in the system for Tin = 9.7 °C, Tpot = 80.6 °C, and m ˙ = 6.43 L/min. State points are (1) cold-side heat exchanger inlet, (2) heating coil entrance, (3) kill chamber entrance, (4) hot-side heat exchanger inlet, (5) system outlet. Experimental temperature measurements are shown in red, with error bars indicating manufacturer specified accuracy and precision for sensors and DAQ. Where multiple instruments are used for a single measurement, the Kline–McClintock method is used to combine the uncertainties into a single value.
Energies 13 00936 g006
Figure 7. Heat required as a function of volumetric flow rate for Tpot = 80 °C and three different water inlet temperatures (Tin=5 °C, 15 °C, and 25 °C).
Energies 13 00936 g007
Figure 8. Energy use per liter of treated water as a function of volumetric flow rate for Tpot = 80 °C and three different water inlet temperatures (Tin = 5 °C, 15 °C, and 25 °C).
Energies 13 00936 g008
Figure 9. Time spent at or above 71 °C in the heat-up coil, kill chamber, and in total as a function of volumetric flow rate at sea level, Tin = 5 °C, and Tpot = 80 °C. Dotted line at 15 s indicates the minimum time required for pasteurization to occur.
Energies 13 00936 g009
Figure 10. Water treatment capacity of the water pasteurizer compared to batch-boiling over traditional and improved household and institutional cookstoves.
Energies 13 00936 g010
Figure 11. Total fuel used (dry-wood equivalent) during operation of the water pasteurizer compared to batch-boiling over traditional and improved household and institutional cookstoves.
Energies 13 00936 g011
Figure 12. Total fuel used (dry-wood equivalent) per liter of treated water for the water pasteurizer compared to batch-boiling over traditional and improved household and institutional cookstoves.
Energies 13 00936 g012
Figure 13. Minimum coil (Do = 12.7 mm) and kill chamber (Do,kill = 53.9 mm) lengths at varying flow rates required to achieve t≥71 = 15 s as a function of flow rate (at standard sea level with Tpot = 80 °C and Tin = 15 °C).
Energies 13 00936 g013
Table 1. Comparison of water treatment methods for low-resource contexts [33].
Method.AdvantagesDisadvantagesCost
FiltrationVarious types and sizes (sand, charcoal, ceramic, etc.); effective in many geographic or weather conditionsProne to failure due to lack of maintenance; some types lack indicator; some require chlorination; risk of recontamination>$0.001/L
ChlorinationEasy to use; lowers risk of recontamination; effective in any geographic or weather conditionRequires precise does; requires ongoing supply of chlorine; distasteful; can be effected by turbidity; lacks indicator>$0.001/L
Solar UV TreatmentReusable; typically portable; minimal maintenance requiredRequires indicator; requires sufficient sunlight; relatively slow; water must be cooled to usable temperatures; risk of recontamination>$0.001/L
BoilingAccessible; visual indicator; effective in many geographic or weather conditionsHigh energy use; high emissions; water must be cooled to usable temperatures; timely; risk of recontamination>$0.10/L
Solar PasteurizationReusable; sustainableRequires indicator; requires sufficient sunlight; relatively slow; low capacity; risk of recontamination<$0.001/L
Biomass PasteurizationEfficient use of local resources; large capacity; effective in many geographic or weather conditions; high flowrateRequires indicator; risk of recontamination<$0.01/L
Table 2. Parameters, equations, measurements, and sensors used in the experiment.
ParametersEquationsValues MeasuredSensors Used
Heat exchanger effectiveness ( ε ) ε = Δ T H   o r   C T H i T C i HX cold inlet temp
HX cold outlet temp
HX hot inlet temp
HX hot outlet temp
Type-K thermocouples
Flow rate ( m ˙ ) m ˙ = m w t Mass of water, timeHanging scale, stopwatch
Pressure dropDirectly measured Differential pressureDifferential pressure transducer
Supplied head h e a d = h i n h o u t Supply water level height,
Outlet hose exit height
Measuring tape
Table 3. Difference between experimental and predicted temperature values at six different flow rates.
Flow Rate (L/min)Texperimental−Tpredicted at Each Location (°C)
12345
2.200.00−0.200.50−0.30−0.13
3.610.500.631.640.640.63
6.060.30−0.340.17−0.630.06
6.430.30−0.260.67−0.230.27
6.200.402.801.190.29−1.70
5.480.201.031.901.100.52
Table 4. Comparison of fuel efficiency and output rate for various heat sources.
StoveVolume (L)Time (min)Fuel (kg)Ref.
Household Open Fire538.11.1[8]
Institutional Open Fire5060.32.4[39]
Institutional Improved Stove4072.71.6[38]

