Article

Separation of BTX Fraction from Reservoir Brines by Sorption onto Hydrophobized Biomass in a Fixed-Bed-Column System

1
AGH University of Science and Technology; Drilling, Oil and Gas Faculty, al. Mickiewicza 30, 30-059 Krakow, Poland
2
Cracow University of Technology, Faculty of Chemical Engineering and Technology, ul. Warszawska 24, 31-155 Krakow, Poland
*
Author to whom correspondence should be addressed.
Energies 2020, 13(5), 1064; https://doi.org/10.3390/en13051064
Submission received: 24 January 2020 / Revised: 22 February 2020 / Accepted: 24 February 2020 / Published: 1 March 2020
(This article belongs to the Section B: Energy and Environment)

Abstract

:
Oily brine from the gas and oil industries remains the most difficult wastewater to treat due to its complex chemical composition, which includes aromatic hydrocarbons. Even at low concentrations, the presence of BTX (benzene, toluene, xylenes) can be extremely harmful to aquatic ecosystems. Fixed-bed adsorption columns are recommended for oily water treatment due to their flexibility and easy operation. In this research, pine sawdust modified with polydimethysiloxane (PDMS) and hydrophobic nanosilica was applied as a sorbent in a filtration system. The surface modification of raw fiber allowed to change its morphology and increase the roughness of it. The Yoon–Nelson, Bohart–Adams, Clark, and Belter models were applied to simulate continuous biosorption. The Bohart–Adams model strongly correlated with the experimental data and described the whole dynamic behavior of the column. The effect of feed flow rate (10–50 mL/min) on breakthrough characteristics was determined. Both the breakthrough and saturation time decreased as the flow rate increased. This study indicated that hydrophobized pine sawdust is an effective low-cost potential biosorbent for the removal of BTX fraction from produced water in continuous column mode.

1. Introduction

Production of reservoir brines is one of the major concerns in the gas and oil industry. The quantity of water extracted depends mainly on the type of reservoir and the degree of its depletion. Their volume can be up to eight times greater than the amount of crude oil produced by an individual hydrocarbon field. Proper management of oilfield waters is often difficult because they often have high salinity and high hydrocarbon content. The environmental effects determine the economy and the performance of fossil fuel production. The salinity of most produced waters is higher than that of seawater [1,2,3]. Alley et al. [1] performed a meta-analysis of the characteristics of produced water based on 165 oilfield, 137 tight gas sand, 4000 natural gas, and 541 shale gas records. According to Alley et al. the majority of produced brines from oil reservoirs contain chloride concentrations ranging from saline (>30 g/L) to hypersaline (up to 238.5 g/L). The concentration of total oil in produced waters (measured by IR spectroscopy) is usually between 2 and 565 mg/L [1], while the concentration of different types of hydrocarbons varies greatly. Stewart and Arnold [4] reported that for a proper design of produced water treatment systems an oil concentration of 1000–2000 mg/L may be assumed. Waters in contact with crude oil and/or natural gas in a reservoir capture selected components from it. These are mainly hydrocarbons, organic compounds containing sulfur, oxygen, and nitrogen heteroatoms, as well as resins and asphaltenes. The physicochemical properties of all these compounds differ significantly and can be in both dissolved and dispersed form in water [5]. By gas chromatography with mass spectrometry detection, Khan et al. isolated over 1400 petroleum compounds in reservoir waters from the Permian Basin (USA). According to these studies, the most-represented groups of chemical compounds are n-alkanes, cycloalkanes, BTEX (benzene, toluene, ethylbenzene, xylenes), alkylbenzenes, and naphthalenes [6]. On the other hand, Tellez et al. reported that 90% of all hydrocarbons present in reservoir waters are C10-C30 n-alkanes [7]. The BTEX fraction constitutes ca. 2%–3% of all petroleum derivatives found in reservoir waters [8]. Fillo et al. reported that the produced waters from gas production processes have higher levels of BTEX than waters from oil production [9]. Despite the fact that the BTEX content in reservoir waters is not high, the presence of these chemical compounds is a problem due to their toxicity. Benzene is classified by ATSDR (Agency for Toxic Substances and Disease Registry) as one of the 10 most hazardous substances (benzene is the sixth on the list, 2017) [10]. On the same list, xylenes (total) and toluene occupy positions 64 and 74, respectively.
Due to the increasing amount of produced oilfield waters, their proper purification becomes crucial from the point of view of rational management of hydrocarbon reservoirs. There are many technologies available to effectively separate solid particles, but the removal of petroleum compounds from water is still a challenge. In regular surface facilities, several different technologies are usually combined. Preliminary gravitational separation allows to separate solid particles and free oil. Filtration, flotation, coalescing on filters, and membrane techniques (microfiltration and ultrafiltration) are used for emulsion breaking, i.e., to remove dispersed oil. The final stage is the removal of microemulsions and dissolved hydrocarbons by evaporation, reverse osmosis, and/or adsorption beds [11,12,13]. In industrial practice, adsorption in filtration columns is quite commonly used as the polishing step due to its good efficiency and low operating costs. Classic filters based on the sieve effect are used to remove solid particles and large droplets of oil from water. Hydrocarbons present in water in finely dispersed and dissolved forms are removed by means of adsorption beds. It is assumed that the efficiency of removing suspensions and petroleum derivatives with this technique can be over 90% [14]. The most popular adsorbent of organic pollutants is activated carbon with excellent sorption properties, which are the result of a well-developed specific surface area, that often exceeds 2000 m2/g [15]. The sorption capacity of carbon materials depends heavily on their preparation. For example, Kayvani et al. showed that carbon nanotubes sorb about 7 g of petroleum derivatives per 1 g of sorbent [16]; Elkady et al. showed that soot activated by KOH/ZnCl2 sorbs 28.3 g/g [17], and Han et al. confirmed that carbon aerogels sorb up to 59 g/g [18].
Nowadays, plant fibers are increasingly used as adsorbent for the removal of hydrocarbons from reservoir waters due to their biodegradability, low purchase costs, diversity, and availability. Walnut shell filters have been used in the petroleum industry for many years [19,20]. US Filter Corporation (Auto-ShellTM filters) is a large supplier of this type of beds. Despite a low sorption capacity of ca. 1 g of oil per 1g of sorbent [21], the material is effective in removing hydrocarbons, as was confirmed by Rawlins et al. [22]. Several authors have reported the application of a continuous column packed with different types of plant fibers for the treatment of BTX (benzene, toluene, xylenes)-contaminated wastewater. Excellent sorption properties of plant kapok have been confirmed by many researchers [23,24,25], which has contributed to the frequent use of this plant as filtration layers. The sorption efficiency of petroleum substances by other plant fibers i.e., cattail fiber, Salvinia sp., wood chip, rice husk, coconut husk, and bagasse, has also been extensively studied [26]. Gallo-Cordova et al. [27] compared the effectiveness of filters made of various types of biomass, including walnut shells, oil palm shells, orange shells, banana peels, passion fruit shells, cocoa beans, and sawdust. Ribeiro et al. [28] compared the efficiency of Salvinia sp. and peat fiber filters. Dried hydrophobic aquaphyte removed up to 90% of oil from oil/water emulsions. El-Sayed et al. [29] showed that thin films of amorphous carbon (ACTF) prepared from wood sawdust can be effectively utilized to remove oil from synthetic produced water in a fixed-bed column system. Further research by Fathy et al. confirmed the high separation efficiency of ACTF prepared from oil palm leaves in condensate oil removal from produced water using a fixed-bed method [30]. Cambiella et al. [31] used eucalyptus sawdust mixed with gypsum (CaSO4 * 2H2O) as a filter layer; more than 99% of oil content in the influent stream was removed. The sorption capacity and selectivity of sawdust can be improved by increasing the surface hydrophobicity. Ismail et al. [32,33] obtained an effective sorbent for oil spill cleanup by esterification of sawdust with oleic acid. Hussein et al. [34] improved the sorption capacity of acid treated sawdust to 4.82 g/g. Results reported by other researchers confirm that the use of sawdust is feasible in the treatment of oily wastewater. Hence, in this study a sawdust-based sorbent for removal of BTX from model reservoir brine was developed: a simple spray-coating method using polydimethylsiloxane as a coupling agent and hydrophobic nanosilica was applied to modify the fiber surface morphology. The present study was focused on evaluating the performance of as-prepared sawdust in the removal of BTX from wastewater in a fixed-bed reactor under different feed flow rates.

2. Materials and Methods

2.1. Materials

Pine sawdust supplied by a local supplier was used to prepare the filter bed. Commercial nanosilica produced by PlasmaChem GmbH was applied to modify these natural plant fibers. Basic properties of nanopowder based on the specification provided by the manufacturer: colloidal, hydrophobic silica, surface modified with PDMS (polydimethylsiloxane), average particle size—14 nm, specific surface area—100 m2/g, bulk density—0.05 g/cm3, purity > 99.8 (excluding stabilizers).
A sample of Polish crude oil from Małopolska oil province and NaCl (pure, Avantor Performance Materials Poland S.A.) were used to prepare the reservoir water models.

2.2. Methods

2.2.1. Preparation of Hydrophobized Plant Fibers

The pine sawdust was washed with distilled water to remove impurities (e.g., dust, dyes) and dried for 24 h in an oven at 30 °C. The resulting material was sieved to obtain targeted sample size of 2–10.0 mm. The preparation of hydrophobized plant fibers was in accordance with the scheme in the Figure 1.
The first step was to prepare appropriate fluids i.e., a solution of 10% polydimethylsiloxane in n-pentane (both purchased from Sigma Aldrich) and a colloidal solution of silica dispersed in alcohol (10 g of PDMS-modified nano-SiO2 per 100 mL of pure ethanol 98%). The next step was surface hydrophobization of raw pine sawdust by spraying 10 g of fiber with 10 mL of 10% polydimethylsiloxane in n-pentane and subsequently with 25 mL of nanosilica dispersion. In the last step the resulting product was dried for 6 h at 40 °C.
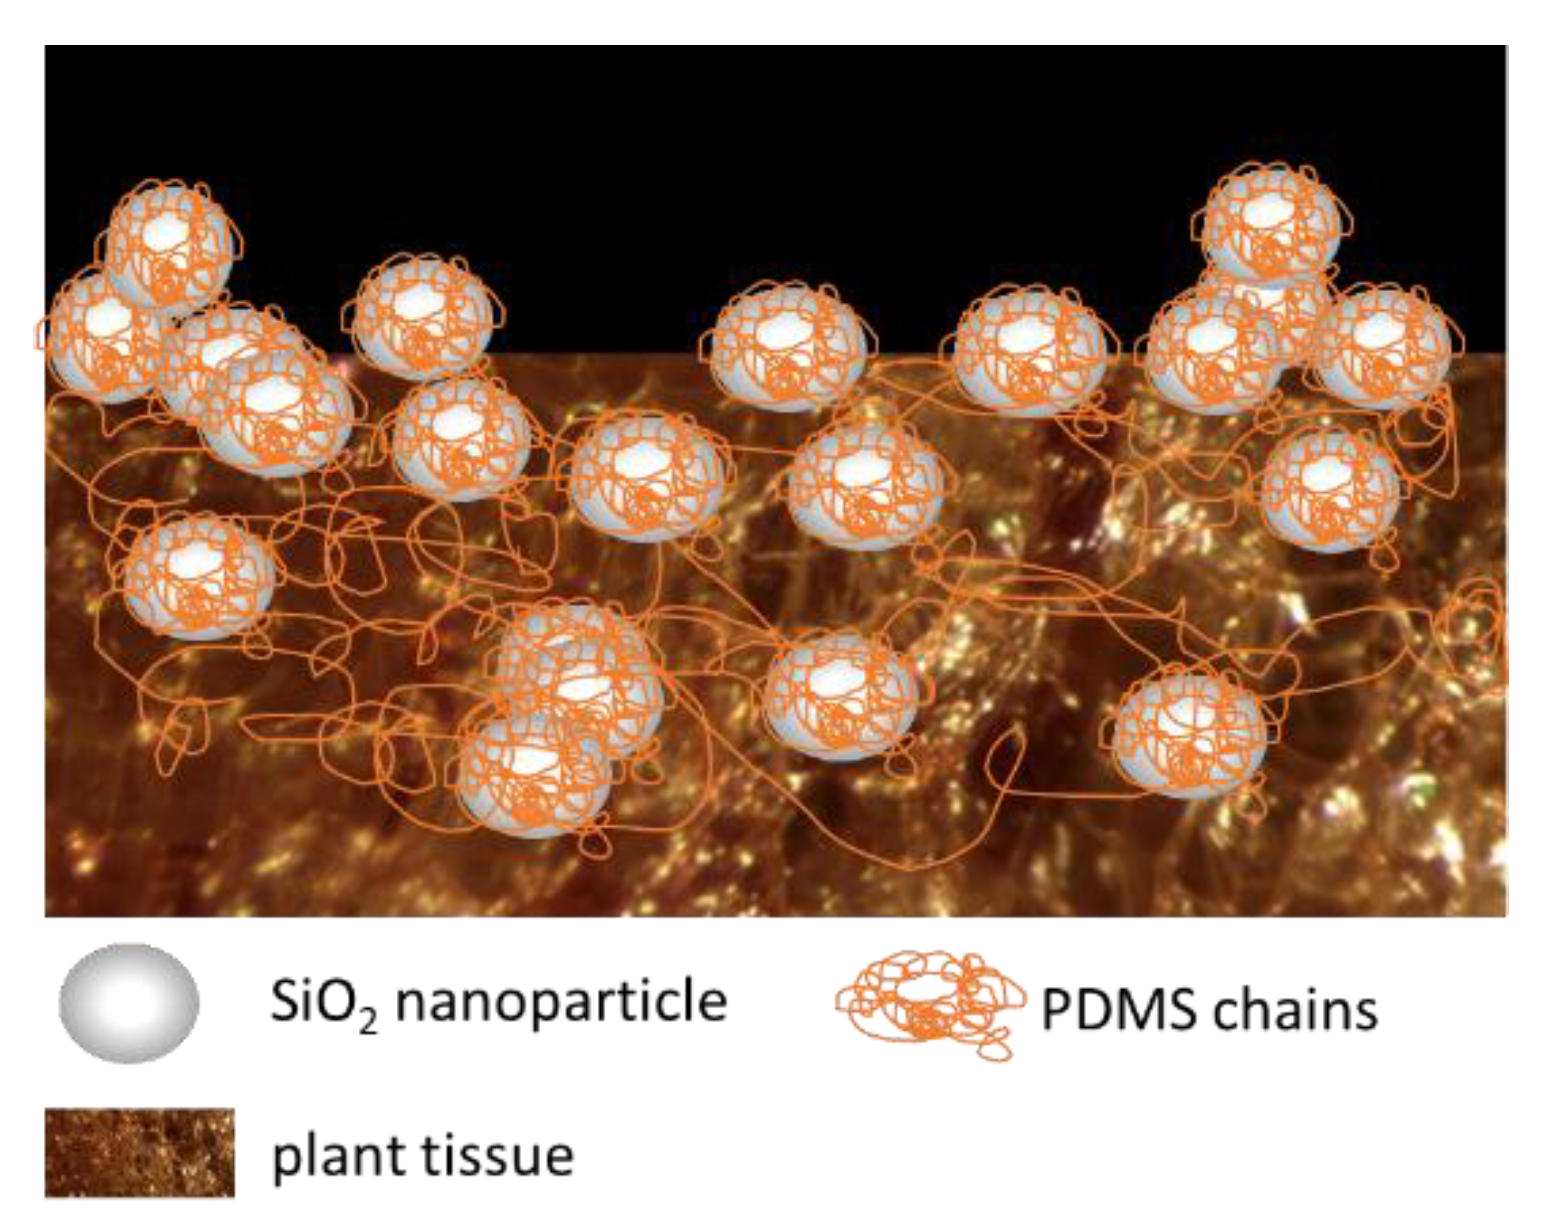
Polydimethysiloxane was used to modify surface wettability from hydrophilic to hydrophobic. Numerous PDMS-coated fibers were reported as promising absorbents for oil spill removal due to their hydrophobicity and selectivity towards hydrocarbons. PDMS forms a thin and sticky layer on the fiber surface and acts as an adhesive (coupling) agent between biomass and nanoparticles. Nanosilica was immobilized on the surface in the second step of synthesis to increase surface specific area and roughness. Between all used compounds (sawdust, PDMS, and nanopowder) some non-covalent interactions may occur including van der Waals forces and hydrogen bonding. Figure 2 shows the visualization of the biomass surface coated with PDMS/nSiO2.

2.2.2. Scanning Electron Microscope Measurement

The morphology of the sawdust samples was analyzed with a scanning electron microscope (SEM, FEI Quanta FEG 250) using an acceleration voltage of 10 kV and magnification ranging from 500× to 3000×.

2.2.3. Filtration Process on Adsorption Beds

The 400 mL of crude oil and 6000 mL of model brine (50 g NaCl per 1 L of distillated water) were shaken in a 10 L canister for 1 h and allowed to stand for a further 48 h. The separated aqueous phase was filtered through prepared adsorption beds from raw and modified sawdust. The tested materials were used as fixed adsorption beds in the filtration process of brines contaminated with hydrocarbon compounds. One liter of brine with a given concentration of hydrocarbons was pumped by means of a peristaltic pump TH15 with a stepper motor from Aqua-Trend company from the top to an adsorption column filled with a given filter material. The column was a glass tube with an internal diameter of 2.2 cm and a height of 25 cm, closed at both ends with plugs secured with a steel mesh. The filtrate from the bottom of the column was collected in 100 mL doses in glass vessels. All measurements were carried out at room conditions. BTX content in each sample was determined by UV-Vis spectroscopy.

2.2.4. Crude Oil Characteristic

All basic properties of oil samples were measured according to ASTM standard methods. The chemical composition of oil was identified by GC-FID method. Gas chromatography of the whole oil was performed with a Hewlett/Packard Model 5890 (HP5890) gas chromatograph with a 30 m × 0.53 mm × 1 μm RTX-1 fused silica capillary column and a FID detector. The oven was programmed from 313 to 603 K at 10 K/min and held isothermal at 603 K for 20 min with helium carrier gas. The BTEX content in crude oil was determined using the certified reference material (2000 μg/mL each component in methanol) provided by Sigma Aldrich. The oily brine was extracted with dichloromethane as a solvent and BTX content was determined as described previously. Simultaneously the mineral oil index (the total concentration of all hydrocarbons eluting from n-decane C10H22 to n-tetracontane C40H82) was measured according to PN-EN ISO 9377-2 [35].

2.2.5. UV-Vis Spectroscopy Measurement

The UV-Vis spectra were recorded by using UV-1700 spectrometer (Shimadzu Inc.) connected to a computer and operated by the UV Probe program. All samples were placed in a 1 mL quartz cell and measured directly as aqueous solutions. No extraction was performed, and no additional sample preparation was used. The UV-1700 spectrometer is a double-beam spectrometer and pure model brine (50 g NaCl per 1 L distilled water) was used as the reference sample. The spectra were scanned in the range of 200–600 nm, with the accuracy of 1 nm.

3. Results and Discussion

3.1. Crude oil Characteristic

For this study a typical medium black oil was used. The physicochemical properties of the crude oil are listed in Table 1.
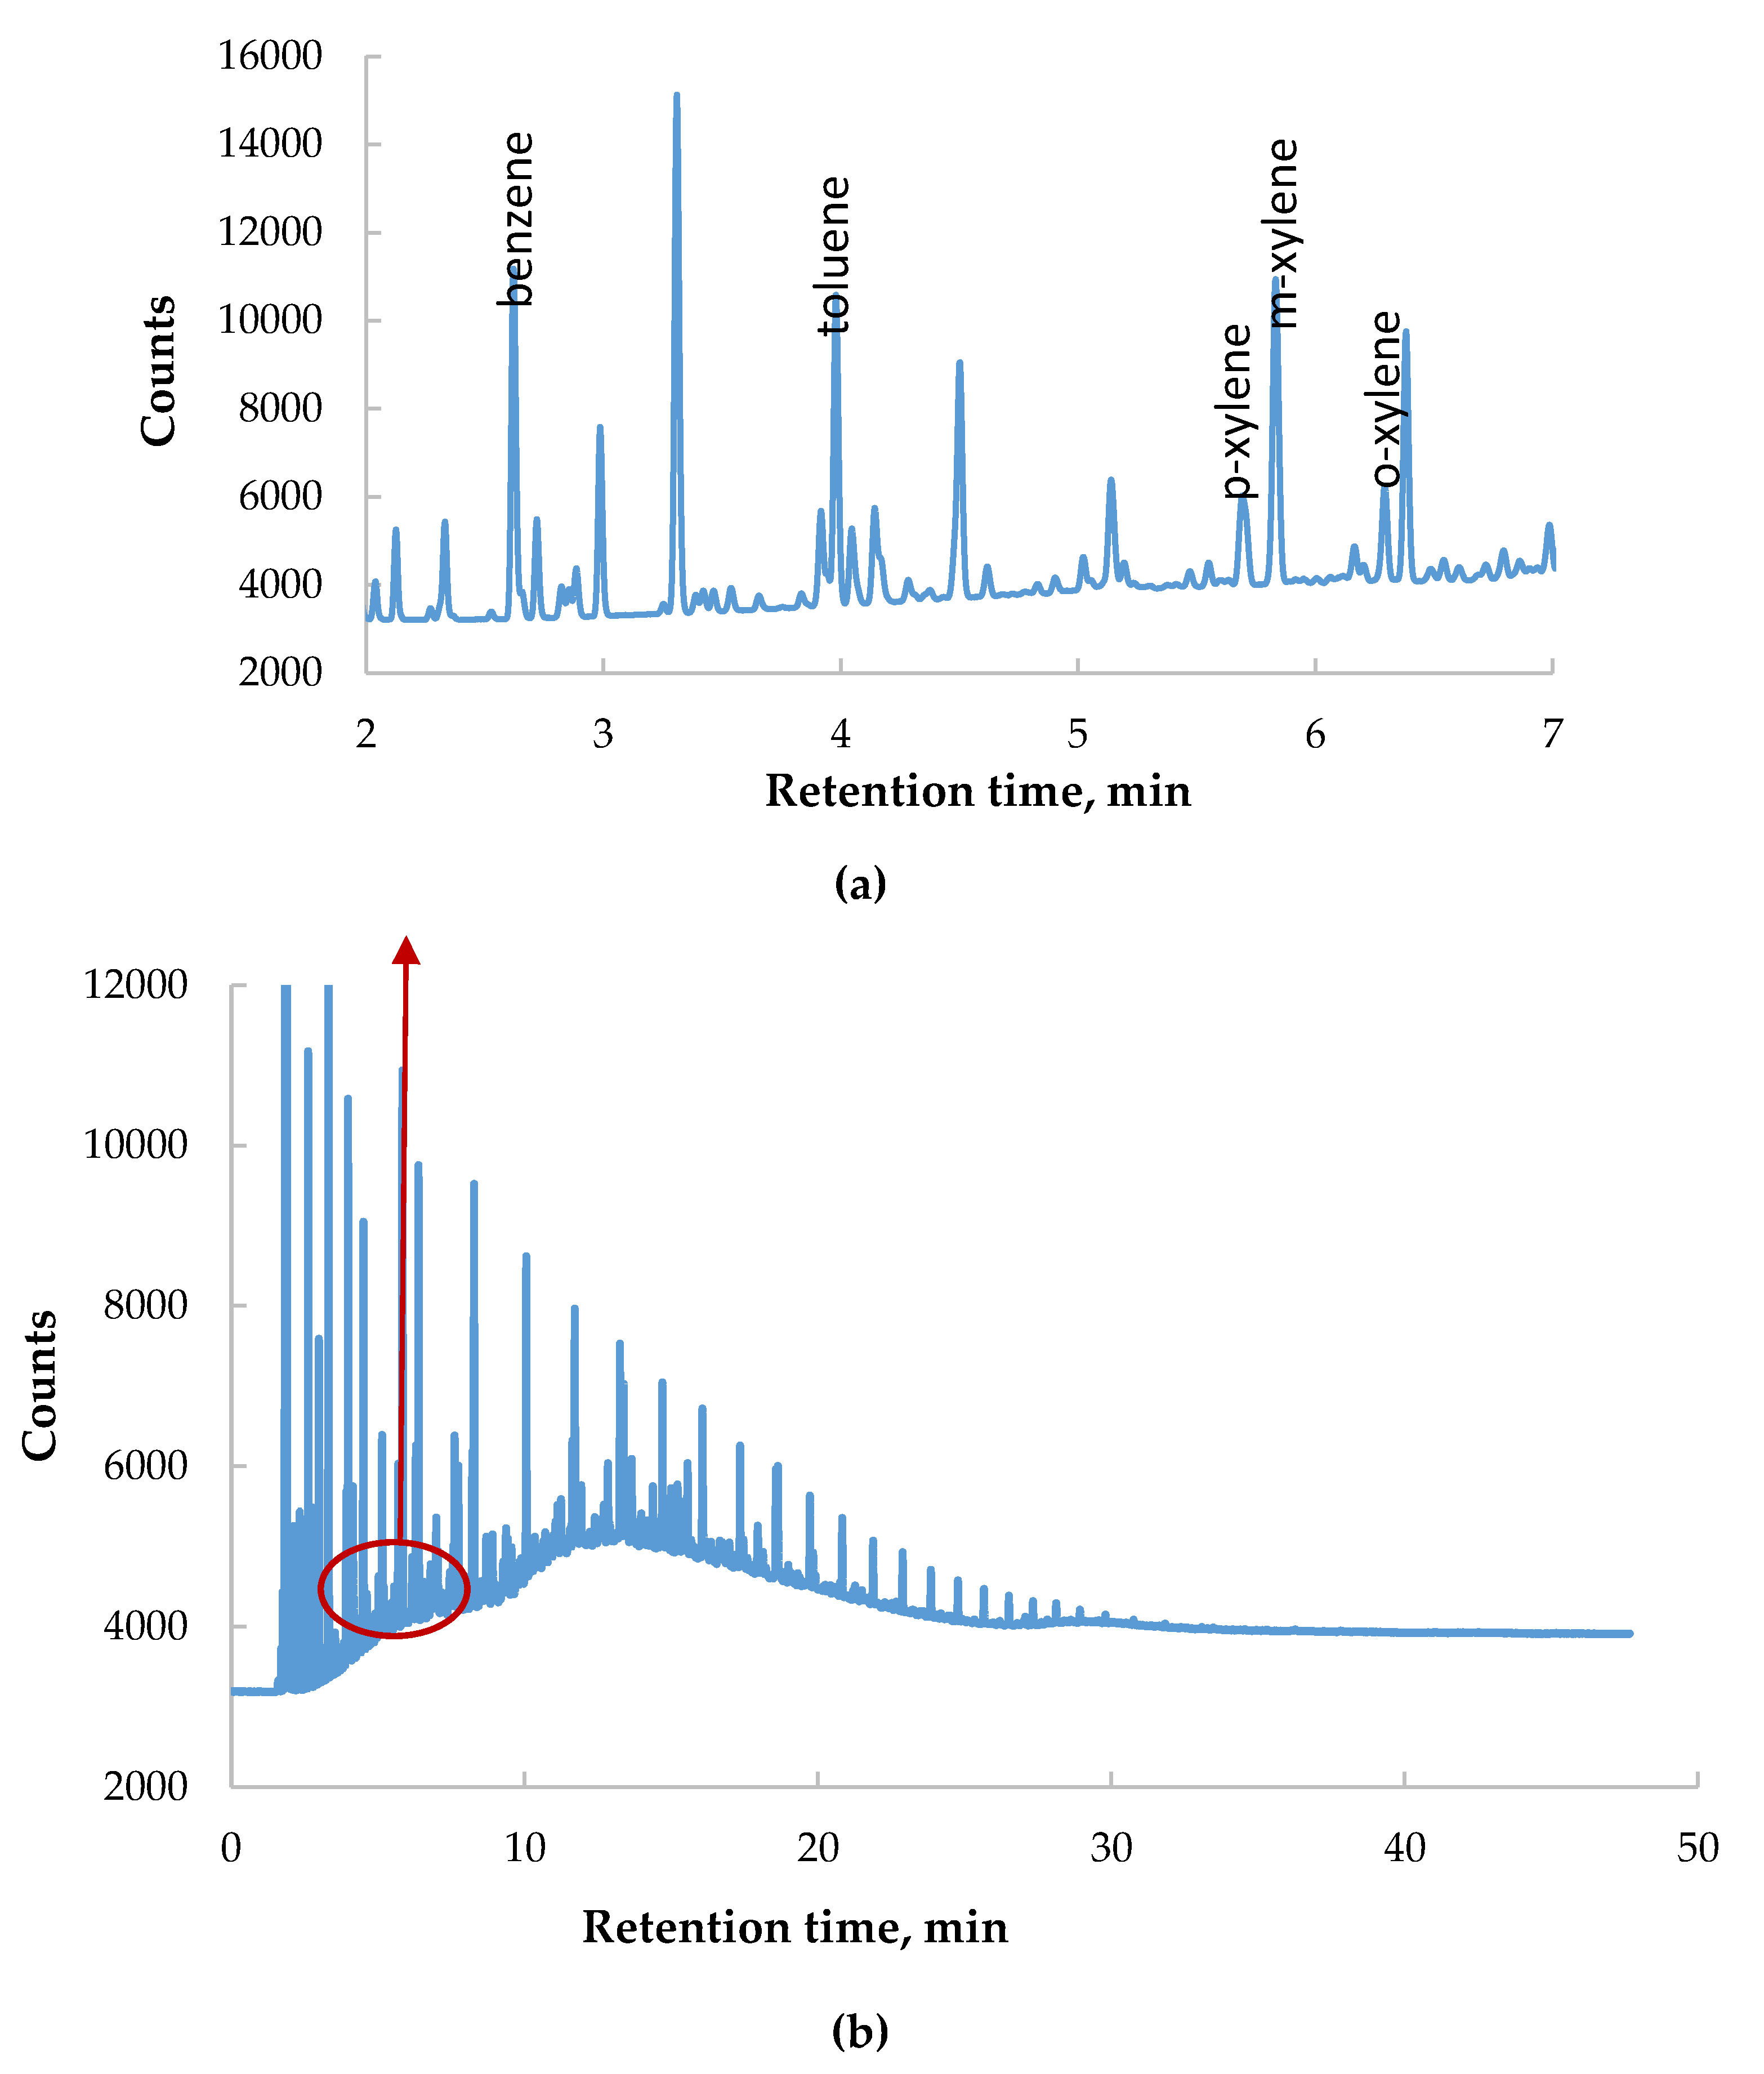
Gas chromatogram of whole crude oil is shown in Figure 3b. Peaks related to BTX components are marked in Figure 3a. The chromatogram shows a typical shape with n-alkane peaks located by their retention times. The lower boiling point hydrocarbons (<C5) were not strongly retained on the stationary phase and eluted through the FID rapidly. In general, the tested oil is highly paraffinic, n-alkanes account for over 85% of weight, which is conspicuous in chromatograms, where n-alkane peaks are significantly larger than others. GC analysis of tested crude oil shows a broad spectrum of n-alkanes whose peak heights progressively diminish toward the higher carbon numbers. The content of individual BTX components in crude oil is given in Table 1. The chromatogram of hydrocarbons extracted from brine is very similar to the original oil. The mineral oil index is equal to 834 mg/L and BTX content equals 364 mg/L. Phase equilibria (including mutual solubilities) in two-component systems of individual hydrocarbon-distilled water is well described in the literature. Salinity and the presence of other hydrocarbons significantly affect the solubility of specific compounds. For various reservoir waters these values change in a wide range and, for example, the reported benzene content in waste brines was in the order of 1.50–778.51 mg/L [6], 1–4 mg/L [36], 0.03–0.1 mg/L [37].
Chromatographic measurements are accurate and useful but too expensive for routine analysis. In this study the BTX concentration in water was determined using UV-Vis spectroscopy.

3.2. Morphology Analyses

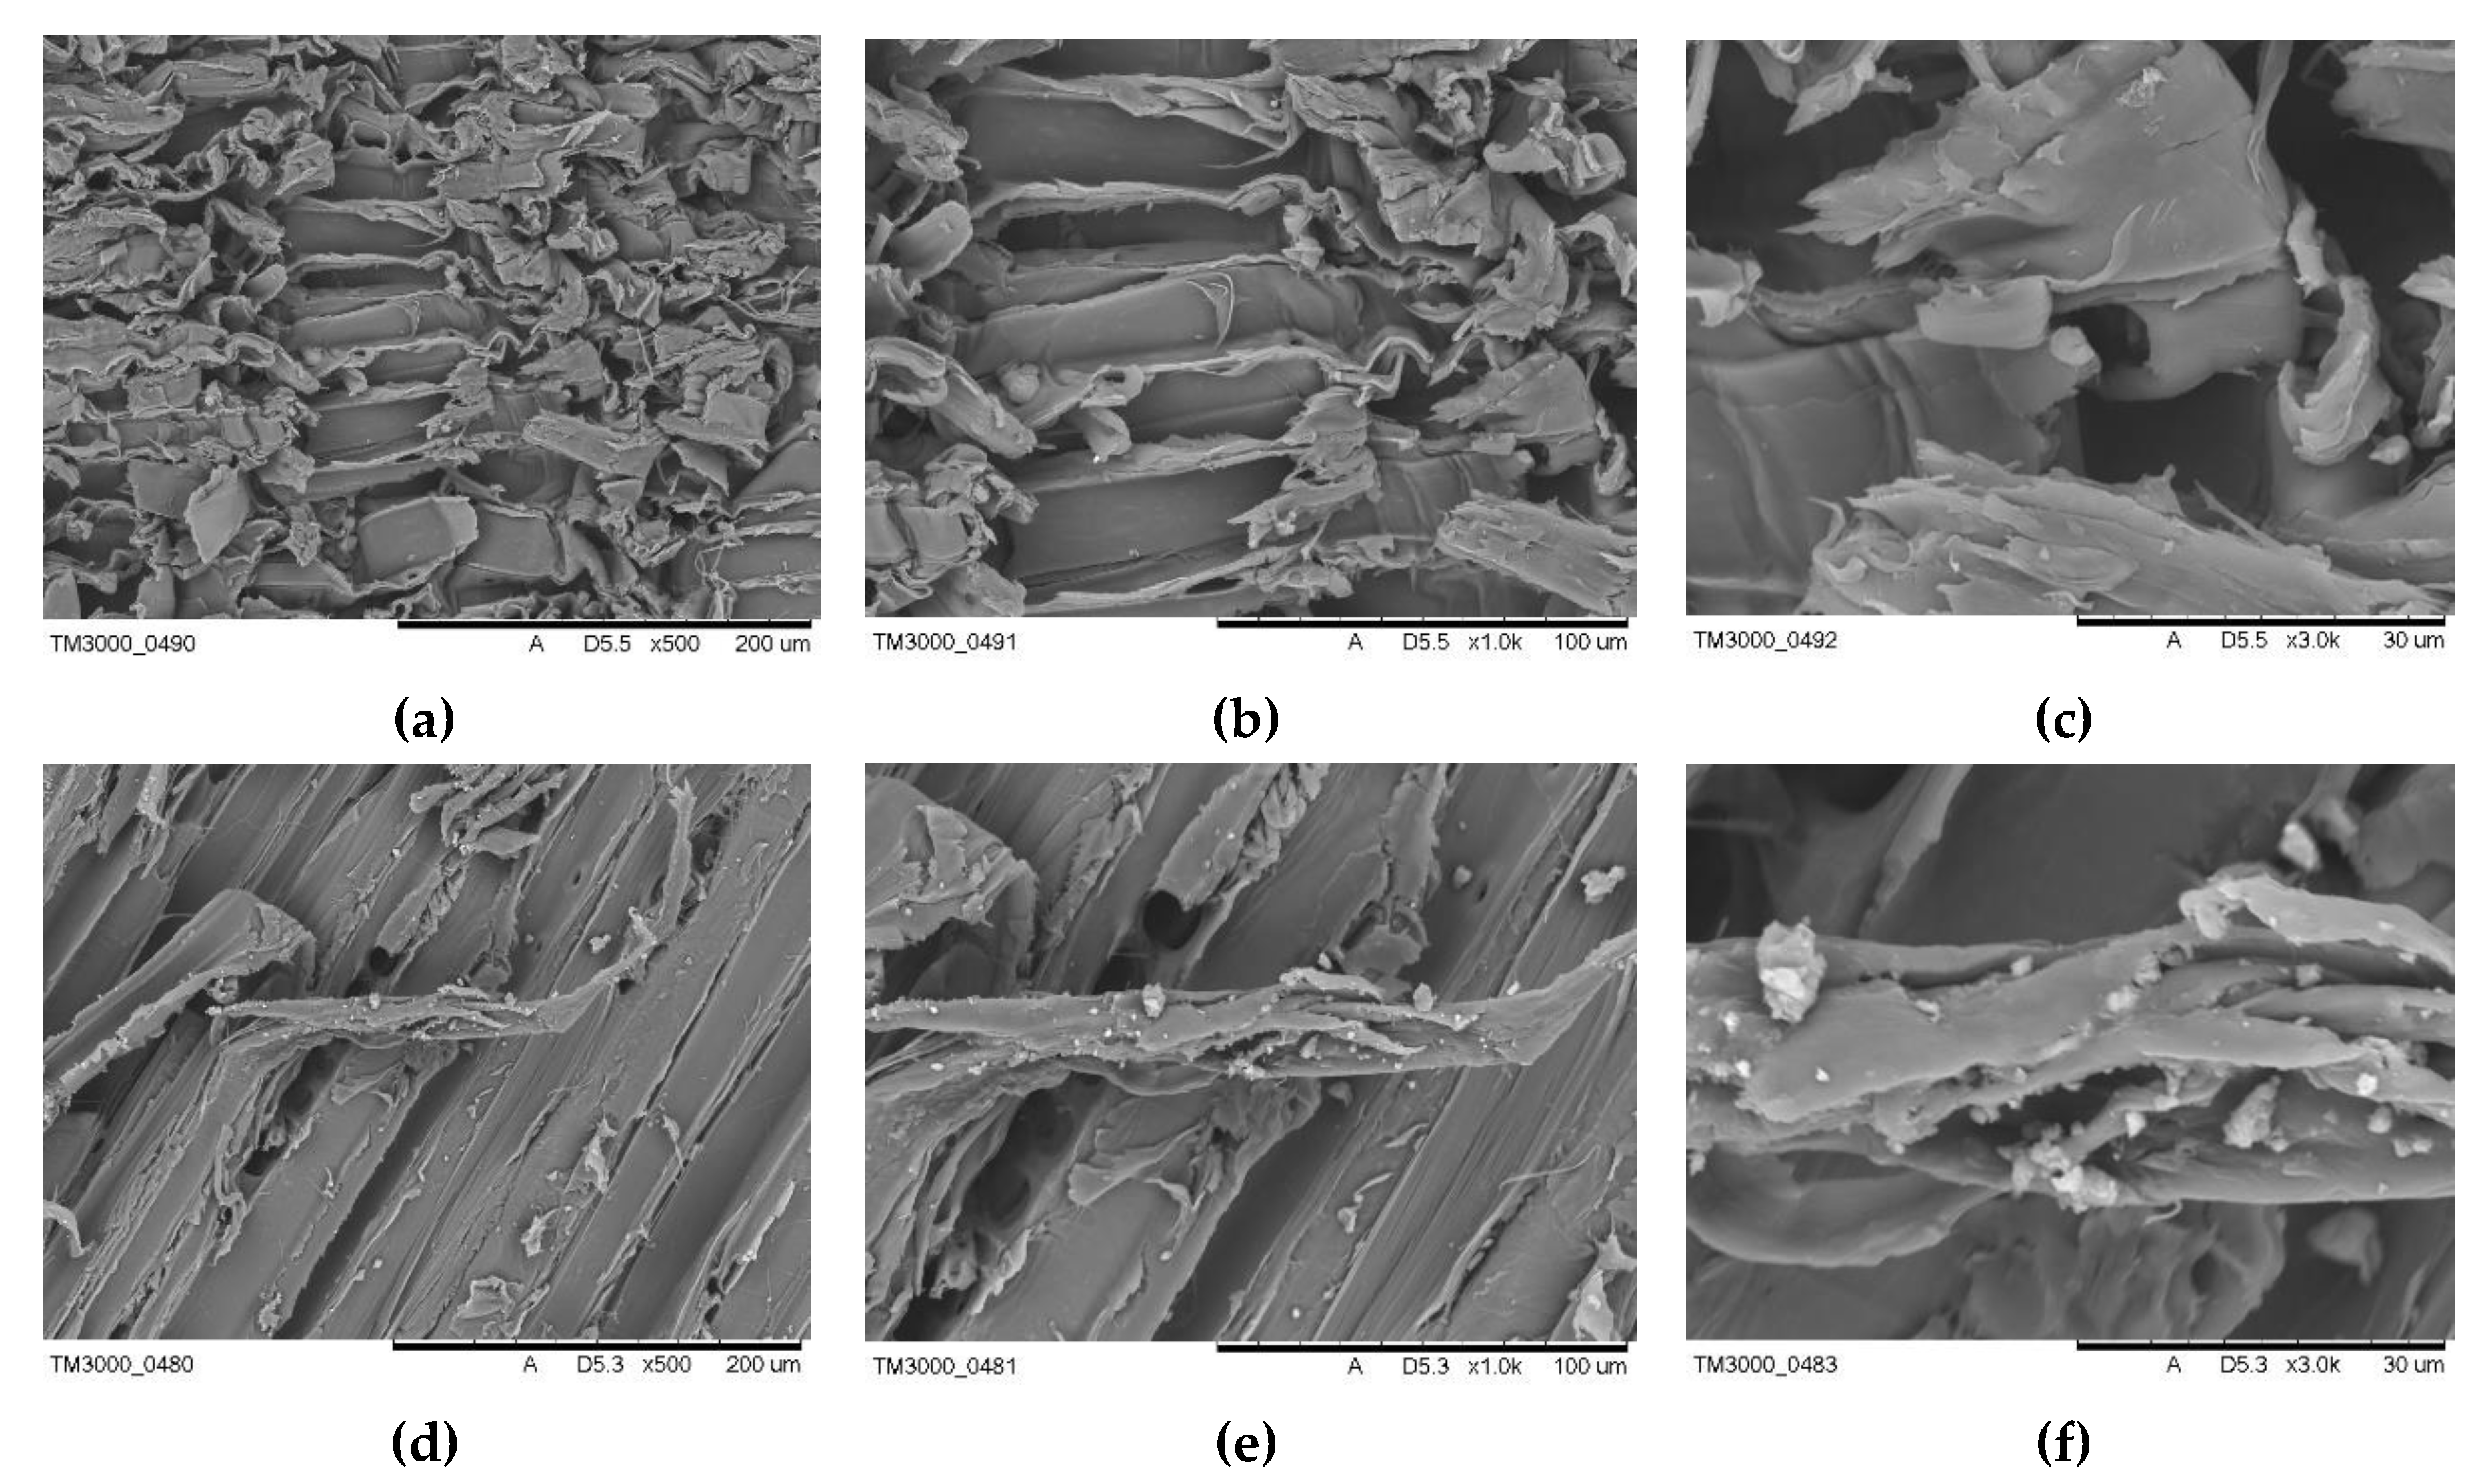
The SEM images of raw and modified sawdust at 500, 1000, and 3000 magnifications are shown in Figure 4. The macroscopic surface of the fibers is heterogeneous, and there are numerous burrs, wrinkles, and folds. The magnified image of pristine fibers reveals the smooth surface with jagged edges. The immobilization of nanosilica particles on sawdust surface using PDMS as coupling agent increased surface roughness. The coated fiber exhibit undulant and course surface morphology with numerous nanosilica aggregates. The hydrophobization increased the number of active sites available for adsorption which can affect the retention capability of oil in sorbent structure. The good adhesion property of oil on the fiber surface is crucial for hydrocarbons removal at high flow rates in filtration columns.
The specific surface area of pine biomass was reported by other researchers to be 0.4075–0.89 m2/g and the pore volume was equal to 0.0009 cm3/g [38,39]. Sawdust has a finely porous, regular structure with closed, elongated cells. It is expected that the surface modification with PDMS/nSiO2 did not influence the pore volume and pore size distribution as the whole process occurs only on the surface. Microscopic images confirm that the surface area after hydrophobization was increased. In our previous work [40] the sunflower pith was modified in the same way and its specific surface area increased from 3.388 to 8.090 m2/g and similar effects are expected in the case of sawdust.

3.3. Measurement of BTX Fraction in Model Brine During the Filtration Process on Absorption Beds

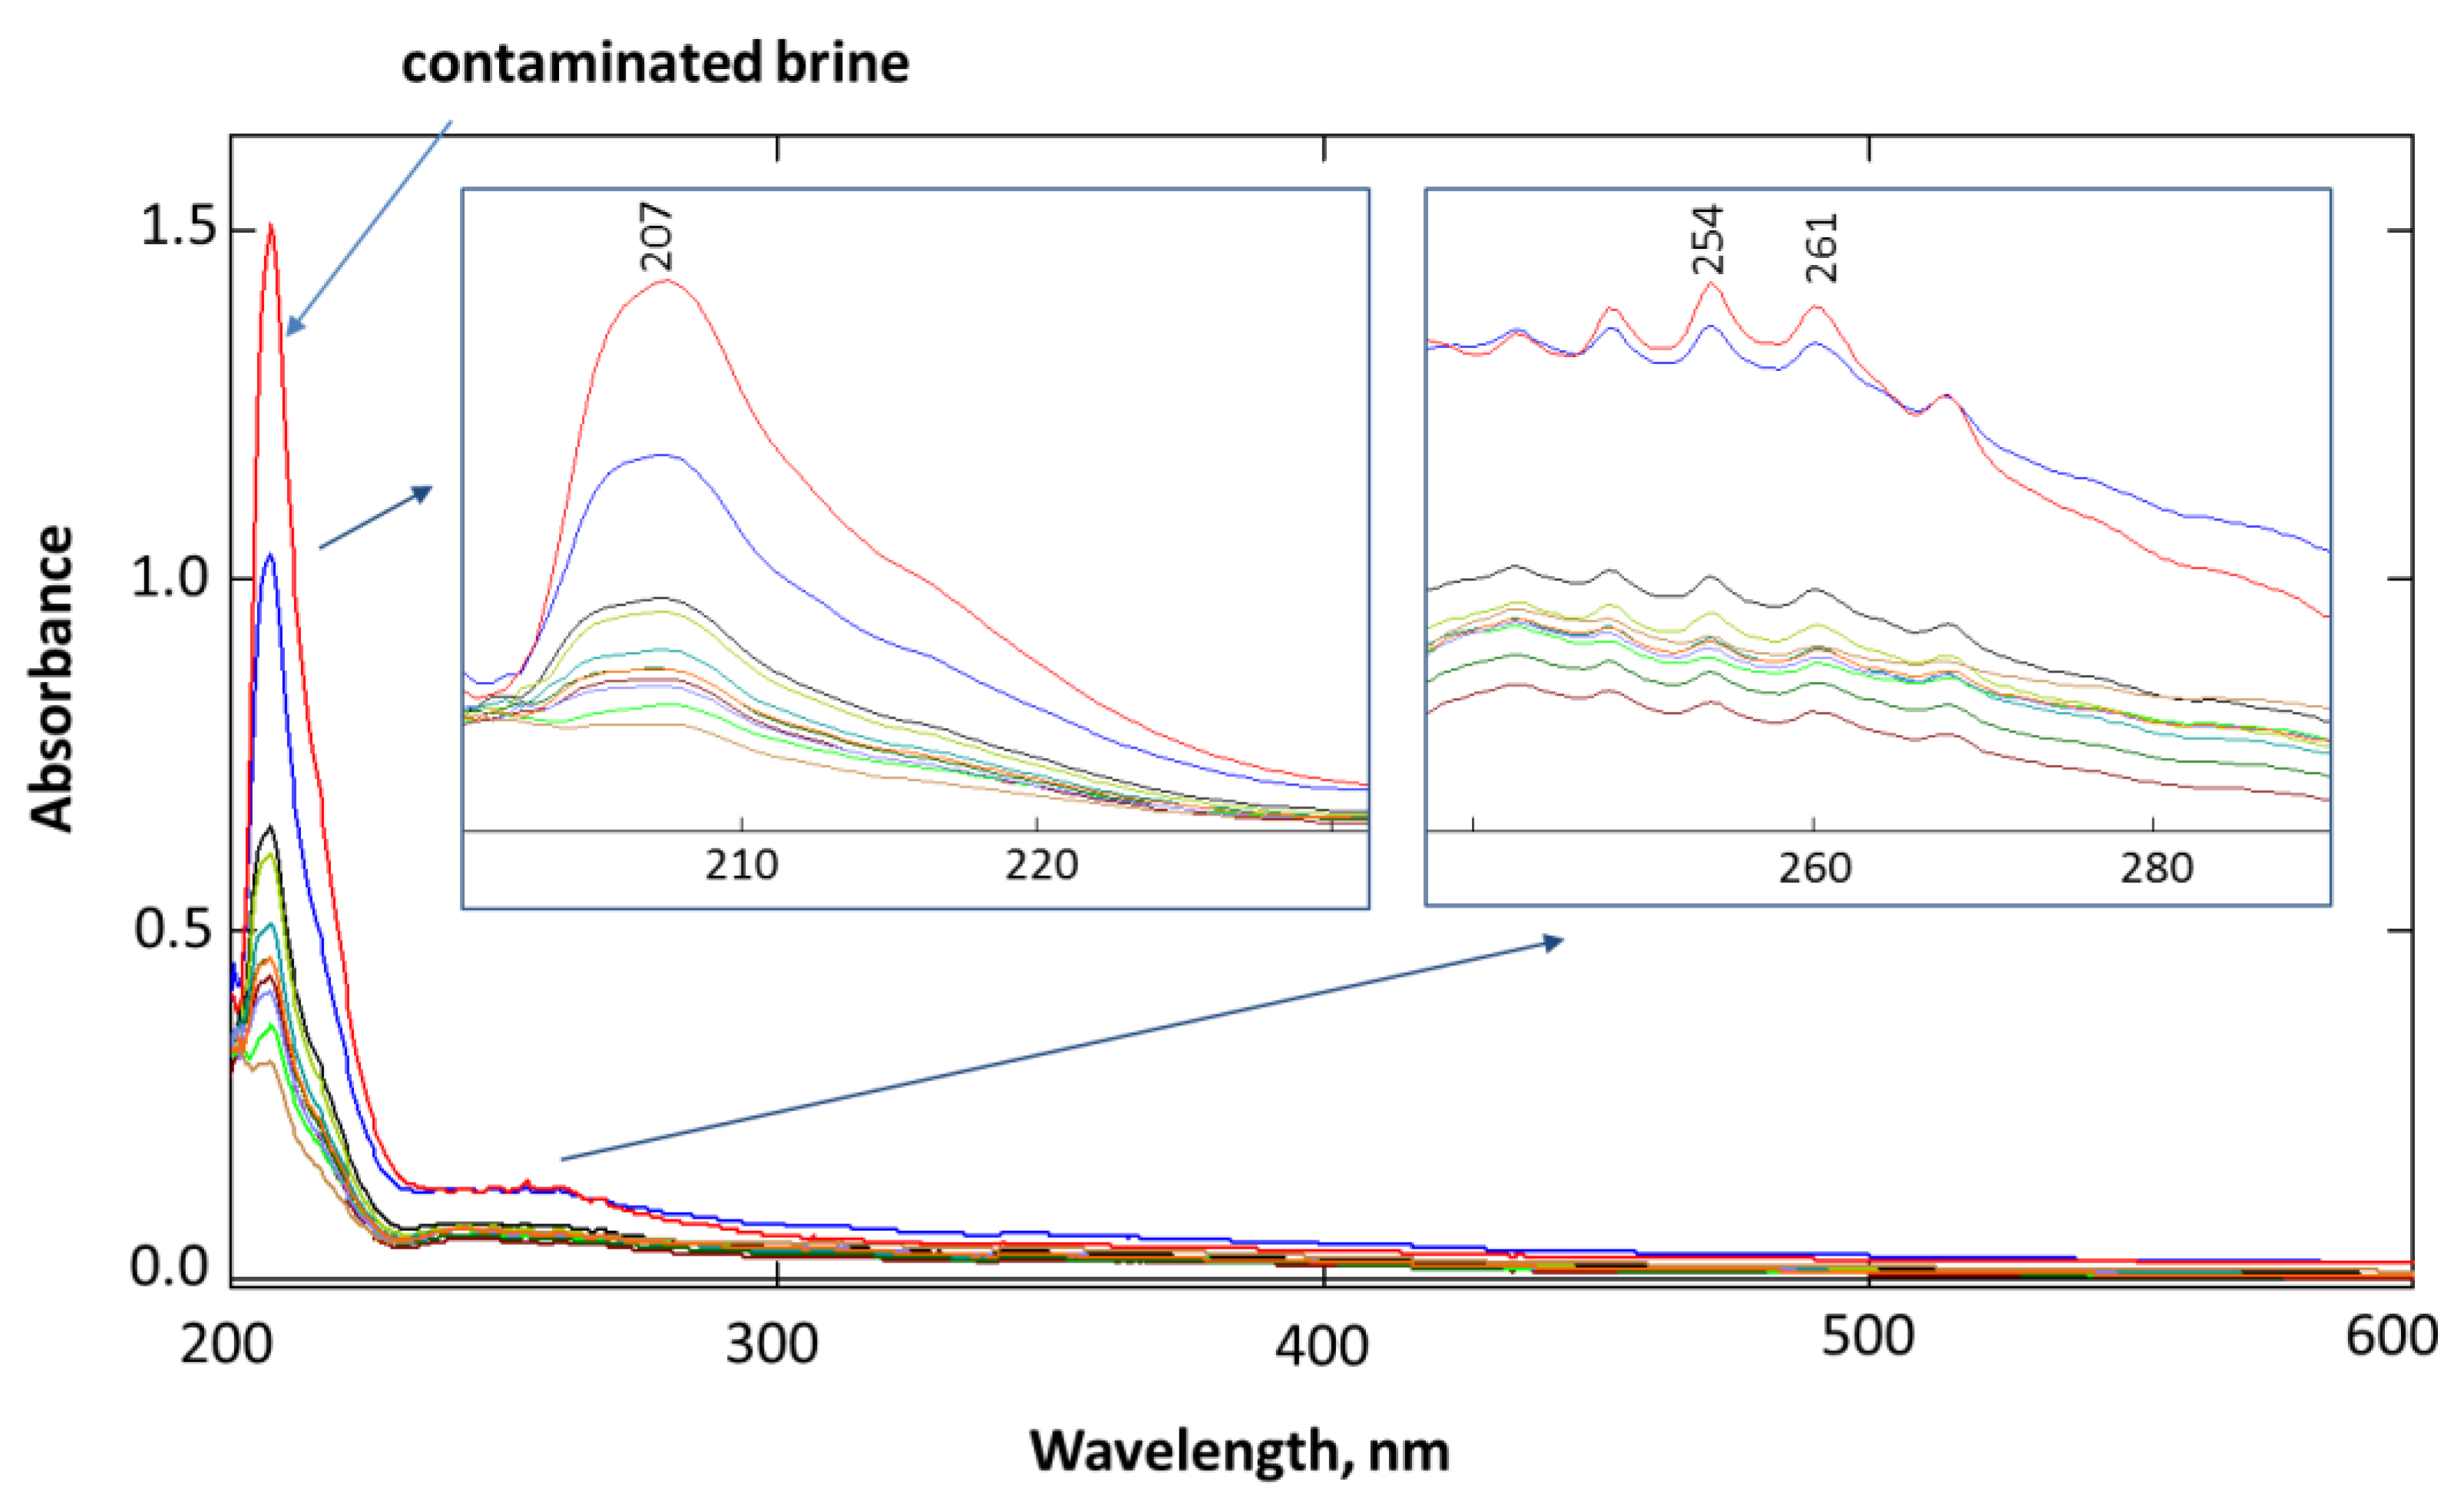
During all filtration processes the presence of BTX fraction in the filtrate was monitored by UV-Vis spectroscopy. Absorption bands on the UV-Vis spectra in the range of 200–230 and 240–280 nm are typical for aromatic compounds containing a benzene ring in their structure. The spectra of BTX in the range of 240–280 nm have a specific shape. A bathochromic effect can be observed—the maximum of absorption is observed at 256, 261, and around 266 nm for benzene, toluene, and xylenes [41]. The UV-Vis spectrum of brine contaminated with petroleum is more complicated, and the identification of individual compounds is difficult due to the overlapping of bands. According to the literature, the BTX fraction content can be analyzed by measuring absorbance at 254 nm or around 205 nm [42,43,44,45].
Figure 5 presents the UV-Vis spectrum set showing the change in aromatic hydrocarbon concentration during the filtration progress of oily water at flow rate of 25 mL/min. Two typical absorption bands with the maximum at 205 and 254 nm for the BTX fraction are observed in the spectrum of the tested brine contaminated by crude oil (the most intense spectrum in Figure 5). The UV-Vis spectra of the filtrates confirm the decrease in BTX fraction content (both peaks at 205 and 254 nm). In our study, using the linear relationship between the concentration of the substance and absorbance at 254 nm, the relative differences in the concentration of hydrocarbons in all tested samples (obtained before, after, and during the filtration process) were determined. These data were used in subsequent studies.

3.4. Column Study

3.4.1. Effect of Feed Flow Rate and Sorbent Wettability on the BTX Breakthrough Curves

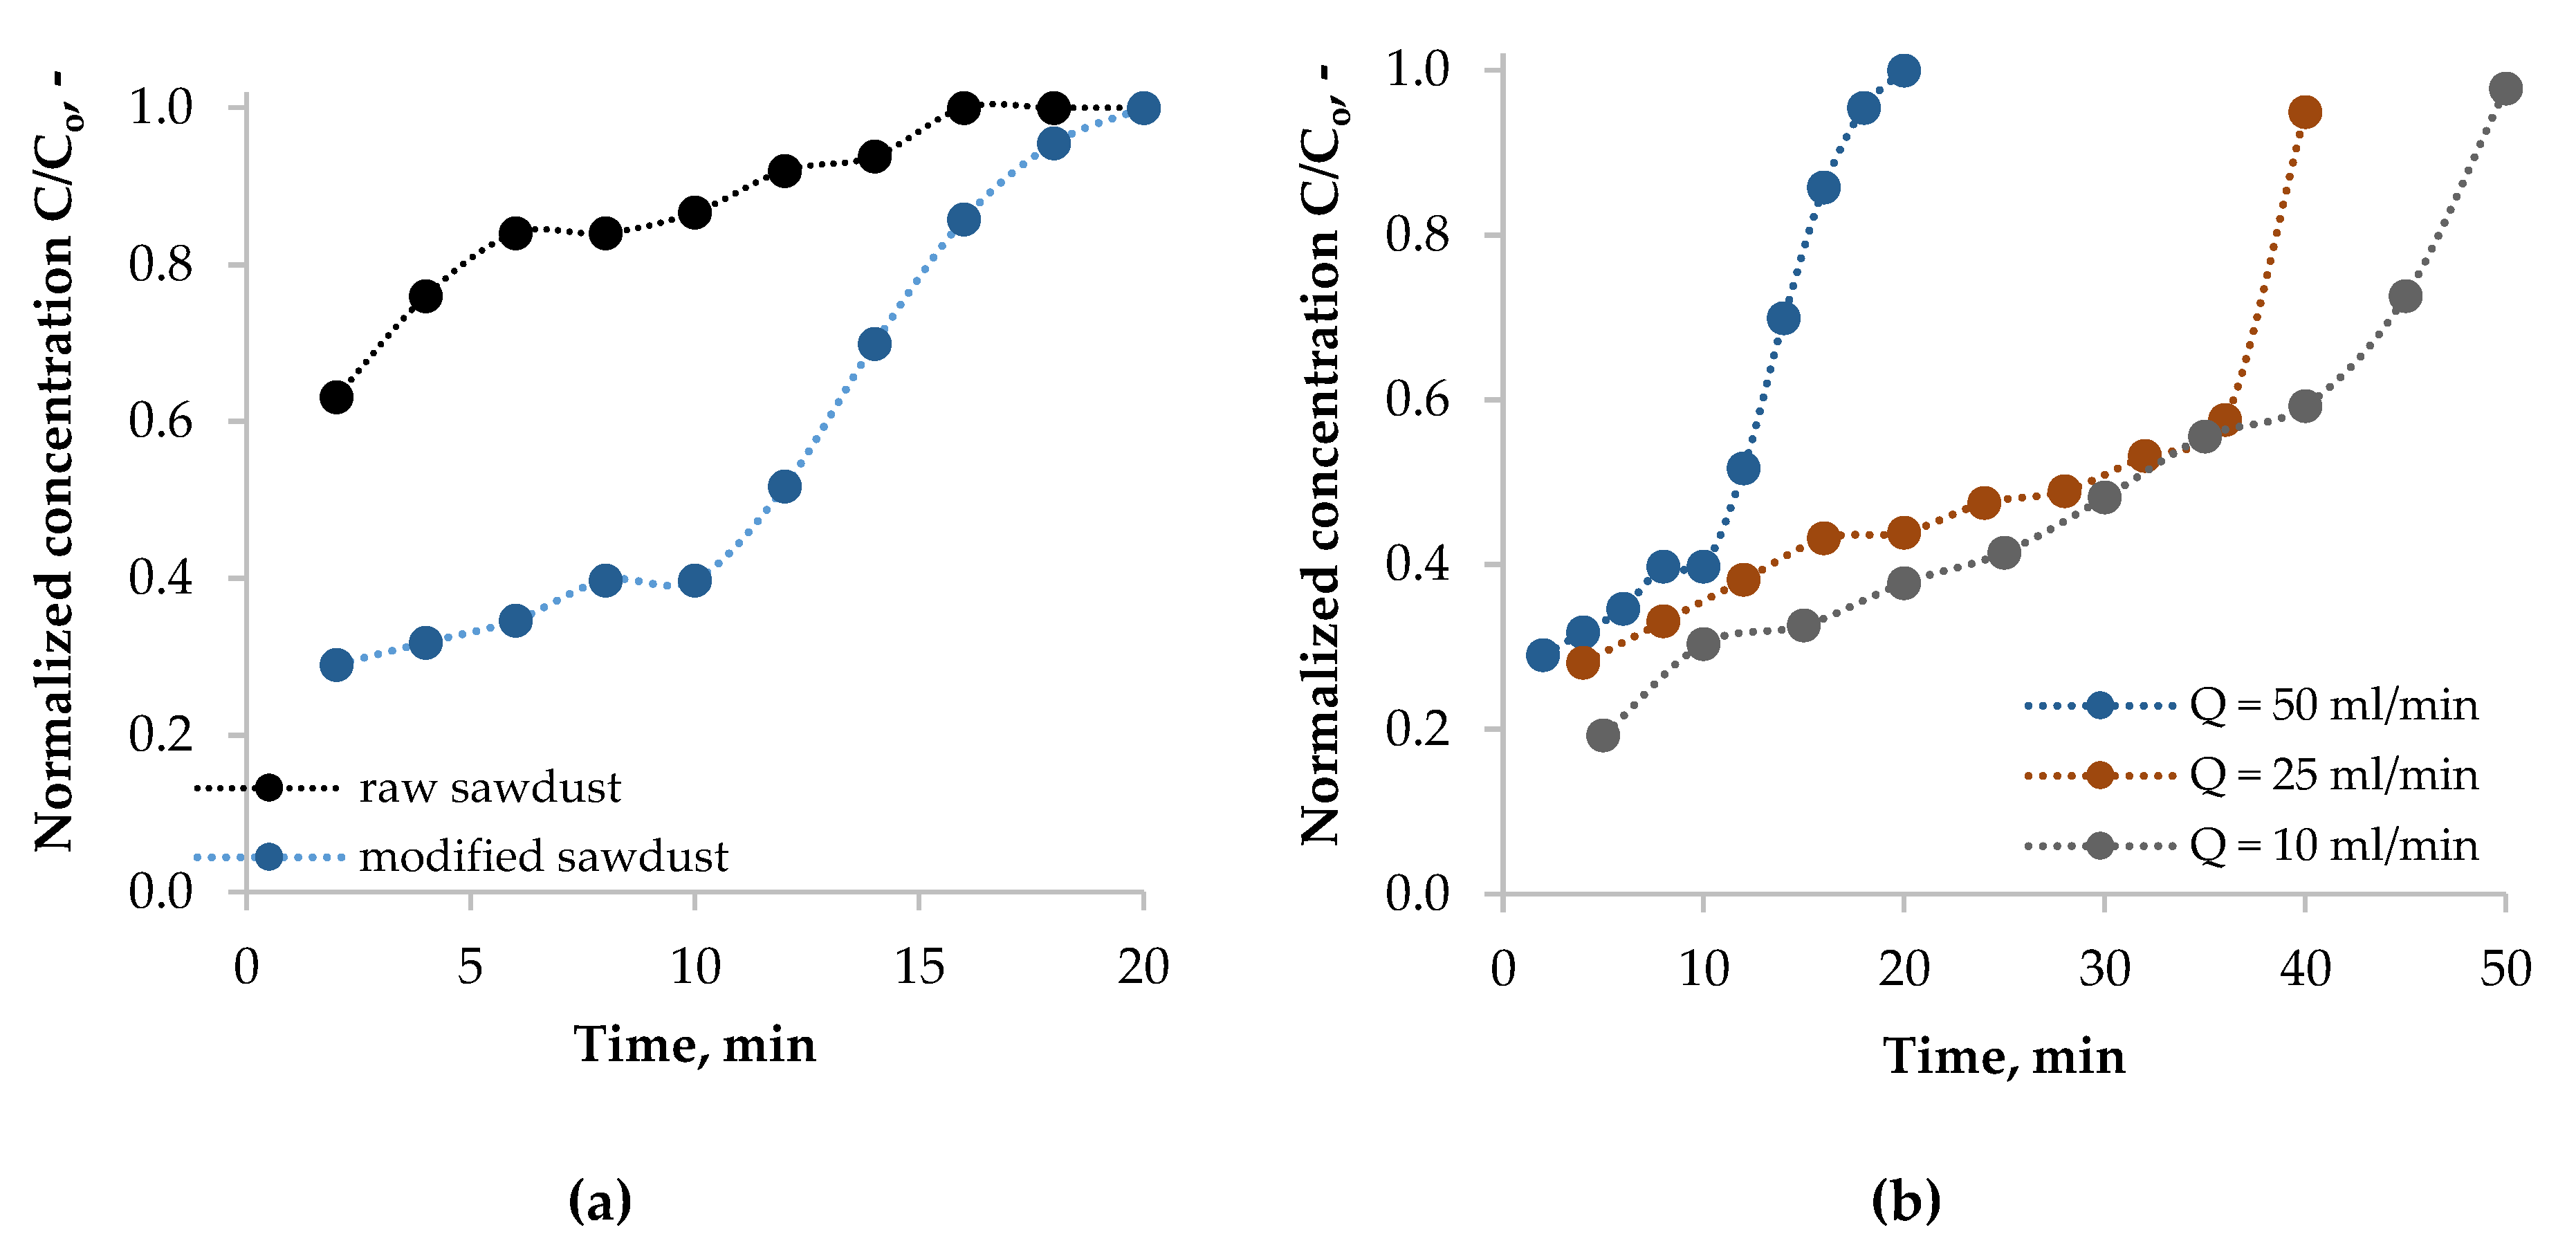
Breakthrough curves show the adsorbate normalized concentration in effluent versus time and can be used to describe the performance of a fixed bed. This normalized (relative) concentration is defined as the ratio of adsorbate concentration in effluent to inlet adsorbate concentration (C/Co). Figure 6a confirms that the modified sawdust exhibits a higher performance in hydrocarbon removal than the raw sawdust. For pristine fiber the BTX concentration in effluent was higher than 60% of initial BTX concentration for the whole filtration run. The modified sorbent removed more than 50% of dissolved hydrocarbons at the filtration initial stage. The surface roughness and hydrophobicity are considered as factors improving sorption capacity of the tested material.
The flow rate is the main operational parameter used to adjust performance of filtration system. The breakthrough curves for modified sawdust at different flow rates are shown in Figure 6b. The initial concentration of BTX fraction and the height of the bed were held constant at 364 mg/L and 25 cm, respectively. The breakthrough occurred faster with a higher flow rate. At lower flow velocities BTX molecules and oil microdroplets are more easily coalesced, adsorbed, and retained in the bed due to more time to contact with sorbent. At shorter residence time the BTX molecules cannot penetrate deeply in the pores. The separation of two liquids in the filtration column is more sensitive to changes in the flow rate as oil droplets are easily deformed and the classic sieve effect does not take place. With an increase in the flow rate, the BTX fraction elutes more rapidly from the beds.

3.4.2. Modeling of Breakthrough Dynamics

The breakthrough curves describe the performance of a fixed-bed column. Mathematical modeling of the adsorption process allows to identify its mechanism and is necessary for the successful design of full-scale adsorbers. Several mathematical models for concentration-time profile prediction have been reported in the literature. The most common ones are Yoon–Nelson, Clark, Bohart–Adams, and Belter models.
The Yoon and Nelson model is widely used for modeling breakthrough curves because it does not require detailed knowledge of the considered system. It can be described in a linear form:
l n ( C C o C ) = k Y N ( t τ )
where C is the solute concentration in the filtrate (mg/L), Co is the inlet BTX concentration in the solution (mg/L), kYN is the Yoon–Nelson’s proportionality constant (min−1), and τ is the time required for retaining 50% of the initial adsorbate (min) [46].
The Adams–Bohart model based on the surface reaction theory assumes that the adsorption rate is proportional to both the residual capacity of the adsorbent and the concentration of the adsorbing species [46]. Numerous studies proved that this model is useful for the description of the initial part of the breakthrough curve. This approach allows to estimate the maximum adsorption capacity and kinetic constant. The expression is the following:
l n ( C o C 1 ) = k B A N o L u k B A C o t
where kBA is the kinetics constant (L/mg*min), No is the maximum volumetric sorption capacity (mg/L), u is the linear velocity (cm/min), and L is the bed depth (cm).
The Clark model assumes plug flow behavior in the bed and uses Freundlich isotherm for equilibrium. The model has the following form
l n ( ( C o C ) n 1 1 ) = l n A r t
A = e x p ( k C N o L u )
r = k C C o
where kC is the Clark constant (L/(mg*min)) and n is the Freundlich constant reported for hydrophobized sawdust by Ismail (-) [32,47].
The Belter model can be described as
C o C = 1 2 ( 1 + e r f [ t t 0 2 σ t o ] )
where erf (x) is the error function of x, to indicates time needed for the outlet BTX concentration to be half of the inlet BTX concentration (min), and σ is the standard deviation of the linear part of the breakthrough curve in the Belter model [46].
In order to determine the sorption mechanism described above models were fitted to the experimental data. The parameters of models were determined using the Levenberg–Marquardt algorithm (nonlinear regression, Minerr function in Mathcad software). RMSE (root mean square error) and chi2 statistical criteria were was applied to evaluate the fitness of the model calculations to the experimental results. These criteria were calculated according to the equations:
R M S E = 1 N i = 1 N ( q e ,   e x p q e ,   c a l c ) 2
c h i 2 = i = 1 N ( q e ,   e x p q e ,   c a l c ) 2 q e ,   c a l c
where N is the data numbers, and qe,exp and qe,calc are the experimental and simulated values, respectively.

3.4.3. Breakthrough Curves—Modeling and Determination of Model Parameters

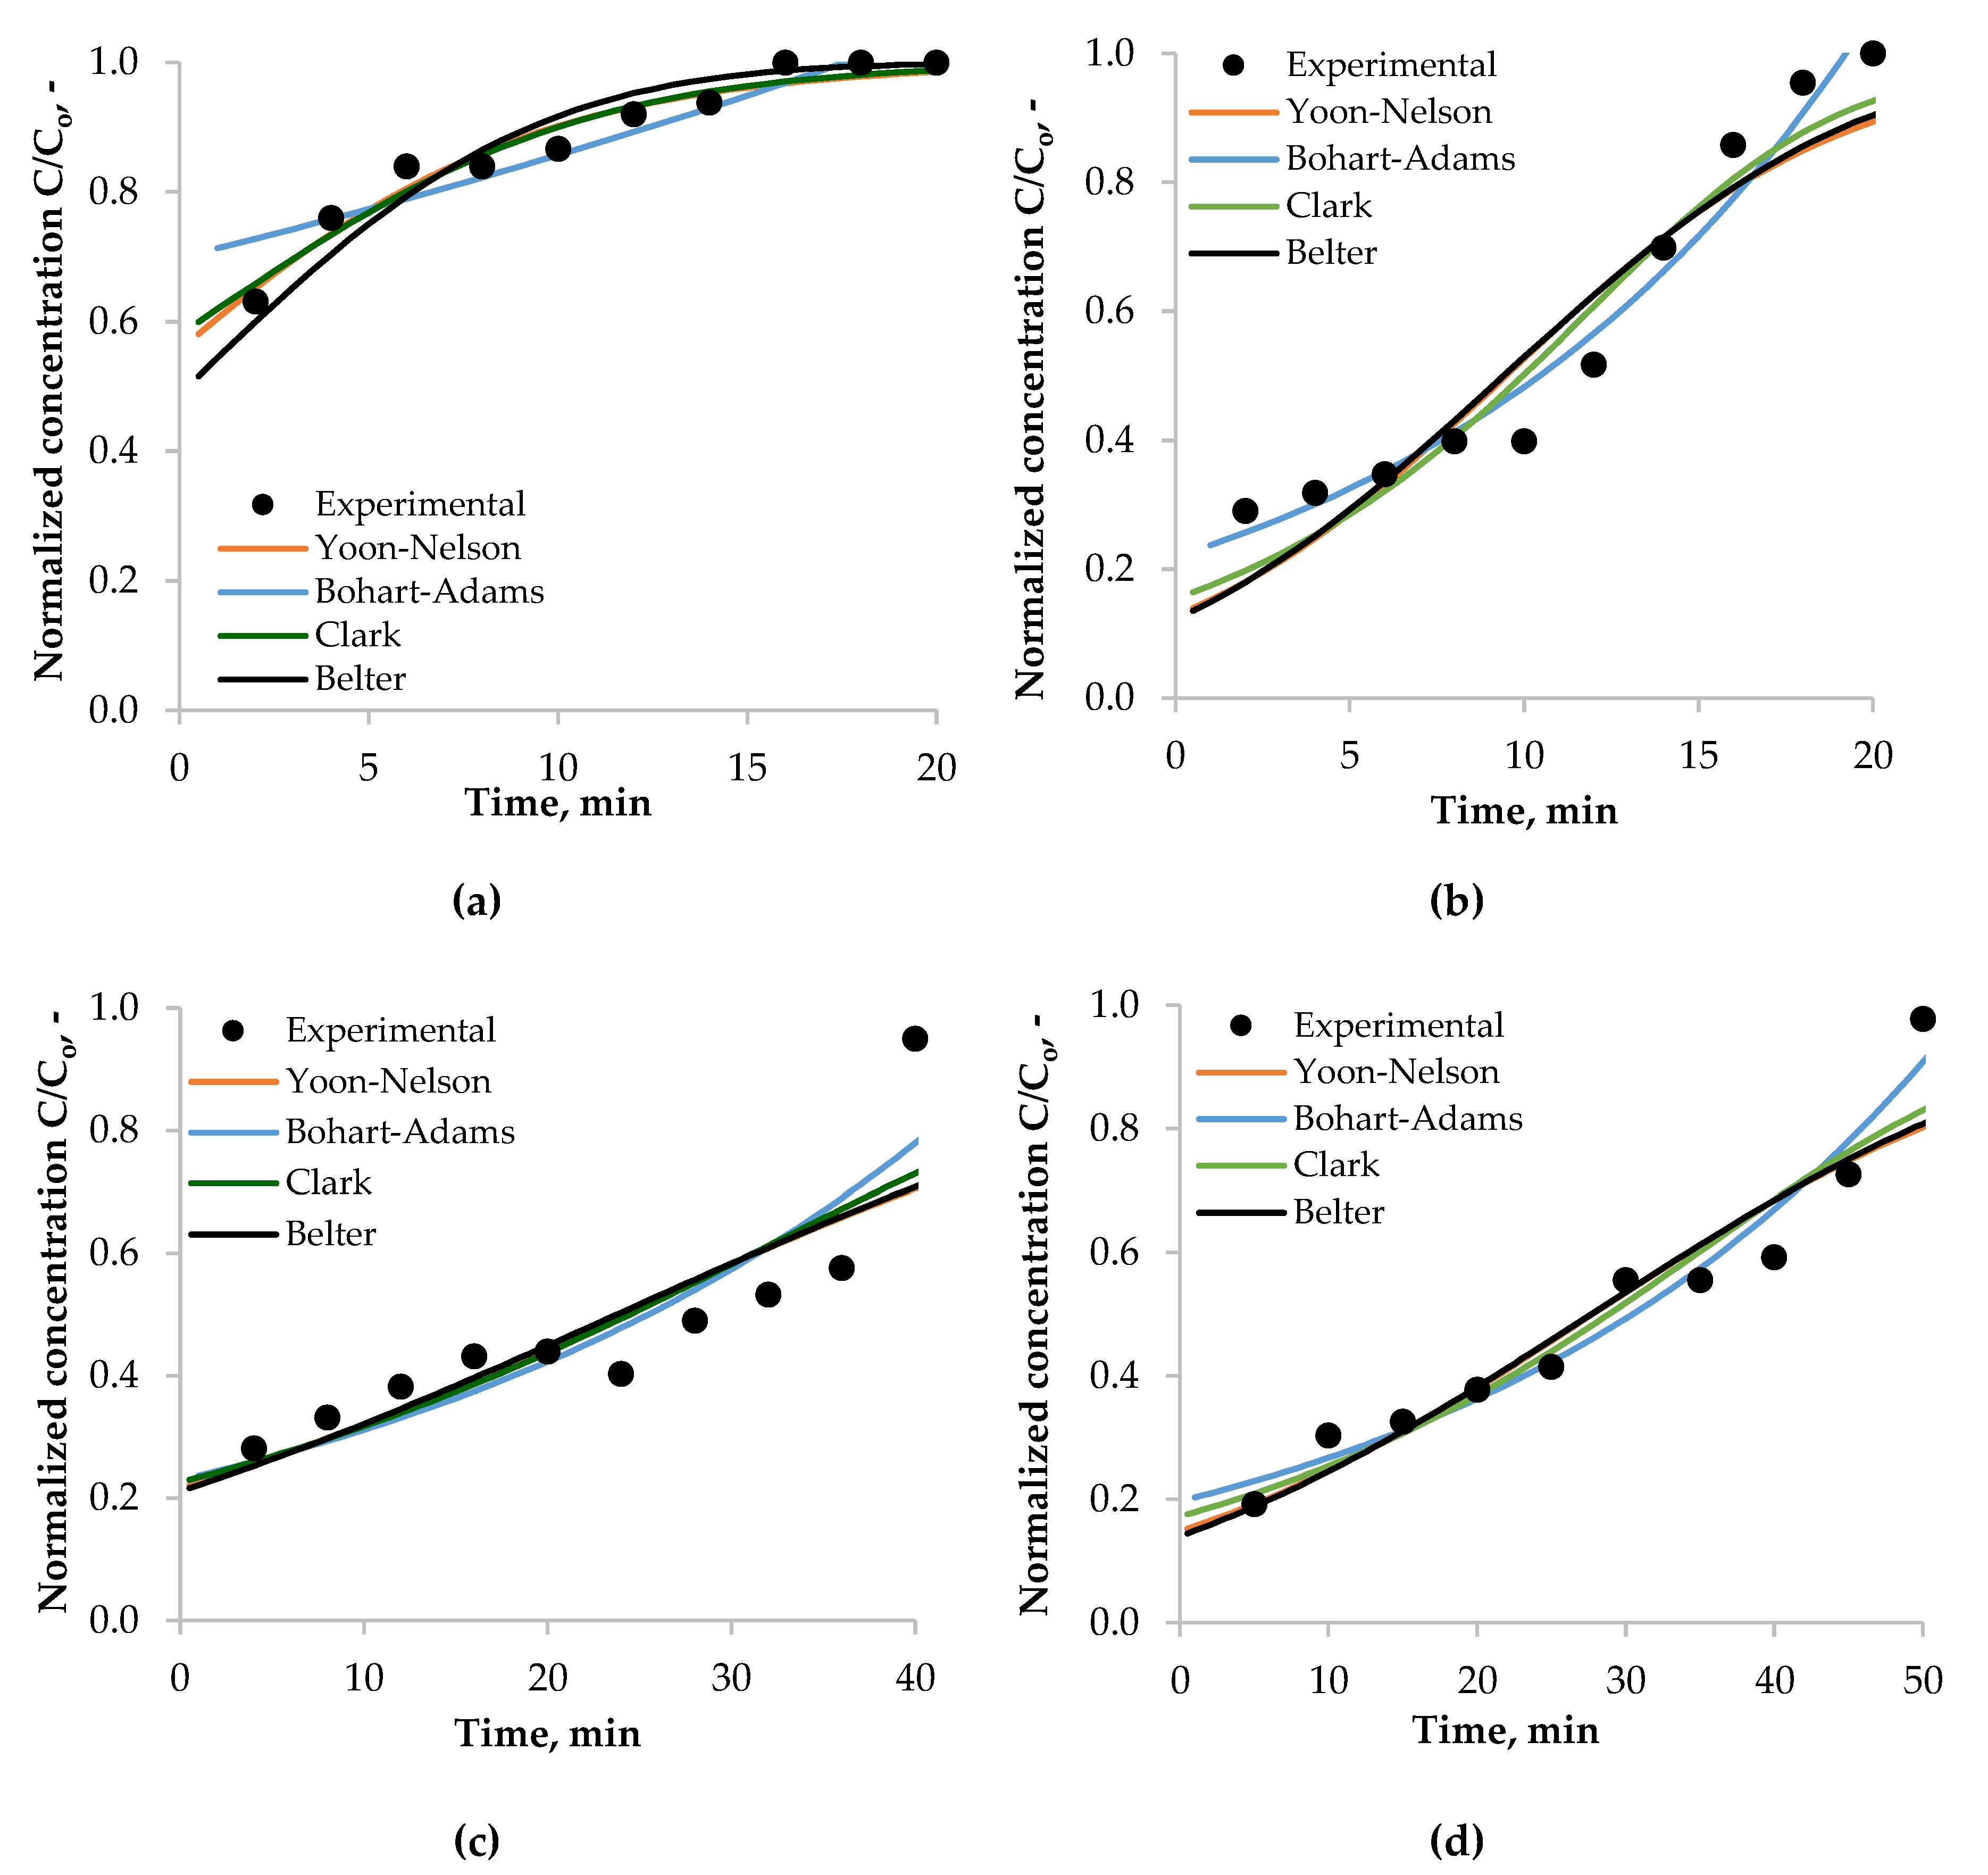
Figure 7 shows the breakthrough curves predicted by Yoon–Nelson, Adams–Bohart, Clark, and Belter models.
The obtained characteristic parameters for each experimental breakthrough curve are summarized in Table 2.
Full breakthrough curves are effectively predicted by the Yoon–Nelson and Bohart-Adams models. The values of the root mean square error are low for both models. Low chi2 confirms that the forecast is consistent with the measured values over the entire range of outlet concentrations. The Yoon–Nelson model does not take into account typical process parameters such as flow rate but it allows to compare the effectiveness of the adsorption materials used. The longer the time it takes for the adsorbent to reach half of its saturation τ , the more effective the sorbent is, i.e., it allows for purification of a greater volume of brine before the concentration at the outlet reaches 0.5 Co. Values of τ determined from the Yoon–Nelson model comply with the experimental values. The kinetic coefficient kYN, similarly to the adsorption rate constant, is a measure of the intensity of the process. Parameter kYN increases with the filtration rate which is associated with a higher number of adsorbate molecules available in a given volume of the bed, which increases the likelihood of sorbent–sorbate contact.
The Bohart–Adams model allows to determine the maximum volumetric adsorption capacity of a bed (grams of oil derivatives per unit volume of the bed). For raw sawdust the capacity is 3.367 g/L and for modified material varies from 2.037 to 4.613 g/L. This capacity is affected by flow rate as at higher flow velocity a more intensive desorption occurs, and oil compounds are washed out.
Direct comparison of the effectiveness of the developed adsorption beds with that of other materials is difficult due to different research methods adopted by the authors. In most cases, the curves obtained are not S-shaped as in the literature. Their characteristic depends strongly on operational parameters and sorbent–sorbate interactions. Works of other authors confirm that it is practically impossible to completely remove dissolved hydrocarbons from water in adsorption columns. Even in the initial phase of experiments, the concentration in effluent is usually equal to 20% of the initial concentration. Moura et al. [48] used ordered mesoporous silica materials to remove BTX fraction from water. After filtering through the column (Co = 10 mg/L, L = 1 cm, Q = 1 mL/min) 50 mL of the waste water, the benzene content in the filtrate was 40% of Co. Zeinali et al. [49], using granulated activated carbon, in most cases removed no more than 60% of toluene from the water. Walnut and coconut shell beds removed less than 50% of hydrocarbons from the produced water as reported Gallo-Cordova et al. [27]. As reported in this work, modified sawdust-based fixed beds show a reasonable removal efficiency.

4. Conclusions

In this study raw and hydrophobized sawdust was used as a low-cost material in laboratory-scale fixed-bed columns in order to test their efficiency in removing BTX fraction from oily brine. The modified material exhibited a higher sorption efficiency due to increased surface roughness related to the presence of nanosilica aggregates. The reduction in flow rate from 50 to 10 mL/min resulted in a 9.5 to 27.8 min increase in the time required to reach 50% of initial BTX concentration in effluent. The maximum sorption capacity (4.6 g of BTX per 1 L of filter bed) was attained at a bed height of 25 cm, 25 mL/min flow rate, and 364 mg/L initial BTX concentration. The Yoon–Nelson, Bohart–Adams, Clark, and Belter models were applied to analyze and predict the experimental data. The Bohart–Adams equation provided the model that best fitted the provided experimental data. The obtained results could be useful for the design of packed adsorption columns.

Author Contributions

Conceptualization, E.K. and K.C.-L.; methodology, E.K. and K.C.-L.; software, E.K.; validation, E.K., M.M. and K.C.-L.; formal analysis, J.S.; investigation, E.K., M.M., A.M. and K.C.-L.; resources, E.K.; data curation, K.C.-L.; writing—original draft preparation, E.K. and K.C.-L.; writing—review and editing, K.C.-L.; visualization, A.M. and M.M.; supervision, J.S.; project administration, E.K.; funding acquisition, E.K. All authors have read and agreed to the published version of the manuscript.

Funding

The project was co-financed by the Ministry of Science and Higher Education of Poland under the program “Support for scientific research management and commercialization of results of R&D works in scientific units and enterprises” under the Smart Growth Operational Program 2014-2020 (Action 4.4).

Conflicts of Interest

The authors declare no conflict of interest.

References

  1. Alley, B.; Beebe, A.; Rodgers, J.; Castle, J.W. Chemical and physical characterization of produced waters from conventional and unconventional fossil fuel resources. Chemosphere 2011, 85, 74–82. [Google Scholar] [CrossRef] [PubMed]
  2. Neff, J.; Lee, K.; DeBlois, E.M. Produced Water: Overview of Composition, Fates, and Effects. In Produced Water Environmental Science Research; Ray, J.P., Engelhardt, F.R., Eds.; Springer: Boston, MA, USA, 1992; Volume 46, pp. 3–54. [Google Scholar]
  3. Tibbetts, P.J.C.; Buchanan, I.T.; Gawel, L.J.; Large, R. A Comprehensive Determination of Produced Water Composition. In Produced Water Environmental Science Research; Ray, J.P., Engelhardt, F.R., Eds.; Springer: Boston, MA, USA, 1992; Volume 46, pp. 97–112. [Google Scholar]
  4. Stewart, M.; Arnold, K. Produced Water Treatment Field Manual, 1st ed.; Gulf Professional Publishing: New York, NY, USA, 2011; pp. 1–134. [Google Scholar]
  5. Pintor, A.M.A.; Vilar, V.J.P.; Botelho, C.M.S.; Boaventura, R.A.R. Oil and grease removal from wastewaters: Sorption treatment as an alternative to state-Of-The-Art technologies. A critical review. Chem. Eng. J. 2016, 297, 229–255. [Google Scholar] [CrossRef]
  6. Khan, N.A.; Engle, M.; Dungan, B.; Holguin, F.O.; Xu, P.; Carroll, K.C. Volatile-Organic molecular characterization of shale-Oil produced water from the Permian Basin. Chemosphere 2016, 148, 126–136. [Google Scholar] [CrossRef] [PubMed]
  7. Tellez, G.T.; Nirmalakhandan, N.; Gardea-Torresdey, G.T. Comparison of purge and trap GC/MS and spectrophotometry for monitoring petroleum hydrocarbon degradation in oilfield produced waters. Microchem. J. 2005, 81, 12–18. [Google Scholar] [CrossRef]
  8. Allen, E. Process water treatment in Canada’s oil sands industry: I. Target pollutants and treatment objectives. J. Environ. Eng. Sci. 2008, 7, 123–138. [Google Scholar] [CrossRef] [Green Version]
  9. Fillo, J.P.; Koraido, S.M.; Evans, J.M. Sources, characteristics, and management of produced waters from natural gas production and storage operations. In Produced Water Environmental Science Research; Ray, J.P., Engelhardt, F.R., Eds.; Springer: Boston, MA, USA, 1992; Volume 46, pp. 151–161. [Google Scholar]
  10. ATSDR 2017 Substance Priority List. Available online: https://www.atsdr.cdc.gov/SPL/ (accessed on 20 January 2020).
  11. Forero, J.E.; Ortiz, O.-P.; Duque, J.-P. Design and application of flotation systems for the treatment of reinjected water in a Colombian petroleum field. Cienc. Tecnol. y Futuro 2007, 3, 147–158. [Google Scholar]
  12. Qiao, X.; Zhang, Z.; Yu, J.; Ye, X. Performance characteristics of a hybrid membrane pilot-Scale plant for oilfield-Produced wastewater. Desalination 2008, 225, 113–122. [Google Scholar] [CrossRef]
  13. Ali, S.A.; Henry, L.R.; Darlington, J.W.; Occapinti, J. New filtration process cuts contaminants from offshore produced. Oil Gas. J. 1998, 96, 73–78. [Google Scholar]
  14. Oil and Gas Produced Water Management and Beneficial Use in the Western United States. Available online: https://www.usbr.gov/research/dwpr/reportpdfs/report157.pdf (accessed on 20 January 2020).
  15. Hamad, B.K.; Noor, A.M.; Afida, A.R.; Asri, M.N.M. High removal of 4-Chloroguaiacol by high surface area of oil palm shell-Activated carbon activated with NaOH from aqueous solution. Desalination 2010, 257, 1–7. [Google Scholar] [CrossRef]
  16. Kayvani, A.; Mckay, G.; Manawi, Y.; Malaibari, Z.; Hussien, M.A. Outstanding adsorption performance of high aspect ratio and super-Hydrophobic carbon nanotubes for oil removal. Chemosphere 2016, 164, 142–155. [Google Scholar] [CrossRef]
  17. Elkady, M.F.; Hussien, M.; Abou-Rady, R. Equilibrium and kinetics behavior of oil spill process onto synthesized nano-Activated carbon. Am. J. Appl. Chem. 2015, 3, 22–30. [Google Scholar] [CrossRef]
  18. Han, S.; Sun, Q.; Zheng, H.; Li, J.; Jin, C. Green and facile fabrication of carbon aerogels from cellulose-Based waste newspaper for solving organic pollution. Carbohydr. Polym. J. 2016, 136, 95–100. [Google Scholar] [CrossRef] [PubMed]
  19. Blumenschein, C.D.; Severing, K.W.; Boyle, E. Walnut shell filtration for oil and solids. AISE Steel Technol. 2001, 78, 33–37. [Google Scholar]
  20. Hirs, G. Method of Filtering Oil from Liquids. US Patent No 3992291, 16 November 1976. [Google Scholar]
  21. Srinivasan, A.; Viraraghavan, T. Removal of oil by walnut shell media. Bioresour. Technol. 2008, 99, 8217–8220. [Google Scholar] [CrossRef] [PubMed]
  22. Rawlins, C.; Sadeghi, F. Experimental study on oil removal in nutshell filters for produced-Water treatment. SPE Prod. Oper. 2017, 33, 1–9. [Google Scholar]
  23. Dong, T.; Wang, F.; Xu, G. Theoretical and experimental study on the oil sorption behavior of kapok assemblies. Ind. Crops Prod. 2014, 61, 325–330. [Google Scholar] [CrossRef]
  24. Dong, T.; Xu, G.; Wang, F. Adsorption and adhesiveness of kapok fiber to different oils. J. Hazard. Mater. 2015, 296, 101–111. [Google Scholar] [CrossRef]
  25. Zheng, Y.; Wang, J.; Zhu, Y.; Wang, A. Research and application of kapok fiber as an absorbing material: A mini review. J. Environ. Sci. 2017, 27, 21–32. [Google Scholar] [CrossRef]
  26. Khan, E.; Virojnagud, W.; Ratpukdi, T. Use of biomass sorbents for oil removal from gas station runoff. Chemosphere 2004, 57, 681–689. [Google Scholar] [CrossRef]
  27. Gallo-Cordova, A.; Silva-Gordillo, M.; Muñoz, G.A.; Arboleda-Faini, X.; Streitwieser, A.D. Comparison of the adsorption capacity of organic compounds present in produced water with commercially obtained walnut shell and residual biomass. J. Environ. Chem. Eng. 2017, 5, 4041–4050. [Google Scholar] [CrossRef]
  28. Ribeiro, T.H.; Rubio, J.; Smith, R.W. A dried hydrophobic aquaphyte as an oil filter for oil/water emulsions. Spill Sci. Technol. Bull. 2003, 8, 483–489. [Google Scholar] [CrossRef]
  29. El-Sayed, M.; Ramzi, M.; Hosny, R.; Fathy, M.; Abdel Moghny, T. Breakthrough curves of oil adsorption on novel amorphous carbon thin film. Water Sci. Technol. 2016, 73, 2361–2369. [Google Scholar] [CrossRef] [PubMed]
  30. Fathy, M.; El-Sayed, M.; Ramzi, M.; Abdelraheem, O.H. Adsorption separation of condensate oil from produced water using ACTF prepared of oil palm leaves by batch and fixed bed techniques. Egypt. Fournal Pet. 2018, 27, 319–326. [Google Scholar] [CrossRef]
  31. Cambiella, A.; Ortea, E.; Rios, G.; Benito, J.; Pazos, C.; Coca, J. Treatment of oil-In-Water emulsions: Performance of a sawdust bed filter. J. Hazard. Mater. 2006, 131, 195–199. [Google Scholar] [CrossRef] [PubMed]
  32. Ismail, A.S. Preparation and evaluation of fatty-Sawdust as a natural biopolymer for oil spill sorption. Chem. J. 2015, 5, 80–85. [Google Scholar]
  33. Ismail, A.S.; El-Sheshtawy, H.S.; Khalil, N.M. Bioremediation process of oil spill using fatty-Lignocellulose sawdust and its enhancement effect. Egypt. J. Pet. 2019, 28, 205–211. [Google Scholar] [CrossRef]
  34. Hussein, S.N.C.M.; Othman, N.H.; Dollah, A.; Rahim, A.N.C.A.; Japperi, N.S.; Ramakrishnan, N.S.M.A. Study of acid treated mixed sawdust as natural oil sorbent for oil spill. Mater. Today Proc. 2019, 19, 1382–1389. [Google Scholar] [CrossRef]
  35. PN-EN ISO 9377-2:2003 Water Quality – Determination of Hydrocarbon Oil Index – Part 2: Method Using Solvent Extraction and Gas Chromatography. Available online: https://infostore.saiglobal.com/en-us/Standards/PN-EN-ISO-9377-2-2003-943737_SAIG_PKN_PKN_2220471/ (accessed on 20 January 2020).
  36. Utvik, T.I.R. Chemical characterization of produced water from four offshore oil production platforms in the North Sea. Chemosphere 1999, 39, 2593–2606. [Google Scholar] [CrossRef]
  37. Sirivedhin, T.; Dallbauman, L. Organic matrix in produced water from the Osage-Skiatook Petroleum Environmental Research site, Osage county, Oklahoma. Chemosphere 2004, 57, 463–469. [Google Scholar] [CrossRef]
  38. Sidirasa, D.; Batziasa, F.; Schroeder, E.; Ranjanc, R.; Tsapatsis, M. Dye adsorption on autohydrolyzed pine sawdust in batch and fixed-Bed systems. Chem. Eng. J. 2011, 171, 3883–3896. [Google Scholar] [CrossRef]
  39. Zhang, R.; Leiviskä, T. Surface modification of pine bark with quaternary ammonium groups and its use for vanadium removal. Chem. Eng. J. 2020, 385, 123967. [Google Scholar] [CrossRef]
  40. Knapik, E. Application of Nanocomposites for the Removal of Hydrocarbons from Produced (Reservoir) Water in Surface Facilities in Oil Fields. Ph.D. Thesis, AGH University of Science and Technology, Kraków, Poland, 2019. [Google Scholar]
  41. Thomas, O.; Brogat, M. Organic Constituents. In UV-Visible Spectrophotometry of Water and Wastewater; Thomas, O., Burgess, C.H., Eds.; Elsevier: Amsterdam, The Netherlands, 2007; pp. 73–90. [Google Scholar]
  42. Negrea, P.; Sidea, F.; Negrea, A.; Lupa, L.; Ciopec, M.; Muntean, C. Studies regarding the Benzene, Toluene and o-Xylene Removal from Waste Water. Chem. Bull. POLITEHNICA Univ. (Timişoara) 2008, 53, 1–2. [Google Scholar]
  43. Zoccolillo, L.; Allessandrelli, M.; Felli, M. Simultaneous determination of benzene and total aromatic fraction of gasoline by HPLC-DAD. Chromatographia 2001, 54, 659–663. [Google Scholar] [CrossRef]
  44. Peng, S.; He, X.; Pan, X. Spectroscopic study on transformations of dissolved organic matter in coal-to-liquids wastewater under integrated chemical oxidation and biological treatment process. J. Environ. Sci. 2018, 70, 206–216. [Google Scholar] [CrossRef]
  45. Farooq, M.; Khan, S.; Wu, J.; Liu, B.; Cheng, Ch.; Akbar, M.; Chai, Y.; Memon, A. Fluorescence and photophysical properties of xylene isomers in water: With experimental and theoretical approaches. R. Soc. Open Sci. 2018, 5, 171719. [Google Scholar]
  46. Chu, K.H. Improved fixed bed models for metal biosorption. Chem. Eng. J. 2004, 97, 233–239. [Google Scholar] [CrossRef]
  47. Tan, K.L.; Hameed, B.H. Insight into the adsorption kinetics models for the removal of contaminants from aqueous solutions. J. Taiwan Inst. Chem. Eng. 2017, 74, 25–48. [Google Scholar] [CrossRef]
  48. Moura, C.P.; Vidal, C.B.; Barros, A.L.; Costa, L.S.; Vasconcellos, L.C.G. Adsorption of BTX (benzene, toluene, o-xylene, and p-xylene) from aqueous solutions by modified periodic mesoporous organosilica. J. Colloid Interface Sci. 2011, 363, 626–634. [Google Scholar] [CrossRef] [Green Version]
  49. Zeinali, F.; Ghoreyshi, A.A.; Najafpour, G. Removal of toluene and dichloromethane from aqueous phase by granular activated carbon (GAC). Chem. Eng. Commun. 2012, 199, 203–220. [Google Scholar] [CrossRef]
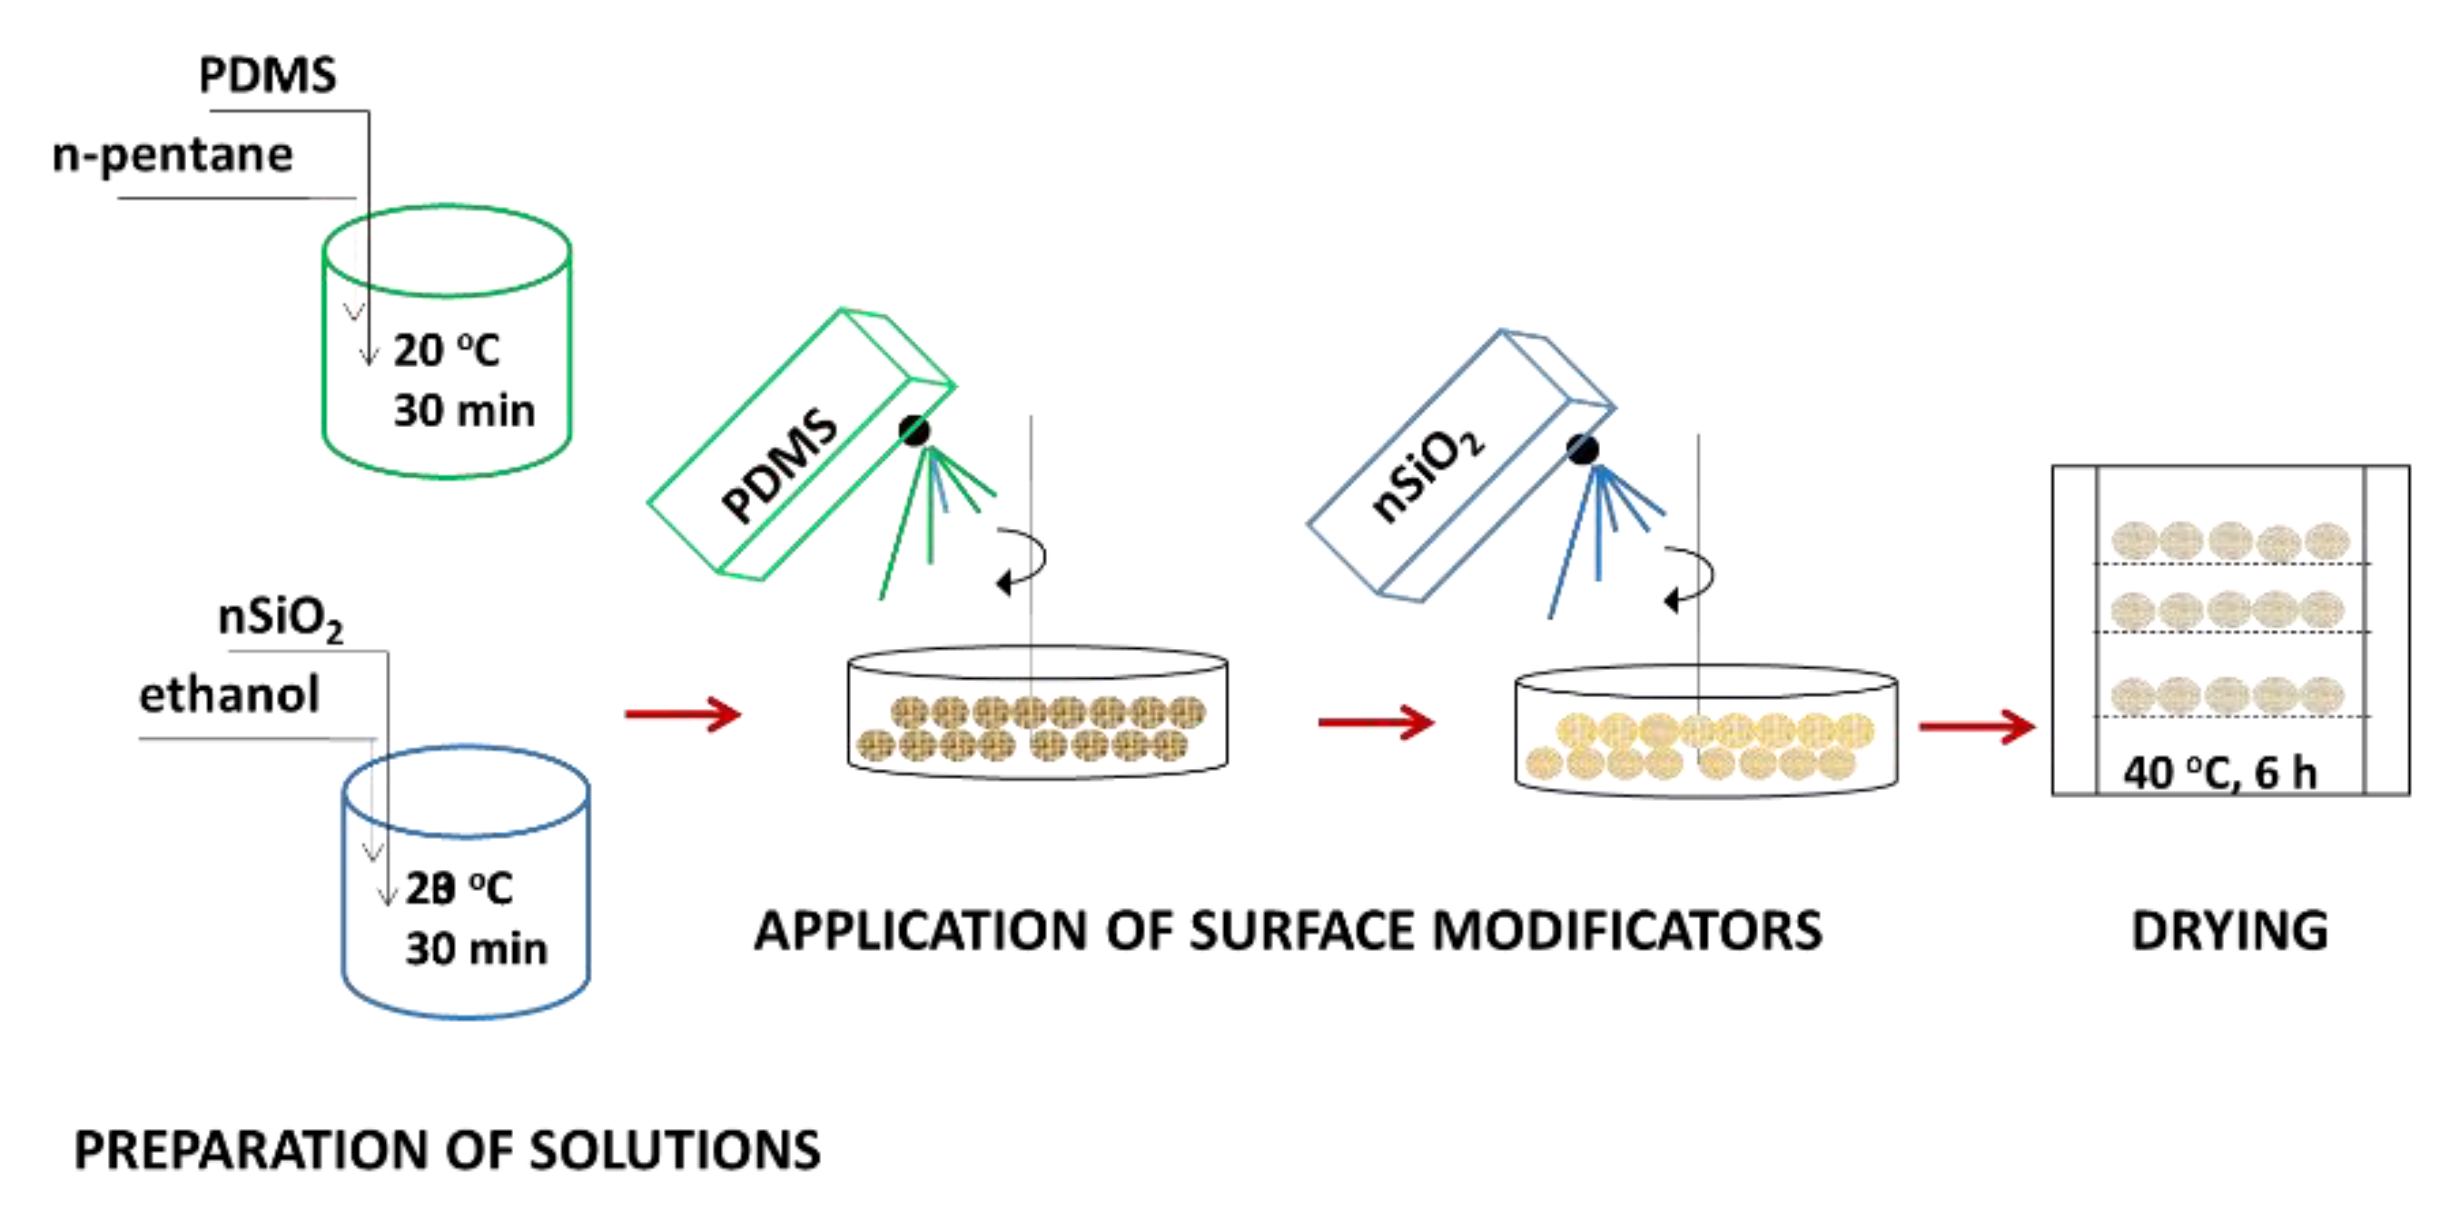
Figure 1. Scheme of preparation of hydrophobized pine sawdust.
Energies 13 01064 g001
Figure 2. Visualization of the distribution of silica nanoparticles onto the PDMS (polydimethylsiloxane)-coated pith.
Energies 13 01064 g002
Figure 3. (a) Identification of BTX (benzene, toluene, xylenes) components on the whole oil chromatogram; (b) whole oil gas chromatogram.
Energies 13 01064 g003
Figure 4. SEM images of raw sawdust at magnifications of (a) 500×; (b) 1000×; (c) 3000× and modified sawdust at magnification of (d) 500×; (e) 1000×; (f) 3000×.
Energies 13 01064 g004
Figure 5. The UV-Vis spectrum of brine contaminated by crude oil (the most intense spectrum in red) and spectra of filtrates collected at different periods of time during filtration at a flow rate of 25 mL/min.
Energies 13 01064 g005
Figure 6. (a) Comparison of sorption performance of raw and modified sawdust at a flow rate of 50 mL/min; (b) effect of flow rates on the adsorbed quantity of BTX onto a modified sawdust fixed-bed column.
Energies 13 01064 g006
Figure 7. (a) Predicted breakthrough curves of BTX adsorption onto raw sawdust at flow rate of 50 mL/min; (bd) experimental and calculated breakthrough curves for modified sawdust at flow rate of 50, 25, and 10 mL/min, respectively.
Energies 13 01064 g007
Table 1. Basic properties of crude oil.
ParameterMethodValue
Density, g/LASTM D2870.827
Viscosity at 293 K, mm2/sASTM D4453.05
Acid number, mg KOH/gASTM D9740.02
Sulfur content, % wtASTM D65600.09
Initial boiling point, KASTM D86331
Aromatic component, g/L
Benzene 0.219
Toluene 0.191
p-xylene 0.087
m-xylene 0.257
o-xylene 0.075
Total BTX 0.829
Table 2. Yoon–Nelson, Adams–Bohart, Clark, and Belter model parameters for BTX breakthrough curves.
System1234
Model parametersRaw sawdust Q = 10 mL/minModified sawdust Q = 10 mL/minModified sawdust Q = 25 mL/minModified sawdust Q = 50 mL/min
Yoon–Nelson
kYN, 1/min0.1990.0630.0540.203
τ , min−1.14127.77923.8749.473
chi20.0070.0760.1460.172
RSME0.0240.070.0960.086
Bohart–Adams
kBA, L/(g*min)0.0560.0840.0840.217
No, g/L3.3672.0374.6133.683
chi20.0210.0390.1060.042
RSME0.0410.0460.080.051
Clark
kC, -2.74769.76735.78291.899
rC, 1/min0.2250.0960.0860.306
chi20.4921.5370.130.178
RSME0.1870.3740.0910.079
Belter
τ , min0.22327.70323.7869.415
σ, -31.6460.9261.2470.859
chi20.0150.0740.1460.167
RSME0.0350.0690.0950.084