The Influence of the Injected Water on the Underground Coalbed Methane Extraction

Abstract
:
1. Introduction
2. Method
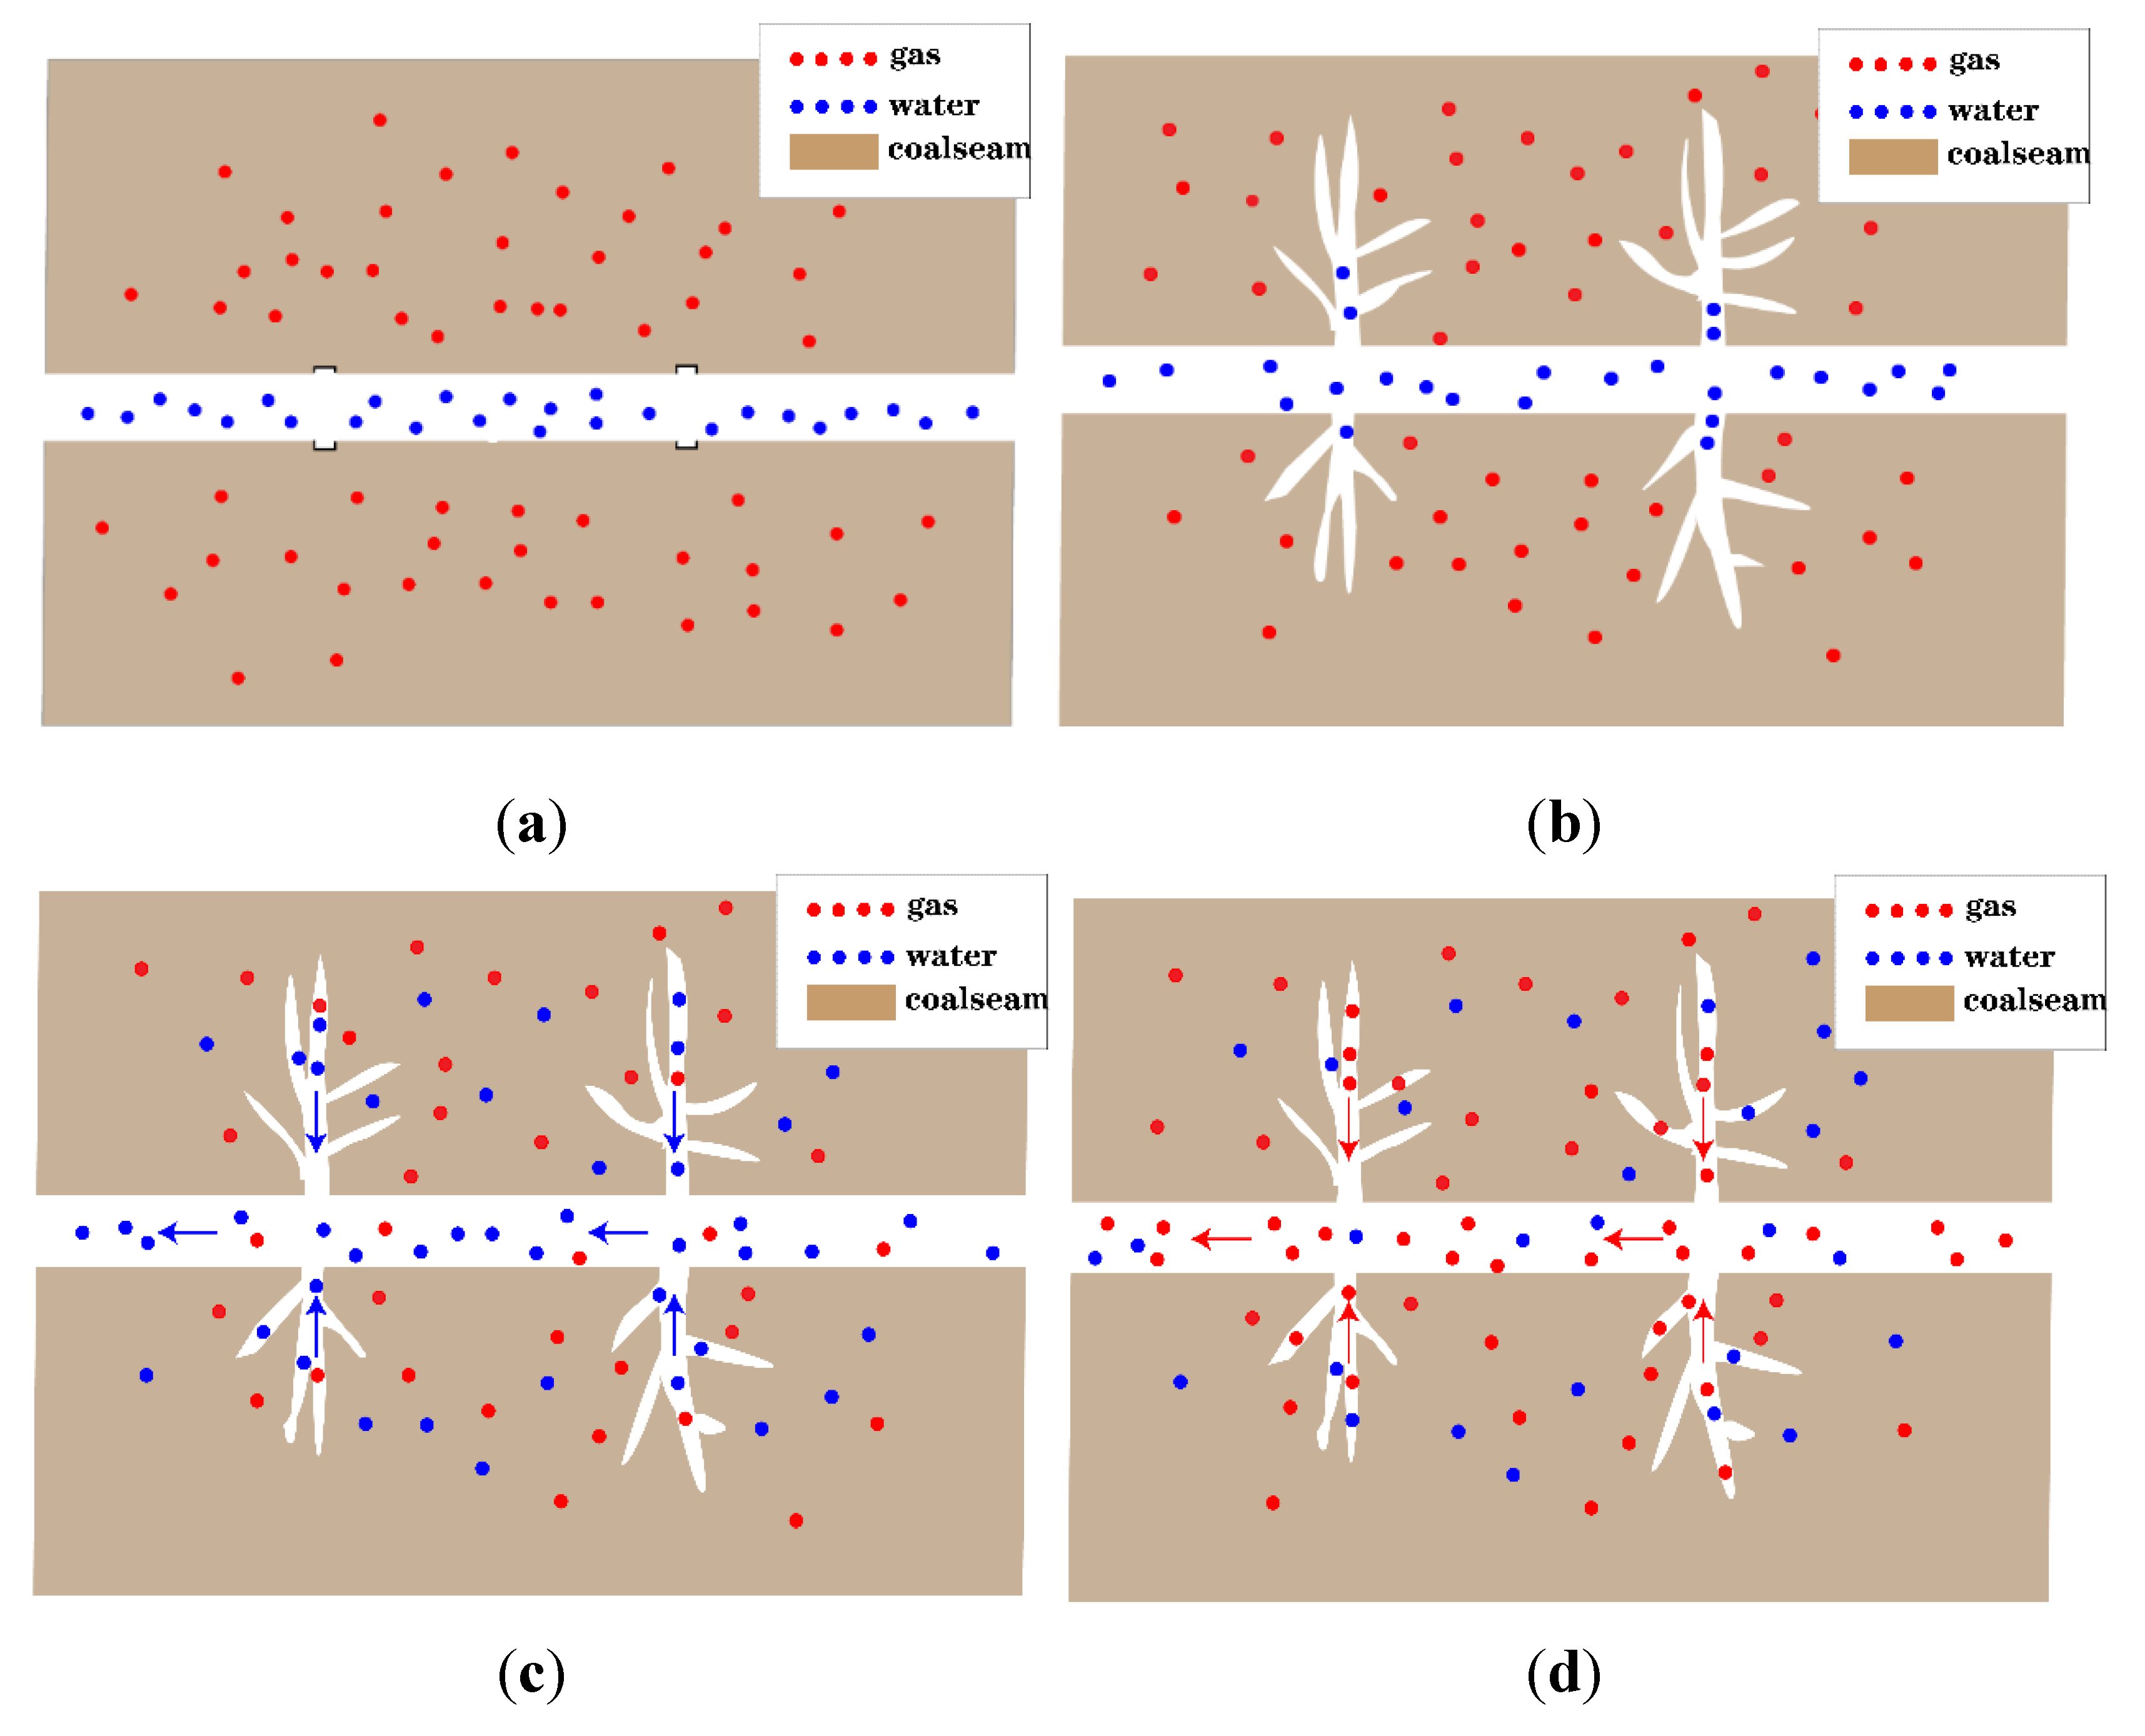
2.1. Model Concept
2.2. Numerical Analysis
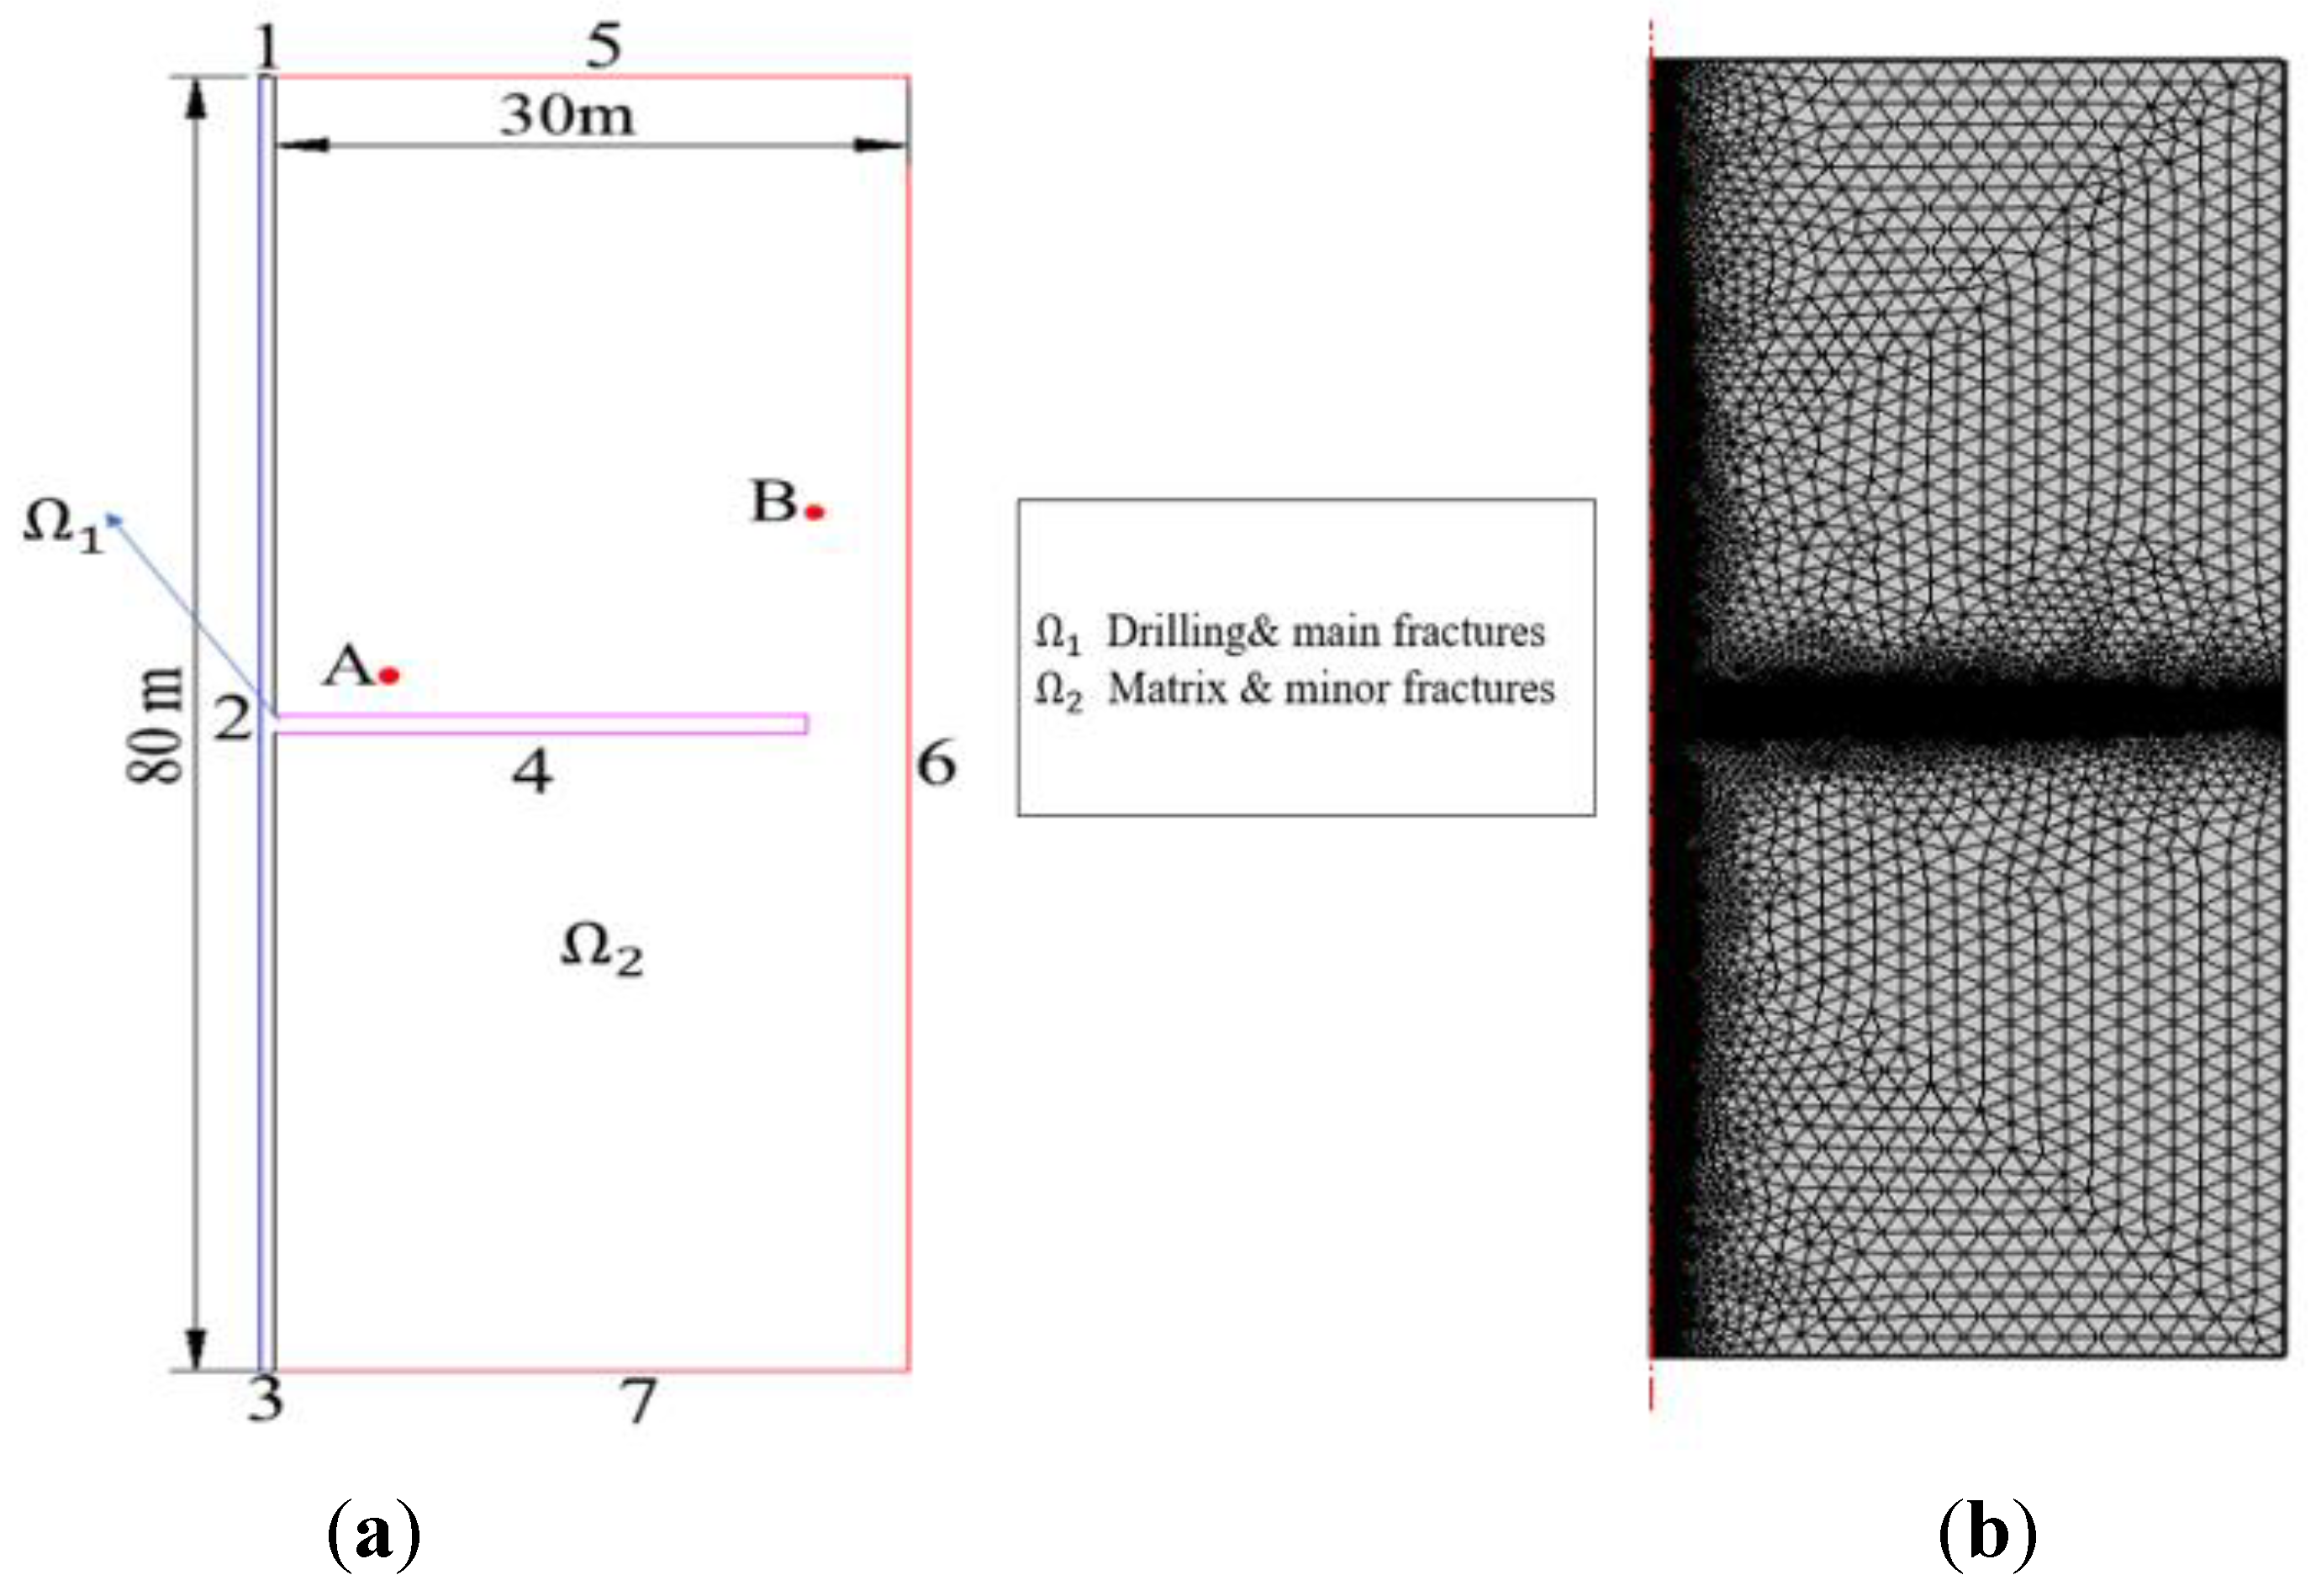
2.3. Model Establishment
- P1 = Pin (boundary 1)
- P3 = Pin (boundary 3)
- Pw = Pwf (boundary 4)
- Pg = Pgf (boundary 4)
- P = Ps (boundaries 5, 6 and 7)
- n * u = 0 (boundary 7)
2.4. Field Verification
3. Results and Discussion
3.1. Field Verification Results
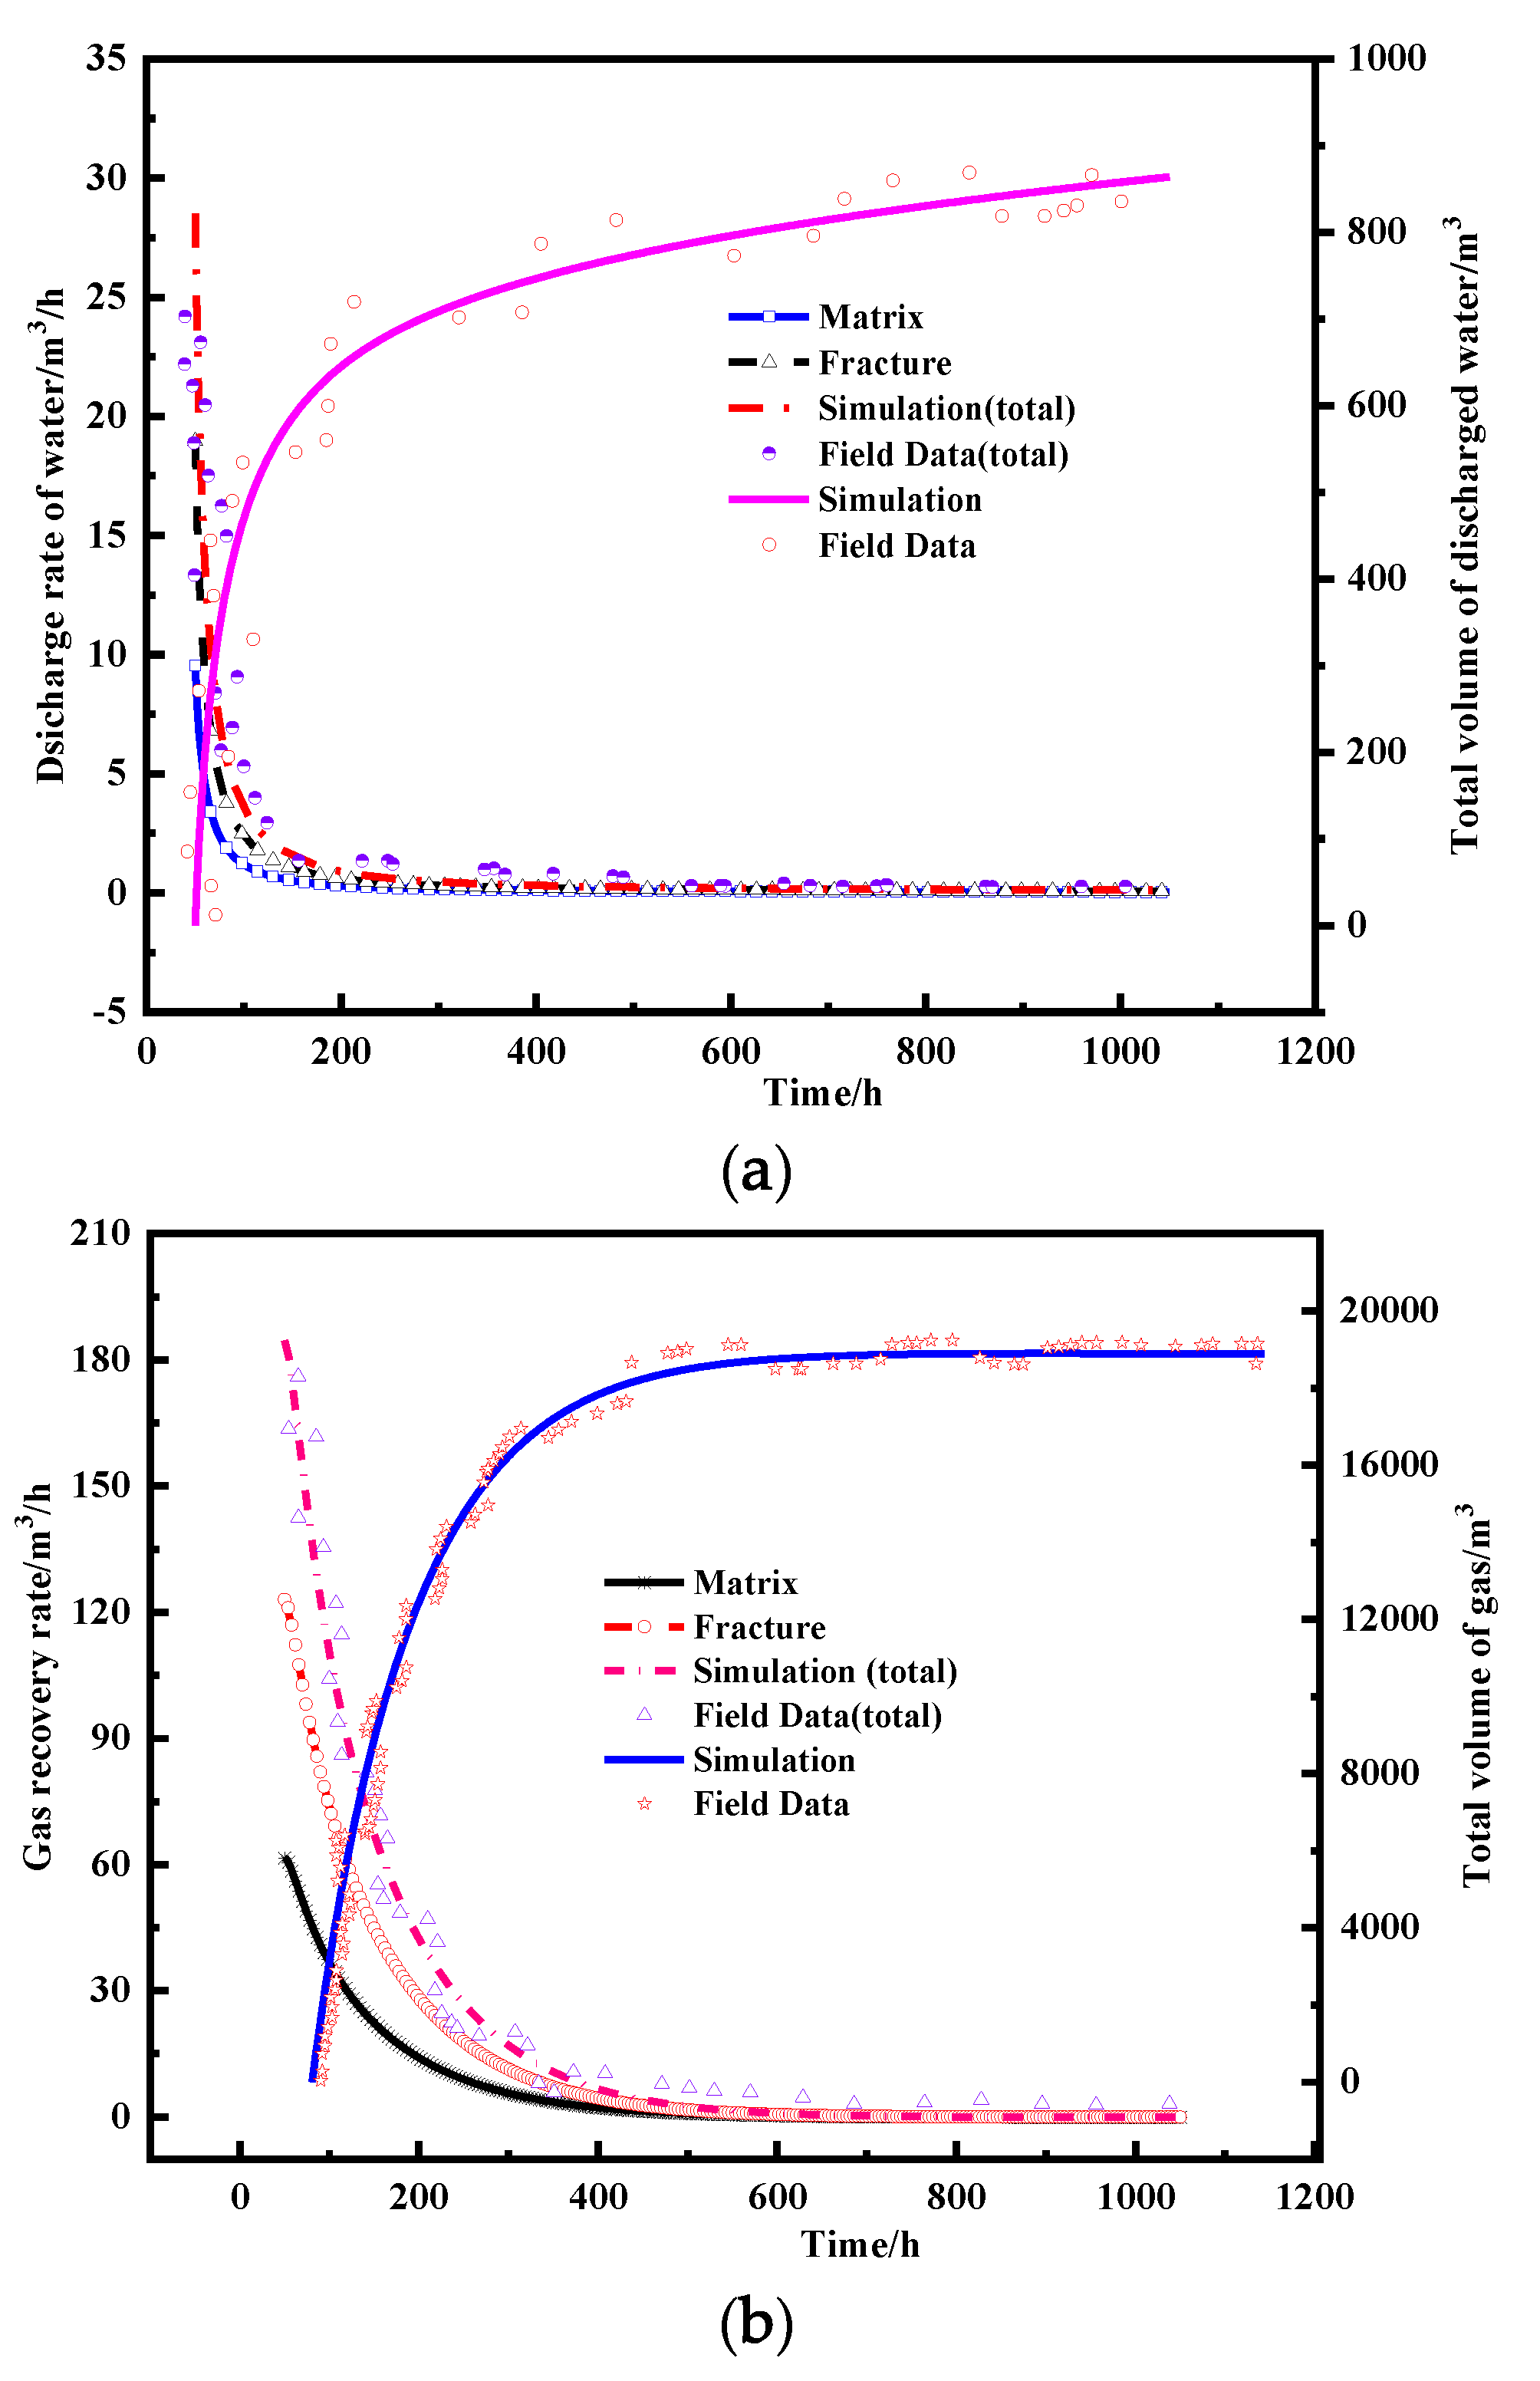
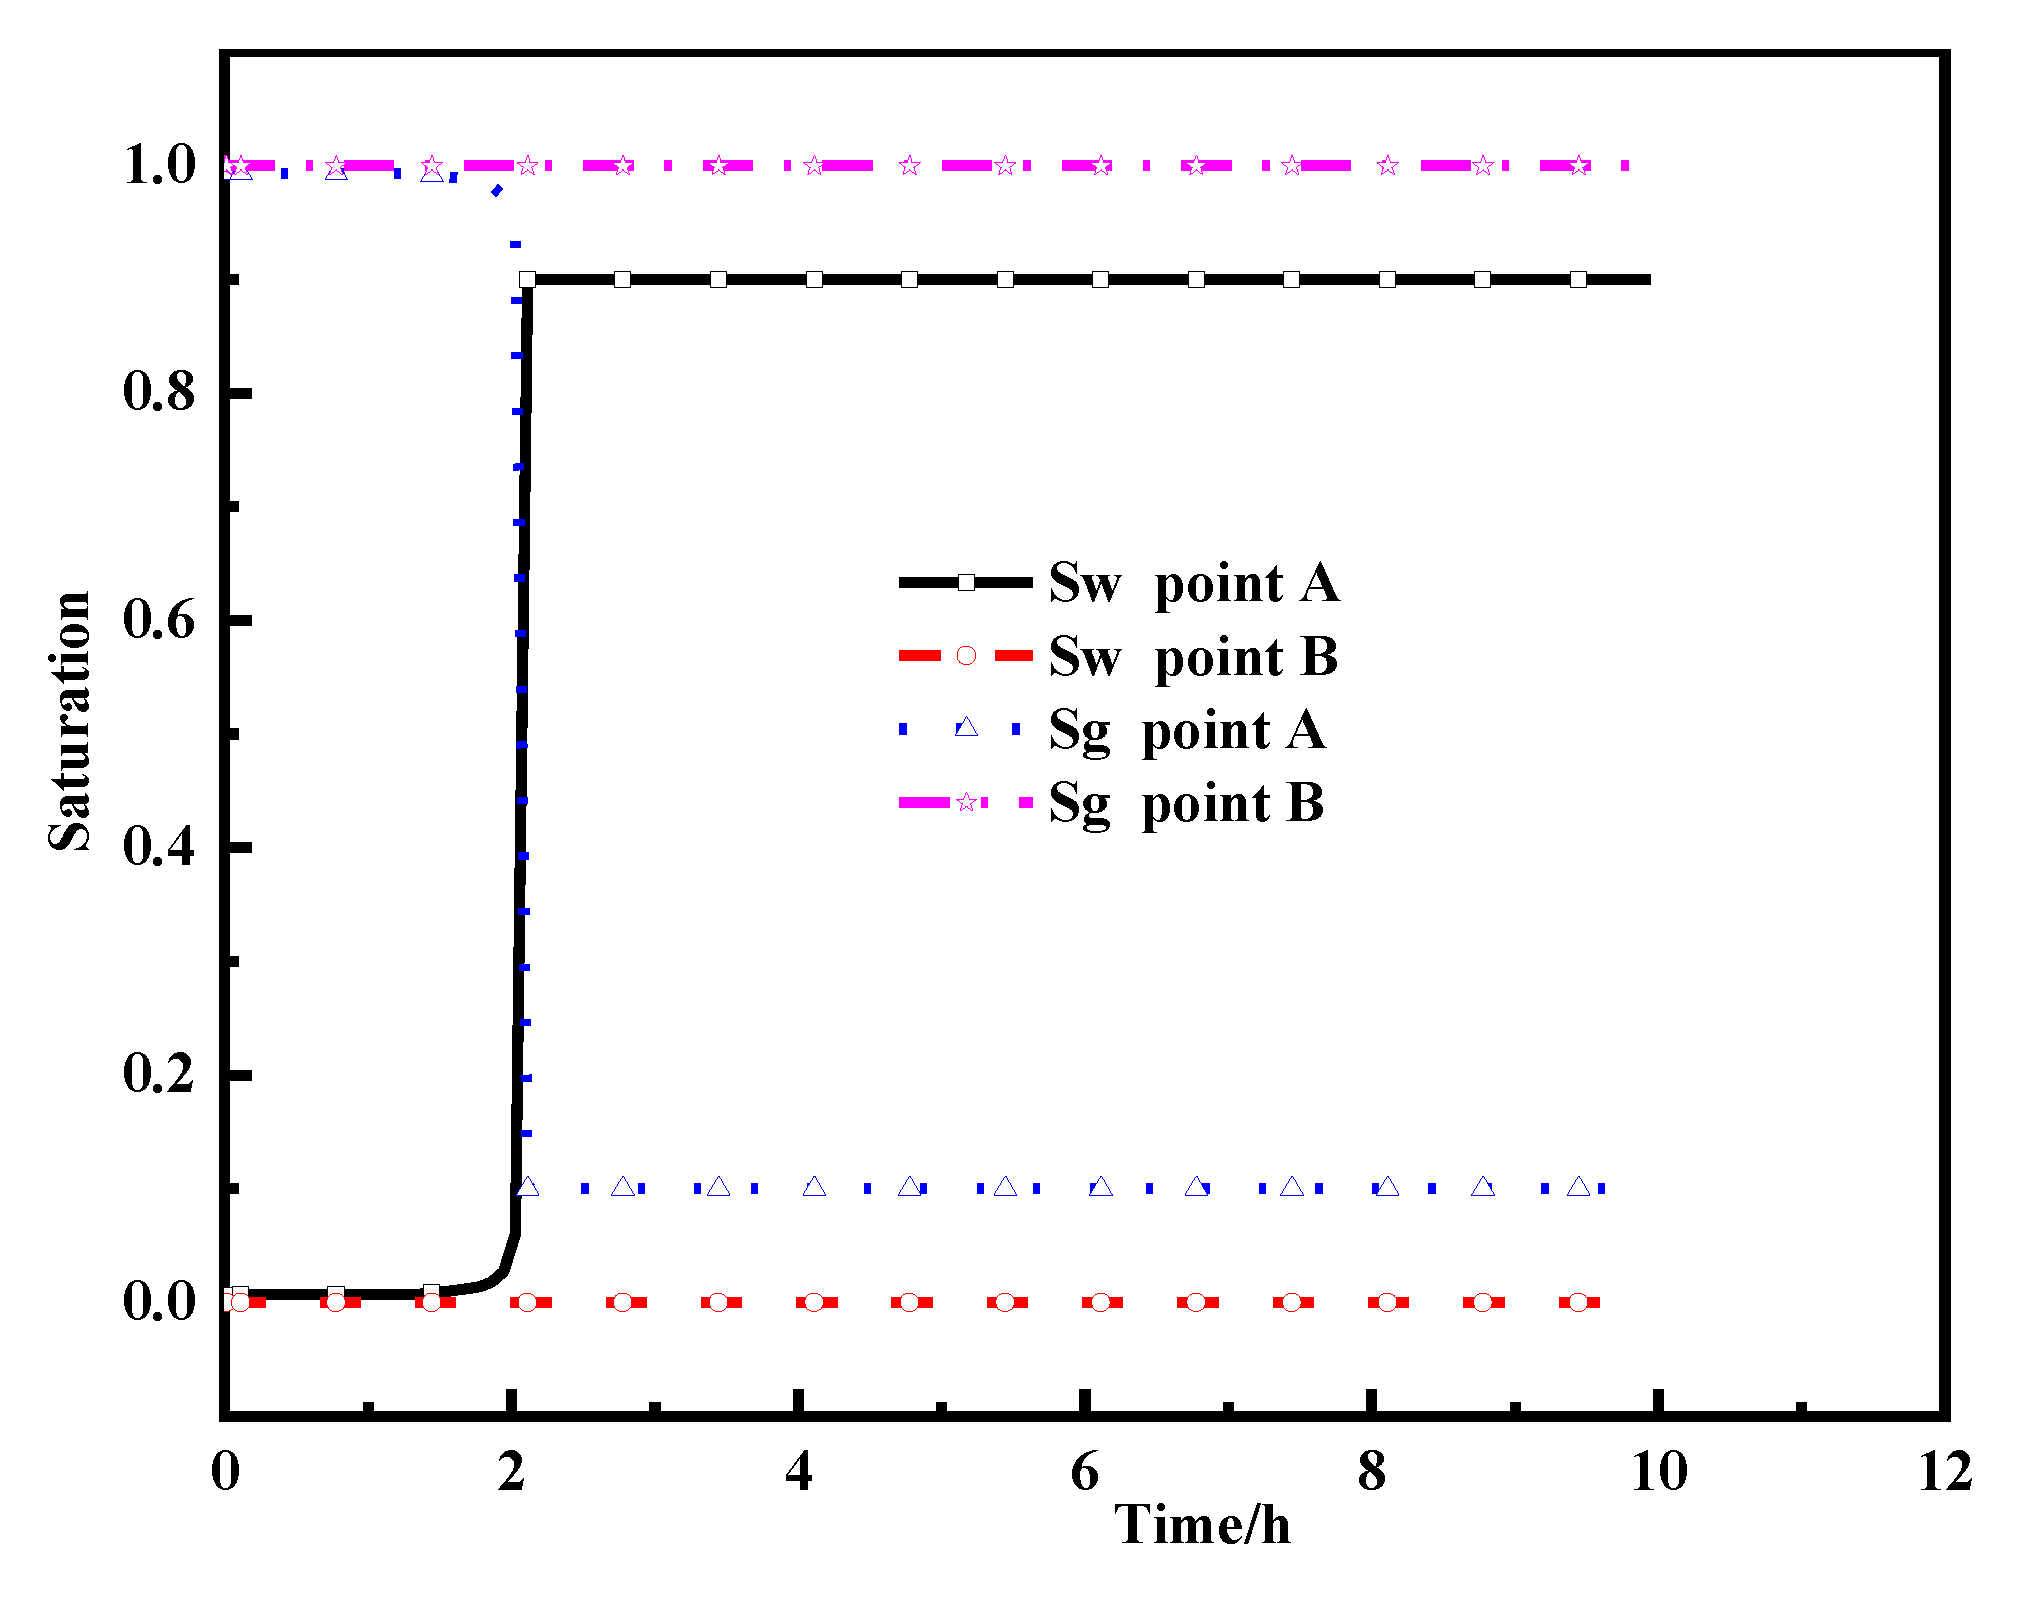
3.1.1. Water Flowback Data
3.1.2. Gas Flow Rate
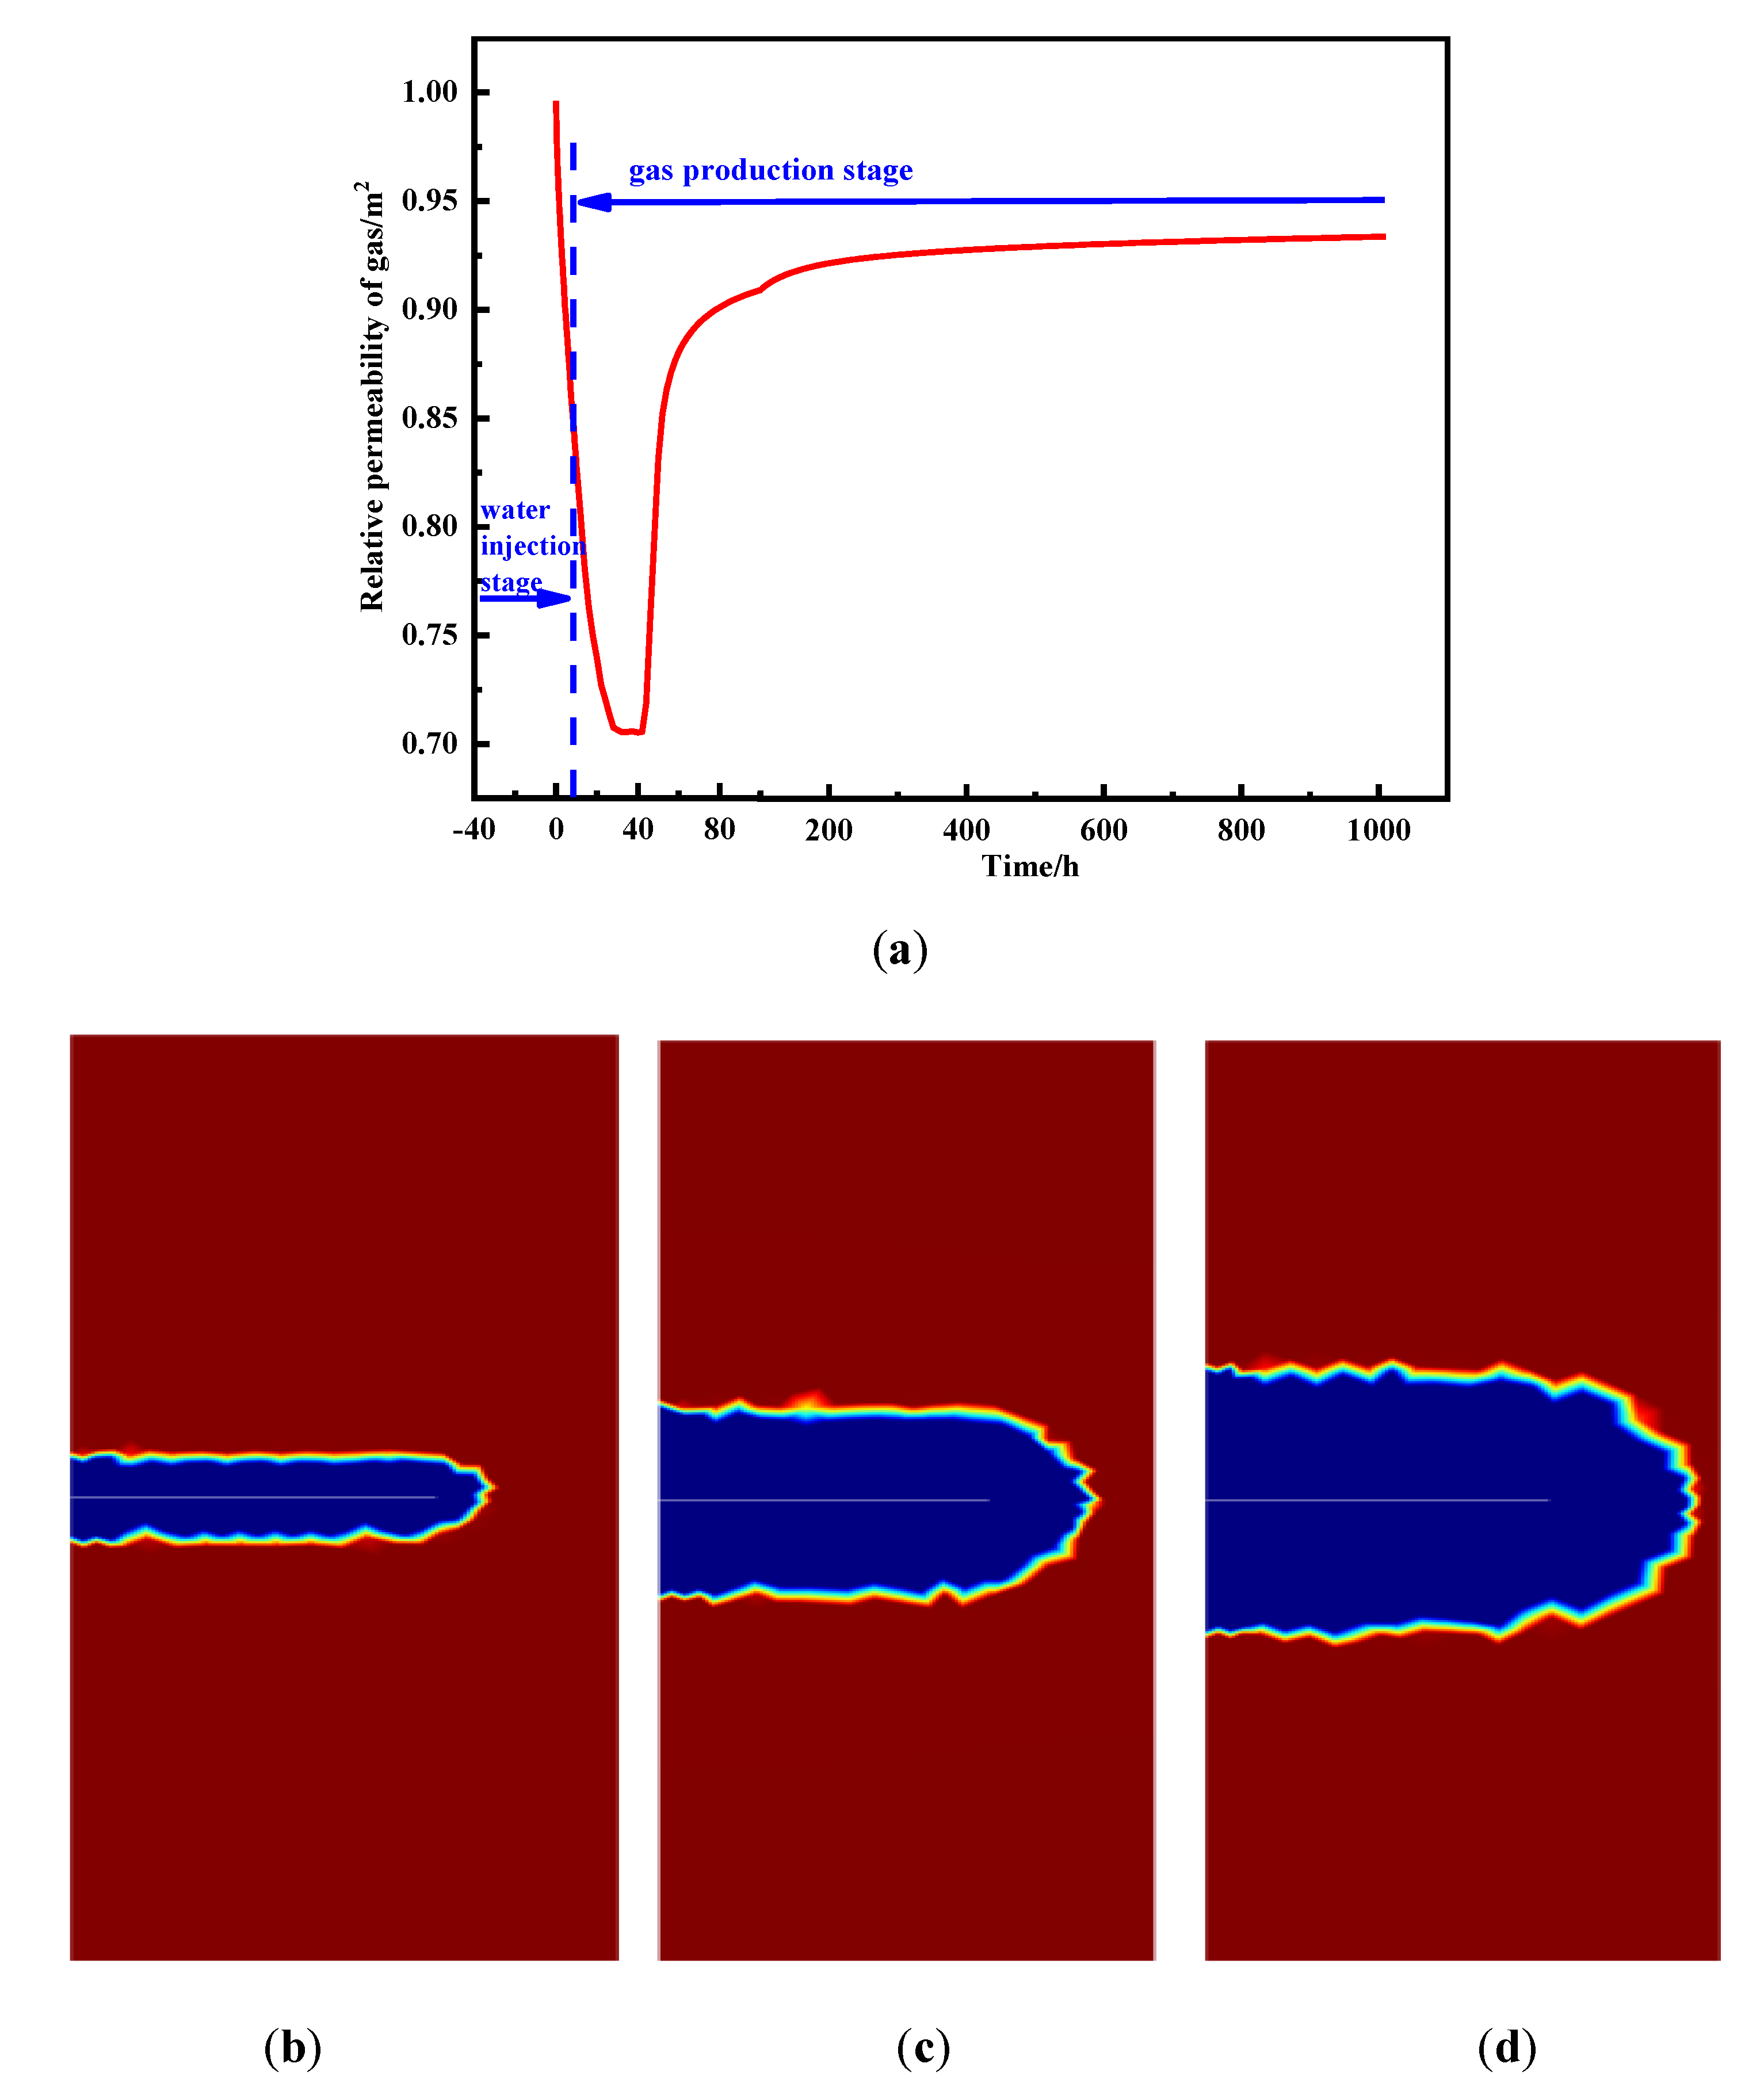
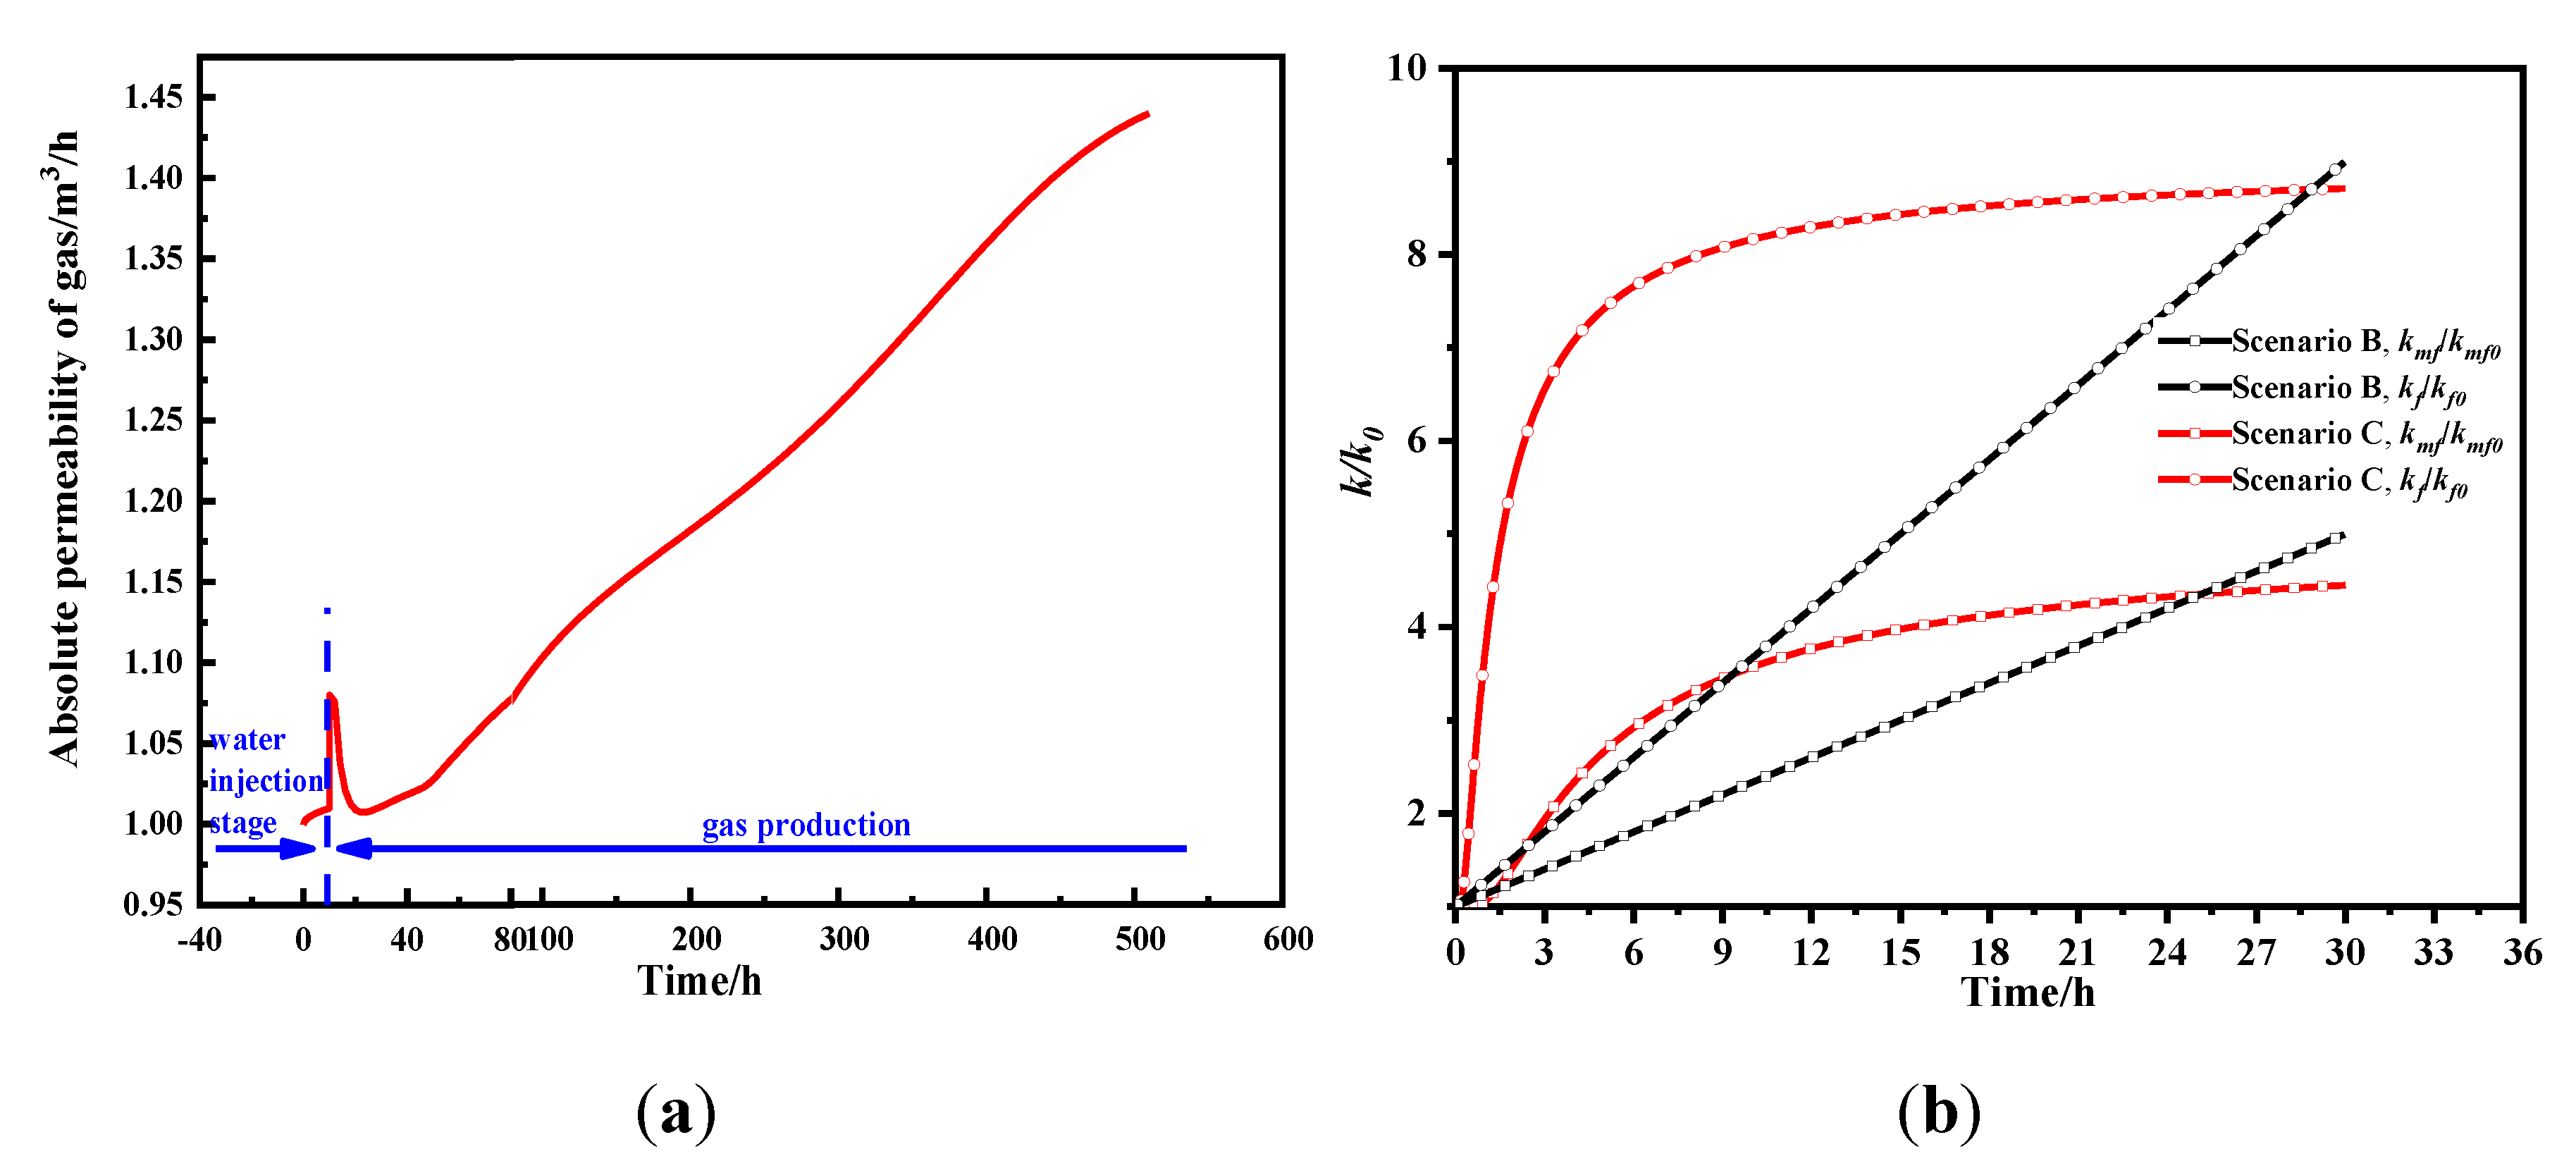
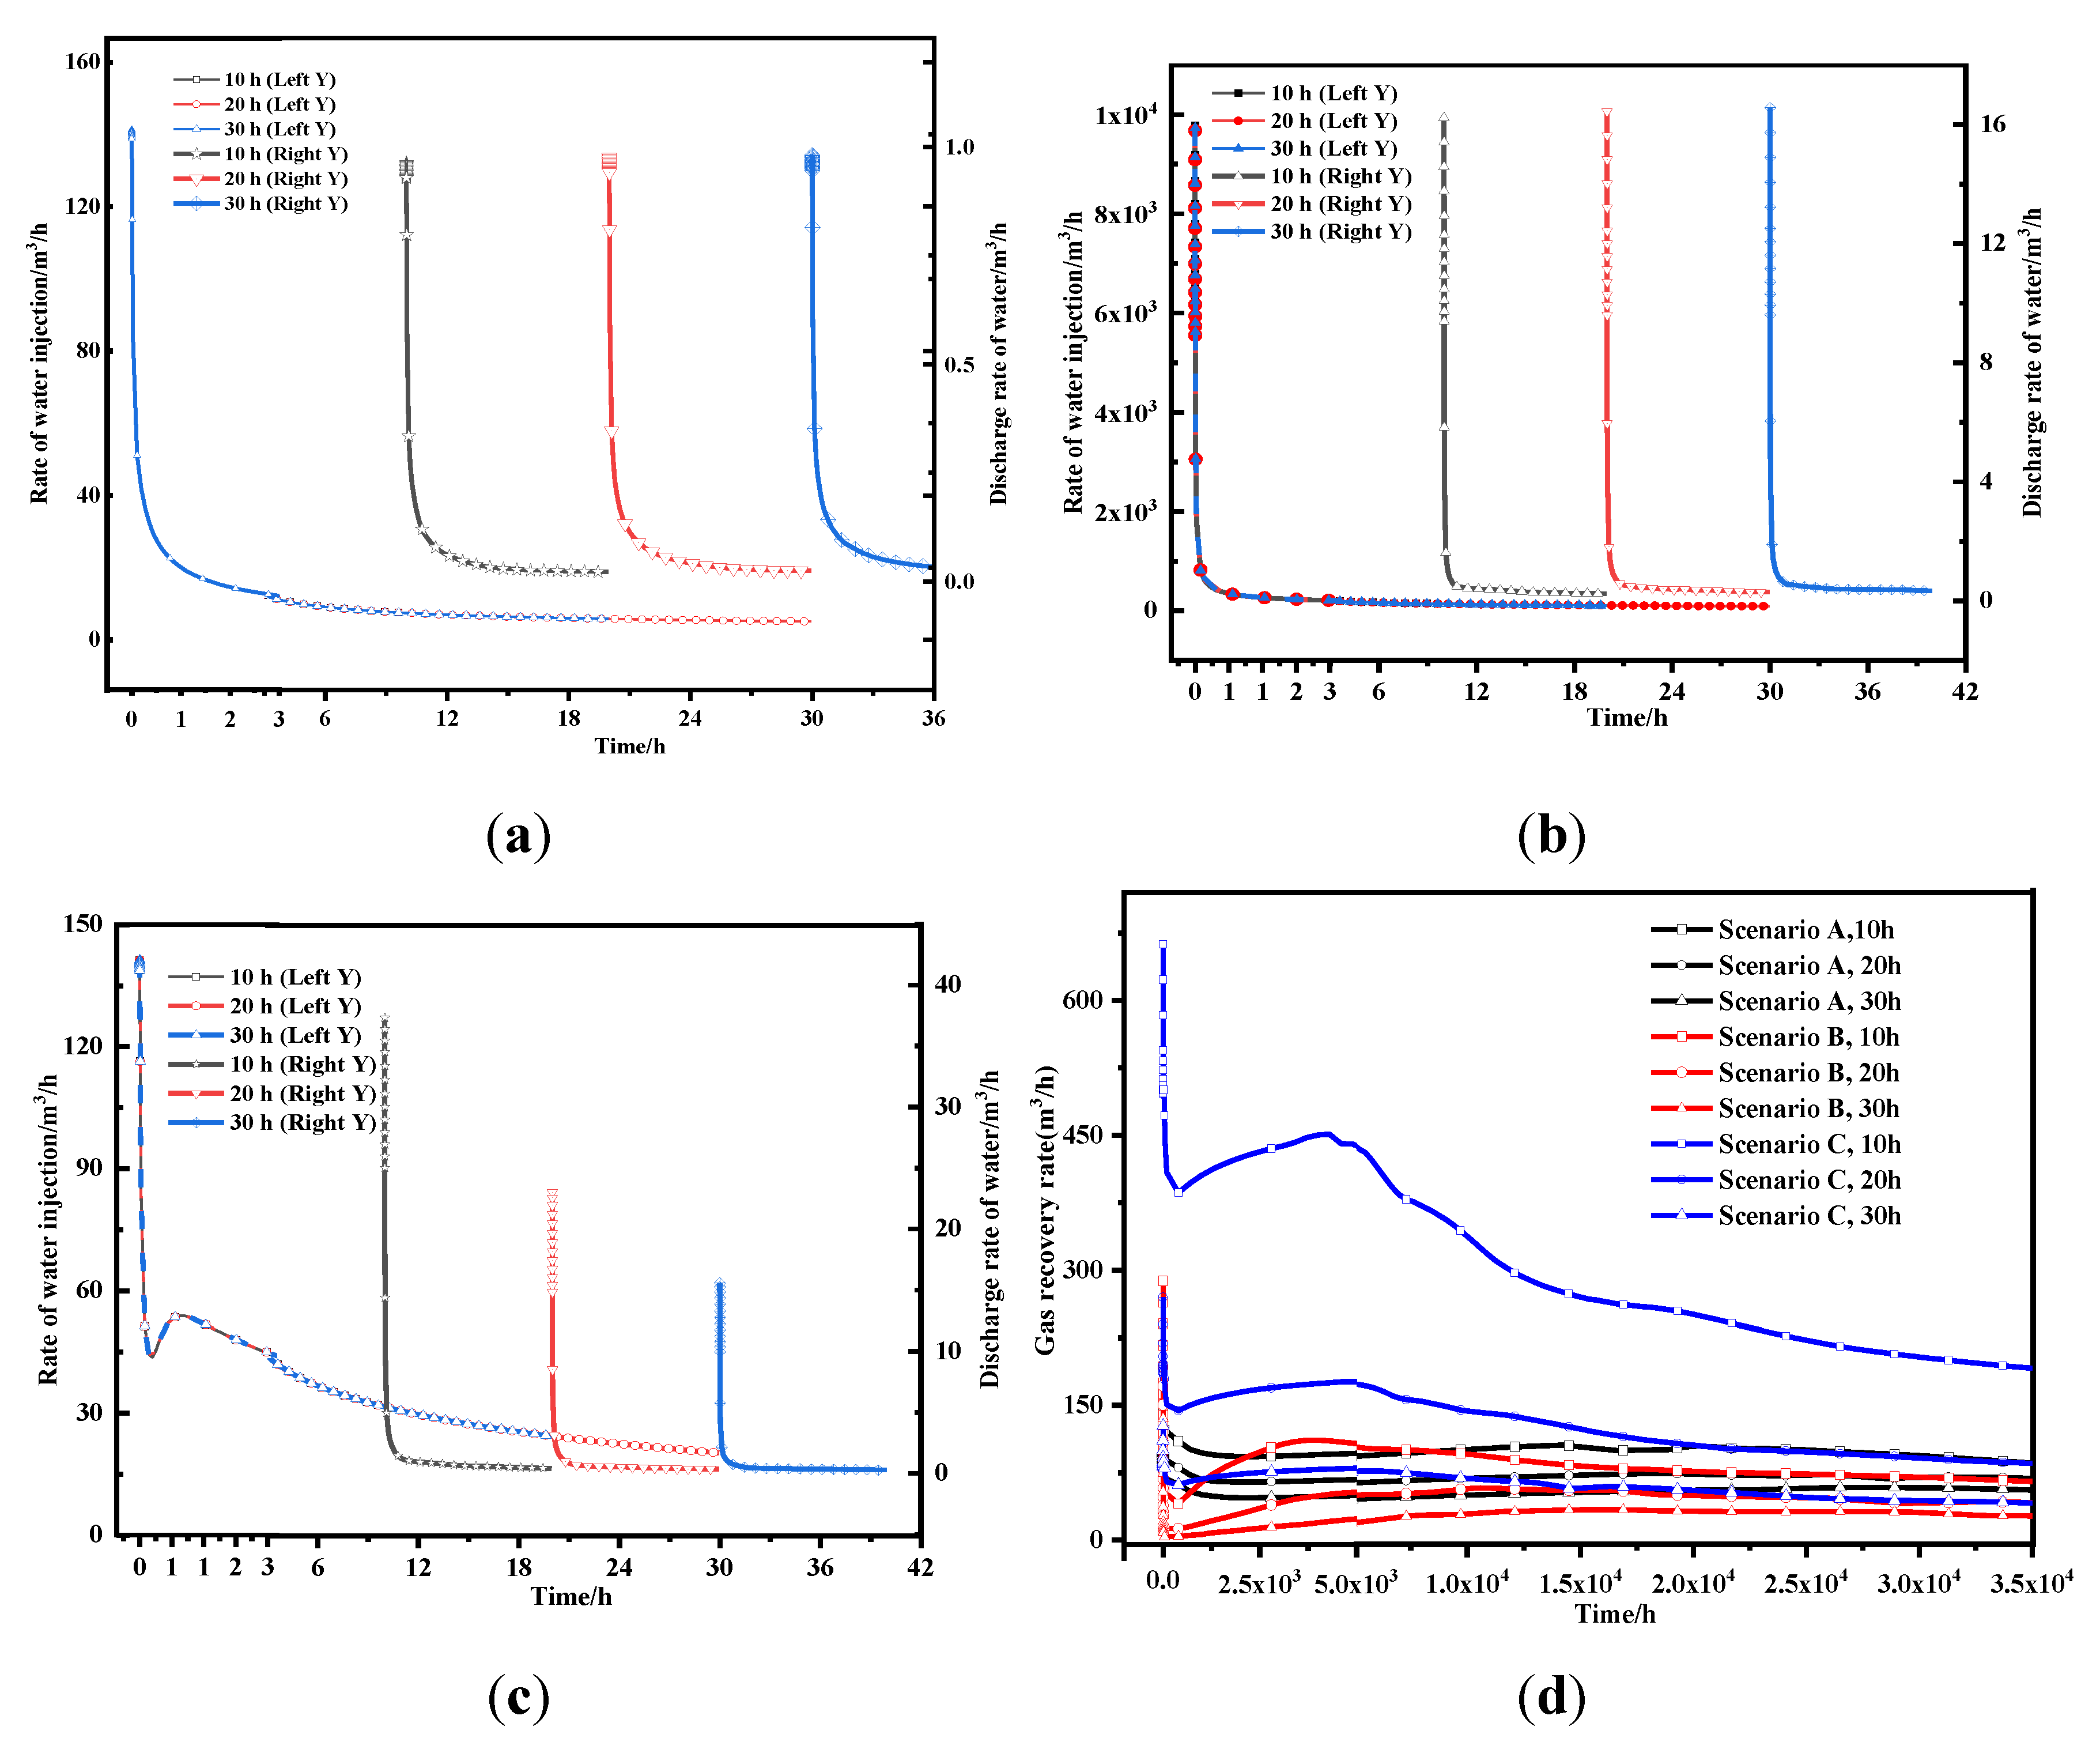
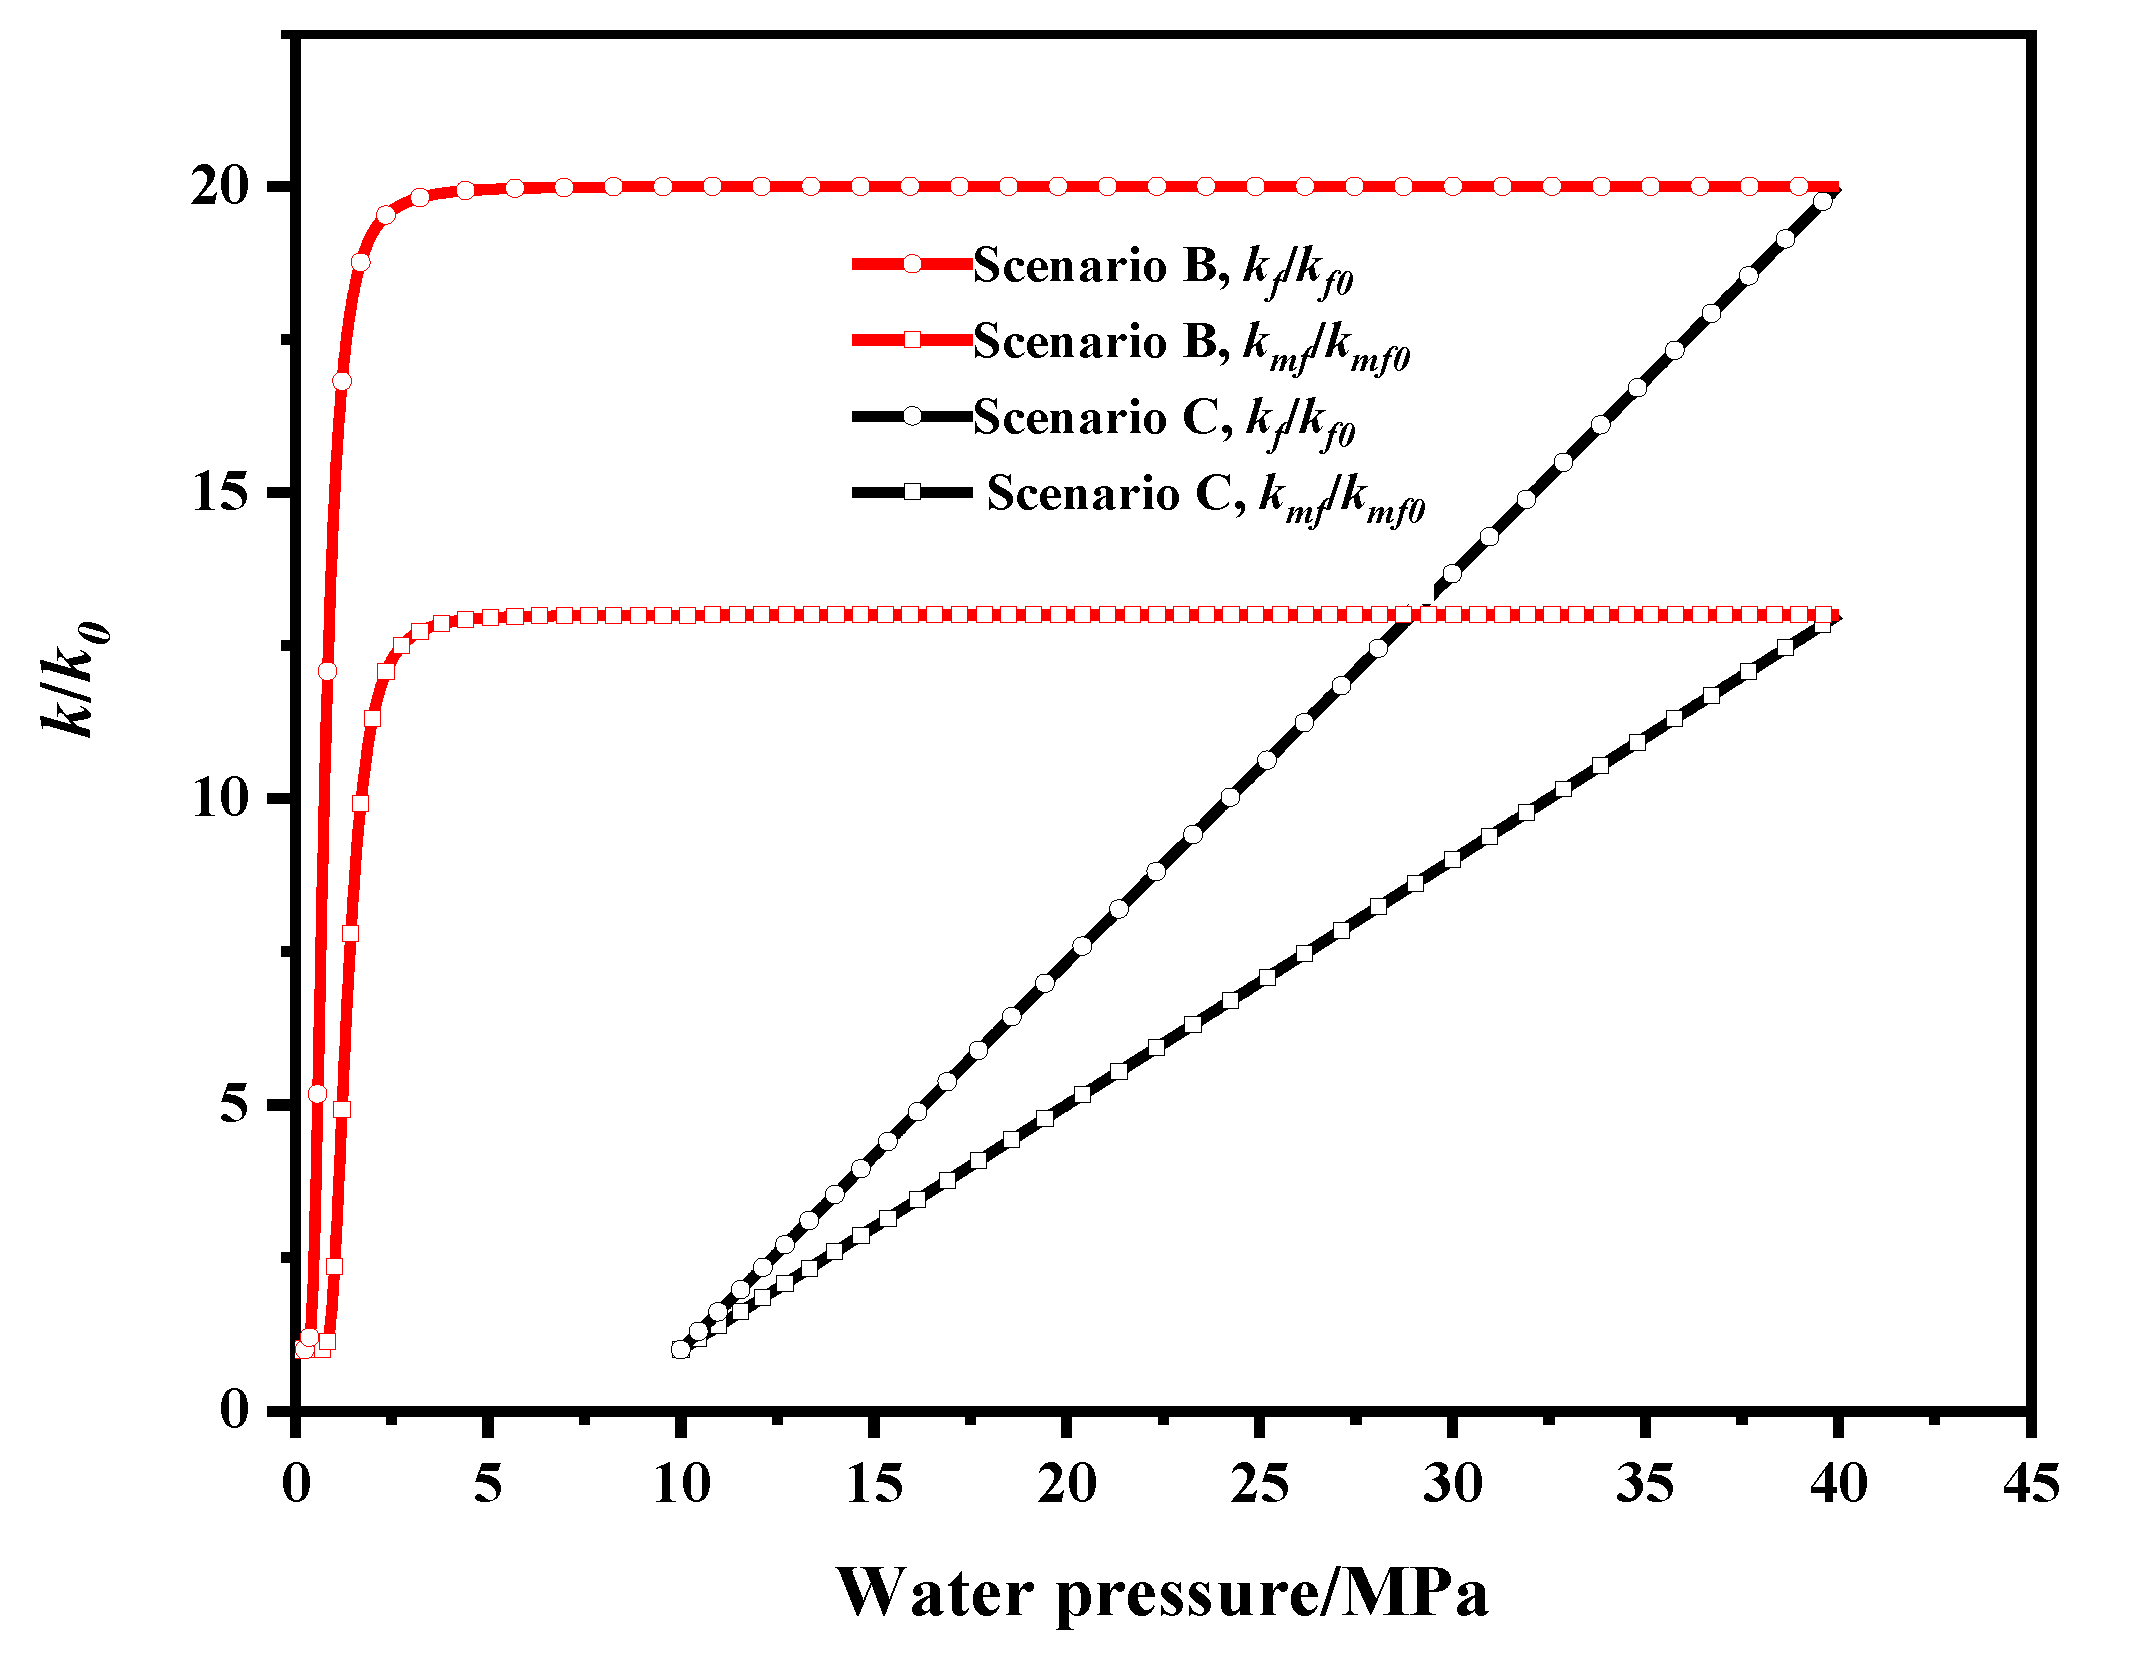
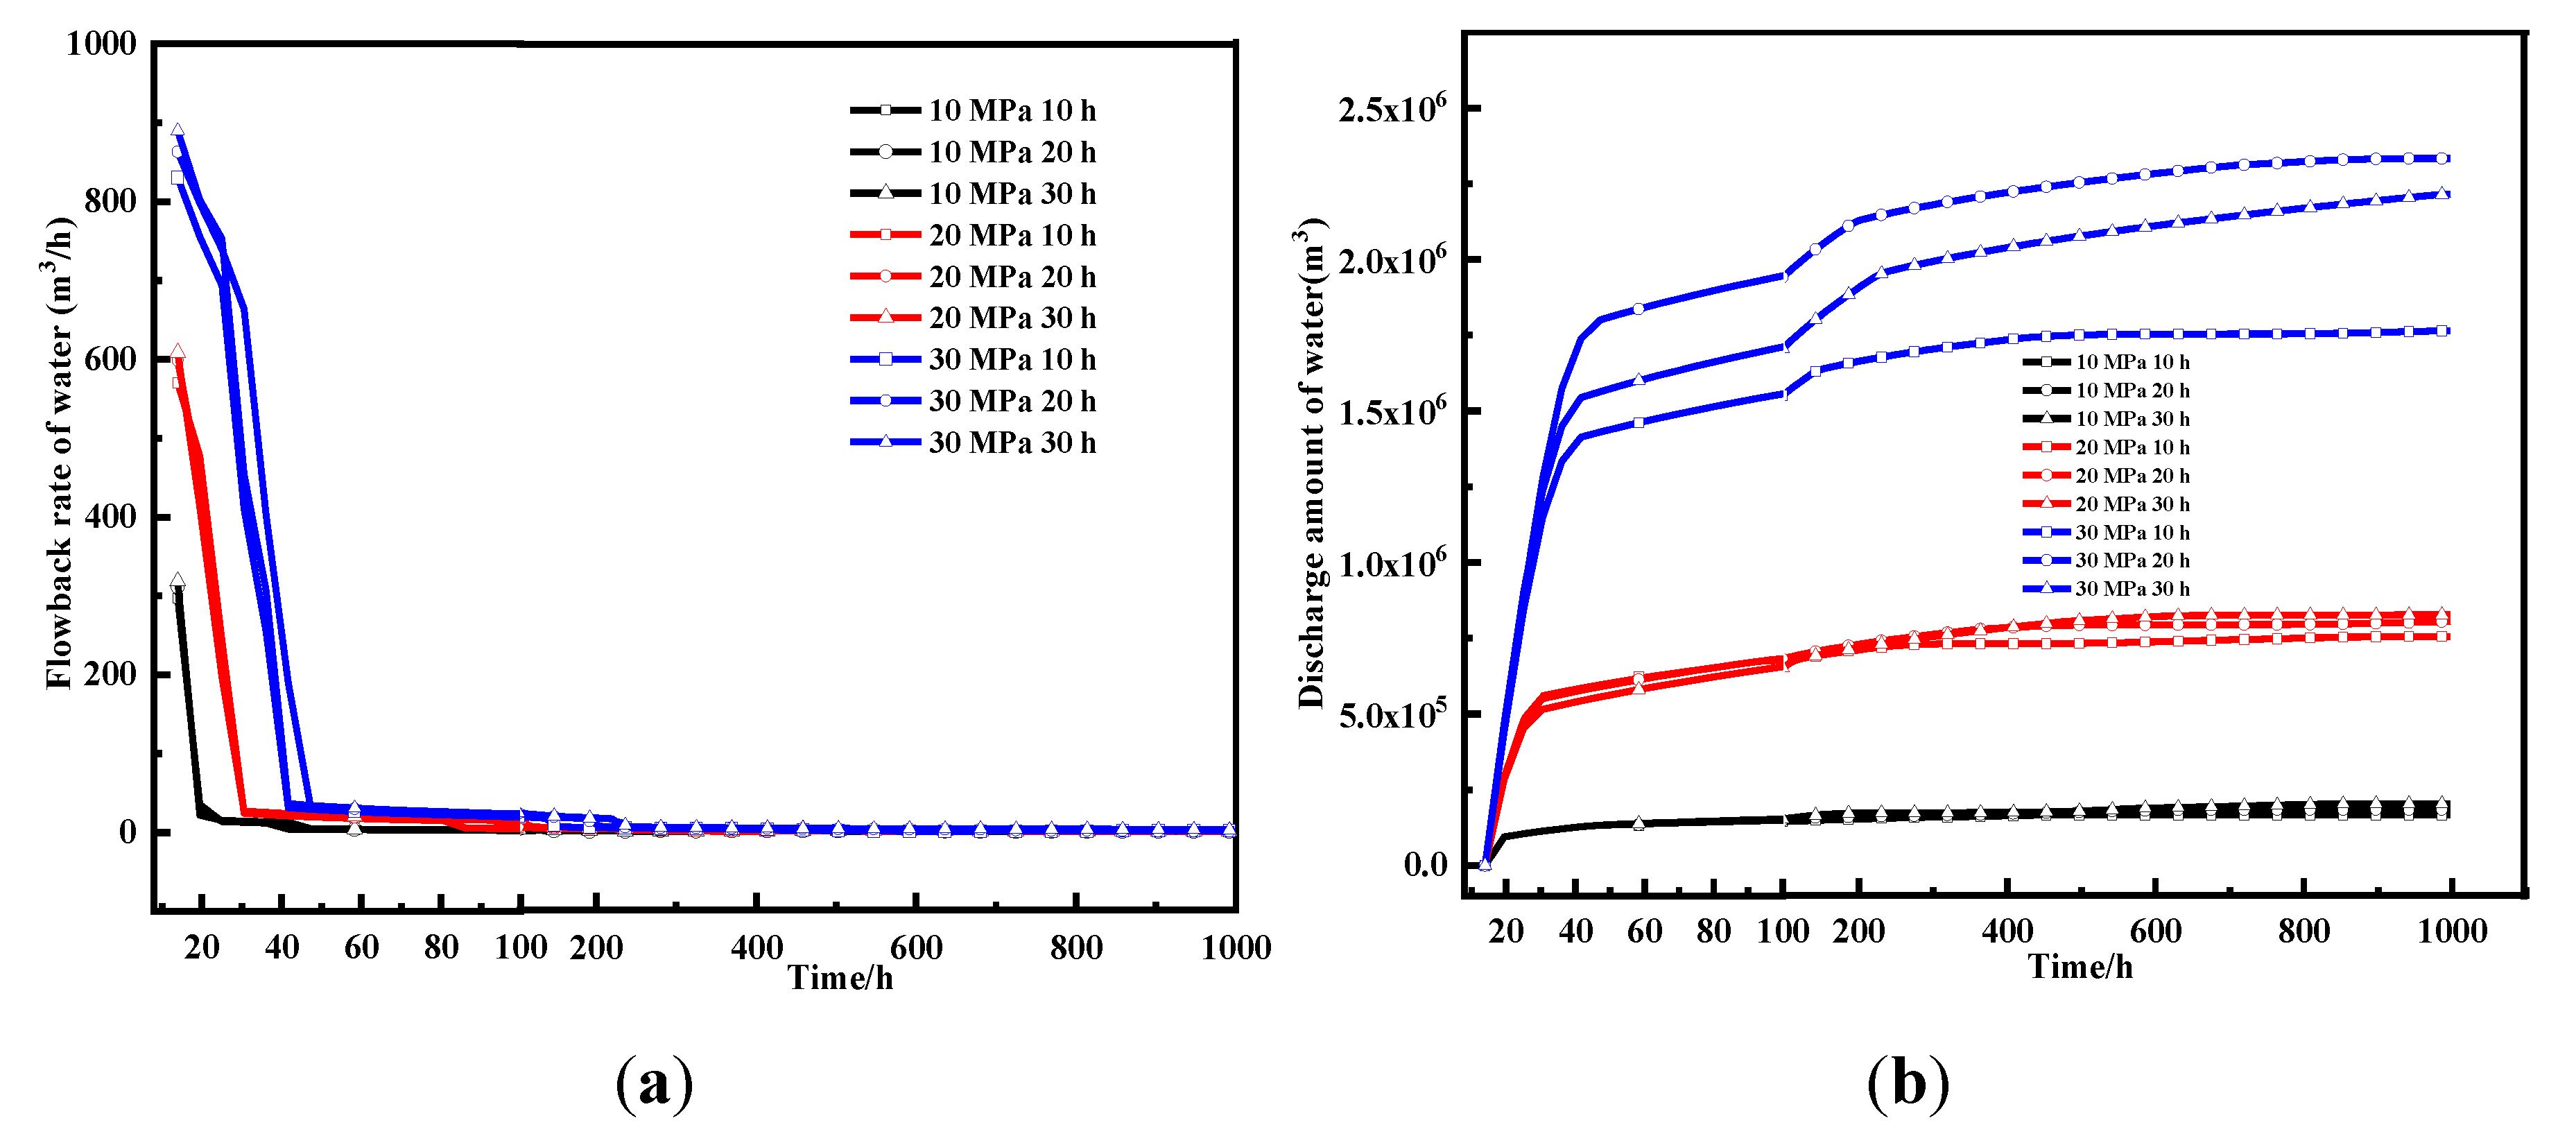
3.2. Simulation Results
4. Conclusions
- The evolutions of relative and intrinsic permeability during both water injection and gas production stages are analyzed. The relative gas permeability declines in the water injection process because of water imitation and then rebounds during the gas production stage. The intrinsic permeability of the fracture system increases in the water injection process and is determined by the competing mechanism between effective stress and gas desorption in the gas production stage.
- Regarding water injection time and pressure impacts, the longer water injection time and larger injection pressure brings larger intrinsic permeability increase and also significant decrease in gas relative permeability. Furthermore, there is a critical injection time beyond which water cannot go further while a critical injection pressure exists above which the hydraulic pressure would impair the gas flow.
- To maximize gas extraction efficiency; a suitable injection time and injection pressure combination can be designed in the presented simulation, where the injection time should be short to prevent water imitation while the injection pressure should be in the middle scale once beyond the strength of the coal.
Author Contributions
Funding
Conflicts of Interest
References
- Yin, S.F.; Ma, H.F.; Cheng, Z.H.; Zou, Q.L.; Li, Y.M.; Jia, H.S.; Zhang, K.X. Permeability enhancement mechanism of sand-carrying hydraulic fracturing in deep mining: A case study of uncovering coal in cross-cut. Energy Sci. Eng. 2019, 7, 1867–1881. [Google Scholar]
- Mohsen, S.M. Multiphysics of carbon dioxide sequestration in coalbeds: A review with a focus on geomechanical characteristics of coal. J. Rock Mech. Geotech. Eng. 2016, 8, 93–112. [Google Scholar]
- Karacan, C.Ö. Coal mine methane: A review of capture and utilization practices with benefits to mining safety and to greenhouse gas reduction. Int. J. Coal Geol. 2011, 86, 121–156. [Google Scholar] [CrossRef]
- Ai, C.; Li, X.X.; Zhang, J.; Jia, D.; Tan, W. Experimental investigation of propagation mechanisms and fracture morphology for coalbed methane reservoirs. Pet. Sci. 2018, 15, 815–829. [Google Scholar] [CrossRef] [Green Version]
- Bahrami, H.; Rezaee, R.; Clennell, B. Water blocking damage in hydraulically fractured tight sand gas reservoirs: An example from Perth basin, Western Australia. J. Pet. Sci. Eng. 2012, 88–89, 100–106. [Google Scholar] [CrossRef]
- Xu, Y.; Lei, Q.; Chen, M.; Wu, Q.; Yang, N.Y.; Weng, D.W.; Li, D.Q.; Jiang, H. Progress and development of volume stimulation techniques. Pet. Explor. Dev. 2018, 45, 932–947. [Google Scholar] [CrossRef]
- Lu, W.Y.; Huang, B.X.; Zhao, X.L. A review of recent research and development of the effect of hydraulic fracturing on gas adsorption and desorption in coal seams. Adsorpt. Sci. Technol. 2019, 37, 509–529. [Google Scholar] [CrossRef] [Green Version]
- Yin, S.X.; Zhang, J.C.; Liu, D.M. A study of mine water inrushes by measurements of in situ stress and rock failures. Nat. Hazards 2015, 79, 1961–1979. [Google Scholar] [CrossRef]
- Cheng, L. Research on hydraulic technology for seam permeability enhancement in underground coal mines in China. Energies 2018, 11, 427. [Google Scholar] [CrossRef] [Green Version]
- Wang, G.; Liu, Y.; Xu, J. Short-term failure mechanism triggered by hydraulic fracturing. Energy Sci. Eng. 2019, 9, 1–10. [Google Scholar] [CrossRef]
- Yin, B.T.; Li, X.F.; Liu, G. A mechanistic model of heat transfer for gas–liquid flow in vertical wellbore annuli. Pet. Sci. 2018, 15, 135–145. [Google Scholar] [CrossRef] [PubMed] [Green Version]
- Zhang, H.W.; Cheng, Y.F.; Li, Q.C.; Yan, C.L.; Han, X. Numerical Analysis of Wellbore Instability in Gas Hydrate Formation During Deep-Water Drilling. J. Ocean Univ. China 2018, 17, 8–16. [Google Scholar] [CrossRef]
- Cai, J.; Gu, S.; Wang, F. Decreasing coalbed methane formation damage using microfoamed drilling fluid stabilized by silica nanoparticles. J. Nanomater. 2016, 10, 1–11. [Google Scholar] [CrossRef]
- Li, J.; Jia, B.; Zhang, C. Seepage mechanism technical practice of hydraulic fracturing of coal seam and auxiliary image simulation technology. J. Vis. Commun. Image Represent. 2019, 59, 244–252. [Google Scholar] [CrossRef]
- Fan, Z.; Geng, M.; Xiao, L. Experimental analysis of multiple factors on hydraulic fracturing in coalbed methane reservoirs. PLoS ONE 2018, 13, e195363. [Google Scholar]
- Chen, S.B.; Zhu, Y.M.; Liu, T.Y. Impact of the clear fracturing fluid on the adsorption properties of CBM. J. China Coal Soc. 2009, 34, 89–94. [Google Scholar] [CrossRef]
- Chen, S.K.; Yang, T.H.; Ranjith, P. Mechanism of the two-phase flow model for water and gas based on adsorption and desorption in fractured coal and rock. Rock Mech. Rock Eng. 2017, 50, 571–586. [Google Scholar] [CrossRef]
- Chen, X.J. Impact of Injected Water on Kinetics Characteristics of Methane Desorption in Coal. Ph.D. Thesis, China University of Ming Technology, Xuzhou, China, 2013. [Google Scholar]
- Gensterblum, Y.; Busch, A.; Krooss, B.M. Molecular concept and experimental evidence of competitive adsorption of H2O, CO2 and CH4 on organic material. Fuel 2014, 115, 581–588. [Google Scholar] [CrossRef]
- Van Genuchten, M.T. A closed-form equation for predicting the hydraulic of conductivity of unsaturated soils. Soil Sci. Soc. Am. J. 1980, 44, 892–898. [Google Scholar] [CrossRef] [Green Version]
- Hu, Y.; Li, M.; Hou, G. The role of water in methane adsorption and diffusion within nanoporous silica investigated by hyperpolarized 129Xe and 1H PFG NMR spectroscopy. Nano Res. 2018, 11, 360–369. [Google Scholar] [CrossRef]
- Iwanec, A.M.S.; Carter, J.P.; Hambleton, J.P. Geomechanics of subsidence above single and multi-seam coal mining. J. Rock Mech. Geotech. Eng. 2016, 8, 304–313. [Google Scholar] [CrossRef] [Green Version]
- Ma, T.; Rutqvist, J.; Oldenburg, C.M.; Liu, W.; Chen, J. Fully coupled two-phase flow and poromechanics modeling of coalbed methane recovery: Impact of geomechanics on production rate. J. Nat. Gas Sci. Eng. 2017, 45, 474–486. [Google Scholar] [CrossRef] [Green Version]
- Cui, G.; Liu, J.; Wei, M.; Shi, R.; Elsworth, D. Why shale permeability changes under variable effective stresses: New insights. Fuel 2018, 213, 55–71. [Google Scholar] [CrossRef]
- Tan, Y.; Pan, Z.; Liu, J.; Zhou, F.; Connell, L.D.; Sun, W.; Haque, A. Experimental study of impact of anisotropy and heterogeneity on gas flow in coal. Part II: Permeability. Fuel 2018, 230, 397–409. [Google Scholar] [CrossRef]
- Cui, G.; Feng, X.T.; Pan, Z.; Chen, T.; Liu, J.; Elsworth, D.; Tan, Y.; Wang, C. Impact of shale matrix mechanical interactions on gas transport during production. J. Pet. Sci. Eng. 2020, 184, 106524. [Google Scholar] [CrossRef]
- Huang, Z.; Li, X.; Li, S.; Zhao, K.; Zhang, R. Investigation of the hydraulic properties of deep fractured rocks around underground excavations using high-pressure injection tests. Eng. Geol. 2018, 245, 180–191. [Google Scholar] [CrossRef]
- Zhang, Y.J.; Zhang, B.; Yin, S. In-situ stresses controlling hydraulic fracture propagation and fracture breakdown pressure. J. Pet. Sci. Eng. 2018, 164, 164–173. [Google Scholar] [CrossRef]
- Cao, P.; Liu, J.; Leong, Y.-K. A multiscale-multiphase simulation model for the evaluation of shale gas recovery coupled the effect of water flowback. Fuel 2017, 2, 191–205. [Google Scholar] [CrossRef]
- Tan, Y.; Pan, Z.; Liu, J.; Feng, X.T.; Connell, L.D. Laboratory study of proppant on shale fracture permeability and compressibility. Fuel 2018, 222, 83–97. [Google Scholar] [CrossRef]


| Parameter Name | Unit and Value | Parameter Name | Unit and Value |
|---|---|---|---|
| Gas viscosity | 1.3 × 10⁻⁵ Pa.s | Matrix initial porosity | 0.08 |
| Initial reservoir pressure | 1.2 MPa | Secondary fracture initial porosity | 0.2 |
| Langmuir constant PL | 4 MPa | Secondary fracture residual volume fraction | 0.05 |
| Langmuir constant VL | 0.005 m3/kg | Poisson’s ratio of coal body | 0.3 |
| Initial gas density | 0.717 kg/m3 | Water injection time | 10 h |
| water permeability in matrix | 1 × 10⁻¹⁸ m2 | Hydraulic fracturing inlet pressure | 20 MPa |
| Initial storage coefficient | 3.84 × 10⁻¹⁰ [1/Pa] | Initial gas permeability in fractures | 15 × 10−16 m2 |
| Coal density | 1300 kg/m3 | Biot constant of coal | 0.67 |
| Initial gas permeability in matrix | 5 × 10⁻¹⁸ m2 | Fracture bulk modulus | 4 GPa |
| Initial water pressure in coal | 1500 Pa | Initial density of water | 1000 kg/m3 |
© 2020 by the authors. Licensee MDPI, Basel, Switzerland. This article is an open access article distributed under the terms and conditions of the Creative Commons Attribution (CC BY) license (http://creativecommons.org/licenses/by/4.0/).
Share and Cite
Liu, Y.; Zhang, Z.; Xiong, W.; Shen, K.; Ba, Q. The Influence of the Injected Water on the Underground Coalbed Methane Extraction. Energies 2020, 13, 1151. https://doi.org/10.3390/en13051151
Liu Y, Zhang Z, Xiong W, Shen K, Ba Q. The Influence of the Injected Water on the Underground Coalbed Methane Extraction. Energies. 2020; 13(5):1151. https://doi.org/10.3390/en13051151
Chicago/Turabian StyleLiu, Yanbao, Zhigang Zhang, Wei Xiong, Kai Shen, and Quanbin Ba. 2020. "The Influence of the Injected Water on the Underground Coalbed Methane Extraction" Energies 13, no. 5: 1151. https://doi.org/10.3390/en13051151
APA StyleLiu, Y., Zhang, Z., Xiong, W., Shen, K., & Ba, Q. (2020). The Influence of the Injected Water on the Underground Coalbed Methane Extraction. Energies, 13(5), 1151. https://doi.org/10.3390/en13051151