Do Oil and Gas Risk Factors Matter in the Malaysian Oil and Gas Industry? A Fama-MacBeth Two Stage Panel Regression Approach


Abstract
:1. Introductions
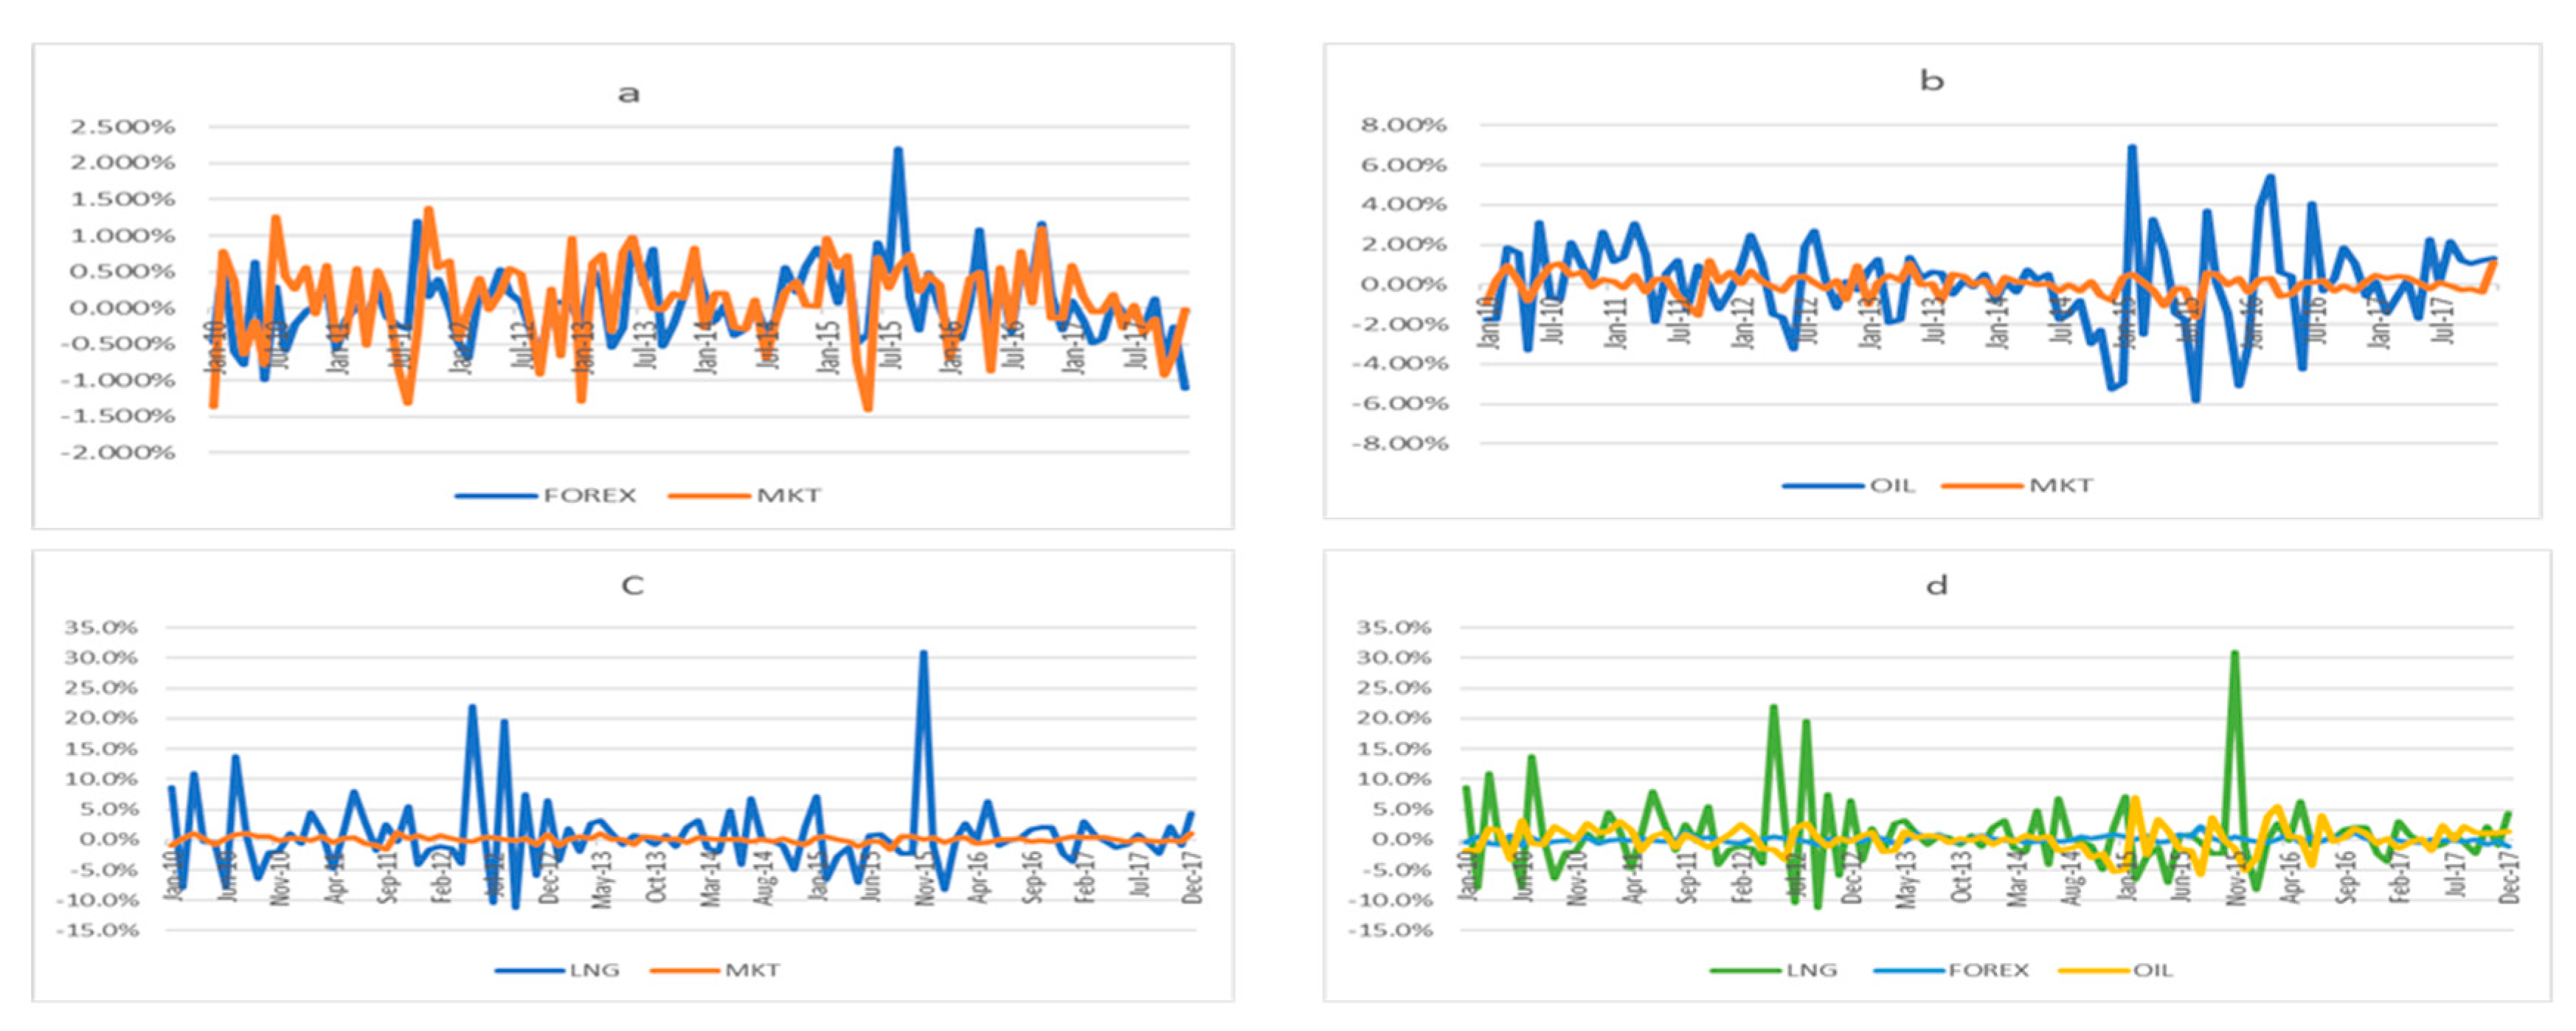
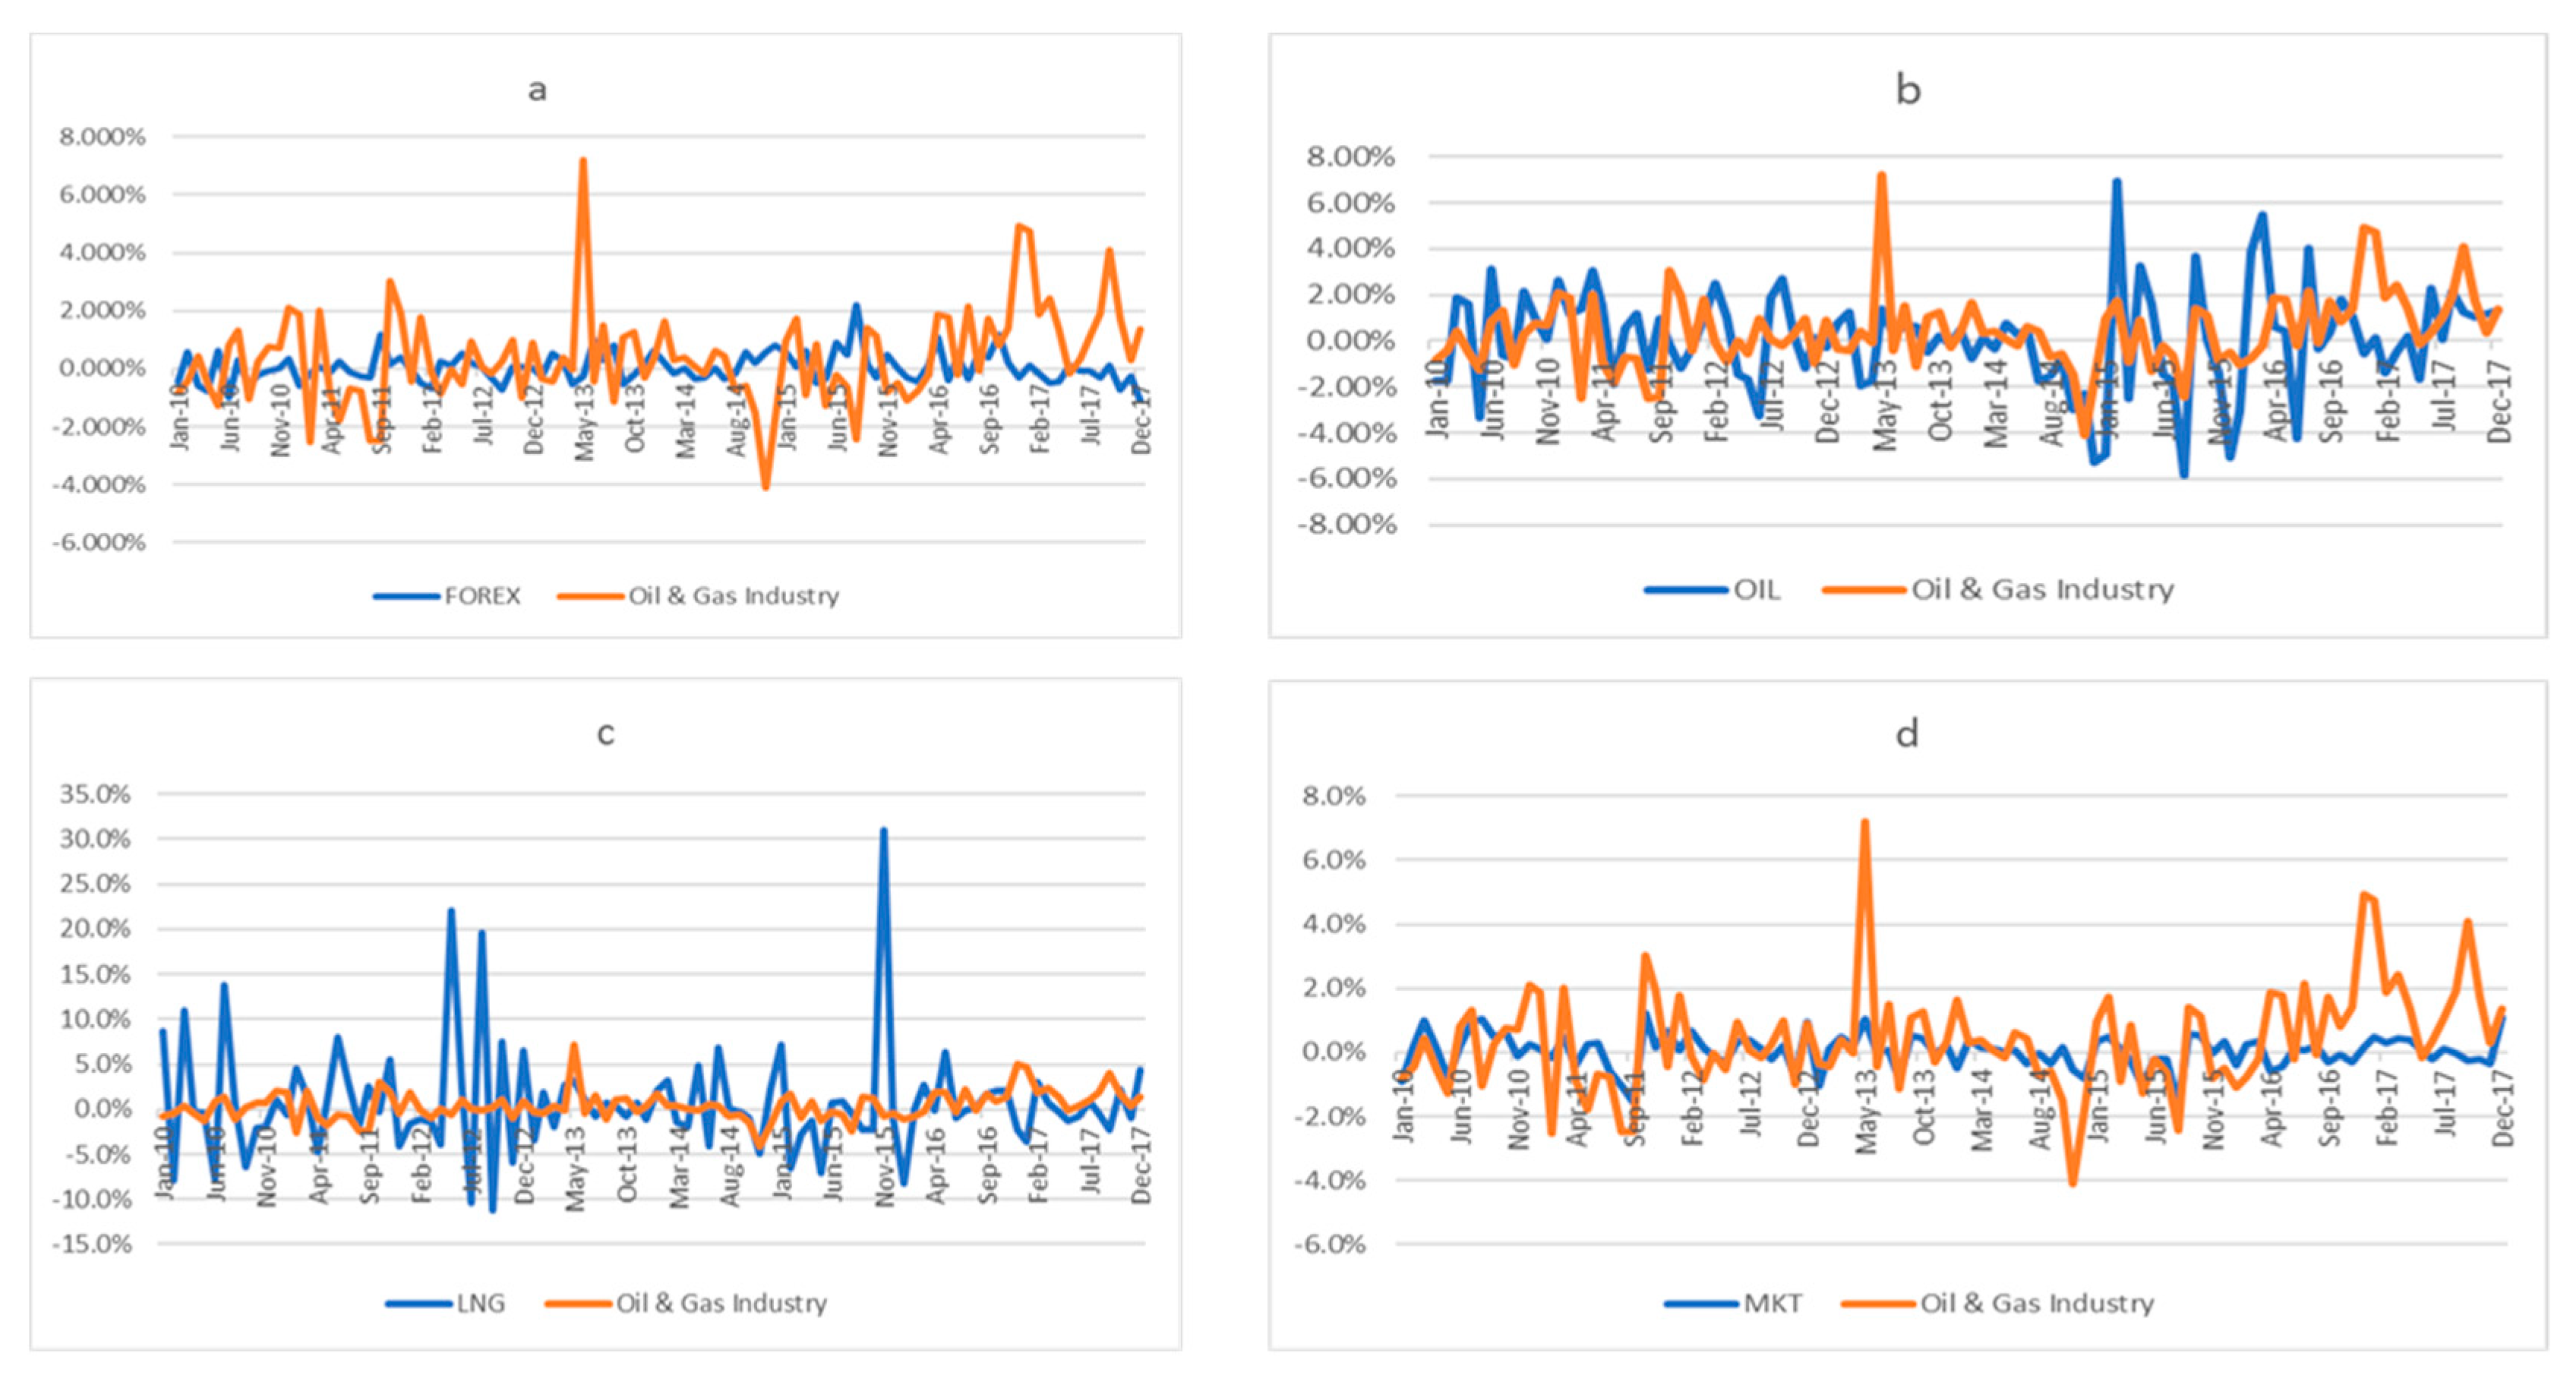
2. Stylized Facts
3. Methodology
3.1. Empirical Methods
3.2. Dataset
4. Empirical Results
5. Discussion
5.1. Common Risk Factors
5.2. Oil and Gas Risk Factors
5.3. Additional Analysis with Time Series Approach
6. Summary and Concluding Remarks
Author Contributions
Funding
Conflicts of Interest
References
- Ramos, S.B.; Taamouti, A.; Veiga HWang, C.W. Do investors price industry risk? Evidence from the cross-section of the oil industry. J. Energy Mark. 2017, 10, 79–108. [Google Scholar] [CrossRef] [Green Version]
- Baek, S.; Bilson, J.F. Size and value risk in financial firms. J. Bank. Financ. 2015, 55, 295–326. [Google Scholar] [CrossRef]
- Gandhi, P.; Lustig, H. Size anomalies in US bank stock returns. J. Financ. 2015, 70, 733–768. [Google Scholar] [CrossRef]
- Viale, A.; Kolari, J.; Fraser, D. Common risk factors in bank stocks. J. Bank. Financ. 2009, 33, 464–472. [Google Scholar] [CrossRef] [Green Version]
- International Energy Agency (IEA). World Energy Outlook; International Energy Agency: Paris, France, 2019. [Google Scholar]
- International Energy Agency. Demand from Asia is set to power the growth of the global gas industry over the next five years. Press release, 7 June 2019. [Google Scholar]
- Basher, S.A.; Haug, A.A.; Sadorsky, P. Oil prices, exchange rates and emerging stock markets. Energy Econ. 2012, 34, 227–240. [Google Scholar] [CrossRef] [Green Version]
- Golub, S. Oil prices and exchange rates. Econ. J. 1983, 93, 576–593. [Google Scholar] [CrossRef]
- Lizardo RAMollick, A.V. Oil price fluctuations and US dollar exchange rates. Energy Econ. 2010, 32, 399–408. [Google Scholar] [CrossRef]
- Sadorsky, P. The empirical relationship between energy future prices and exchange rates. Energy Econ. 2000, 22, 253–266. [Google Scholar] [CrossRef]
- Zhang, Y.F.; Fan, Y.; Tsai, H.T.; Wei, Y.M. Spillover effects of US exchange rate on oil prices. J. Policy Model. 2008, 30, 973–991. [Google Scholar] [CrossRef]
- Merton, R.C. An intertemporal capital asset pricing model. Econometrica 1973, 41, 867–887. [Google Scholar] [CrossRef]
- Boyer, M.M.; Filion, D. Common and fundamental factors in stock returns of Canadian oil and gas companies. Energy Econ. 2007, 29, 428–453. [Google Scholar] [CrossRef] [Green Version]
- Faffa, R.W.; Brailsford, T.J. Oil price risk and the Australian stock market. J. Energy Financ. Dev. 1999, 4, 69–87. [Google Scholar] [CrossRef]
- Jin, Y.; Jorion, P. Firm value and hedging: Evidence from U.S. oil and gas producers. J. Financ. 2006, 61, 893–919. [Google Scholar] [CrossRef]
- Lanza, A.; Manera, M.; Grasso, M.; Giovannini, M. Long-run models of oil stock prices. Environ. Model. Softw. 2005, 20, 1423–1430. [Google Scholar] [CrossRef] [Green Version]
- Mohanty, S.; Nandha, M.; Bota, G. Oil shocks and stock returns: The case of the Central and Eastern European (CEE) oil and gas sectors. Emerg. Mark. Rev. 2010, 11, 358–372. [Google Scholar] [CrossRef]
- Mohanty, S.K.; Nandha, M. Oil Risk Exposure: The Case of the U.S. Oil and Gas Sector. Financ. Rev. 2011, 46, 165–191. [Google Scholar] [CrossRef]
- Nandha, M.; Faff, R. Does oil move equity prices? A global view. Energy Econ. 2007, 30, 986–997. [Google Scholar] [CrossRef]
- Park, J.; Ratti, R.A. Oil price shocks and stock markets in the U.S. and 13 European countries. Energy Econ. 2008, 30, 2587–2608. [Google Scholar] [CrossRef]
- Ramos, S.B.; Veiga, H. Risk factors in oil and gas industry returns: International evidence. Energy Econ. 2011, 33, 525–542. [Google Scholar] [CrossRef] [Green Version]
- Sadorsky, P. Risk factors in stock returns of Canadian oil and gas companies. Energy Econ. 2001, 23, 17–28. [Google Scholar] [CrossRef]
- Sadorsky, P. The oil price exposure of global oil companies. Appl. Financ. Econ. Lett. 2008, 4, 93–96. [Google Scholar] [CrossRef]
- Sanusi, M.S.; Ahmad, F. Modelling oil and gas stock returns using multi factor asset pricing model including oil price exposure. Financ. Res. Lett. 2016, 18, 89–99. [Google Scholar] [CrossRef]
- Ulusoy, V.; Özdurak, C. The Impact of Oil Price Volatility to Oil and Gas Company Stock Returns and Emerging Economies. Int. J. Energy Econ. Policy 2018, 8, 144–158. [Google Scholar]
- Fama, E.; MacBeth, J. Risk, return, and equilibrium: Empirical tests. J. Political Econ. 1973, 81, e607–e636. [Google Scholar] [CrossRef]
- Scholtens, B.; Wang, L. Oil risk in oil stocks. Energy J. 2008, 29, 89–111. [Google Scholar] [CrossRef]
- Petersen, M.A. Estimating standard errors in finance panel data sets: Comparing approaches. Rev. Financ. Stud. 2009, 22, 435–480. [Google Scholar] [CrossRef] [Green Version]
- Goyal, A. Empirical cross-sectional asset pricing: A survey. Financ. Mark. Portf. Manag. 2012, 26, 3–38. [Google Scholar] [CrossRef] [Green Version]
- Kan, R.; Robotti, C. Evaluation of asset pricing models using two-pass cross-sectional regressions. In Handbook of Computational Finance; Springer: Berlin/Heidelberg, Germany, 2012; pp. 223–251. [Google Scholar]
- Fama, E.F.; French, K.R. Common Risk Factors in the Returns on Stocks and Bonds. J. Financ. Econ. 1993, 33, 3–56. [Google Scholar] [CrossRef]
- Carhart, M.M. On persistence in mutual fund performance. J. Financ. 1997, 52, 57–82. [Google Scholar] [CrossRef]
- Basher, S.A.; Sadorsky, P. Oil price risk and emerging stock markets. Glob. Financ. J. 2006, 17, 224–251. [Google Scholar] [CrossRef]
- Energy Information Administration. Malaysia Report: International Energy Data and Analysis; Energy Information Administration: Washington, DC, USA, 2019.
- Energy Information Administration. A Malaysia Oil Market Overview; Energy Information Administration: Washington, DC, USA, 2019.
- Demirer, R.; Jategaonkar, S.P.; Khalifa, A.A. Oil price risk exposure and the cross-section of stock returns: The case of net exporting countries. Energy Econ. 2015, 49, 132–140. [Google Scholar] [CrossRef]
- Malaysian Petroleum Resources Corporation. Industry Insights: Malaysia Oil & Gas Overview. Available online: https://www.mprc.gov.my/ (accessed on 1 January 2019).
- Fama, E.F.; French, K.R. Size, value, and momentum in international stock returns. J. Financ. Econ. 2012, 105, 457–472. [Google Scholar] [CrossRef]
- Narayan, P.K.; Narayan, S. Modelling the impact of oil prices on Vietnam’s stock prices. Appl. Energy 2010, 87, 356–361. [Google Scholar] [CrossRef]
- Zhu, H.M.; Li, R.; Yu, K. Modelling dynamic dependence between crude oil prices and Asia Pacific stock returns. Int. Rev. Econ. Financ. 2014, 29, 208–223. [Google Scholar] [CrossRef]
- Apergis, N.; Miller, S.M. Do structural oil-market shocks affect stock prices? Energy Econ. 2009, 31, 569–575. [Google Scholar] [CrossRef] [Green Version]
- Hatemi, J.A.; Al Shayed, A.; Roca, E. The effect of oil prices on stock prices: Fresh evidence from asymmetric causality tests. Appl. Econ. 2017, 49, 1584–1592. [Google Scholar] [CrossRef]
- Narayan, P.K.; Sharma, S.S. New evidence on oil price and firm returns. J. Bank. Financ. 2011, 35, 3253–3262. [Google Scholar] [CrossRef]
- Arouri, M.E.H. Does crude oil move stock markets in Europe? A sector investigation. Econ. Model. 2011, 28, 1716–1725. [Google Scholar] [CrossRef]
- Mollick, A.V.; Assefa, T.A. US stock returns and oil prices. The tale from daily data and the 2008–2009 financial crisis. Energy Econ. 2013, 36, 1–18. [Google Scholar] [CrossRef]
- Glosten, L.R.; Jagannathan, R.; Runkle, D.E. On the relation between the expected value and the volatility of the nominal excess return on stocks. J. Financ. 1993, 48, 1779–1801. [Google Scholar] [CrossRef]
- Nurjannah; Galagedera, D.U.; Brooks, R. Conditional Relation between Systematic Risk and Returns in the Conventional and Downside Frameworks: Evidence from the Indonesian Market. J. Emerg. Mark. Financ. 2012, 11, 271–300. [Google Scholar] [CrossRef]
- Theriou, N.G.; Aggelidis, V.P.; Maditinos, D.I.; Šević, Ž. Testing the relation between beta and returns in the Athens stock exchange. Manag. Financ. 2010, 36, 1043–1056. [Google Scholar] [CrossRef]
- Tuyon, J.; Ahmad, Z. Behavioural finance perspectives on Malaysian stock market efficiency. Borsa Istanb. Rev. 2016, 16, 43–61. [Google Scholar] [CrossRef] [Green Version]
- Min, B.K.; Kim, T.S. Momentum and downside risk. J. Bank. Financ. 2016, 72, S104–S11. [Google Scholar] [CrossRef]
- Cheema, M.A.; Nartea, G.V. Momentum returns, market states, and market dynamics: Are Islamic stocks different? In Proceedings of the 18th Malaysian Finance Association Annual Conference (MFAC) 2016 and the 7th Islamic Banking, Accounting and Finance Conference (iBAF) 2016, Melaka, Malaysia, 29–31 May 2016. [Google Scholar]


| Company | Change in 2014 EPS (%) | Change in 2014 Stock Price (%) | Change in 2015 EPS (%) | Change in 2015 Stock Price (%) | Change in 2016 EPS (%) | Change in 2016 Stock Price (%) | Change in 2017 EPS (%) | Change in 2017 Stock Price (%) |
|---|---|---|---|---|---|---|---|---|
| Alam Maritim Resources | −16.4 | −50.6 | −11.2 | −33.4 | −6.5 | −29.9 | −0.17 | −30 |
| Bumi Armada | −4.7 | −50.5 | −4.8 | −6.9 | −0.7 | −26.5 | −0.06 | 26.6 |
| Dayang Enterprise Holdings | −3.9 | −22.3 | −2.1 | −51.3 | −2.4 | −16.1 | −0.04 | 30 |
| Icon Offshore | 3.1 | −56.2 | −2.3 | −33.3 | −8.9 | −25.4 | −0.07 | −23.3 |
| Uzma | −0.5 | −54.1 | 6.3 | 16.7 | 18.4 | −5.5 | 0.05 | −10.3 |
| Petronas Dagangan | −10.9 | −43.33 | −14.00 | −40.0 | −12.2 | −8.5 | 1.15 | 5.03 |
| Perisai Petroleum Teknologi | −43.2 | −59.3 | −6.9 | −52.8 | −3 | −66.6 | −0.36 | −6 |
| SapuraKencana Petroleum | −2.5 | −52.65 | −1.8 | −12.9 | 0.3 | −19.8 | −4.47 | −52.14 |
| Scomi Energy Services | −5.4 | −30.1 | −2.5 | −51 | 0 | −52.6 | 0.09 | 18.75 |
| UMW Oil & Gas Corp | −1.6 | −8.5 | 1.5 | −35 | −3.2 | −41.19 | −0.04 | 13.8 |
| TH Heavy Engineering | −39.0 | −65.9 | −17.1 | −43.33 | −25.8 | −20.5 | −0.15 | −23.1 |
| Panel A: Sub-Industry | |||||||
| Oil & Gas Drilling | Oil & Gas Equipment and Services | Oil & Gas Refining and Marketing | Oil & Gas Storage and Transportation | Oil & Gas Exploration and Production | Coal & Consumable Fuels | Gas Utilities | |
| Mean | −0.009 | 0.007 | 0.002 | 0.003 | 0 | −0.001 | 0.002 |
| SD | 0.483 | 0.229 | 0.36 | 0.164 | 0.347 | 0.424 | 0.145 |
| Skewness | −0.091 | 0.949 | 1.233 | 0.375 | 1.195 | 0.556 | 0.216 |
| Kurtosis | 10.262 | 6.965 | 13.028 | 6.437 | 8.356 | 4.45 | 6.7 |
| Jarque-Bera test | 479.366 | 335.74 | 1853.016 | 215.001 | 597.669 | 25.038 | 241.089 |
| p-value | 0 | 0 | 0 | 0 | 0 | 0 | 0 |
| PP | −15.98 *** | −17.08 *** | −18.48 *** | −19.62 *** | −12.40 *** | −23.25 *** | −15.98 *** |
| ADF | −6.56 *** | −10.58 *** | −18.53 *** | −19.02 *** | −12.39 *** | −23.47 *** | −6.56 *** |
| Panel B: Risk Factors | |||||||
| MKT | SMB | HML | WML | OIL | LNG | EX | |
| Mean | 0 | 0.009 | 0.014 | 0.069 | 0 | 0.007 | 0.001 |
| SD | 0.093 | 1.295 | 1.699 | 0.446 | 0.3 | 0.932 | 0.08 |
| Skewness | −0.165 | −1.69 | 6.407 | −1.072 | −0.262 | 5.443 | 0.113 |
| Kurtosis | 4.964 | 21.211 | 84.344 | 8.455 | 4.486 | 61.142 | 5.232 |
| Jarque-Bera test | 68.899 | 5960.437 | 117821.5 | 596.94 | 43.143 | 60794.96 | 87.469 |
| p-value | 0 | 0 | 0 | 0 | 0 | 0 | 0 |
| PP | −20.43 *** | −22.01 *** | −20.22 *** | −20.00 *** | −12.09 *** | −19.95 *** | −20.43 *** |
| ADF | −23.29 *** | −23.31 *** | −22.08 *** | −20.57 *** | −20.55 *** | −20.53 *** | −23.29 *** |
| Market | SMB | HML | WML | OIL | LNG | FOREX | |
|---|---|---|---|---|---|---|---|
| 1 | −0.009 * | 0.282 ** | 0.218 ** | 0.281 *** | 0.044 | −0.199 ** | Market |
| 1 | −0.301 ** | −0.196 ** | 0.177 ** | 0.090 * | −0.092 * | SMB | |
| 1 | 0.221 ** | 0.188 ** | 0.004 | −0.186 ** | HML | ||
| 1 | 0.331 ** | 0.207 ** | −0.208 ** | WML | |||
| 1 | 0.116 * | −0.442 ** | OIL | ||||
| 1 | 0.076 * | LNG | |||||
| 1 | FOREX |
| Constant | MKT | SMB | HML | WML | R-Square | F Value | DW | Hausman Test | LM Test | |
|---|---|---|---|---|---|---|---|---|---|---|
| Panel A: Fama-MacBeth Cross-Sectional Regression | ||||||||||
| Excess Returns | 0.002 (2.01) ** | −0.112 (−6.10) *** | −0.023 (−1.99) * | −0.188 (−2.08) ** | −0.090 (−2.73) ** | 0.0982 | 5.78 ** | |||
| Panel B: Pooled Regression | ||||||||||
| Excess Returns | 0.003 (1.96) ** | −0.099 (13.11) *** | −0.018 (−1.75) * | −0.186 (−1.94) * | −0.090 (−3.66) *** | 0.1067 | 10.22 *** | 1.88 | ||
| Panel C: Fama-MacBeth Panel Regression (Random Effects) | ||||||||||
| Excess Returns | 0.003 (1.96) ** | −0.096 (−11.03) *** | −0.019 (−1.77) * | −0.114 (−2.11) ** | −0.088 (−2.96) ** | 0.1077 | 12.85 *** | 1.93 | 3.21 | 3.32 *** |
| Constant | MKT | SMB | HML | WML | OIL | GAS | EX | R-Square | F Value | DW | Hausman Test | LM Test | |
|---|---|---|---|---|---|---|---|---|---|---|---|---|---|
| Panel A: Fama-MacBeth Cross-Sectional Regression | |||||||||||||
| Excess Returns | −0.039 (−4.73) *** | −0.0311 (−3.27) *** | −0.019 (−1.73) * | −0.115 (−1.97) ** | −0.031 (−2.21) *** | 0.079 (2.19) ** | 0.199 (3.66) *** | 0.013 (2.09) ** | 0.1605 | 8.89 ** | |||
| Panel B: Pooled Regression | |||||||||||||
| Excess Returns | 0.001 (1.35) | −0.0831 (12.96) *** | −0.004 (−0.20) | −0.014 (−2.17) ** | −0.005 (−3.10) *** | 0.021 (2.29) ** | 0.010 (2.08) ** | 0.001 (2.01) ** | 0.1860 | 15.80 *** | 1.84 | ||
| Panel C: Fama-MacBeth Panel Regression (Random Effects) | |||||||||||||
| Excess Returns | 0.001 (1.35) | −0.083 (−10.34) *** | −0.012 (−0.47) | −0.007 (−2.01) ** | −0.0025 (−2.22) ** | 0.021 (1.99) ** | 0.008 (1.97) ** | 0.024 (2.25) ** | 0.1644 | 21.08 *** | 1.95 | 3.50 | 2.88 *** |
| Constant | MKT | SMB | HML | WML | OIL | LNG | EX | Alpha (0) | Alpha (1) | Beta (1) | DW | |
|---|---|---|---|---|---|---|---|---|---|---|---|---|
| Oil & gas drilling | −0.006 (−3.87) *** | 1.239 (7.11) *** | 0.017 (2.80) *** | 0.008 (1.19) | −0.008 (−2.97) *** | 0.001 (1.96) ** | 0.027 (1.21) | 0.323 (2.01) ** | 9.8E−05 (0.88) | 0.108 (1.68) * | 0.843 (10.44) *** | 1.96 |
| Oil & gas equipment services | 0.002 (1.89) * | 1.044 (12.10) *** | 0.027 (3.89) *** | 0.020 (3.07) *** | −0.001 (1.02) | 0.085 (2.96) *** | 0.003 (2.32) *** | 0.075 (1.97) ** | 4.7E−05 (1.82) * | 0.136 (2.14) ** | 0.816 (12.6) *** | 2.01 |
| Oil & gas refining marketing | 2.0E−05 (0.03) | 0.340 (7.24) *** | −0.005 (−1.04) | 0.001 (0.03) | 2.1E−05 (0.02) | 0.004 (1.99) ** | 0.001 (1.62) | 0.115 (1.97) ** | 1.2E−05 (1.52) | 0.129 (2.61) *** | 0.861 (18.19) *** | 2.10 |
| Oil & gas storage transportation | 0.002 (2.91) *** | 1.019 (5.78) *** | 0.562 (6.13) *** | 0.510 (7.00) *** | −0.491 (−1.88) * | 0.094 (2.02) ** | 0.011 (0.69) | 0.090 (2.33) *** | 2.01E−05 (−1.52) | 0.066 (1.99) ** | 0.603 (12.59) ** | 1.99 |
| Oil & gas exploration production | −0.003 (−2.16) ** | 0.761 (7.06) *** | 0.017 (2.30) ** | 0.301 (5.13) *** | 0.014 (1.58) | 0.113 (3.33) *** | 0.002 (2.02) ** | 0.099 (2.79) *** | 8.7E−05 (1.96) ** | 0.119 (2.49) ** | 0.845 (16.68) *** | 1.94 |
| Coal & consumable fuels | −0.004 (−1.49) | 0.851 (3.89) *** | 0.690 (2.21) ** | −0.005 (−0.76) | −0.002 (−0.52) | 0.108 (1.97) ** | 0.103 (2.09) ** | 0.362 (1.86) * | 0.003 (1.98) ** | 0.229 (1.41) | 0.716 (5.08) *** | 1.89 |
| Gas utilities | 0.009 (1.42) | 0.501 (9.71) *** | −0.002 (−0.72) | −0.002 (−0.59) | 0.002 (1.31) | −0.048 (−2.46) *** | −0.037 (−1.98) ** | −0.243 (−3.82) *** | 1.7E−05 (−1.472) | 0.046 (1.46) | 0.90 (16.27) *** | 2.22 |
© 2020 by the authors. Licensee MDPI, Basel, Switzerland. This article is an open access article distributed under the terms and conditions of the Creative Commons Attribution (CC BY) license (http://creativecommons.org/licenses/by/4.0/).
Share and Cite
Hoque, M.E.; Low, S.W.; Zaidi, M.A.S. Do Oil and Gas Risk Factors Matter in the Malaysian Oil and Gas Industry? A Fama-MacBeth Two Stage Panel Regression Approach. Energies 2020, 13, 1154. https://doi.org/10.3390/en13051154
Hoque ME, Low SW, Zaidi MAS. Do Oil and Gas Risk Factors Matter in the Malaysian Oil and Gas Industry? A Fama-MacBeth Two Stage Panel Regression Approach. Energies. 2020; 13(5):1154. https://doi.org/10.3390/en13051154
Chicago/Turabian StyleHoque, Mohmmad Enamul, Soo Wah Low, and Mohd Azlan Shah Zaidi. 2020. "Do Oil and Gas Risk Factors Matter in the Malaysian Oil and Gas Industry? A Fama-MacBeth Two Stage Panel Regression Approach" Energies 13, no. 5: 1154. https://doi.org/10.3390/en13051154