Abstract
This study dealt with evaluating the (J85-GE-5H) military turbojet engine (TJE) in terms of exergetic and advanced exergetic analyses at Military (MIL) and Afterburner (AB) process modes by utilizing kerosene (JP-8) and hydrogen (H2) fuels. First, exergy and advanced exergy analyses of the engine were performed using JP-8 fuel as per actual engine operating conditions. These analyses of the turbojet engine using hydrogen fuel were also examined parametrically. The performance evaluation of the engine was lastly executed by comparing the obtained results for both fuels. Based on the parametric studies undertaken, the entire engine’s exergetic efficiency with JP-8 was reckoned 30.85% at the MIL process mode while it was calculated as 16.98% at the AB process mode. With the usage of H2, the efficiencies of the engine decreased to 28.62% and 15.33% for the above mentioned two modes, respectively. As the supreme exergy destructions occurred in the combustion chamber (CC) and afterburner exhaust duct (ABED) segments, the new technological developments should be considered to design more efficient engines. As a result, the engine worked less efficiently with hydrogen fuel due to the enhancement in exergy destructions. Conversely, the greenhouse gas (GHG) emission parameters lessened with the utilization of H2 fuel.
1. Introduction
In today’s world, the main parameter of sustainable economic development bounds up with energy. The diminishing of the energy sources due to fast consumption can cause detrimental effects on the environment [1]. Aviation, one of the most energy consuming sectors, should be considered as per ecological threat to the world. Increases in CO2 emissions and temperature cause climate change across the world. In this regard, many studies have been executed in order to eliminate the unfavorable effects of the emissions in aviation [2,3,4,5,6]. Moreover, another challenge that must be considered is the diminution of fossil energy resources. In this context, these challenges led researchers to work on alternative energy resources. One of the most eco-friendly and least pollutant renewable source as well, known is hydrogen. In recent years, the studies on fuel cell-based energy systems have led liquefied hydrogen fuel to be considered as an important alternative fuel with feasible outcomes [7,8,9,10,11,12,13,14,15], but the disadvantages that have been waiting to be solved still remain [16,17,18,19,20,21]. Hydrogen should be produced because it does not exist in nature by itself. The need for the large fuel tank size, preserving liquefied hydrogen approximately below 253 °C working conditions and the aerodynamic design challenges in terms of weight is counted to be the major problems [22,23,24].
Beyond all this, the main concern is to design jet propulsion systems regarding exergetic efficiency in order to give the best feasible outcome regardless of the type of fuel used [16,17,25,26,27]. It is known that aircraft gas turbine engines operate according to thermodynamic principles. The main criterion on performance evaluation of aircraft engines is to achieve maximum thrust with minimum fuel consumption [28,29]. On this aspect, energy and exergy performance assessments have been applied to aircraft engines based on thermodynamic rules [30,31,32,33,34,35,36]. Thermodynamics’ second law analysis named exergy analysis can give a chance to evaluate the quality of energy, entropy production (irreversibility) and the capability of doing work. Exergy can deal with the quantity of the work by considering the system and its environment thanks to reversible processes. The entire performance in a gas turbine system can be determined by putting forth the irreversibilities [37,38,39,40,41]. The whole performance of a system and its segments can be improved when the irreversibilities and the exergy destructions of the system are diminished [42,43]. Not only the destruction ratio but also the interplay of the segments in a system can give the researchers a better comprehension to evaluate the performance metrics in a gas turbine engine. Even though thermodynamic irreversibilities lead to inefficiencies, which can be examined through conventional exergy analysis, further investigation by examining the source of irreversibility and amelioration capacity can be achieved only via advanced exergy analysis [44,45,46,47,48].
As opposed to prior researches, the comparative improved performance examination of J85-GE-5H turbojet engine (TJE), as considering advanced exergetic analyses with the utilization of H2 fuel, has not been detected during the literature review. The primary interest and the originality of this study lie in this view. The main objectives and typicalness of this study can be abstracted to:
- Calculate the exergy destructions of TJE and its segments,
- Compare the TJE exergetic efficiency with the improved exergetic efficiency at Military (MIL) and Afterburner (AB) process modes for JP-8 fuel and H2 fuel,
- Determine advanced exergy destruction rates of TJE and its segments by dividing into endogenous/exogenous and avoidable/unavoidable parts,
- Compare the advanced exergetic destruction rates with the usage of JP-8 fuel and H2 fuel and
- Find out the segments in demand of recuperation.
2. Methodology
2.1. Definition of TJE
J85-GE-5H TJE is formed of the segments given as air compressor (AC), combustion chamber (CC), gas turbine (GT), forward exhaust duct (FED), afterburner exhaust duct (ABED) and gas turbine mechanic shaft (GTMS), which joins eight stage axial flow compressor section to a two stage turbine section. In this research, the inlet duct was assumed negligible since the engine was operated in the ground test cell indoor condition. The combustion with continuous flow occurs in the annular CC and ABED segments. This engine is used on T-38 military training aircraft. The engine and its segments’ power need can be obtained by the expansion of burnt gases in the turbine. The empirical data, such as temperature (T), fuel and air flow rates () and pressure (P), regarding the TJE segments, have been obtained by indicators that are mounted on the engine. The ABED segment provides more power and thrust force by burning the AB fuel depending on the flight characteristic. A basic cross-section of the TJE is demonstrated in Figure 1.
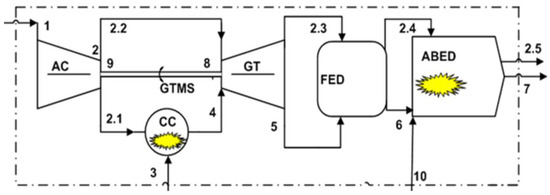
Figure 1.
A basic cross-section and exergy flow of the military TJE.
2.2. Assumptions Made
The assumptions regarding the study are listed as follows:
- Air and combustion gases were reputed as ideal gases.
- The TJE functioned in a steady state.
- At the end of the process, complete combustion was obtained.
- Kinetic exergy and potential exergy changes were reputed to be insignificant.
- Since the engine was operated in the ground test cell as a rigid position, Vin was assumed to be zero. Therefore, the effect of the inlet duct was neglected.
- The AC and GT segments of the TJE were counted off as adiabatic due to negligible heat transfer rates [3,31].
- The fuels, JP-8 and H2, based on the exergy analysis of this study.
- The Lower Heating Value (LHV) was assumed to be 43,124 kJ/kg for JP-8 and 119,450 kJ/kg for H2 fuel [49,50].
2.3. Exergy Analysis
As per exergy analysis, the efficiency of the system and its segments are considered by their place, source and size with the maximum exergy destruction [44]. In other words, exergy is a description of a utilizable work that can be obtained from the present capacity of a gas turbine system. With this scope, the CC and ABED segments are the main components, which have significant effects in terms of exergetic efficiency due to the utmost exergy destructions.
2.3.1. The Exergy Equations
General exergy equilibrium equation is defined by:
where is the heat transfer rate at temperature; is the work rate; is exergy flow rate and the is exergy destruction rate.
The exergy equation can be written for a continuous flow continuous open (CFCO) system as follows [51]:
where and symbolize fuel exergy rate and product exergy rate, respectively.
Exergy consumption, symbolized as , is obtained by summing the rates of exergy destruction and exergy losses [3].
In order to consider the energy produced in the system, the chemical consumption of liquid fuels (CaHb) can be calculated per unit mass as undermentioned [39,49,52]:
where represents the fuel exergy grade function calculated as 1.0616 for JP-8 fuel with the chemical formula of C12H23 [31]. The specific exergy of the jet fuel is obtained by multiplying the LHVF with the within the value of 45,780.28 kJ/kg, whereas it is calculated as 134,778 kJ/kg for liquefied H2 fuel [53].
The impulse is equal to the momentum of the burned gases at the exhaust duct and is obtained as follows [54]:
where the subscripts “in” and “out” stand for inlet and outlet control quantities, respectively; A is the area (m2); F is the thrust (N); is the mass flow rate (kg/s) and V is the velocity (m/s). Since the turbojet engine ran in a ground test cell without being exposed to outdoor conditions, the input momentum was assumed to be zero [31,34,49].
The product exergy rate of the TJE, symbolized as , is calculated as follows [31]:
where and represent the mass flow rate of exhaust gases and the outlet velocity of the exhaust nozzle, respectively.
2.3.2. Combustion Balance Equations in CC and ABED segments
As per the empirical data obtained from the engine test cell, the energy produced in CC and ABED segments were calculated within the rate of 15,593.11 and 31,972.05 kW at MIL and AB process modes, respectively; while the mass flow rates of kerosene were determined as 0.36 and 0.74 kg/s. When calculating the energy values for the engine segments, the reference environmental condition was taken as the basis. As stated in Ref. [50], LHV of the hydrogen fuel is greater than that of the kerosene fuel. Therefore, equal energy values can be obtained by using 0.13 and 0.27 kg/s hydrogen fuels for MIL and AB process modes, respectively.
Since the mass of fuel and exhaust gases varies, the thrust gained from exhaust nozzle differs for MIL and AB process modes. However, the temperature and the pressure of the compressor segment in both process modes are the same. Therefore, this gives a chance to compare the efficiency of the entire system with and without AB impact in the present study for both fuel utilizations.
The air consists of 77.48% nitrogen (N2), 20.59% oxygen (O2), 1.90% water vapor (H2O) and 0.03% carbon dioxide (CO2) [3,31,39,49], while kerosene consists of approximately 9% (C8–C9) aliphatic hydrocarbons, 65% (C10–C14) aliphatic hydrocarbons, 7% (C15–C17) aliphatic hydrocarbons and 18% aromatics [55]. Since the ratio of dodecane in kerosene is the highest percentage hydrocarbon, it is considered as a representative component in this research.
For JP-8 fuel, the air-to-fuel ratio is calculated 45.10 at the MIL process mode. The combustion equation is demonstrated in terms of mole fractions as given below [56]:
The primary emissions considered in the exhaust emission were CO2, H2O, O2 and N2. Upon the completion of the combustion process as per Equation (7), the mass compositions of combustion gases were obtained to be 6.89% CO2 (1.15 kg/s), 3.85% H2O (0.64 kg/s), 15.14% O2 (2.52 kg/s) and 74.12% N2 (12.36 kg/s). The specific heat capacity of the combustion gases is calculated as undermentioned [57]:
where the unit of temperature (T) is Kelvin and the specific heat capacity of the combustion gases is kJ/(kg·K). Based on the mass rates of emissions, the combustion gases value has been calculated in terms of temperature by implementing the values of each emission [57].
When operating at the AB process mode, the air-to-fuel ratio is reckoned to 22.84. For the AB process mode, the combustion equation can be written as:
Upon the completion of combustion process as per Equation (9), the mass compositions of combustion gases were determined to be 20.04% CO2 (3.49 kg/s), 8.96% H2O (1.56 kg/s), 0.04% O2 (0.01 kg/s) and 70.96% N2 (12.35 kg/s). The specific heat capacity of the combustion gases at the AB process mode is reckoned as undermentioned:
The ideal gas constant values of combustion gases were calculated as 0.290112 and 0.289927 kJ/(kg·K) for the MIL and AB process modes, respectively.
For H2 fuel, the air-to-fuel ratio was calculated 124.93 at the MIL process mode. The combustion equation is demonstrated as undermentioned [56]:
Upon the completion of combustion process as per Equation (11), the mass compositions of combustion gases are reckoned 0.05% CO2 (0.01 kg/s), 8.28% H2O (1.36 kg/s), 16.51% O2 (2.71 kg/s) and 75.16% N2 (12.36 kg/s). The specific heat capacity of the combustion gases is calculated as follows [57]:
When operating at the AB process mode, the air-to-fuel ratio is reckoned as 61.42. For the AB process mode, the combustion equation can be shown as undermentioned:
Upon the completion of combustion process as per Equation (13), the mass compositions of combustion gases are reckoned 0.04% CO2 (0.01 kg/s), 22.47% H2O (13.75 kg/s), 3.53% O2 (0.59 kg/s) and 73.96% N2 (12.36 kg/s). The specific heat capacity of the combustion gases at the AB process mode is computed as shown below:
The ideal gas constant values of combustion gases were calculated as 0.304282 and 0.33245 kJ/(kg·K) for the MIL and AB process modes, respectively.
The specific heat capacity of air is shown with the temperature unit of Kelvin (K) as undermentioned [58]:
The exergy equilibrium equations for TJE and its primary segments are derived and given below:
- Air compressor:

- Combustion chamber:

- Gas turbine:

- Forward exhaust duct:

- ABED at MIL process mode:

- ABED at AB process mode:

- Gas turbine mechanic shaft:

- TJE at MIL process mode:
- TJE at AB process mode:
Table 1 and Table 2 demonstrate the reckoned energy rate, exergy rate, mass flow rate, pressure and specific heat capacity for the system segments according to the flow state numbers for JP-8 and H2 fuel usages, respectively.

Table 1.
Values for energy rate, exergy rate, mass flow rate, pressure and specific heat capacity for the system segments for kerosene fuel utilization (*: solely for Afterburner (AB) process mode).
Table 2.
Values for energy rate, exergy rate, mass flow rate, pressure and specific heat capacity for the system segments for H2 fuel utilization (*: solely for AB process mode).
2.3.3. Exergy Performance Variables
The diverse variables, which help assess the exergetic performance of the TJE, are determined as follows [31,59]:
- Exergy efficiency:
- Relative exergy consumption rate:
- Fuel exergy demolition rate:
- Productivity lack rate:
- Exergetic improvement potential:
- Specific fuel consumption rate:
- Improved exergetic efficiency:
3. Advanced Exergy Analysis
Even though in exergy analysis, one can figure out the destructions and irreversibilities, it cannot classify the provenance. The further step in order to gain sophisticated consequences is to reckon the advanced exergetic breakdown by virtue of the exergy analysis results [44,45,46,47,48]. By this way, one can classify the entropy production and the demolition of the segment’s exergy. Irreversibility taking place in a device not only depends on its performance but also is related to the remaining segments, which deals with it. However, the demolition based on the segment itself can be avoidable rather than the rest of the segments interplay among it. Besides, the segments demolition can influence each of the other system segments’ demolitions. With the help of the advanced exergy analysis, researchers have a chance to design systems that are more efficient. By dividing the exergy demolition into endogenous and exogenous parts, one can find out the source of irreversibilities.
The relations for calculating the endogenous and exogenous parts of the n-th segment are demonstrated as [60,61]:
The demolition regarding the endogenous part includes the segment performance, considering that other segments work in optimal conditions. The effect of the residuary segments on the whole system composes the exogenous part of the demolition. When the disposal capacity of irreversibilities is considered, the exergy demolitions need to be divided into unavoidable and avoidable parts by the researchers. Although the technological challenges are altered, the unavoidable part of the segments cannot be removed. Yet, the avoidable part can be altered with the aid of technical recuperation. The unavoidable exergy destruction rate equation can be written as follows [62,63]:
The avoidable exergy destruction rate can be gained by subtracting the unavoidable exergy destruction rate from the real exergy destruction rate as:
A schematic subdivision of the exergy destruction is shown in Figure 2.
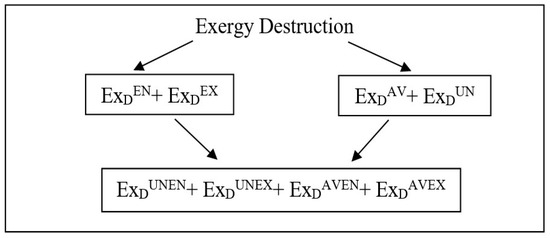
Figure 2.
A schematic subdivision of exergy destruction.
The rates are united to be evaluated for further analysis as given hereinafter [64]:
where can be diminished via the uplift of the regarding segment, whereas can be diminished via the uplift of other system segments.
4. Results and Discussion
In accordance with Table 1, exergetic performance variables at MIL and AB process modes of the entire TJE are demonstrated in Table 3 and Table 4 for kerosene utilization, respectively. As per the results, the velocities of the combustion gases were measured as 782.7 and 992.5 m/s at MIL and AB process modes, respectively. The thrusts of the aircraft at MIL and AB process modes were 13.05 and 17.28 kN, respectively. While the specific fuel consumption (SFC) was calculated as 99.77 (kg/h)/kN at the MIL process mode, it was determined to be 229.78 (kg/h)/kN at the AB process mode. The product exergy rates of the entire engine known as the kinetic exergy of the combustion gases were calculated as 5106.21 and 8575.33 kW at MIL and AB process modes, respectively, while the fuel exergy rates were 16,553.58 and 50,494.99 kW. Thus, exergy consumption rates were calculated as 11,447.37 and 41,919.66 kW at MIL and AB process modes, respectively. Figure 3 indicates the exergetic and improved exergetic efficiency of the TJE and its segments for the MIL and AB process modes, respectively, with the usage of JP-8 fuel hereinafter.
Table 3.
Results for exergy performance variables at the MIL process mode for JP-8 fuel.
Table 4.
Results for exergy performance variables at the AB process mode for JP-8 fuel.
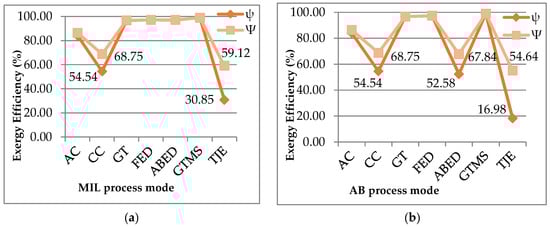
Figure 3.
(a) MIL process mode exergy efficiency; (b) AB process mode exergy efficiency.
While the entire engine had 9108.99 kW exergy destruction rate and 2338.38 kW exergy loss rate at the MIL process mode, it had 28,595.47 kW exergy destruction rate and 13,324.19 kW exergy loss rate at the AB process mode. Even though the overall engine efficiency was detected at MIL and AB process modes with the ratios of 30.85% and 16.98%, respectively, it was determined to be 59.12% and 54.64% when taking into account the improved potential of the system. The exergy ratio and other variables for the system segments are given as undermentioned:
- As per Table 3 at the MIL process mode, the utmost exergy demolition took place in the CC segment, which had a rate of 7525.35 kW. The entire engine had a 7916.25 kW exergy improvement potential rate, which was detected in the CC as the highest ratio with a value of 3421.07 kW. The CC segment had the rock-bottom exergy efficiency with a ratio of 54.54%, while it was detected as 68.75% for the improved condition. Therewithal, the CC had the utmost relative exergy consumption ratio with 65.74%, the maximum fuel exergy depletion ratio with 45.46% and the maximum productivity exergy lack ratio with 147.38%.
- As per Table 4 at the AB process mode, the utmost exergy demolition occurred in the ABED segment, which had a rate of 19,727.84 kW. The entire engine had a 34,800.63 kW exergy improvement potential rate, which was detected in the ABED as the highest ratio, with a value of 9354.18 kW. The ABED had the rock-bottom exergy efficiency with a ratio of 52.58%, whereas it was detected 67.84% for the improved condition. At the same time, the ABED had the maximum relative exergy consumption ratio with 47.06%, the maximum fuel exergy depletion ratio of 39.07% and the maximum productivity exergy lack ratio with 230.05%.
In accordance with Table 2, exergetic performance variables at MIL and AB process modes of the entire TJE are demonstrated in Table 5 and Table 6 for H2 utilization, respectively. Since the research has been performed parametrically in terms of H2 fuel usage similar to Ref. [65], the velocities of the exhaust gases were assumed as 782.7 and 992.5 m/s at MIL and AB process modes, respectively. The thrusts of the A/C at MIL and AB process modes were 12.87 and 16.58 kN, respectively. While SFC was calculated 36.52 (kg/h)/kN at MIL process mode, it was calculated 86.46 (kg/h)/kN at the AB process mode. The product exergy rates of the entire engine known as the kinetic exergy of the exhaust gases were determined as 5035.44 and 8228.21 kW at MIL and AB process modes, respectively, while the fuel exergy rates were 17,594.04 kW and 53,668.79kW. Thus, exergy consumption rates were calculated as 12,558.60 and 45,440.58 kW at MIL and AB process modes, respectively. Figure 4 illustrates the exergetic and improved exergetic efficiency of the TJE and its segments for the MIL and AB process modes, respectively, with the usage of H2 fuel hereinafter.
Table 5.
Results for exergy performance variables at the MIL process mode for H2 fuel.
Table 6.
Results for exergy performance variables at the AB process mode for H2 fuel.
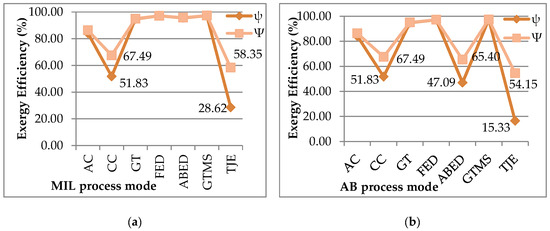
Figure 4.
(a) MIL process mode exergy efficiency; (b) AB process mode exergy efficiency.
While the entire engine had a 10,378.03 kW exergy destruction rate and 2180.57 kW exergy loss rate at the MIL process mode, it had a 33,113.43 kW exergy destruction rate and 12,327.15 kW exergy loss rate at the AB process mode. Even though the engine efficiency was detected at MIL and AB process modes with the ratios of 28.62% and 15.33%, respectively, it was determined 58.35% and 54.15% for the improved conditions. The exergy ratio and other variables were presented as follows:
- As per Table 5 at the MIL process mode, the utmost exergy demolition took place in the CC segment, which had a rate of 8474.61 kW. The entire engine had 8964.31 kW exergy improvement potential, which was in the CC as the highest ratio with the value of 4082.01 kW. The combustion chamber segment had the rock-bottom exergy efficiency by the ratio of 51.83%, while it was detected 67.49% for the improved condition. Therewithal, the CC had the utmost relative exergy consumption ratio with 67.48%, the maximum fuel exergy depletion ratio with 48.17% and the maximum productivity exergy lack ratio with 168.30%.
- As per Table 6 at the AB process mode, the utmost exergy demolition was due to the ABED segment, which had a rate of 23,065.79 kW. The entire engine had 38,473.87 kW exergy improvement potential, which was detected in the ABED as the highest ratio, with a value of 12,203.64 kW. The ABED had the rock-bottom exergy efficiency by the ratio of 47.09%, whereas it was detected as 65.40% for the improved condition. At the same time, the ABED has the maximum relative exergy consumption ratio with 50.76%, the maximum fuel exergy depletion ratio with 42.98% and the maximum productivity exergy lack ratio with 280.33%.
When comparing the exergetic efficiency results acquired from the present study with the outcome of J69-T-25A TJE study [65], one can write as follows:
The exergetic efficiency of the whole J69 engine was determined 15.40% with kerosene fuel usage while it was reckoned 14.33% with hydrogen fuel utilization. The percentage change of J69 engine’s exergetic efficiency calculated as 6.95% was not only lower than the MIL process mode exergy efficiency percentage change 7.23% of the J85-GE-5H TJE but also lower than the AB process mode exergy efficiency percentage change 9.73%. Although these findings have indicated that the use of hydrogen fuel caused more exergy destruction in J85 engine, the overall engine efficiency was more efficient than J69 engine in both process modes. On the other hand, as per Ref. [31], the efficiency of (J85-GE-CAN-15) TJE determined 31.64% and 24.18% at the MIL and AB process modes, respectively, was detected more efficient than the ones in this article.
In order to verify the exergy analyses consequences, the advanced exergy analysis results were taken into account for further performance assessment of TJE and its segments. Turbojet engine and its segments’ advanced exergy destructions are shown for MIL and AB process modes in Table 7 and Table 8 for JP-8 usage.
Table 7.
Results for endogenous, exogenous, unavoidable and avoidable exergy demolition of TJE and its segments at the MIL process mode for JP-8 utilization.
Table 8.
Results for endogenous, exogenous, unavoidable and avoidable exergy demolition of TJE and segments at AB process mode for JP-8 utilization.
As per Table 7 at the MIL process mode, the total avoidable exergy destruction rate of the TJE was 650.18 kW. The largest part of this ratio occurred in the CC with a rate of 207.71 kW. The utmost unavoidable exergy destruction rate was due to in the CC with a value of 7317.64 kW. This rate was equal to 86.51% of the total unavoidable exergy destruction rate (8458.81 kW), which is 80.33% of the total exergy destruction rate (9108.99 kW). As per Figure 5, the unavoidable demolition part of the CC was the sum of the rate of 6643.88 kW and with a rate of 673.76 kW. The unavoidable parts cannot be diminished via uplift in the efficiency of the system due to manufacturing restrictions.
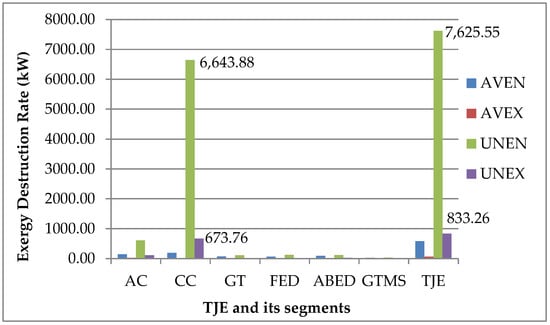
Figure 5.
Advanced exergy evaluation of TJE and its segments as per avoidable/-unavoidable endogenous/-exogenous destruction ratios at the MIL process mode for JP-8 utilization.
On the other hand, the utmost endogenous exergy destruction rate took place in the CC with a rate of 6835.25 kW. Since the great endogenous exergy destruction rate, being due to the CC, the amount of the endogenous part of the exergy destruction therein the entire engine was extremely greater than that of the exogenous part. The percentage of endogenous exergy destruction therein the CC was 83.24% of the total endogenous exergy destruction rate (8211.69 kW) and the 75.04% of the total exergy destruction rate. The TJE engine had an aggregate exogenous exergy demolition rate of 897.30 kW. The major fragments of this rate given in Table 7 were determined 690.10 kW in the CC, 132.24 kW in the AC, 33.06 kW in the ABED and 25.98 kW in the FED. The exogenous exergy destruction was brought about in the n-th segment by the irreversibilities that occurred in the downstream segments. One could have a chance to understand the reciprocal interplay between engine segments by separating the demolitions into the exogenous parts. With respect to Table 7, the CC had a striking influence on the AC segment based on the inefficiencies. At the same time, the AC had the same influence on the CC segment too. Moreover, the AC and the CC segments’ inefficiencies caused the exergy destructions of the downstream segments.
One could have a better understanding by analyzing the dispersion of the exergy demolition as per Table 7. The avoidable-exogenous exergy demolition rates were calculated 20.01 and 16.34 kW in the AC and CC segments, respectively. The could be diminished uplift in the form of the entire system or uplift in the efficiency of the downstream system segments. The section could be diminished by uplifting the efficiency of the searched segment. According to the obtained results, while the CC segment had the utmost avoidable demolition value with the ratio of 31.95% at the MIL process mode, the ABED segment had the utmost avoidable demolition value with the ratio of 66.99% at the AB process mode.
As per Table 8 at the AB process mode, the total avoidable exergy destruction rate of the TJE was 3543.88 kW. The great section of this ratio occurred in the ABED segment with a value of 3001.05 kW. The irreversibilities took place in the downstream segments led to exogenous exergy demolition in the n-th segment. The TJE engine had an aggregate exogenous exergy demolition rate of 4192.77 kW. The major fragments of this rate were 3328.53 kW in the ABED, followed by 690.10 kW in the CC and 132.24 kW in the AC. The supreme was in the ABED with a rate of 16,726.80 kW, being equal to 66.77% of total unavoidable exergy destruction rate (25,051.59 kW) and 58.49% of total exergy destruction rate (28,595.47 kW). As per Figure 6, the unavoidable demolition part of the ABED was the sum of the rate of 13,867.49 kW and with a rate of 2859.31 kW. In addition, the supreme endogenous exergy destruction rate was determined in the ABED with a rate of 16,399.32 kW. This ratio equaled to 83.13% of the ABED exergy destruction rate (19,727.85 kW) and 67.20% of the total endogenous exergy destruction rate (24,402.70 kW). As per Table 8, the ABED segment had the utmost with the rate of 469.22 kW. The rate of the equaled to 1.82% of the total exergy destruction rate in the TJE at the AB process mode while it was reckoned 0.7% at the MIL process mode.
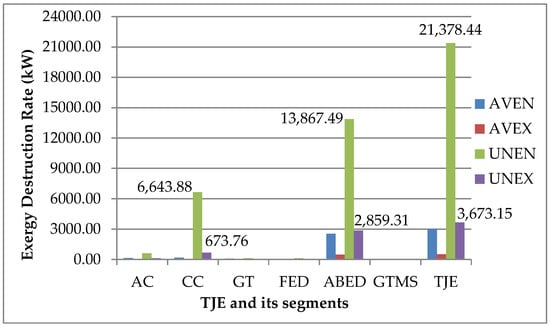
Figure 6.
Advanced exergy evaluation of TJE and its segments as per avoidable/-unavoidable endogenous/-exogenous destruction ratios at AB process mode for JP-8 utilization.
On the other hand, the turbojet engine and its segments’ advanced exergy destructions are shown in Table 9 and Table 10 at MIL and AB process modes for H2 usage hereinafter:
Table 9.
Results for endogenous, exogenous, unavoidable and avoidable exergy demolition of TJE and segments in advanced exergy evaluation at MIL process mode for H2 utilization.
Table 10.
Results for endogenous, exogenous, unavoidable and avoidable exergy demolition of TJE and segments in advanced exergy evaluation at AB process mode for H2 utilization.
According to Table 9 at the MIL process mode, the total avoidable exergy destruction rate of the TJE was 860.40 kW. The great section of this ratio occurred in the CC with a rate of 300.33 kW. The utmost unavoidable exergy destruction rate took place in the CC with a rate of 8174.28 kW, being equal to 85.89% of the total unavoidable exergy destruction rate (9517.63 kW) and 78.77% of the total exergy destruction (10,378.03 kW). As per Figure 7, the unavoidable demolition part of the CC was the sum of the rate of 7348.78 kW and with a rate of 825.50 kW.
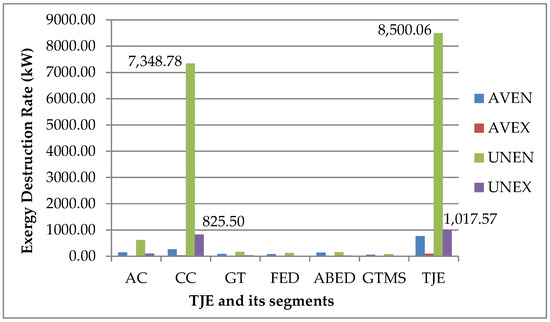
Figure 7.
Advanced exergy evaluation of TJE and its segments as per avoidable/-unavoidable endogenous/-exogenous destruction ratios at MIL process mode for H2 utilization.
The utmost endogenous exergy destruction rate occurred in the CC with a rate of 7613.87 kW. According to the obtained results, endogenous exergy destruction rates of the entire engine were greater than the exogenous destruction rates. The percentage of endogenous exergy destruction in the CC was 82.15% of the total endogenous exergy destruction (9268.47 kW) and 73.37% of the total exergy destruction in the TJE. The TJE engine had an aggregate exogenous exergy demolition rate of 1109.56 kW. The major fragments of this rate given in Table 9 were 860.74 kW in the CC, 119.75 kW in the AC, 49.74 kW in the GT and 43.50 kW in the ABED. As per Table 9, the influences of the CC and AC segments on each other not only caused their exergy destructions but also the exergy destructions of other engine segments. According to the results, while the CC segment had the utmost avoidable demolition value with a ratio of 34.91% at the MIL process mode, the ABED segment had the utmost avoidable demolition value with the ratio of 70.36% at the AB process mode. The results for endogenous, exogenous, unavoidable and avoidable exergy demolition of TJE and segments in advanced exergy evaluation at AB process mode for H2 utilization are shown in Table 10.
As per Table 10 at the AB process mode, the total avoidable exergy destruction rate of the TJE was 4694.19 kW. The great section of this ratio occurred in the ABED segment with a value of 3982.38 kW. The TJE engine had an aggregate exogenous exergy demolition rate of 5363.32 kW. The major fragments of this rate were 4297.26 kW in the ABED and 860.74 kW in the CC.
The supreme took place in the ABED with a rate of 19,083.41 kW, which was equal to 67.15% of the total unavoidable exergy destruction rate (28,419.23 kW) and 61.33% of the total exergy destruction rate (33,113.43 kW).
As per Figure 8, the unavoidable demolition part of the ABED was the sum of with a rate of 15,469.09 kW and with a rate of 3614.32 kW. In addition, the supreme occurred in the ABED with a rate of 18,768.53 kW, being equal to 81.37% of the ABED exergy destruction rate (23,065.79 kW) and 67.63% of the total endogenous exergy destruction rate (27,750.11kW). As per Table 10, rates were calculated as 682.94 kW in the ABED and 35.24 kW in the CC. The rate of the equaled to about 2.3% of the total exergy destruction in the TJE at the AB process mode while it was reckoned approximately 0.9% at the MIL process mode.
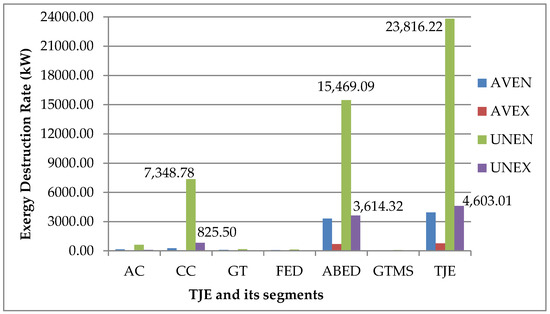
Figure 8.
Advanced exergy evaluation of TJE and its segments as per avoidable/-unavoidable endogenous/-exogenous destruction ratios at AB process mode for H2 utilization.
5. Conclusions
J85-GE-5H turbojet engine utilized on a military aircraft was assessed fully as per the exergetic and advanced exergetic analyses with the usage of kerosene and hydrogen fuels. First, exergy and advanced exergy analyses of the engine were carried out using JP-8 fuel as per actual engine operating conditions. Secondly, exergy and advanced exergy analyses results of the turbojet engine using hydrogen fuel were examined parametrically. Ultimately, the values calculated for both fuel usages were compared for the performance metric evaluation of the turbojet engine. The primary striking consequences regarding the present investigation were given hereinafter:
- Exergy destruction rate of the entire engine with JP-8 was reckoned 9108.99 kW at the MIL process mode and 28,595.47 kW at the AB process mode. With the use of H2, the exergy destruction rate of the engine at the MIL process mode was 10,378.03 kW while it was 33,113.43 kW at the AB process mode.
- Exergy efficiency of the whole engine with JP-8 was calculated 30.85% at the MIL process mode and 16.98% at the AB process mode. With the utilization of H2, the efficiency of the engine at the MIL process mode was 28.62%, whereas it was 15.33% at the AB process mode.
- When taking into account the ExIP, the improved exergy efficiency of the entire engine with JP-8 was determined to be 59.12% at the MIL process mode and 54.64% at the AB process mode. On the other hand, the improved exergy efficiency of the engine at the MIL process mode was 58.35%, whereas it was 54.15% at the AB process mode by using H2.
- The product exergy rates of the engine were calculated for JP-8 usage at MIL and AB process modes with the rates of 5106.21 and 8575.33 kW, respectively, while they were obtained as 5035.44 and 8228.21 kW with the utilization of H2.
- Since the mass flow rates of H2 fuel were less than those of JP-8 fuel’, the SFC values were determined less for H2 usage.
- The unavoidable exergy destructions rates of the engine were calculated for JP-8 usage at MIL and AB process modes with the rates of 8458.81 and 25,051.59 kW, respectively, while they were determined 9517.63 and 28,419.23 kW with the utilization of H2. Besides, the UNEN exergy destruction had the biggest exergy demolition portion in the entire system for both fuel utilizations. Hence, the system has little betterment capability.
- The endogenous exergy destruction rates of the engine were computed for kerosene usage at MIL and AB process modes with the rates of 8211.69 and 24,402.70 kW, respectively, while they were determined as 9268.47 and 27,750.11 kW with the utilization of H2.
- The exogenous destruction rates of the engine were calculated for kerosene usage at MIL and AB process modes with the rates of 897.30 kW and 4192.77 kW, respectively, while they were determined as 1109.56 kW and 5363.32 kW with the utilization of H2.
- Since the endogenous exergy destruction rates were determined larger than the exogenous destruction rates, the interplays among the engine segments were poor.
- The avoidable exergy destruction rates of the engine were calculated for JP-8 usage at MIL and AB process modes with the rates of 650.18 and 3543.88 kW, respectively, while they were determined as 860.40 and 4694.19 kW with the utilization of H2. Moreover, the AVEX exergy destruction had the smallest exergy demolition portion in the entire system for both fuel utilizations.
Among the engine segments, the CC and ABED segments had the supreme exergy destruction rate, unavoidable exergy destruction rate, product exergy waste rate, relative exergy waste rate and fuel exergy waste rate and ExIP for both fuel usages. These results indicated that the main factor causing a decrease in the efficiency of the TJE was the low efficiency of the CC and ABED segments due to the irreversibilities that occurred in the burnout process. Moreover, the uplift potentials were by a majority pertinent to the segments due to the internal demolition ratio was larger than the external demolition ratio. The main destructions that occurred due to internal heat transfers from the burned fuel to the air-fuel mixture, could cause constraints to achieve a more beneficial work. In other words, these analyses pointed out that those segments, which were in the border of thermodynamic restrictions based on the unavoidable endogenous destruction rates, were to be manufactured more efficiently with conventional manufacturing technology. Therefore, it has been important to increase the turbine inlet temperature (TIT) and the compressor pressure ratio in order to increase the overall efficiency of the engine by reducing inefficiencies in the ABED and CC segments. With the development of gas turbine manufacturing technology in terms of materials and production methods in recent years, it is thought that gas turbine engines, which would be produced monolithic by a 3D print manufacturing method, could work more eco-friendly and efficiently by reducing exergy destructions.
As a result, the engine worked less efficiently with hydrogen fuel due to the enhancement in exergy destructions. Conversely, the GHG emissions lessened with the utilization of H2 fuel were clearly put forth in the article according to the mass rates that were exhausted from the engine.
Author Contributions
Conceptualization, B.Y. and O.B.; methodology, B.Y.; software, B.Y.; validation, B.Y., O.B. and H.G.; formal analysis, B.Y.; investigation, B.Y.; resources, B.Y and O.B.; data curation, O.B.; writing—original draft preparation, B.Y.; writing—review and editing, B.Y., H.G and A.H. All authors have read and agreed to the published version of the manuscript.
Funding
This research received no external funding.
Acknowledgments
The authors are very grateful to the four reviewers and Associate Editor for their constructive and valuable suggestions.
Conflicts of Interest
The authors declare no conflict of interest.
Nomenclature
| area (m2) | |
| specific heat capacity (kJ/(kg·K)) | |
| energy rate (kW) | |
| exergy rate (kW) | |
| exergetic improvement potential rate (kW) | |
| thrust (kN) | |
| lower heating value of fuel (kJ/kg) | |
| mass flow ratio (kg/s) | |
| pressure (kPa) | |
| heat transfer rate (kW) | |
| specific fuel consumption ((kg/h)/kN) | |
| temperature (°C or K) | |
| velocity (m/s) | |
| work rate (kW) | |
| Greek Letters | |
| fuel exergy demolition rate (%) | |
| relative exergy consumption rate (%) | |
| productivity lack rate (%) | |
| exergy (second law) yield (%) | |
| improved exergy yield (%) | |
| Subscripts | |
| air | |
| afterburner exhaust duct | |
| air compressor | |
| consumption | |
| combustion chamber | |
| destroyed, destruction | |
| fuel | |
| forward exhaust duct | |
| combustion gas | |
| gas turbine | |
| gas turbine mechanic shaft | |
| inlet | |
| losses | |
| n-th segment | |
| outlet | |
| pressure | |
| product | |
| temperature | |
| turbojet engine | |
| reference state | |
| station numbering of segments | |
| Superscripts | |
| avoidable | |
| avoidable-endogenous | |
| avoidable-exogenous | |
| endogenous | |
| exogenous | |
| real | |
| unavoidable | |
| unavoidable-endogenous | |
| unavoidable-exogenous | |
| Abbreviations | |
| afterburner process mode | |
| air compressor | |
| afterburner exhaust duct | |
| combustion chamber | |
| continuous flow continuous open | |
| forward exhaust duct | |
| gas turbine | |
| gas turbine mechanic shaft | |
| military process mode | |
| segment | |
| turbine inlet temperature | |
| turbojet engine | |
References
- Turgut, E.T. Exergoeconomic Analysis of Aircraft Gas Turbine Engines. Ph.D. Thesis, Anadolu University, Eskisehir, Turkey, 2007. [Google Scholar]
- Atılgan, R.; Turan, O.; Altuntas, O.; Aydin, H.; Synylo, K. Environmental impact assessment of a turboprop engine with the aid of exergy. Energy 2013, 58, 664–671. [Google Scholar] [CrossRef]
- Aydin, H.; Turan, O.; Karakoc, T.H.; Midilli, A. Exergetic sustainability indicators as a tool in commercial aircraft: A case study for a turbofan engine. Int. J. Green Energy 2015, 12, 28–40. [Google Scholar] [CrossRef]
- Lee, J.J. Can we accelerate the improvement of energy efficiency in aircraft systems? Energy Convers. Manag. 2010, 51, 189–196. [Google Scholar] [CrossRef]
- Morsli, S.; Amina, S.; Ganaoui, M.E.; Ramenah, H. Computational simulation of entropy generation in a combustion chamber using a single burner. Entropy 2018, 20, 922. [Google Scholar] [CrossRef]
- Lee, J.J.; Lukachko, S.P.; Waitz, I.A.; Schafer, A. Historical and future trends in aircraft performance, cost and emissions. Annu. Rev. Energy Environ. 2001, 26, 167–200. [Google Scholar] [CrossRef]
- Elitzur, S.; Rosenband, V.; Gany, A. On-board hydrogen production for auxiliary power in passenger aircraft. Int. J. Hydrog. Energy 2017, 42, 14003–14009. [Google Scholar] [CrossRef]
- Nanaki, E.A.; Koroneos, C.J. Exergetic aspects of hydrogen energy systems—The case study of a fuel cell bus. Sustainability 2017, 9, 276. [Google Scholar] [CrossRef]
- Dincer, I.; Acar, C. A review on potential use of hydrogen in aviation applications. Int. J. Sustain. Aviat. 2016, 2, 74–100. [Google Scholar] [CrossRef]
- Alayi, R.; Nemati, R.; Shamel, A.; Kasaeian, A.; Sarkaleh, M.K.; Ahmadi, M.H. Energetic and exergetic analysis hybrid solid oxide fuel cell systems and gas turbine (SOFC-GT). Math. Modell. Eng. Prob. 2019, 6, 263–270. [Google Scholar] [CrossRef]
- Cecere, D.; Giacomazzi, E.; Ingenito, A. A review on hydrogen industrial aerospace applications. Int. J. Hydrog. Energy 2014, 39, 10731–10747. [Google Scholar] [CrossRef]
- Stamatis, A.; Vinni, C.; Bakalis, D.; Tzorbatzoglou, F.; Tsiakaras, P. Exergy analysis of an intermediate temperature solid oxide fuel cell-gas turbine hybrid system fed with ethanol. Energies 2012, 5, 4268–4287. [Google Scholar] [CrossRef]
- Harsha, S. Liquid hydrogen as aviation fuel and its relative performance with commercial aircraft fuel. Int. J. Mech. Eng. Robotic Res. 2014, 1, 73–77. [Google Scholar]
- Khandelwal, B.; Karakurt, A.; Sekaran, P.R.; Sethi, V.; Singh, R. Hydrogen powered aircraft: The future of air transport. Prog. Aerosp. Sci. 2013, 60, 45–59. [Google Scholar] [CrossRef]
- Mahmoudi, S.M.S.; Sarabchi, N.; Yari, M.; Rosen, M.A. Exergy and exergoeconomic analyses of a combined power producing system including a proton exchange membrane fuel cell and an organic rankine cycle. Sustainability 2019, 11, 3264. [Google Scholar] [CrossRef]
- Klug, H.G.; Faass, R. Cryoplane: Hydrogen fuelled aircraft-status and challenges. Air Space Eur. 2001, 3, 252–254. [Google Scholar] [CrossRef]
- Westenberger, A. Hydrogen Fuelled Aircraft. In Proceedings of the AIAA International Air and Space Symposium and Exposition: Next 100 Years, AIAA 2003–2880, Dayton, OH, USA, 14–17 July 2003. [Google Scholar]
- Bicer, Y.; Dincer, I. Life cycle evaluation of hydrogen and other potential fuels for aircrafts. Int. J. Hydrog. Energy 2017, 42, 10722–10738. [Google Scholar] [CrossRef]
- Gohardani, A.S.; Doulgeris, G.; Singh, R. Challenges of future aircraft propulsion: A review of distributed propulsion technology and its potential application for the all electric commercial aircraft. Prog. Aerosp. Sci. 2011, 47, 369–391. [Google Scholar] [CrossRef]
- Sarlioglu, B.; Morris, C.T. More electric aircraft: Review, challenges and opportunities for commercial transport aircraft. IEEE Trans. Transp. Electrif. 2015, 1, 54–64. [Google Scholar] [CrossRef]
- Blakey, S.; Rye, L.; Wilson, C.W. Aviation gas turbine alternative fuels: A review. Proc. Combust. Inst. 2011, 33, 2863–2885. [Google Scholar] [CrossRef]
- International Coordinating Council of Aerospace Industries Associations. Non-drop in fuels and advanced aircraft system power technologies. In Proceedings of the Conference on Aviation and Alternative Fuels, CAAF/09-IP/13, Rio de Janeiro, Brazil, 16–18 November 2009. [Google Scholar]
- ASTM. ASTMD1655-18a, Standard Specification for Aviation Turbine Fuels; ASTM International: West Conshohocken, PA, USA, 2018. [Google Scholar]
- Rivard, E.; Trudeau, M.; Zaghib, K. Hydrogen storage for mobility: A Review. Materials 2019, 12, 1973. [Google Scholar] [CrossRef]
- Cooper, J.; Dingle, L. Engineering an afterburner for a miniature gas turbine engine. Aircr. Eng. Aerosp. Tech. 2005, 77, 104–108. [Google Scholar] [CrossRef]
- Li, H.; Chen, Y.; Tan, T.; Du, J.; Zhou, J.; Liu, C. Design and characteristic calculation of combustion chamber of hydrogen-fueled scramjet based on constant static temperature heating method. In Proceedings of the 2019 IEEE 10th International Conference on Mechanical and Aerospace Engineering (ICMAE), Brussels, Belgium, 22–25 July 2019. [Google Scholar]
- Safaei, H.; Aziz, M.J. Thermodynamic analysis of three compressed air energy storage systems: Conventional, adiabatic and hydrogen-fueled. Energies 2017, 10, 1020. [Google Scholar] [CrossRef]
- Kurt, H.; Recebli, Z.; Gedik, E. Performance analysis of open cycle gas turbines. Int. J. Energy Res. 2009, 33, 285–294. [Google Scholar] [CrossRef]
- Karakoc, T.H.; Turgut, E.T.; Hepbasli, A. A study on exergy analysis of a hydrogen fuelled turbofan engine. In Proceedings of the 3rd International Green Energy Conference, IGEC-2007, Västerås, Sweden, 18–20 June 2007. [Google Scholar]
- Ehyaei, M.A.; Anjiridezfuli, A.; Rosen, M.A. Exergetic analysis of an aircraft turbojet engine with an afterburner. Therm. Sci. 2013, 17, 1181–1194. [Google Scholar] [CrossRef]
- Balli, O. Afterburning effect on the energetic and exergetic performance of an experimental turbojet engine (TJE). Int. J. Exergy 2014, 14, 212–243. [Google Scholar] [CrossRef]
- Sohret, Y.; Sogut, M.Z.; Karakoc, T.H.; Turan, O. Customised application of exergy analysis method to PW120A turboprop engine for performance evaluation. Int. J. Exergy 2016, 20, 48–65. [Google Scholar] [CrossRef]
- Ekici, S.; Altuntas, O.; Acikkalp, E.; Sogut, M.Z.; Karakoc, T.H. Assessment of thermodynamic performance and exergetic sustainability of turboprop engine using mixture of kerosene and methanol. Int. J. Exergy 2016, 19, 295–314. [Google Scholar] [CrossRef]
- Balli, O.; Hepbasli, A. Exergoeconomic, sustainability and environmental damage cost analyses of T56 turboprop engine. Energy 2014, 64, 582–600. [Google Scholar] [CrossRef]
- Turan, O. An exergy way to quantify sustainability metrics for a high bypass turbofan engine. Energy 2015, 86, 722–736. [Google Scholar] [CrossRef]
- Coban, K.; Colpan, C.; Karakoc, T. Energy and exergy analysis of an helicopter engine. J. Sustain. Aviat. Res. 2016, 1, 27–39. [Google Scholar]
- Kaya, N.; Turan, O.; Midilli, A.; Karakoc, T.H. Exergetic sustainability improvement potentials of a hydrogen fueled turbofan engine UAV by heating its fuel with exhaust gasses. Int. J. Hydrog. Energy 2016, 41, 8307–8322. [Google Scholar] [CrossRef]
- Yucer, C.T. Thermodynamic analysis of the part load performance for a small scale gas turbine jet engine by using exergy analysis method. Energy 2016, 111, 251–259. [Google Scholar] [CrossRef]
- Balli, O. Exergy modeling for evaluating sustainability level of a high by-pass turbofan engine used on commercial aircrafts. Appl. Therm. Eng. 2017, 123, 138–155. [Google Scholar] [CrossRef]
- Coban, K.; Colpan, C.O.; Karakoc, T.H. Application of thermodynamic laws on a military helicopter engine. Energy 2017, 140, 1427–1436. [Google Scholar] [CrossRef]
- Ekici, S.; Sohret, Y.; Coban, K.; Altuntas, O.; Karakoc, T.H. Performance evaluation of an experimental turbojet engine. Int. J. Turbo. Jet Eng. 2017, 34, 365–375. [Google Scholar] [CrossRef]
- Naemi, S.; Avval, M.S.; Kalhori, S.B.; Mansoori, Z. Optimum design of dual pressure heat recovery steam generator using non-dimensional parameters based on thermodynamic and thermoeconomic approaches. Appl. Therm. Eng. 2013, 52, 371–384. [Google Scholar] [CrossRef]
- Tai, V.C.; See, P.C.; Mares, C. Optimisation of energy and exergy of turbofan engines using genetic algorithms. Int. J. Sustain. Aviat. 2014, 1, 25–42. [Google Scholar] [CrossRef]
- Erbay, Z.; Hepbasli, A. Application of conventional and advanced exergy analyses to evaluate the performance of a ground-source heat pump (GSHP) dryer used in food drying. Energy Convers. Manag. 2014, 78, 499–507. [Google Scholar] [CrossRef]
- Tsatsaronis, G.; Park, M.H. On avoidable and unavoidable exergy destructions and investment costs in thermal systems. Energy Convers. Manag. 2002, 43, 1259–1270. [Google Scholar] [CrossRef]
- Shivam, M.; Sohret, Y.; Sanjay, O. Advanced exergy analysis of aero gas turbine cycle based on air-film blade cooling. In Proceedings of the International Symposium on Sustainable Aviation, ISSA-2017-302, Kiev, Ukraine, 10–13 September 2017. [Google Scholar]
- Vatani, A.; Mehrpooya, M.; Palizdar, A. Advanced exergetic analysis of five natural gas liquefaction processes. Energy Convers. Manag. 2014, 78, 720–737. [Google Scholar] [CrossRef]
- Anvari, S.; Saray, R.K.; Bahlouli, K. Conventional and advanced exergetic and exergoeconomic analyses applied to a tri-generation cycle for heat, cold and power production. Energy 2015, 91, 925–939. [Google Scholar] [CrossRef]
- Balli, O. Advanced exergy analyses of an aircraft turboprop engine (TPE). Energy 2017, 124, 599–612. [Google Scholar] [CrossRef]
- Wu, Z.; Zou, S.; An, L. The second law (exergy) analysis of hydrogen. J. Sustain. Dev. 2011, 4, 260–263. [Google Scholar] [CrossRef][Green Version]
- Tsatsaronis, G. Recent developments in exergy analysis and exergoeconomics. Int. J. Exergy 2008, 5, 489–499. [Google Scholar] [CrossRef]
- Rakopoulos, C.D.; Giakoumis, E.G. Second-law analyses applied to internal combustion engines operations. Prog. Energy Combust. Sci. 2006, 32, 2–47. [Google Scholar] [CrossRef]
- Song, Z.; Jiaxuan, W. The Principle of Energy-Saving; Water Resources and Electric Power Press Water Conversancy and Electric Power Press: Beijing, China, 1985. [Google Scholar]
- El-Sayed, A.F. Aircraft propulsion and gas turbine engines. In Aircraft Propulsion and Gas Turbine Engines, 2nd ed.; CRC Press: Boca Raton, FL, USA, 2017. [Google Scholar]
- Campbell, L.J.; Fisher, J.W. A PBPK modeling assessment of the competitive metabolic interactions of JP-8 vapor with two constituents, m-xylene and ethyl benzene. Inhal. Toxicol. 2007, 19, 265–273. [Google Scholar] [CrossRef]
- Borman, G.L.; Ragland, K.W. Combustion Engineering, International ed.; Mc Graw-Hill Co: Singapore, 1998. [Google Scholar]
- Cengel, Y.A.; Boles, M.A. Thermodynamics: An Engineering Approach, 8th ed.; Mc Graw-Hill Education: New York, NY, USA, 2014. [Google Scholar]
- Moran, M.J.; Shapiro, H.N. Fundamentals of Engineering Thermodynamics, 3rd ed.; Wiley: New York, NY, USA, 1995. [Google Scholar]
- Balli, O. Maximum operation performance evaluation of a turbojet engine designed for missiles and Unmanned Aerial Vehicles (UAV) with exergy analysis methodology. Erciyes Univ. J. Inst. Sci. Tech. 2019, 35, 13–32. [Google Scholar]
- Sohret, Y.; Acikkalp, E.; Hepbasli, A.; Karakoc, T.H. Advanced exergy analysis of an aircraft gas turbine engine: Splitting exergy destructions into parts. Energy 2015, 90, 1219–1228. [Google Scholar] [CrossRef]
- Kelly, S.; Tsatsaronis, G.; Morosuk, T. Advanced exergetic analysis: Approaches for splitting the exergy destruction into endogenous and exogenous parts. Energy 2009, 34, 384–391. [Google Scholar] [CrossRef]
- Wei, Z.; Zhang, B.; Wu, S.; Chen, Q.; Tsatsaronis, G. Energy-use analysis and evaluation of distillation systems through avoidable exergy destruction and investment costs. Energy 2012, 42, 424–433. [Google Scholar] [CrossRef]
- Callak, M.; Balkan, F.; Hepbasli, A. Avoidable and unavoidable exergy destructions of a fluidized bed coal combustor and a heat recovery steam generator. Energy Convers. Manag. 2015, 98, 54–58. [Google Scholar] [CrossRef]
- Petrakopoulou, F.; Tsatsaronis, G.; Morosuk, T.; Carassai, A. Conventional and advanced exergetic analyses applied to a combined cycle power plant. Energy 2012, 41, 146–152. [Google Scholar] [CrossRef]
- Balli, O.; Sohret, Y.; Karakoc, T.H. The effects of hydrogen fuel usage on the exergetic performance of a turbojet engine. Int. J. Hydrog. Energy 2018, 43, 10848–10858. [Google Scholar] [CrossRef]


© 2020 by the authors. Licensee MDPI, Basel, Switzerland. This article is an open access article distributed under the terms and conditions of the Creative Commons Attribution (CC BY) license (http://creativecommons.org/licenses/by/4.0/).