Article

Performance Evaluation of Bus Rapid Transit System: A Comparative Analysis of Alternative Approaches for Energy Efficient Eco-Friendly Public Transport System

1
Department of Civil Engineering, Pakistan Institute of Engineering and Technology, Multan 66000, Pakistan
2
Department of Civil Engineering, University of Engineering and Technology, Taxila 47080, Pakistan
3
NFC- Institute of Engineering and Technology, Multan 66000, Pakistan
4
Transportation Research Institute (IMOB), UHasselt, Agoralaan, B-3590 Diepenbeek, Belgium
5
Department of Civil Engineering, HITEC University, Taxila 47080, Pakistan
6
Department of Civil Engineering, Bahauddin Zakariya University, Multan 66000, Pakistan
7
Department of Mechanical Engineering, École de Technologie Supérieure, ÉTS, Montreal, QC H3C 1K3, Canada
8
Bayreuth Centre for Ecology and Environmental Research, University of Bayreuth, 95440 Bayreuth, Germany
*
Author to whom correspondence should be addressed.
Energies 2020, 13(6), 1377; https://doi.org/10.3390/en13061377
Submission received: 7 February 2020 / Revised: 12 March 2020 / Accepted: 14 March 2020 / Published: 16 March 2020
(This article belongs to the Section B: Energy and Environment)

Abstract

:
The development of the bus rapid transit system (BRTS) is tremendously growing in developing countries of the world. In large cities, the projection of transportation intends to enhance economic growth and changes the image of the city for both residents and outsiders. The purpose of this research was to study the application of alternative options for energy efficient BRTS in developing countries. The BRTS has some of its accessibility patterns that relate to the socio-economic strata. A decision-making efficiency analysis methodology has been applied to analyze the comparative analysis of both conventional fuel and hybrid bus systems for the Multan city of Pakistan. The section-wise application of a hybrid energy-based bus system has been analyzed in comparison to the conventional bus system. Out of 21 stations, the efficiency-wise hybrid bus system remained superior or equivalent to the standard value of 1 except one midpoint section. The finding of the analysis indicates that the hybrid mechanism of buses can not only replace a conventional fuel-based system, but will also help as an energy-efficient and eco-friendly economical solution. This study will help to revolutionize the bus rapid transit system in developing countries.

1. Introduction

Bus rapid transit systems have witnessed outstanding growth in the recent years. The new implementations are taking place throughout the cities of the developing countries. These systems are relatively inexpensive with greater flexibility, as compared with railway systems and their promise to encourage economic revitalization [1]. The project of the bus rapid transit (BRT) type of transportation setup intends to enhance economic growth and changes the image of the city for both residents and outsiders. A successful system is a system that provides access to all residents of the city. Bus rapid transit is an economical substitute for other modes of transport [2]. It is highly operational in well-built countries. A bus rapid transit system (BRTS) matches the features and performance of the contemporary rail system, includes station facilities, ticketing, and the row of way. However, BRTS has benefits well over rail transit, which includes lesser execution cost, lesser construction cost, accommodation of many routes, and relaxation towards town conditions [3,4]. In the past years, this system has become more popular in urban transit, particularly in emerging capitals. Almost six continents have applied this system, comprising more than 166 cities, and most of them are in construction phases [5]. To evaluate the performance of newly introduced public transport facilities is the core theme of the research. In view of the above, the enlisted objectives are as follows: (a) To study the performance of BRTS as a safe, reliable and efficient transport for the people of Pakistan, (b) to analyze the performance of BRTS against traffic congestion, (c) the analysis of an attractive alternative in terms of time and convenience, (d) to carry out a service performance evaluation of Multan BRTS, and (e) to conduct an energy-efficient operational analysis of BRTS and to recommend solutions for the improvement of bus transit services. A combination of increasing population, increased automobile ownership, and insufficient road space created a situation of long commute times within an average speed of 40 km/h, with a very high accident rate. The air pollution also appears to be increasing every day. In the last ten years, the travel time for persons of the cities declined by 32% and there was an increase in pollution [1]. Given this situation, the city of Multan invested a new transit system that was aimed at increasing the population, efficiency, and competitiveness, and contributing to the inclusive sustainability aims of these cities.
This study is focused on the feasibility analysis of alternatives for focus on the performance of an energy-efficient bus system to improve the efficiency and environment-friendly bus rapid transit system operating in developing countries. To study the performance analysis, a first-time benchmarking technique has been applied to insight realistic conditions for the energy efficient BRTS. The benchmarking technique like the data envelopment analysis (DEA) can help to implement energy-saving alternatives like hybrid bus systems with multiple inputs and multiple outputs. This study will help in the comparative analysis of resources with practical implications and policy development. The case study of the BRT system for the city of Multan has been considered to study the performance of the developing city of the Asian region. This is a first-time study, related to the implementation of an energy-efficient public transport bus system in this region of South Asia.

2. Background

Bus rapid transit system (BRTS) is described as “an integrated system of facilities, services, and amenities that collectively improve the speed, reliability, and identity of bus transit” [6]. It is an assimilated system with good quality buses, distinct infrastructure, and limited mix traffic running way and designed for greater speed, reliability, and safety. BRTS has a separate bus lane and limited large spacing stops compared with local buses. BRTS is provided as it has a high speed, more capacity, an increased reliability, a successful attraction of ridership, and environmental, social, and economic benefits [7].

2.1. Key Features of Bus Rapid Transit System (BRTS)

BRTS, a unique modern standardized public transit service comprising innumerable amenities, technologies, and facilities to provide a quality public bus service has the forthcoming key elements. To make the system more friendly and attractive to commuter and riders’ perception of the service quality required effective, exact, and reachable commuter information technologies. To get route guidance, scheduled prior to starting a trip is required by the commuter, and the source of the information may be the telephone or internet [7]. Real-time bus information including bus arrival time, next to bus station distance, name of current station, next station arrival time, location information, service alerts, and interchange facilities information are required to improve the BRTS ridership by reducing waiting time fears [7]. All the above stated features of BRTS assimilated to form a system, stated as BRTS [7]. The layout features, design characteristics, operational techniques, and all features of BRTS may vary from system to system, depending upon the land use pattern, investment plan, and environmental consideration.

2.2. Energy Consumption

Worldwide fuel energy consumption for the transport sector is increasing, and this is one of the largest energy consumption and environment-related issues. Consumption of transport fuel and future prediction for Pakistan can be seen in Figure 1. To solve this problem, energy-efficient solutions are necessary. Developing countries cannot afford to consume the high value of fuel for public transport, especially for BRTS. Otherwise, it increases the travel cost with the change in market fuel rates and makes public transport out of reach from the pocket of common travelers.
After the successful implementation of BRTS, its performance analysis was under the core target of the study. The fuel-saving and energy-efficient public transport system is now a major goal for future studies. To study these features, a carbon footprint concept with reference to BRTS was to be studied in a view of environmental impact [9]. Different fuel consumption parameters like compressed natural gas (CNG), Diesel Fuel features were also discussed [10]. Overall energy-efficient performance study is necessary for BRTS for the efficient rapid bus transit system [1,11,12,13,14]. Fuel and energy consumption for public transport utilization is one of the cases to be studied for an efficient transport system [15,16,17].

2.3. Spatial Accessibility

Spatial accessibility, in order to provide easy transport facility, plays an important role for the urban development. The bus system works as a backbone and replacement of the transport system for efficient and effective transportation modes [18,19,20,21]. Thus, some of the policies had been made to overcome the problem that causes impedance between residents and employment areas. Due to this, transportation with spatial accessibilities of housing authorities to the services of urban areas is being made easy. The best solution was to link the people to the social areas by means of transportation that connects the people to the society with a lot of ease. Bus rapid transit (BRT) has increasingly become an attractive urban transit alternative [3,14,21,22,23,24] especially in developing cities, due to its cost-effective and flexible implementation [14]. The BRT system has particular stations at the most critical areas, which are fully commercial, overpopulated, and recreational. The main point is the planning that leads to the connectivity of people to the BRT system, with ease and a better economy. A system that has to be run must be compatible and accessible to the residents at each point of the route. One can travel easily to the BRT system, by taking a little walk from houses. This is the main accessibility that a system should provide in order to increase its performance. Each person must be able to perform each activity relating to society without any resistance. This resistance is reduced by better planning of the route selection and station selection of the BRT system, where anyone can have access, from any place, to the BRT system. Thus, the attractive places and locations that are highly demanded must be connected closely to the BRT stations, so that everyone can take advantage of this system. This advantage only seems to be possible if the system is provided with excellent spatial accessibility to the targeted locations of the society.

3. Materials and Methods

3.1. Framework

The basic framework followed for the analysis of energy-efficient public transport bus system alternatives is shown in Figure 2. A step-by-step working formation has been designed following previous patterns [25,26] given in the flowchart.
Step 1: The selection of study area and BRT route map;
Step 2: Data collection from BRT offices and field data collection;
Step 3: Data stratification and analysis (for travel route segmentations, travel speed and time analysis, roadway condition, traffic flow, urban land regional analysis, and fuel consumption);
Step 4: Comparative data analysis of BRT alternatives (1—conventional fuel based bus system and 2—hybrid battery based bus system);
Step 5: Efficiency performance analysis using benchmarking concept with the help of data envelopment analysis (DEA), with the concept of maximizing output and minimizing input;
Step 6: Decision making based on efficiency analysis for the application of alternatives for the energy-efficient BRT system.

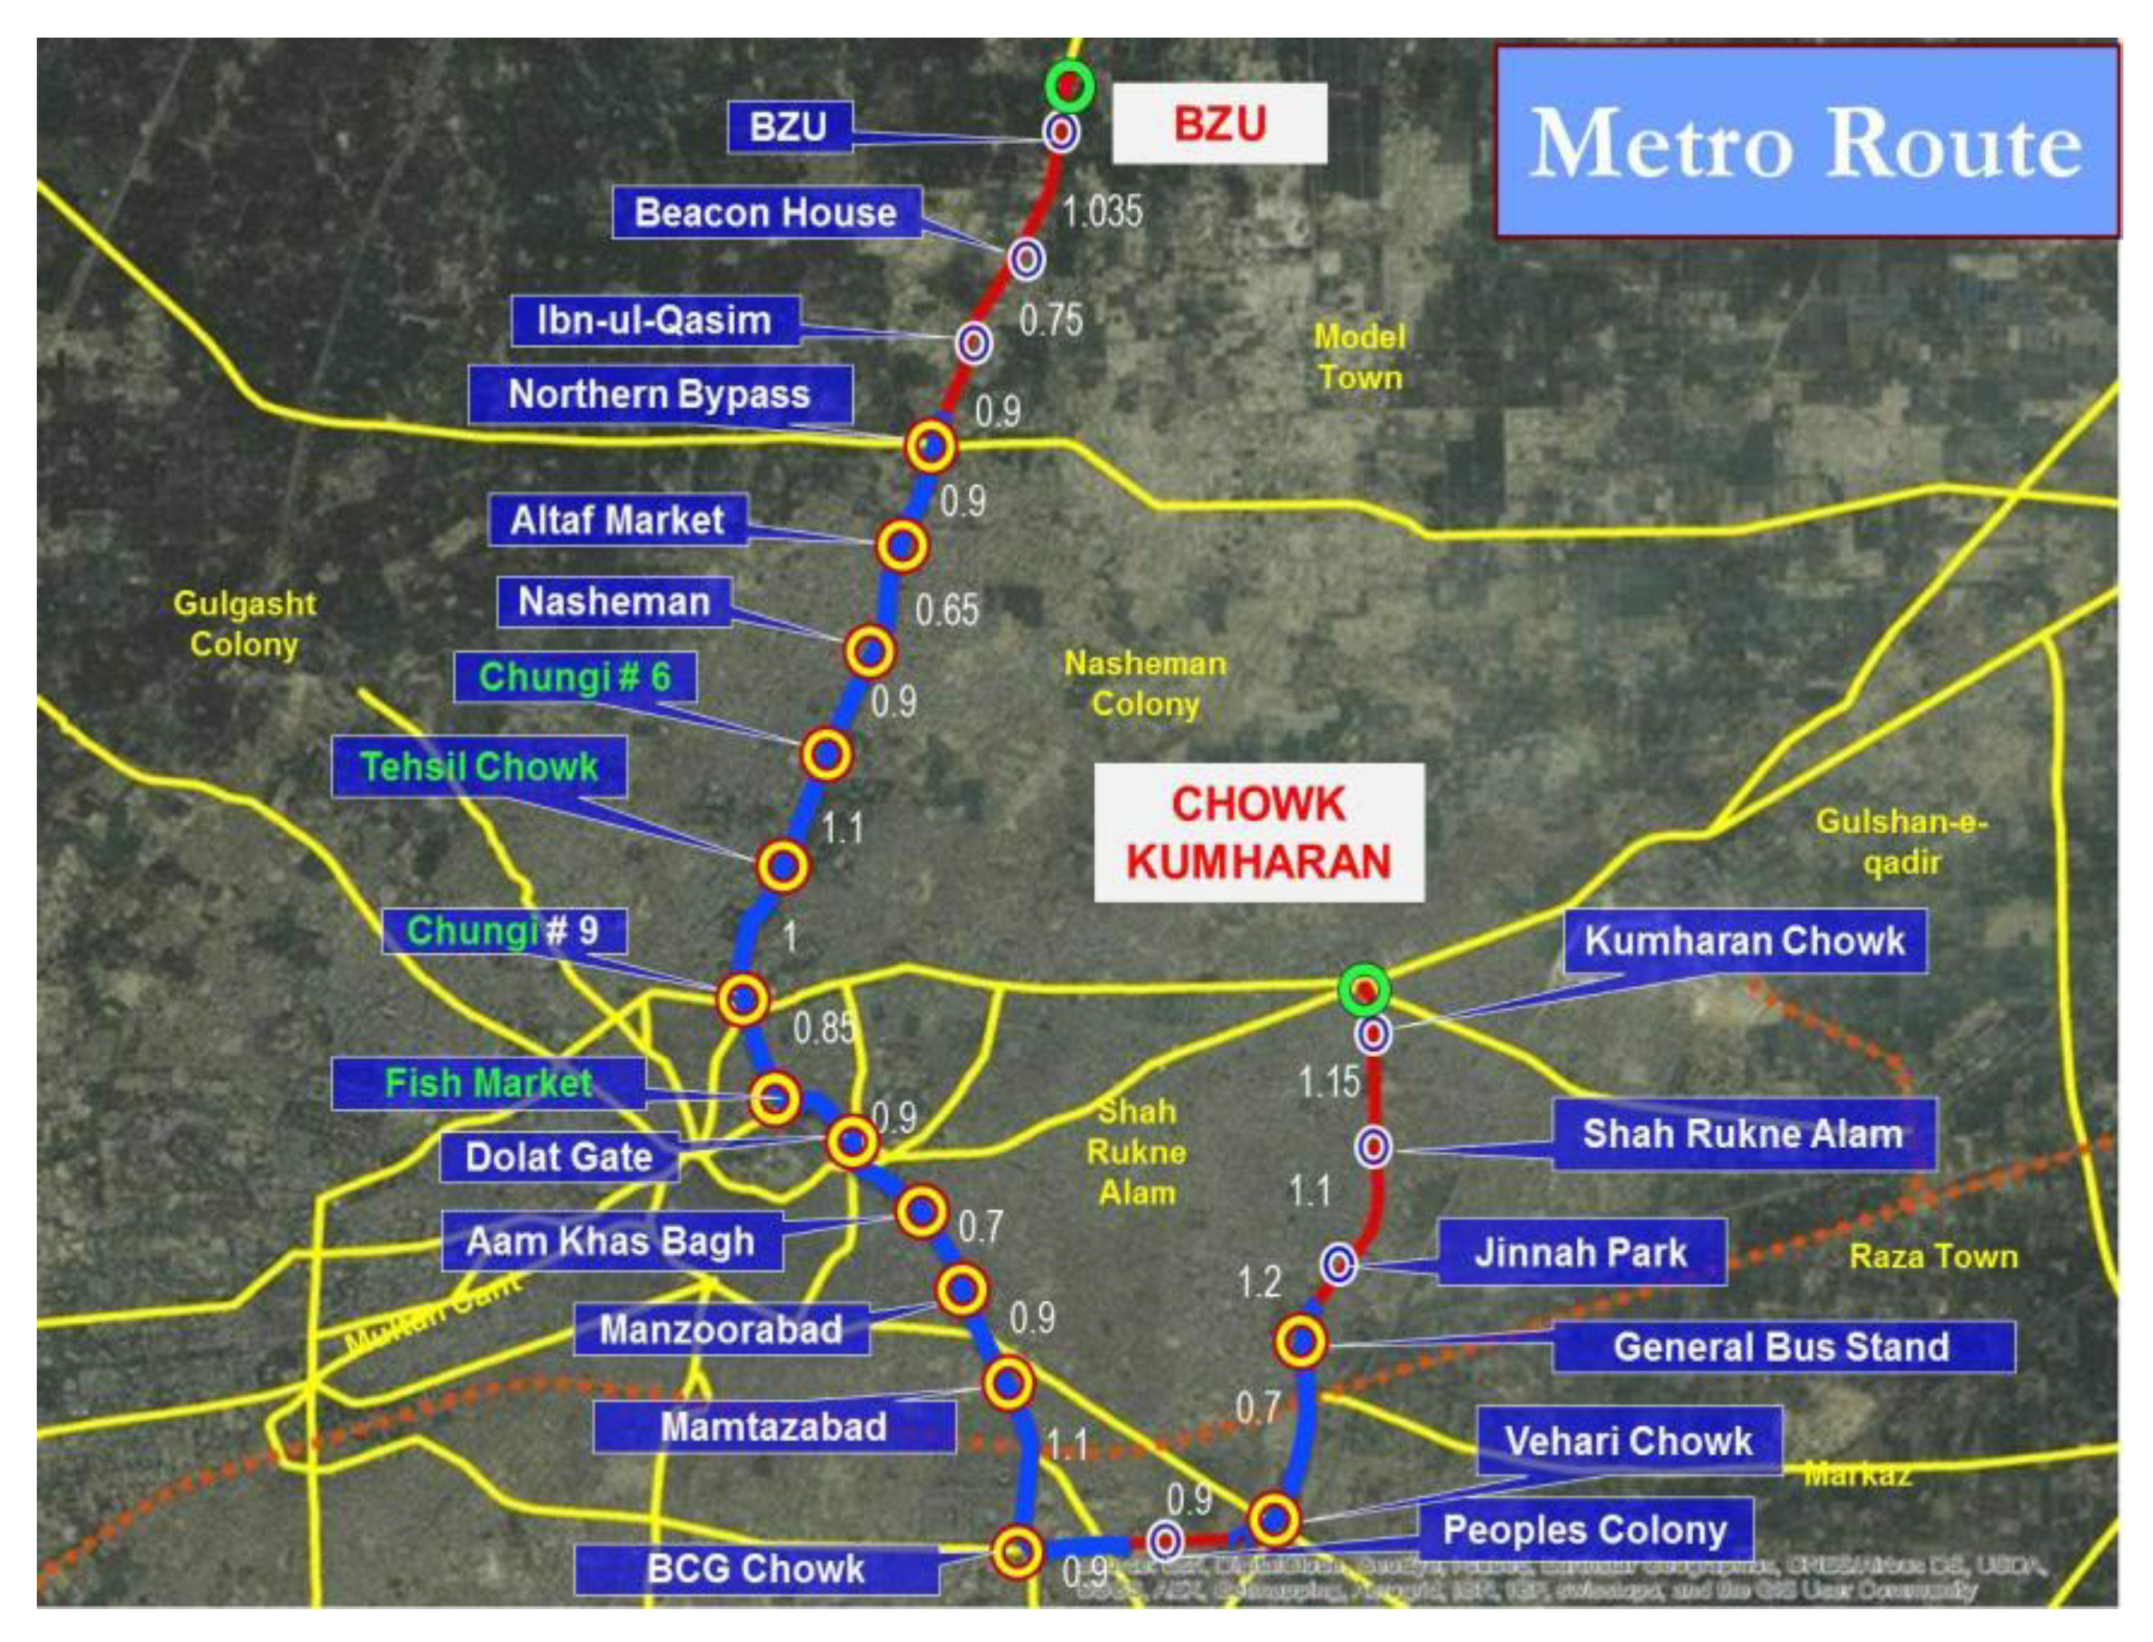
3.2. Study Area and Data Collection

The city of Multan (known as the city of saints) is the seventh-largest city of Pakistan and is located in the south region. It covers 132.1 sq. km of area. Multan had a population of 1.31 million in the 1998 census, but it has increased up to 1.87 million in 2018 [27]. This means that Multan has an average growth rate of 2.6% annually. It is often called the city of saints. Multan has a critical condition in terms of income and inequality. The city is small and is overpopulated; thus, the road system is bearing a burden that causes a lot of problems for the inhabitants. It also causes problems like congestion, accidents, pollution, etc. Hence, the government has decided to overcome this problem in Multan by the development of the BRTS. The traffic route planning was poor, which caused the failure of the BRT system in Multan. The BRT system of the Multan corridor is approximately 18.5 km in length, which has been developed for the cost of 200 million United States dollars (USD). It also consists of 21 stations variable in length. Some of the sections are located at ground level and the rest is elevated. The elevated portion is 6.5 km, while 12 km are at grade level. The Multan BRT system carries 5–10 thousand persons daily, which is considered to be a good number of passengers. The BRT system consists of different types of corridors such as the feeder, stops and stations, access to a pedestrian, and main and other terminals along a control center unit. The BRT Route plane is shown in Figure 3.
Complete data about infrastructures and operation was available from the BRT authorities. Some of the variables were taken out directly and some of them were collected indirectly. Official data were collected from BRTS offices and the remaining data were physically collected from the BRT travelers through a questionnaire. The analysis was manual and followed a standard iterative process used for qualitative data, based on the content analysis theory. This section intends to summarize the overall investigation procedure that was directed in May 2018 in Multan. Route lists were acquired from the Bus Rapid Transit Authority, and these were followed by a survey. These provided the concrete data for the quantitative measures developed in this study. The security staff and BRT representative helped to complete the survey. To make the data more precise to randomness, data were collected during three peak hours (8:00–9:00), (13:00–14:00), (17:00–18:00). Therefore, the following variables could be further used to distinguish the good and bad performance of the bus rapid transit systems. A flow chart below Figure 3 explains the methodology quite significantly. A structural framework of the whole study methodology is made, and through it, the methodology is well explained along with its other various important factors or components.

3.3. Data Stratification and Analysis

After the collection of data, the BRT system performance was analyzed with graphical visualization. In the case of this BRT system, the evaluation was made by calculating some of the variables which serve as an important factor in determining the performance analysis of the BRT system. Variables were calculated by means of field visits, official visits to the officials, and taking some confidential information. The focus was to study the data related to the travel cost, inflow rate or ridership, BRT travel speed, signals, crossing or intersections all over the BRT routes, educational institutes (presence/number of institutes in that area), roadway conditions, urban area type along the BRT route, population density, speed limit, stopping time, travel time, and traveler numbers. These variables have been studied by means of field visits and official visits. The travel time has been calculated for both the BRT system of Multan by means of Global Positioning System (GPS) and confidential works. Some of the other variables, like cost, have been fixed by the government as (0.125 USD) per person, through which the traveler can travel at any place throughout the city. These variables help to evaluate the object or the BRT system. There are a few other important factors that are included in the methodology, which determine or help to determine the BRT performance of Multan. The stratification was also done for the required areas. The city streets were divided into a number of strata, and then, according to their level, the evaluation is made. Moreover, two measures of accessibility were taken into account and were calculated as (a) complete access to the stations and stops, and (b) access to the social opportunities and social activities. The pedestrians must have easy and quick access to the BRT system, and then the BRT must have good access to all the social institutes and opportunities related to society. The comparative bus formation and infrastructure of the BRT system are shown in Figure 4.
There are two levels of connectivity for this model, among which the first level consists of pedestrians, who are all over the accessible areas of the BRT, and the other consists of BRT system stations and stops. These two connectivity levels serve as a model and the pedestrians are the main level for this connectivity, while the BRT stations serve as the only entrance and exit points of this model. Thus, this multi-model structure helps to calculate the travel time as the walking travel time for the pedestrians to access the BRT stations. The pedestrians must have easy and quick access to the BRT system, and then the BRT must have good access to all the social institutes and opportunities related to society. This means the walk time of the passengers from the residential area to the BRT, and then the BRT travel time to the destination, and finally the passenger’s time to reach society or opportunities from that last station. This model helps to check the spatial accessibility of the BRT and also the walk time. The areas are stratified and then the levels are evaluated, and each level has its own pedestrians and population, including educational institutes and other social networks. We also know that every mode of transport is given or provided with assigned speed. The feeder buses are slow enough at 20 km/h. The walking speed is rather 5 km/h.

3.4. Data Envelopment Analysis Model for Efficiency Analysis

One of the efficient techniques for the performance analysis of bus systems is data envelopment analysis [18,19]. Data envelopment analysis (DEA) is one of the non-parametric approaches developed by Chames, Cooper, and Rhodes in 1978 [30]. Its concept is described as “data envelopment analysis studies structures approach, in which the association between all inputs and outputs are taken into account simultaneously yielding a more consistent measure of efficiency. The weights used for each BRT segment, hereinafter called the decision-making unit (DMU), are those, which maximize the ratio between the weighted output and the weighted input. If the relative efficiency of a set of DMUs, performing the same function is to be evaluated, those DMUs should use the same type of input to produce the same type of output. The efficiency score of a DMU varies from 0 to 1. A DMU with an efficiency score of 1 is considered to be most efficient. Efficient DMUs achieve greater output per unit input than those achieved by the inefficient DMUs. If efficiency of a DMUis1, no other DMU is more efficient than that DMU and the weights adopted can be considered as the optimal weights. If efficiency is less than 1, there can be other DMUs that may be more efficient. In short in case of measurement of efficiency the concept of maximum output using minimum input is applied.” [31]. DEA, which is an established technique in the field of transportation and management, has a mathematical expression as Equation (1):
max E 0 = i = 1 m v i x i 0 s u b j e c t t o r = 1 s u r y r 0 = 1 , i = 1 m v i x i j r = 1 s u r y r j 0 ,     j = 1 , , n u r , v i 0 , r = 1 , , s ,     i = 1 , , m
DEA model and efficiency level are calculated by applying the performance analysis outcome and exposure variables [32,33]. In Figure 5, the formation of the DEA model can be explained according to the two concepts. If the output is desired, it should be maximized for the calculation of efficiency, while minimizing output is required for the calculation of risk. Due to its benchmarking formulation, DEA is considered superior with reference to the regression technique.
In these concepts, while calculating efficiency in the transportation field, the highest level has been considered as the frontier of performance. In the case of efficiency evaluation, Efficiency is calculated by maximizing output and minimizing input [33]. The simplest form of calculating Efficiency by DEA is as follows:
Efficiency: Basic concept of DEA- Efficiency calculation is as in Equation (2):
E f f i c i e n c y = W e i g h t e d   S u m   o f   O u t p u t W e i g h t e d   S u m   o f   I n p u t = M a x i m i z e   O u t p u t M i n i m i z e   I n p u t

4. Results

The analysis is the main part of this study, and the BRT system is analyzed through some of the variables which are also discussed here. The access of the stations of the BRT system for the people is a very important portion of this analysis along with these variables. The Multan BRT is evaluated through some variables, which are also calculated, and then the analysis is made. The analysis of the Metro Bus System station accessibility is further a very important factor as all the pedestrians and the residents must have easy access to the BRT system. Spatial accessibility is a very important term in transportation projects which includes residential areas, housing authorities, and modes of transportation for remote areas. It is a major problem that the segregation of residential areas to the services is being made. Therefore, in order to overcome this segregation of residents to the services, transportation plays an important role. Thus, some of the policies had been made to overcome the problem that causes impedance between residents and employment areas. Due to this, transportation with spatial accessibilities of housing authorities to the services of urban areas is being made easy. The best solution was to link the people to the social areas by means of transportation that connects the people to the society with a lot of ease. Moreover, further analysis is made through these variables, which are calculated, and then the object evaluation is made through these variables.

4.1. Travel Speed Analysis

The travel speed is considered as the main aspect, when it comes to bus rapid transit performance. The graph illustrates the discrepancy in speed with time, in comparison with Multan BRT systems. The travel speed is a very important factor for the evaluation of the BRT system. Multan BRT system has different travelling speed, which shows different values for both of them. The following are some graphs that help to analyze the BRT performance.
This graph (Figure 6) shows the travel speed of BRT buses of Multan city with respect to time. As illustrated from the graph, we can see that the average traveling speed of Multan BRT is between 40 km/h and 55 km/h, which is quite good compared with the other modes of transport. The BRT maximum speed is 55 km/h and this is very good. Additionally, the time frame is given according to the stations. The first stations required just 100 seconds to reach. The same was observed for other stations covered within 60 to 110 seconds, which is also quite incredible.
From the analysis of these data, as shown in Figure 7, it was found that, at the distance of 1035 m, the first station was located. The time consumed was about 100 sec, which was the double of the Manzorabad location. Northern-By-Pass and Shalimar Colony have constant distances of 900 m with a difference of 8 sec in the time period. The time duration suddenly leaped at BCG Chowk to 110 sec with a 1010-m measured distance, and then varying until the last station. Hence, larger distances between the stations degraded the BRT performance.

4.2. Fuel Consumption and Efficiency Analysis

The bus rapid transit (BRT) is a contemporary public transport system with numerous potentials like fast traveling efficiency and low fuel cost. However, when we compared it with the hybrid bus, the results might be contradictory. Fuel cost is a substantial part of mass transit authority finances. Hybrid technology is a striking choice for passengers and it can play an imperative role in reducing the functional costs of interventions. There are thousands of regular hybrid buses moving in Multan and only 35 articulated transit (60 feet) buses are operational along the BRT corridor. The main aspect of using a hybrid bus is the fuel economy, time savings, and emission reduction. Additionally, three BRT buses and three hybrid buses were analyzed on the same transit route of Multan. The fuel consumption of BRT is 3 km per liter and the hybrid bus has a fuel consumption of 4.5 km per liter. Results revealed that the highest fuel cost for BRT was $0.93 at the Shah Rukn-e-Alam station, while it was $0.21 for a hybrid bus at the same terminal. The topmost traveling speed of 54 km/h was noted by a hybrid bus at a particular station, but BRT had a 5-km/h crowning speed at Shah Rukn-e-Alam. The average travel time for the hybrid bus was 73 sec, and 77 sec for the BRT bus, which shows that the hybrid technology is dominating BRT in both these facets. The overall fuel costs of a BRT bus and a hybrid bus are $108 and $66.81 respectively, during the entire day. The fuel consumption is rather dissimilar for the dual modes (BRT and hybrid), because of the diverse passenger capacity, boulevard level, and road condition, as shown in Table 1.

4.3. Comparative Performance Analysis of Conventional Fuel Bus vs. Hybrid Fuel Bus System Analysis

To analyze the performance of the BRT system after utilization of the hybrid battery-based bus system, data envelopment analysis can be used to see the performance of the effective utilization of the system.
The basic model can be viewed in a simple expression in Equation (3), as follows:
E f f i c i e n c y = u l y 1 j + u 2 y 2 j + + u k y k j v l y 1 j + v 2 y 2 j + + v l y l j
where:
uk = weight of output k,
ykj = amount of output k from unit j,
ul = weight of output l,
ylj = amount of output l from unit j.
Following the similar concept of using inputs and outputs, technical parameters have been considered as output, and the target is to minimize the output while the discharge is the inputs, as the target is to maximize the input [33]. Thus, the Equation (4) to calculate the efficiency score value through the DEA is as follows:
E f f i c i e n c y = U 1 ( Speed ) + U 2 ( Distance )   V 1 ( Fuel ) + V 2 ( Cos t ) + V 3 ( Time )
where:
U1,2 = weights for 1st and 2nd output,
V1,2,3 = weights for 1st, 2nd, and 3rd input
The Lingo software was used to apply the DEA model via programming, which produced the efficiency values for each decision-making unit (DMUs), i.e., segments of BRT sections as shown in Table 2.
The comparative analysis shown in Figure 8 explains the benefits of using a hybrid bus system for cost-saving and shows a better performance of the BRT system. Hence, it can be implemented successfully for energy-efficient utilization.
The comparative analysis shows that the efficiency has been calculated on the basis of the benchmarking concept with the concept of minimizing fuel, cost, and time, while maximizing the speed and travelling distance. Thus, in this formation, DEA helps to evaluate the efficiency of section-wise BRT analysis, which shows that the hybrid bus system will be more efficient to utilize in comparison with the conventional fuel-based bus system.

5. Conclusions

This study is based on the efficiency analysis of a hybrid bus system using advanced benchmarking techniques for an efficient energy-saving BRT system. Developing countries around the world are investing in large city-wide BRTS projects, sometimes accompanied for invigorating the economic development and overcoming a legacy of injustice with the income policies. The research has worked to highlight the importance of both the design and designing an accessible transportation system, and also working on the distribution of opportunities and services for an urban area thoroughly. It has provided a framework for planning new policies and their potential for improving accessibility for all segments of the population. The bus rapid transit was a new project in Pakistan that has revolutionized the transport sector. It was beneficial for lower-class people, who had less income and low living standards. Its quality and fare were better than conventional bus systems, and that is why most people preferred to ride it. The aim of this project was to evaluate the system through the analysis of the existing setup and existing system and it suggested and designed an improved public transit system for the two cities. It also provides an overall assessment of the BRTS Multan. The main discussion of this case study is to give answers to the question relating to how well Bus Rapid Transit has achieved its aims towards sustainable mobility in Multan. Road conditions, travel time, bus depot location, and travel speed are the main factors influencing the efficiency of bus rapid transit systems. It was found that the BRT could attract expressly private vehicle customers to change the mode choice. Bus rapid transit (BRT) grants a higher passenger capacity, economical, comfortable, and flexible alternative for high-performance transit facilities, and thus, has progressively gained attentiveness from policymakers. The Multan BRT project was curtailed due to a number of reasons. The internal setup was not simple enough to implement this project. The selection of the first corridor (a route of stumpy demand outlying location) was rather fruitless.
Using the data envelopment analysis (DEA) provides an opportunity to compare the performance of the BRTS system with conventional diesel and hybrid bus systems for an energy efficient BRTS. Comparative analysis shows that, out of 21 stations, except at only one section located at Chungi Number 9 Stop, the efficiency-wise hybrid bus system remained superior or equivalent to the standard value of 1. The range of efficiency was almost equal to 1 on all stops, except at Chungi Number 9, where it was 0.77. The finding of the analysis indicates that the hybrid mechanism of buses can not only replace the fuel-based system but will also help as an energy-efficient and eco-friendly economical solution. For the improvement of the system, some recommendations have been suggested as follows: being the first study in Pakistan that carries out a detailed analysis of the Multan bus rapid transit. The major focus of this study was to evaluate the overall performance of the Multan BRT system after the application of a hybrid bus system which has shown a positive indication of the implementation of energy-efficient fuel-saving bus rapid transit systems.

Author Contributions

All authors contributed equally to this study. All authors have read and agreed to the published version of the manuscript.

Funding

This research received no external funding.

Conflicts of Interest

The authors declare no conflict of interest.

References

  1. Delmelle, E.C.; Casas, I. Evaluating the spatial equity of bus rapid transit-based accessibility patterns in a developing country: The case of Cali, Colombia. Transp. Policy 2012, 20, 36–46. [Google Scholar] [CrossRef]
  2. Cervero, R. Bus Rapid Transit (BRT) An Efficient and Competitive Mode of Public Transport, 20th AECA Scientific Advisory Group Report; European Automobile Manufacturers Association: Brussel, Belgium, 2013. [Google Scholar]
  3. Cain, A.; Darido, G.; Baltes, M.R.; Rodriguez, P.; Barrios, J.C. Applicability of TransMilenio bus rapid transit system of Bogotá, Colombia, to the United States. Transp. Res. Rec. 2007, 2034, 45–54. [Google Scholar] [CrossRef]
  4. BTS-BRT-RP, A. Bus Rapid Transit Service Design, in APTA Standard Development Program. In Bus Rapid Service Design APTA BTS-BRT-RP-004-10; American Public Transportation Association: Washington, DC, USA, 2010. [Google Scholar]
  5. GBD. Global BRT Data—Worldwide and Key Indicators per Region. Available online: http://brtdata.org/ (accessed on 20 June 2019).
  6. Levinson, H.S.; Zimmerman, S.; Clinger, J.; Rutherford, G.S. Bus rapid transit: An overview. J. Public Transp. 2002, 5, 1. [Google Scholar] [CrossRef]
  7. Rahman, M.M.; Wirasinghe, S.; Kattan, L. Users’ views on current and future real-time bus information systems. J. Adv. Transp. 2013, 47, 336–354. [Google Scholar] [CrossRef]
  8. Rehman, A.; Deyuan, Z. Pakistan’s energy scenario: A forecast of commercial energy consumption and supply from different sources through 2030. Energy Sustain. Soc. 2018, 8, 26. [Google Scholar] [CrossRef] [Green Version]
  9. Cui, S.; Niu, H.; Wang, W.; Zhang, G.; Gao, L.; Lin, J. Carbon footprint analysis of the Bus Rapid Transit (BRT) system: A case study of Xiamen City. Int. J. Sustain. Dev. World Ecol. 2010, 17, 329–337. [Google Scholar] [CrossRef]
  10. Vincent, W.; Jerram, L.C. The potential for bus rapid transit to reduce transportation-related CO2 emissions. J. Public Transp. 2006, 9, 12. [Google Scholar] [CrossRef]
  11. Rahman, M.S.-U.; Timms, P.; Montgomery, F. Integrating BRT systems with rickshaws in developing cities to promote energy efficient travel. Procedia-Soc. Behav. Sci. 2012, 54, 261–274. [Google Scholar] [CrossRef] [Green Version]
  12. Sebastiani, M.T.; Lüders, R.; Fonseca, K.V.O. Evaluating electric bus operation for a real-world BRT public transportation using simulation optimization. IEEE Trans. Intell. Transp. Syst. 2016, 17, 2777–2786. [Google Scholar] [CrossRef]
  13. Cuéllar, Y.; Buitrago-Tello, R.; Belalcazar-Ceron, L.-C. Life cycle emissions from a bus rapid transit system and comparison with other modes of passenger transportation. CT&F-Cienc. Tecnol. Futuro 2016, 6, 123–134. [Google Scholar]
  14. Satiennam, T.; Fukuda, A.; Oshima, R. A study on the introduction of bus rapid transit system in Asian developing cities: A case study on Bangkok Metropolitan Administration Project. IATSS Res. 2006, 30, 59–69. [Google Scholar] [CrossRef] [Green Version]
  15. Imam, R.; Jamrah, A. Energy consumption and environmental impacts of Bus Rapid Transit (BRT) systems. Jordan J. Civ. Eng. 2012, 159, 1–12. [Google Scholar]
  16. Sukarno, I.; Matsumoto, H.; Susanti, L. Transportation energy consumption and emissions-a view from city of Indonesia. Future Cities Environ. 2016, 2, 6. [Google Scholar] [CrossRef]
  17. Meng, F.; Liu, G.; Yang, Z.; Casazza, M.; Cui, S.; Ulgiati, S. Energy efficiency of urban transportation system in Xiamen, China. An integrated approach. Appl. Energy 2017, 186, 234–248. [Google Scholar] [CrossRef]
  18. Lao, Y.; Liu, L. Performance evaluation of bus lines with data envelopment analysis and geographic information systems. Comput. Environ. Urban Syst. 2009, 33, 247–255. [Google Scholar] [CrossRef]
  19. Chang, K.-P.; Kao, P.-H. The relative efficiency of public versus private municipal bus firms: An application of data envelopment analysis, In International Applications of Productivity and Efficiency Analysis; Springer: Berlin/Heidelberg, Germany, 1992; pp. 63–80. [Google Scholar]
  20. Eboli, L.; Mazzulla, G. Service quality attributes affecting customer satisfaction for bus transit. J. Public Transp. 2007, 10, 2. [Google Scholar] [CrossRef] [Green Version]
  21. Dastagir, G.; Khan, R.; Shahid, O.; Mir, A.; Faheem, M. The Study of Bus Rapid Transit (BRT) System at University Road Peshawar, Pakistan. J. Mech. Civ. Eng. 2013. [Google Scholar] [CrossRef]
  22. Mishra, R.; Parida, M.; Rangnekar, S. Evaluation and analysis of traffic noise along bus rapid transit system corridor. Int. J. Environ. Sci. Technol. 2010, 7, 737–750. [Google Scholar] [CrossRef] [Green Version]
  23. Ma, W.; Yang, X. A passive transit signal priority approach for bus rapid transit system. In 2007 IEEE Intelligent Transportation Systems Conference; IEEE: Piscataway, NJ, USA, 2007. [Google Scholar]
  24. Rodríguez, D.A.; Targa, F. Value of accessibility to Bogotá’s bus rapid transit system. Transp. Rev. 2004, 24, 587–610. [Google Scholar] [CrossRef]
  25. Chen, X.; Li, Z.; Jiang, H.; Li, M. Investigations of interactions between bus rapid transit and general traffic flows. J. Adv. Transp. 2015, 49, 326–340. [Google Scholar] [CrossRef]
  26. ADB. Bus Rapid Transit (BRT): Toolkit for Feasibility Studies_Module 2_Feasibility Study Work Flow. Available online: https://sti-india-uttoolkit.adb.org/mod2/se2/002.html (accessed on 30 July 2019).
  27. Census-Pakistan. Multan District. Available online: https://web.archive.org/web/20170829164748/http://www.pbscensus.gov.pk/sites/default/files/DISTRICT_WISE_CENSUS_RESULTS_CENSUS_2017.pdf (accessed on 20 June 2019).
  28. MDA. Multan Development Authority, Multan. Available online: http://www.mda.gop.pk/metro_menu.php (accessed on 8 August 2018).
  29. Yusufzai, A. PTI Planning to Cut Subsidies and Remodel Metro Bus Projects. Available online: https://propakistani.pk/2018/08/13/pti-planning-to-cut-subsidies-and-remodel-metro-bus-projects/ (accessed on 12 August 2019).
  30. Charnes, A.; Cooper, W.W.; Rhodes, E. Measuring the efficiency of decision making units. Eur. J. Oper. Res. 1978, 2, 429–444. [Google Scholar] [CrossRef]
  31. Raju, K.S.; Kumar, D.N. Ranking irrigation planning alternatives using data envelopment analysis. Water Resour. Manag. 2006, 20, 553–566. [Google Scholar] [CrossRef]
  32. Shah, S.A.R.; Brijs, T.; Ahmad, N.; Pirdavani, A.; Shen, Y.; Basheer, M.A. Road Safety Risk Evaluation Using GIS-Based Data Envelopment Analysis—Artificial Neural Networks Approach. Appl. Sci. 2017, 7, 886. [Google Scholar] [CrossRef] [Green Version]
  33. Shah, S.A.R.; Ahmad, N.; Shen, Y.; Pirdavani, A.; Basheer, M.A.; Brijs, T. Road Safety Risk Assessment: An Analysis of Transport Policy and Management for Low-, Middle-, and High-Income Asian Countries. Sustainability 2018, 10, 389. [Google Scholar] [CrossRef] [Green Version]
Figure 1. Transport-related energy consumption prediction [8].
Energies 13 01377 g001
Figure 2. Research Methodology.
Energies 13 01377 g002
Figure 3. Route Map of BRT Multan [28].
Energies 13 01377 g003
Figure 4. The BRT-Metro Bus System: (a) Diesel Fuel Bus, (b) Hybrid Battery Base Bus, (c) Service Area, and (d) Station [28,29].
Energies 13 01377 g004
Figure 5. Basic DEA Model Conceptual Diagram [33].
Energies 13 01377 g005
Figure 6. Analysis of Travel Speed of Multan with Respect to Time
Energies 13 01377 g006
Figure 7. Analysis of Travel Distance of Multan with Respect to Time.
Energies 13 01377 g007
Figure 8. Comparative Performance Analysis of Conventional Fuel Bus vs. Hybrid Fuel Bus System Analysis.
Energies 13 01377 g008
Table 1. Fuel Consumption and Comparative Route Performance Analysis.
StationsDistance (km)BRT BusHybrid Bus
Fuel Cons (lit)Fuel Cost ($US)Speed (kmph)Time (s)Fuel Cons (lit)Fuel Cost ($US)Speed (km/h)Time (s)
BZU1.0350.340.30431000.230.204386
Bahadar Pur1.0350.340.30431000.230.204386
Mehmood Kot0.750.250.3040530.170.144152
Northern By-Pass0.90.300.2655750.200.175460
Shalimar Colony0.90.300.2640670.200.174166
Sabzazar0.650.220.1942600.140.134058
Chungi No. 60.90.300.2640800.200.173983
Gulgasht1.10.370.32371020.240.2139100
Chungi No. 910.330.2940930.330.294285
Fort Qasim0.850.280.2541810.190.164371
Daulat Gate0.90.300.2645950.200.174867
Hafiz Jamal0.870.290.2539600.190.174471
Manzoor Abad0.70.230.2040500.160.144052
Ahmad Abad0.90.300.2644750.200.174572
BCG Chowk1.10.370.32461100.240.214788
Peoples Colony0.90.300.2645700.200.174572
Vehari Chowk0.90.300.2643550.200.174375
General Bus Stand0.70.230.2046580.160.144654
Jinnah Park1.20.400.3545870.270.324694
Shah Rukn-e-Alam1.10.370.9347600.240.214872
Kumaranwala Chowk1.150.380.3344900.260.224788
Note: Fuel Cons (lit) = Fuel Consumption (Liters).
Table 2. Comparative Performance Analysis of Conventional Fuel Bus vs. Hybrid Fuel Bus System Analysis.
DMUsStationsC. B. Eff. ScoreH.B. Eff. Score
ABZU Stop10.9856917
BBahadar Pur10.9856917
CMehmood Kot0.98794661
DNorthern By-Pass0.98900591
EShalimar Colony0.98899760.999981
FSabzazar0.97743791
GChungi No. 60.98898470.999962
HGulgasht0.98209540.999963
IChungi No. 90.99551130.7700518
JFort Qasim0.99729560.9999797
KDaulat Gate0.98897490.999987
LHafiz Jamal0.99712610.9944214
MManzoor Abad10.9620835
NAhmad Abad0.98899370.999979
OBCG Chowk0.98209650.999983
PPeoples Colony0.98899960.999979
QVehari Chowk10.999974
RGeneral Bus Stand11
SJinnah Park0.98569040.9644047
TShah Rukn-e-Alam11
UKumaranwala Chowk0.99564180.9856835
Note: C. B. Eff. Score = Conventional Fuel Bus Efficiency Score; H.B. Eff. Score = Hybrid Fuel Bus Efficiency Score.

