Article

Multi-Objective Thermo-Economic Optimization of a Combined Organic Rankine Cycle (ORC) System Based on Waste Heat of Dual Fuel Marine Engine and LNG Cold Energy Recovery

1
Merchant Marine College, Shanghai Maritime University, Shanghai 201306, China
2
Institute of Refrigeration and Cryogenics, Shanghai Jiao Tong University, Shanghai 200240, China
*
Author to whom correspondence should be addressed.
Energies 2020, 13(6), 1397; https://doi.org/10.3390/en13061397
Submission received: 20 February 2020 / Revised: 6 March 2020 / Accepted: 13 March 2020 / Published: 17 March 2020
(This article belongs to the Section I: Energy Fundamentals and Conversion)

Abstract

:
In this paper, a combined organic Rankine cycle (ORC) system that can effectively utilize the cold energy of Liquefied Nature Gas (LNG) and the waste heat of dual fuel (DF) marine engine was proposed. Particularly, the engine exhaust gas and the jacket cooling water of the DF marine engine were used as heat sources. Firstly, a thorough assessment of thermo-economic performance was conducted for the combined ORC system using 11 environmentally friendly working fluids (WFs). Afterwards, the effects of evaporation and condensation pressures on the net output work, energy efficiency, exergy efficiency, total investment cost and payback period were examined. Furthermore, the thermo-economic performances of the ORC system were optimized via multi-objective optimization with a genetic algorithm. Finally, exergy destructions and investment costs of each component under the optimal operating conditions were analyzed to make suggestions for further improvement. The results show that R1150-R1234yf-R600a and R170-R1270-R152a are the two most promising WF combinations. The exergy destruction of the combined ORC system mainly exists in heat exchangers. Through WF optimization, the exergy destruction in the intermediate heat exchanger was reduced by 18.99%. The proportion of expanders investment cost could be greater than 50% and the payback period of the combined ORC system varies in the range of 7.68–9.43 years. This study demonstrated that the selection of WF and the optimization of operating conditions had important potential to improve thermo-economic performances of ORC systems.

1. Introduction

Maritime transport enjoys low cost and accounts for 80% of global trade by volume and more than 70% of cargo value [1]. Meanwhile, burning of ship fuel brings serious environmental problems due to pollutant emissions, such as CO2, SOx, NOx and particle material. Moreover, the International Maritime Organization’s new rules limit the sulphur content of bunker fuel to 0.5% of the weight of ocean-going ships, well below the 3.5% limit set in 2012 [2]. In this context, liquified nature gas (LNG) is considered to be the most promising marine fuel [3]. Compared with conventional heavy fuel oil, LNG could reduce emissions by 85–95% of NOx, 20% of CO2 and 100% of SOx [4]. The number of LNG fueled ships in-service and on-order is increasing and is expected to account for 32% of shipping energy demand by 2050 [5].
Large container ships are the main carriers for international cargo transport. The maximum efficiency of the marine engine is about 50%, which means that about 50% of the fuel energy is not used for propulsion but dispersed as waste heat taken away by engine exhaust gas (EEG) and jacket cooling water (JCW). Therefore, waste heat recovery (WHR) systems for improving energy utilization have attracted the attention of shipowners and researchers. Methods of WHR mainly include turbocharging [6], EEG recirculation [7], pressure steam power generation [8], waste heat refrigeration [9] and thermal power cycle for electricity generation [10,11]. Because electricity is convenient to use and store, thermal power cycles for WHR have been widely studied. organic Rankine cycle (ORC) system, uniquely suited for WHR and power generation from low and high temperature heat sources, is regarded as one of the most promising technologies [12,13]. With respect to ORC system researches, efforts are mainly focused on three topics: working fluid (WF) selection [14,15], heat and cold source (e.g., solar, industrial waste heat, geothermal, seawater and LNG cold) [16,17] and system configuration [18,19].
Since WFs have great impacts on system efficiency, components design and system economic performance, many studies have been carried out on the selection of WFs. Both pure WFs (such as hydrocarbons, hydrofluorocarbon, ammonia and carbon dioxide) and zeotropic mixtures were included. Heberle and Brüggemann [20] suggested that the WF with low temperature differences in evaporator and high values in condenser were suitable for a cost-efficient ORC system. Han et al. [21] found R600 exhibited the best comprehensive performance of a regenerative ORC system for recovering the waste flue gas of 160 °C. Uusitalo et al. [22] stressed that the higher the critical temperature of the WF, the higher the thermal efficiency that could be achieved. The results of Valencia et al. [23] showed that the ORC system for WHR from a 2-MW natural gas engine with a recuperator and toluene led to the best performance, which brought about the net power output of 146.25 kW, an overall conversion efficiency of 11.58%, an ORC thermal efficiency of 28.4% and a specific fuel consumption reduction of 7.67%. In the work of Zhang et al. [24], cis-butene and R1234ze(E) was suggested as the best WF for subcritical and trans-critical ORC systems, respectively.
There still exists disagreement with respect to the effect of zeotropic mixtures on thermo-economic performances of ORC system. Some researchers claimed that the performances of ORC systems could be improved by using zeotropic mixtures as WFs. Ge et al. [25] presented a work regarding the effect of zeotropic mixtures on the performances of a dual-loop ORC system with EEG as heat source. Results proved that compared with pure WFs, the net power output of ORC system with zeotropic mixtures could be increased by 9.0%. The same conclusion could also be found in the references [26,27]. Meanwhile, the work of Oyewunmi and Markides [28] clearly showed that ORC system with zeotropic mixtures would lead to larger evaporators, condensers and expanders and higher costs. On the contrary, according to Su et al. [29], the ORC system with zeotropic mixture had lower performance than pure WFs. Moreover, they emphasized that the exergy destructions of evaporator and condenser with zeotropic mixture were not certain to be reduced. It could be concluded that the advantages of zeotropic mixtures are closely related to the constraints of ORC systems. Therefore, only pure WFs would be investigated in this study.
As for WF selection for ORC systems operating under cryogenic temperatures, limited literature could be found. Rao et al. [30] researched 16 potential working fluids for an ORC system utilizing solar energy and LNG cold energy. R143a followed by R290 and R1270 were suggested as the most suitable fluids for the proposed cycle. He et al. [31] studied the performances of an ORC system utilizing LNG cold energy. Five potential working fluids were analyzed and R236fa demonstrated the highest thermal efficiency. Yu et al. [32] compared the performance of 22 WFs with regard to ORC system utilizing LNG cold energy. The particle swarm optimization algorithm was adopted to find optimal working fluids. They reported that R170, R134a and R290 perform better than other working fluids for the ORC system with waste heat recovering from a natural gas fired power plant. Nevertheless, the selection of WF for ORC system addressing LNG cold energy and waste heat recovery simultaneously requires special attention. Han et al. [33] developed a novel triple ORC system for the waste heat and cold energy recovery of LNG fueled ships. By comparing thermo-economic performances of the ORC system, the optimal WF, evaporation temperature and condensation temperature for different cycles were decided via the multi-objective self-adaptive firefly algorithm.
Furthermore, the characteristics of heat source and cold source affect the configuration and performance of ORC systems. This paper concentrates on reviewing the ORC systems in the recovery of waste heat from marine engines. The first ORC system installed onboard ships for marine engine WHR was investigated by Öhman et al. [34]. R236fa was used as WF in the ORC system. JCW was the heat source and low temperature cooling water was the cold source. With the ORC system, 4–6% fuel saving was obtained. Choi and Kim [35] theoretically investigated a dual-loop WHR system with a lower ORC system for propulsion a 6800 twenty-foot equivalent unit container ship. The EEG was used as heat source. The results proved that the propulsion efficiency of 2.824% improvement and about 6.06% reduction in the specific fuel oil consumption and specific CO2 emissions were obtained. Later on, Yang and Yeh [36] optimized the performance of the ORC system for a large marine diesel engine. The ratio of net power output to total heat exchanger area was regarded as the objective function. The WFs, condensation and evaporation temperatures of the ORC system were determined to achieve the maximum objective function. Among six studied WFs, the performance of R600a was the most satisfying. Baldi et al. [37] pointed out the installation cost of ORC system utilizing waste heat from a ship diesel engine could be reduced by taking the operational profile into account. In the work of Song et al. [38], ORC systems for recovering the waste heat from both JCW and EEG were designed. WFs and system operation parameters were optimized with maximizing net power output. Their results showed that the optimized ORC system is compact and economical even though there was a slight sacrifice of net output work. Subsequently, Yun et al. [39] compared the performances of single and dual ORC systems with a wide range of waste heat from marine applications. The results confirmed that the dual-loop ORC system could produce 3–15% higher power output than the single ORC system. Recently, Valencia Ochoa et al. [40] presented three different ORC systems with WHR from a natural gas engine and carried out thermo-economic optimization using a particle swarm optimization algorithm. They found that the two-stage ORC system had the greatest opportunities to improve thermo-economic performance. The optimization results allowed the maximum output power to be 99.52 kW when the pinch point temperatures of the evaporator and condenser were 35 °C and 16 °C, respectively. In their other work [41], exergo-economic analysis was proved to be a powerful method to identify the irreversibility and highest cost in ORC systems. Besides the mostly studied subcritical ORC systems, trans-critical [42,43] and supercritical ORC systems [44] were also proposed for WHR from marine engine.
Because of the cryogenic temperature of LNG, the condensation temperature would be far below the environment temperature. Therefore, the configuration of ORC systems mounted on the LNG fueled ship should be restudied. Sung and Kim [45] designed a novel dual-loop ORC system for an LNG carrier with recovering waste heat from EEG and JCW. For each ORC loop, the selection of WFs was performed for different system configurations. With R601 and R125 as WF, the output work was increased by 5.17%. However, the economic performance was not evaluated. Six WFs were examined in the combined ORC system proposed by Habibi et al. [46]. Additionally, the effects of evaporation temperature, inlet stream quality and condensation temperature on the ORC system performance were analyzed. Multi-objective optimization was carried out to determine the favorable performance condition. The results showed that R601a led to the highest net power output (178.6 kW) and total cost rate (19.3 $/h), while toluene led to the lowest net power output (154.7 kW) and total cost rate (17.36 $/h). Le et al. [47] investigated cold energy recovery from LNG regasification process. The cold energy recovered from LNG was 215 kJ/kg, which could generate 1.7 GWh annually for 1 kg/s LNG, with a payback period less than 7 years. However, only one R290 was studied in their work. Koo et al. [48] investigated six different ORC systems to recover LNG cold energy from a LNG powered ship using the simulation software ASPEN (V10.0, Aspen Tech, Bedford, MA, USA). The optimization results displayed that ORC system with R290 showed the best exergy efficiency (40.7%), the best net power output (116.8 kW) and the lowest annualized cost (38838 $/year).
From the above studies, the results relating to ORC systems based on LNG cold energy and waste heat recovery are summarized in Table 1. The adoption of dual-loop ORC system appears to be an efficient and viable method for waste energy cascade utilization. In addition, the benefit of intermediate heat exchanger (IHE) to the thermo-economic performance of ORC system has been demonstrated [29,49]. However, very few published studies analyze the effects of working pressure on ORC system performances with regard to the two-level heat sources. In order to fully understand the superiority of the combined ORC system, the evaporation pressure and condensation pressure in the IHE must be analyzed. Furthermore, it is not clear how to select the suitable WFs especially for a large temperature difference between cold and heat sources.
The purpose of this paper was to explore the feasibility of ORC system based on energy cascade utilization in ship waste heat recovery and provides a method for thermo-economic performance optimization. In this paper, a combined ORC system with IHE was proposed for WHR of DF marine engine and cold energy recovery of LNG. Firstly, the applicability of 11 environmentally friendly WFs for different loops of the combined ORC system was examined and two optimal WF combinations were decided. Secondly, the effects of IHE evaporation and condensation pressure on the combined ORC system under two optimal WF combinations were investigated from the perspective of thermo-economic, including net output power, energy efficiency, exergy efficiency, initial investment and payback period. Thirdly, multi-objective optimization was performed to find the best operating condition.

2. System Description

2.1. Marine Engine

The type of marine engine is Wärtsilä 50DF, which is a four-stroke, non-reversible, turbocharged and inter-cooled DF marine engine with direct injection of liquid fuel and indirect injection of gas fuel. The engine can be operated in gas mode or diesel mode. In this study, the primary parameters of the Wärtsilä 50DF marine engine are summarized in Table 2. About 50% of fuel energy is converted into the propulsion energy power for the marine engine, while the other 50% is taken away by the waste heat. There are two main forms of waste heat: (1) high temperature EEG generated by fuel combustion; (2) JCW that is used to remove the excess heat of main engine and guarantee proper working temperature. In the meantime, the LNG vaporization process releases a large amount of cold energy.

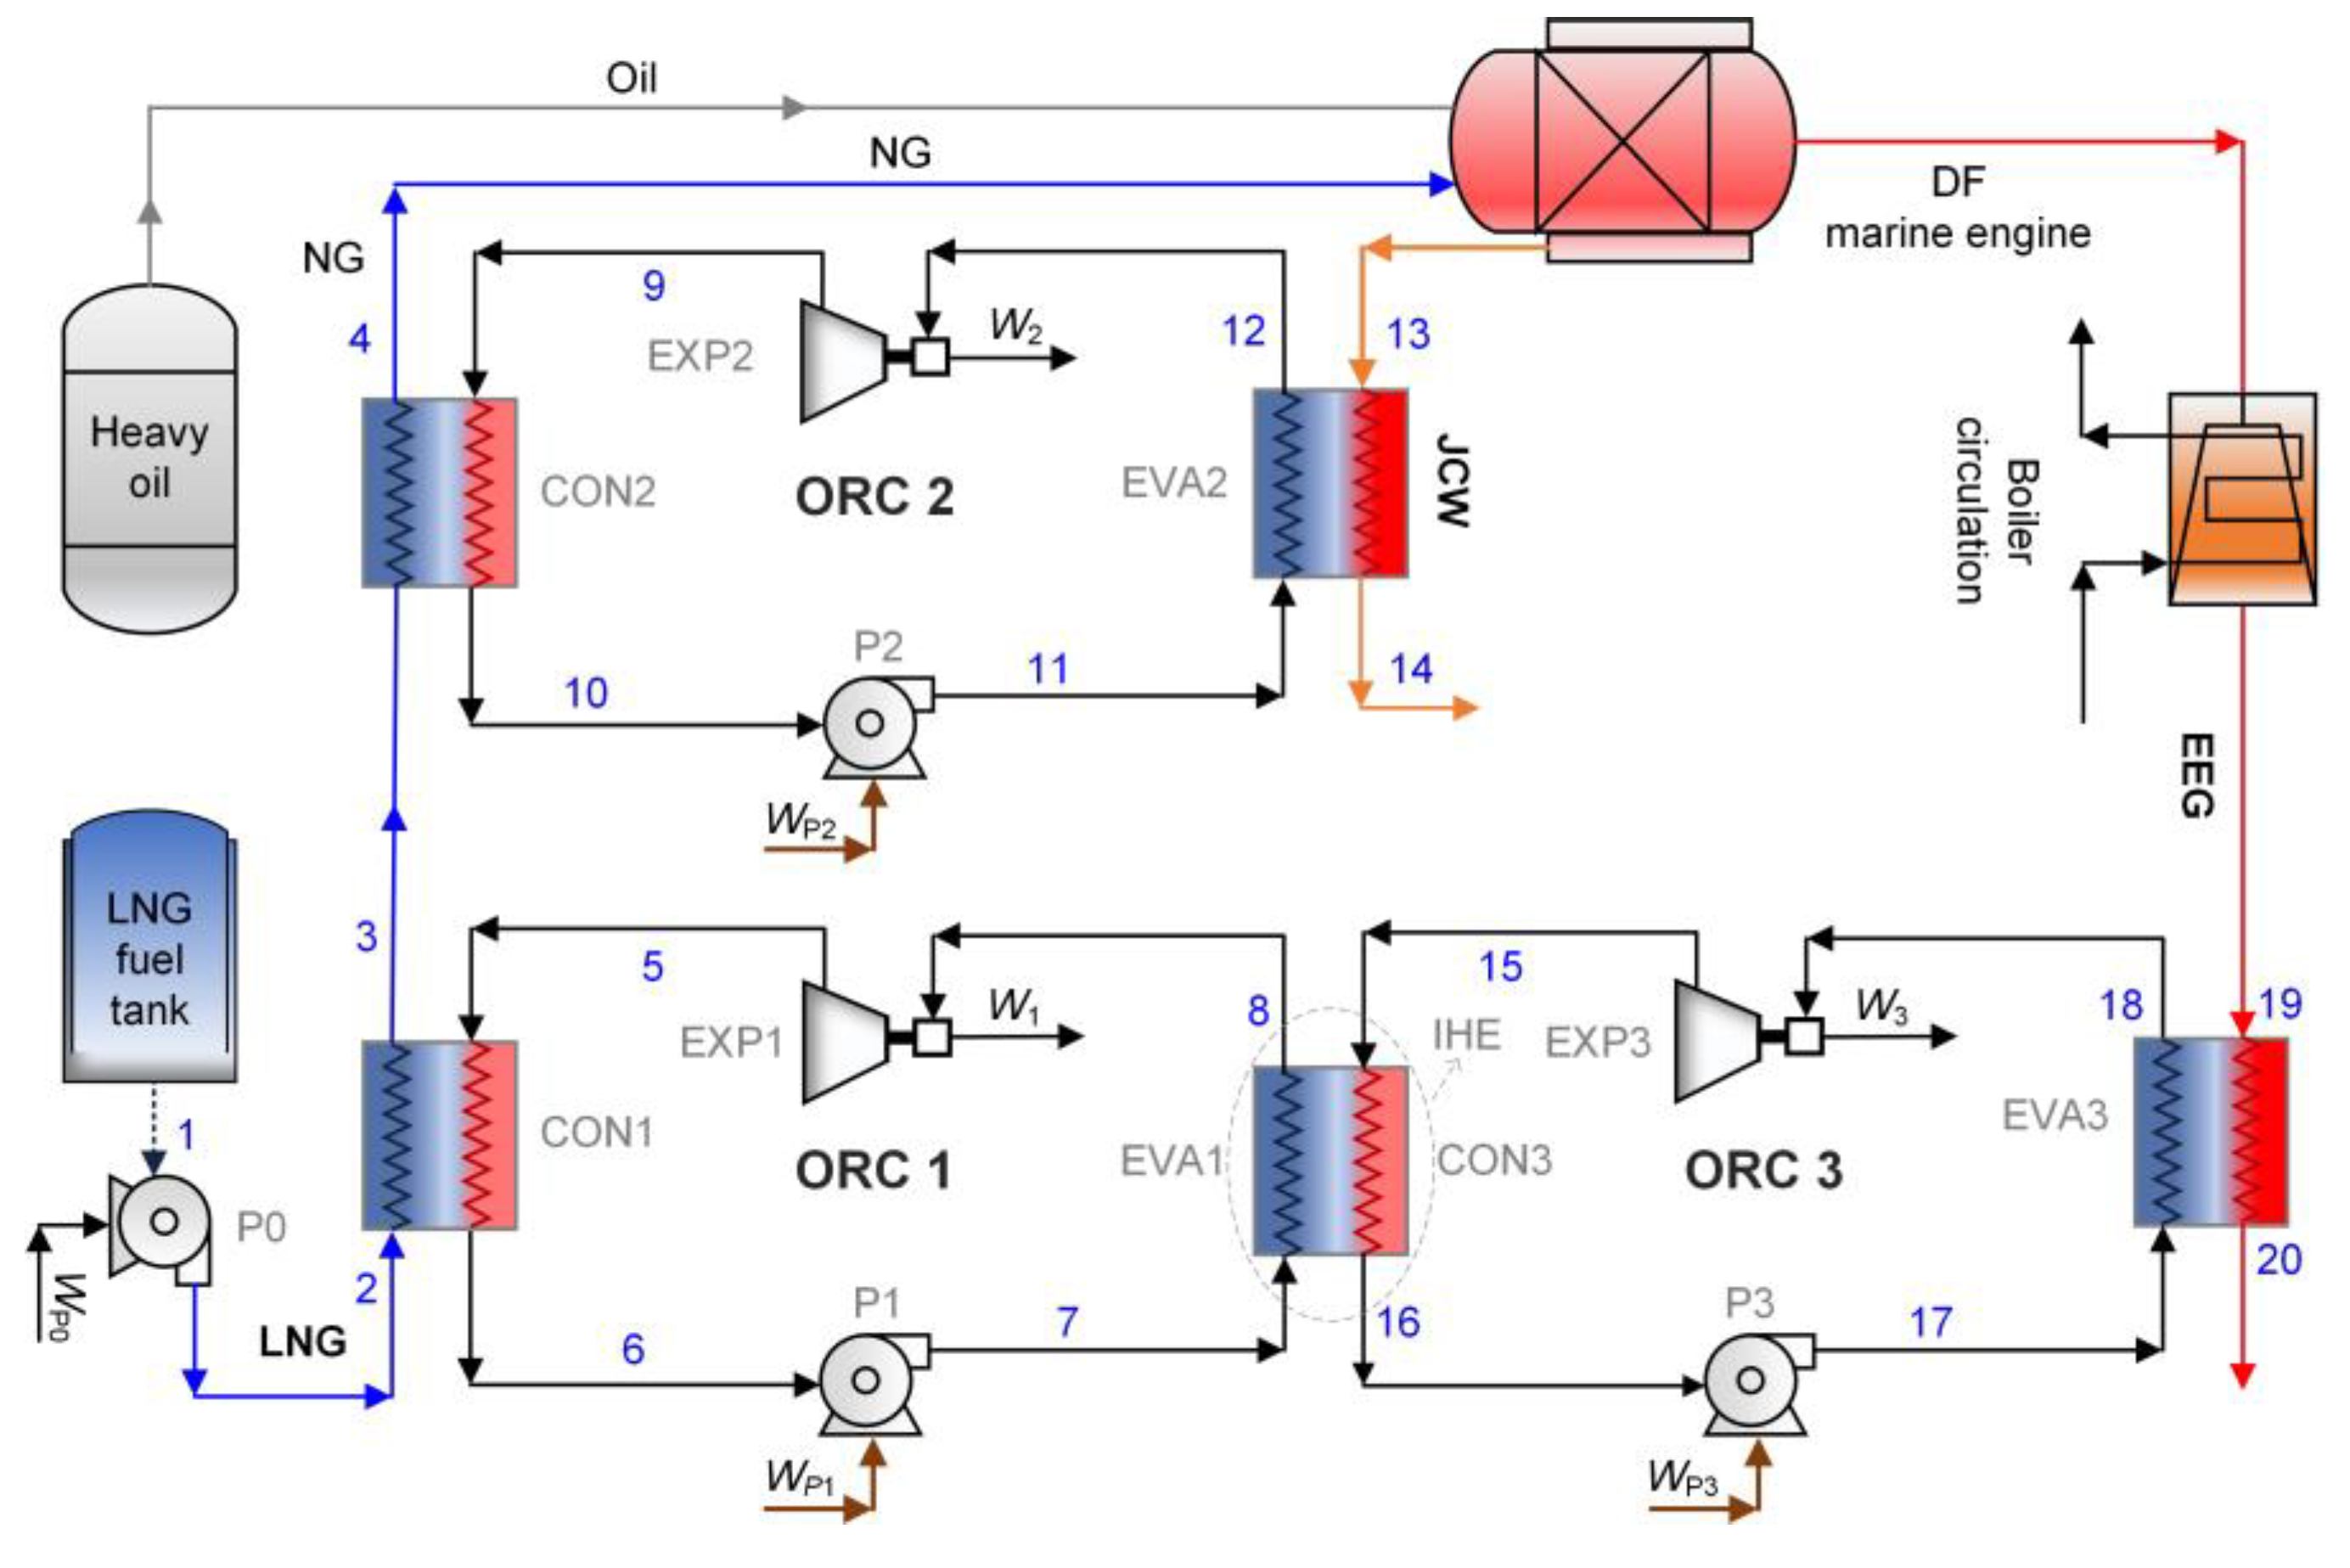
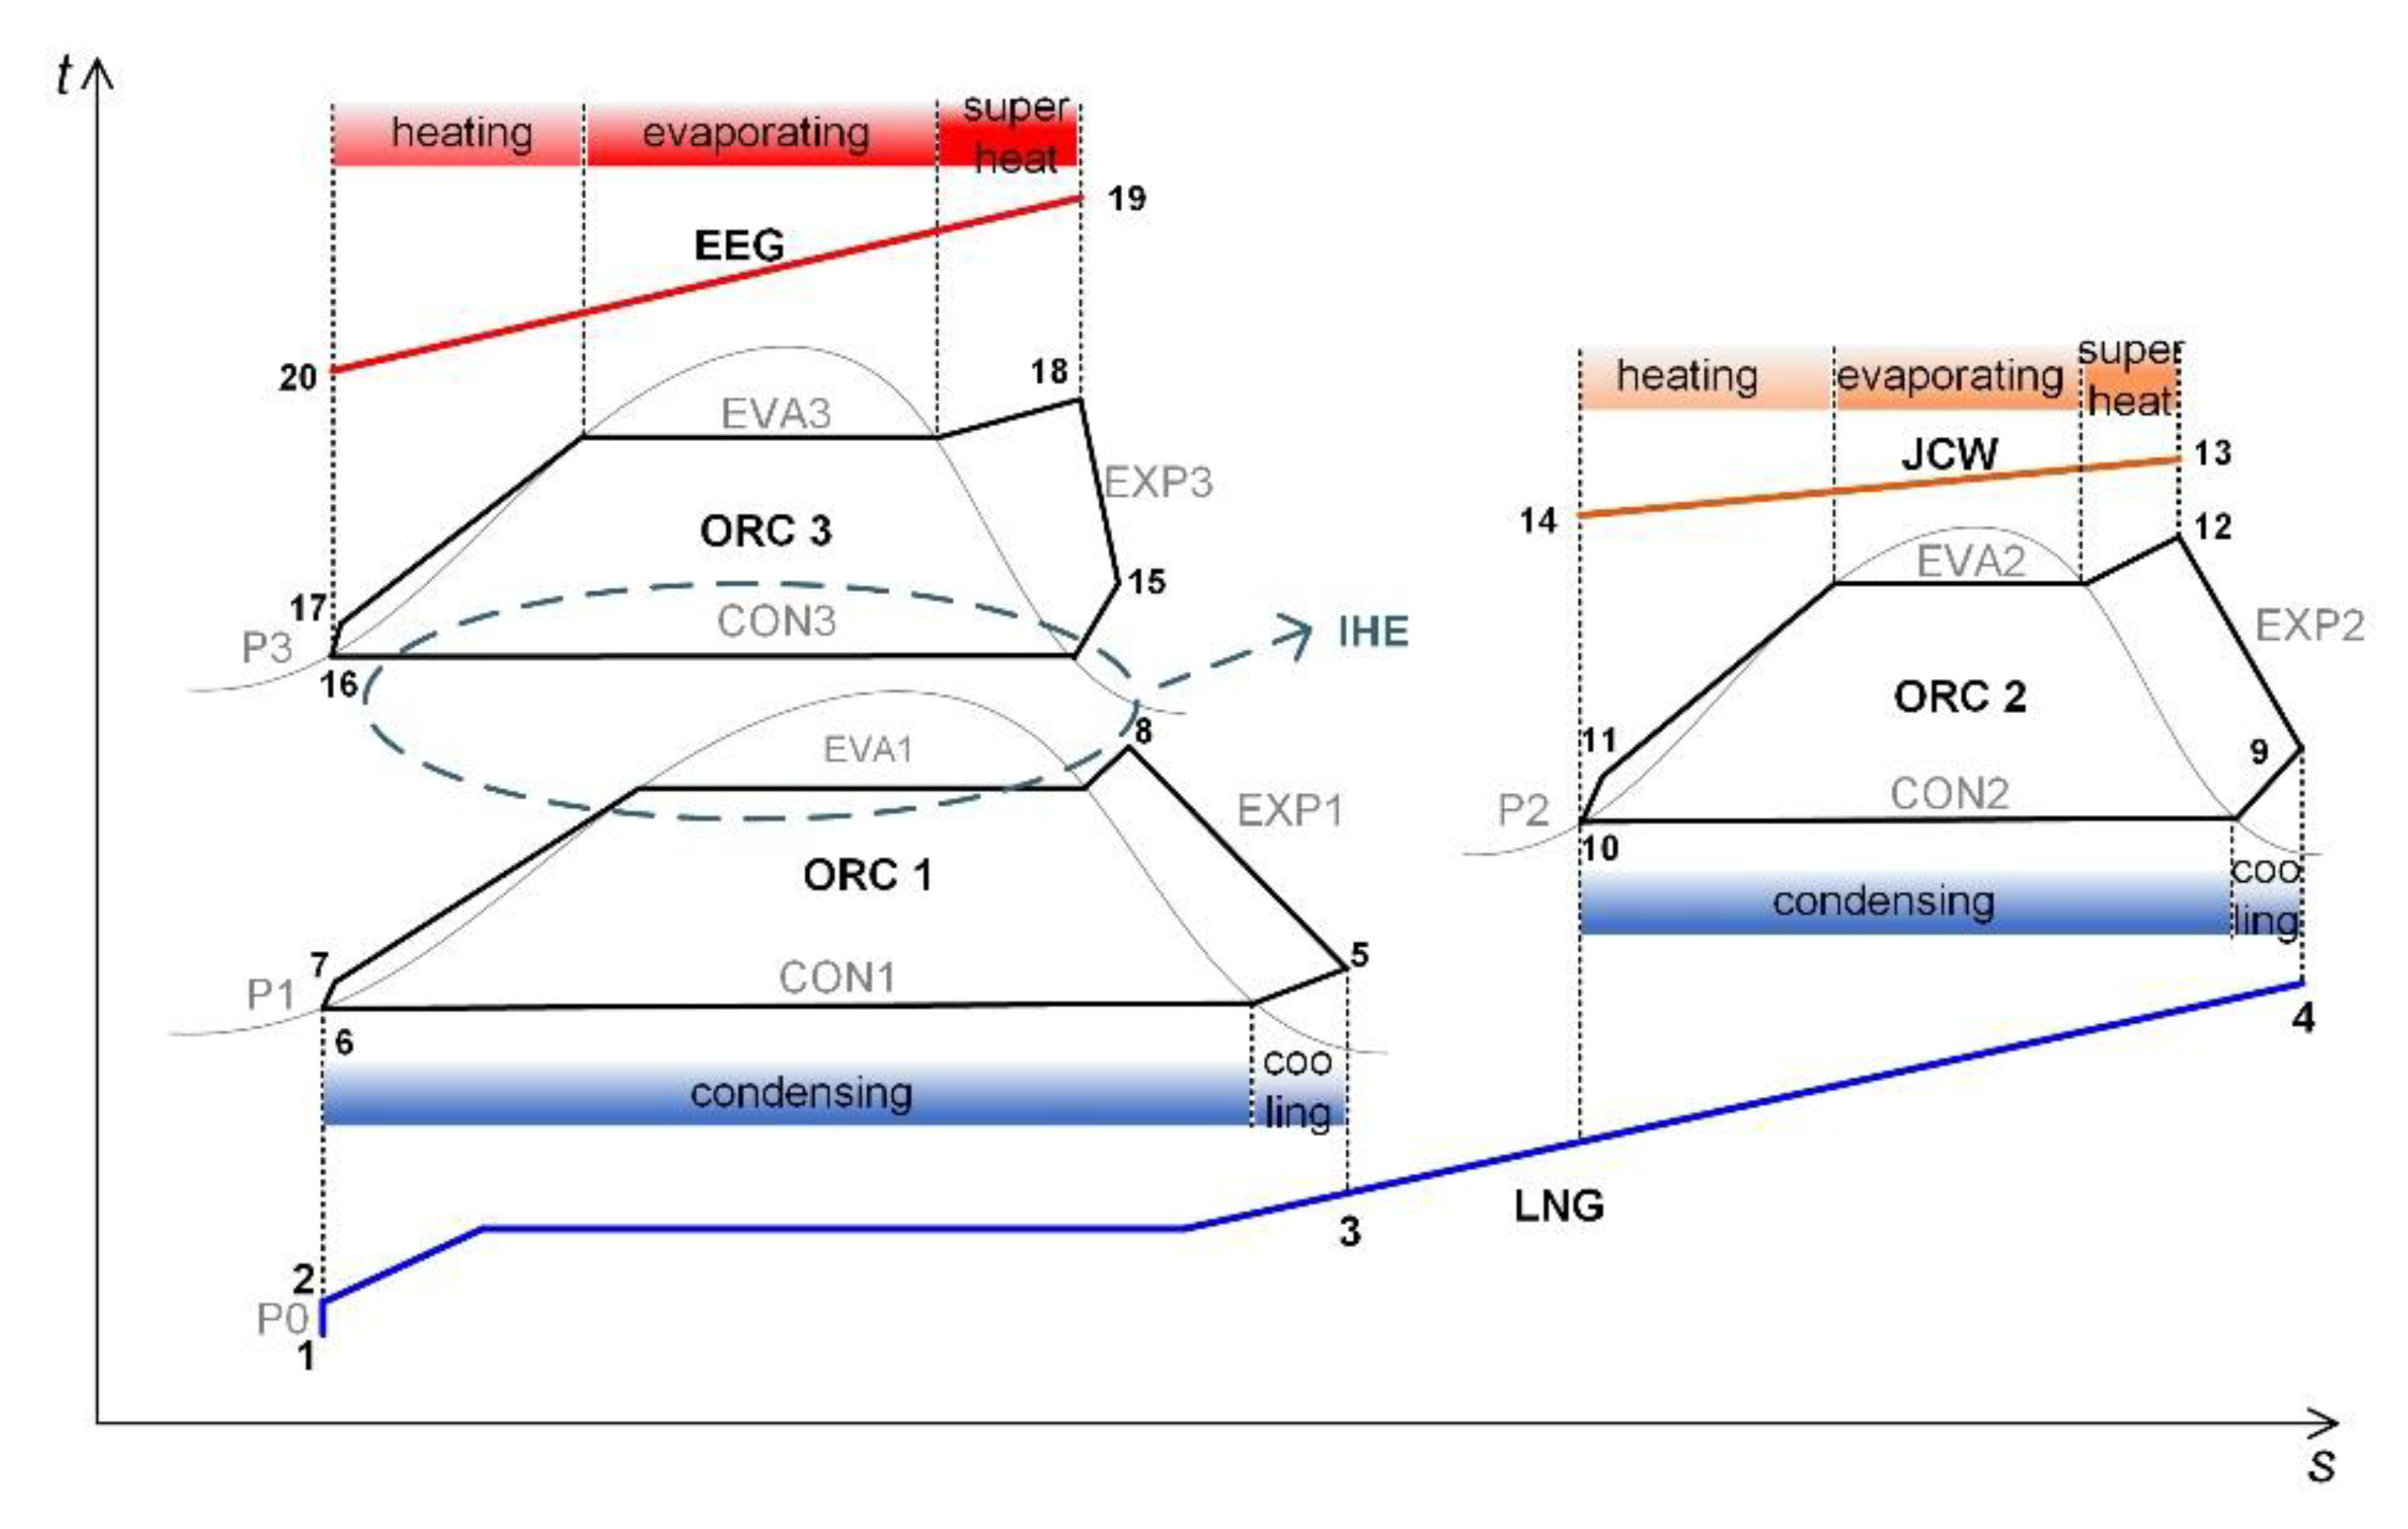
2.2. ORC System Description

The cold energy and waste heat from the DF marine engine are converted into electrical energy with the combined ORC system. In order to avoid the efficiency decrease of heat transfer between large temperature difference, a combined ORC system based on energy cascade utilization principle is proposed, which is illustrated in Figure 1. LNG, used as fuel, requires gasification before entering the DF marine engine. The outlet temperature of EEG from the DF marine engine is usually higher than 300 °C. After flowing through the boiler circulation, the temperature of EEG is still higher than 150 °C. JCW of the DF marine engine is generally with the temperature in the range of 78–95 °C. Therefore, EEG and JCW from the DF marine engine work as dual heat sources for the combined ORC system. The t-s diagram of the combined ORC system is shown in Figure 2.
As shown in Figure 1, the combined ORC system consists of three ORC subsystems: ORC 1, ORC 2 and ORC 3. In ORC 1, LNG in the storage tank is introduced to a condenser (CON1) by a pump (P0). The released cold energy enables the working fluid 1 (WF1) condensed to subcooled liquid. Then, WF1 is pressurized by P1 and enters the evaporator (EVA1) to absorb the heat released by WF3 in ORC 3. The EVA1 in ORC 1 works as the CON3 in ORC 3. After that, WF1 becomes superheat vapor and promotes expander (EXP1) to produce electricity. In ORC 2, the partially gasified LNG served as the cold source and the EEG works as the heat source. The circulation of the WF2 in ORC 2 is similar to WF1 in ORC 1. WF2 absorbs the waste heat carried by JCW and becomes a superheated state. The superheat vapor of WF2 contributes the EXP2 to generate electricity. In ORC 3, WF3 is condensed to the subcooled fluid and then is pressurized by P3. The waste heat brought by EEG helps WF3 vaporize in EVA3. The superheat WF3 pushes EXP3 to produce electricity. Afterwards, WF3 is condensed in CON3 to the subcooled state. The electricity generated by the combined ORC system is the sum of W1, W2 and W3 and the power consumed by the system is the sum of WP0, WP1, WP2 and WP3. Considering the characteristics of LNG-fueled ships and results in Table 1, the boundary conditions of the combined ORC system are shown in Table 3, including environment, cold source and heat source.

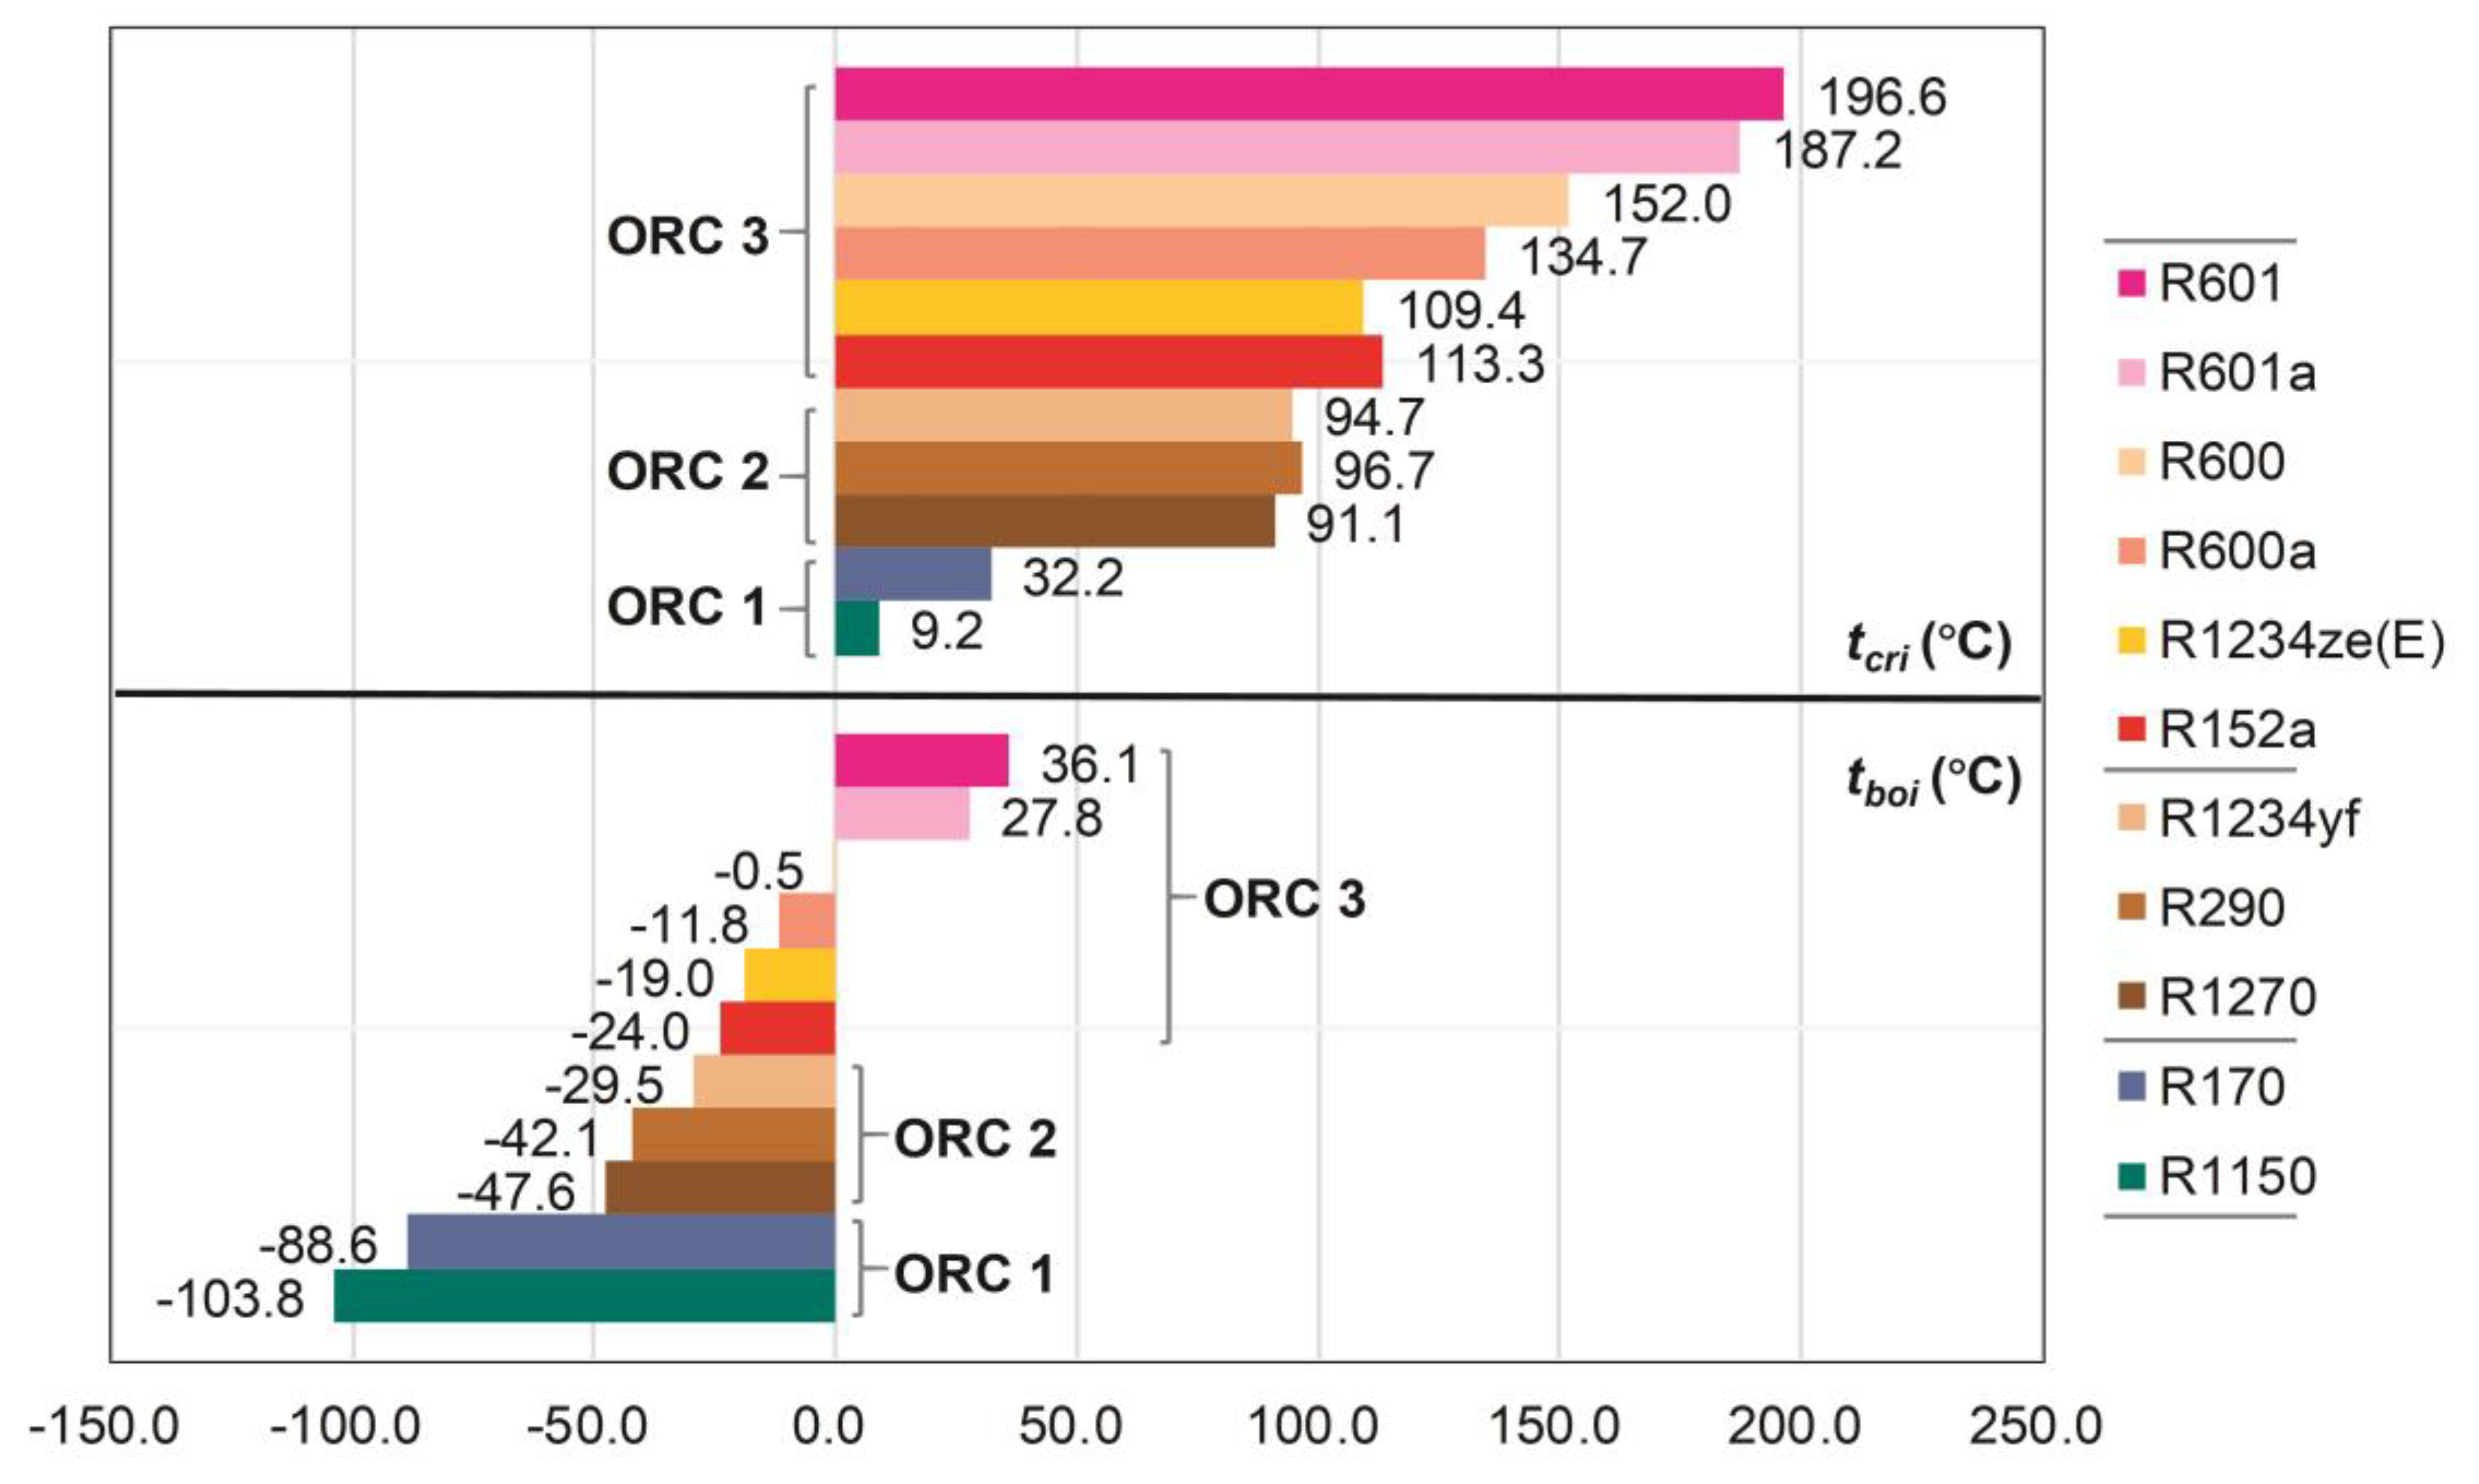
2.3. Candidate Working Fluids

To satisfy the requirements of environmentally friendly WFs, only refrigerants with zero ozone depletion potential (ODP) and global warming potential (GWP) less than 200 are considered in this study. By considering the characteristics of the heat source and cold source, 11 candidate WFs were selected for the combined ORC system. The physical parameters of the selected WFs are presented in Table 4. The classification, environmental and safety indicators are also shown in Table 4. Since the tboi relates to WF phase change and the critical temperature (tcri) limits the working region, the tboi and tcri of different WFs are illustrated in Figure 3. Considering system safety and stability, the matching relationship of WFs with different ORC subsystems was determined. R1150 and R170 are recommended for ORC 1 since they have lower tcri. R1270, R290 and R1234yf with higher tcri are used in ORC 2. R152a, R1234ze(E), R600a, R600, R601 and R601 are used in ORC 3 since their tcri are close to the temperature range of EEG. Therefore, a total of 36 cases would be produced by all possible combinations.

3. Methodology

3.1. Mathematic Model

To analyze thermal and economic performance of the ORC system with different WF combinations, a simulation model is necessary. To simplify and clarify the analysis, the following assumptions are made: (1) all components are assumed to operate under steady state conditions; (2) the heat and friction losses of the system piping and equipment are neglected; (3) the EEG is treated as ideal gas and LNG is treated as methane; (4) the kinetic and potential energy changes in the system are omitted; (5) the DF marine engine operates at full load. The thermodynamic properties of WFs at particular points in the ORC system are obtained from the REFPROP model [51]. To ensure heat transfer performance, a set of specifications and constraints are listed according to the thermodynamic principles, which are summarized in Table 5. According to Györke et al. [52] and Javanshir et al. [53], superheat does not increase the efficiency of isotropic and dry WFs, but it does increase the efficiency of wet WFs. Therefore, the superheat was set at 10 °C for wet WFs.

3.2. Thermo-Economic Analysis

Thermodynamic analysis is conducted by evaluating the energy efficiency and exergy efficiency of the overall system. Moreover, the combined ORC system with different WFs is evaluated and compared from the perspective of economy. The energy, exergy and economic analyses of the ORC system are briefly described here. In order to evaluate the efficiency of energy conversion in a thermodynamic cycle, the analysis is generally considered in terms of energy conversion quantity and quality based on the first and the second law of thermodynamics, respectively. Each component in the combined ORC system is regarded as a control volume with the mass flow (m), heat transfer (Q) and work interactions (W). The mass and energy balance equations are as Equations (1) and (2), respectively:
m i n = m o u t
m i n h i n + Q i n = m o u t h o u t + Q o u t + W
where h is the enthalpy of the working fluid. The subscript in and out refers to the inlet and out of the volume.
Exergy (Ex) is defined as the maximum output work that can be obtained when the flow reversibly changes from a given temperature and pressure to a reference state. The exergy considered in this paper is enthalpy exergy, as defined in Equation (3). Exergy is a function of enthalpy and entropy, which are functions of state. All practical processes are irreversible and thus cause the exergy degradation. Therefore, the exergy destruction (ΔEx) of a flow is defined as the difference of input exergy and output exergy, as shown in Equation (4):
E x = m [ h h 0 ( t 0 + 273.15 ) ( s s 0 ) ]
Δ E x = E x i n E x o u t
where t0 is the reference temperature and h0 and s0 are the specific enthalpy and specific entropy evaluated under the reference state. In this paper, the values of reference temperature and pressure are 25 °C and 100 kPa, respectively.
Based on the mass and energy conservation principle, energy and exergy analysis models for each component are summarized in Table 6.
The capital investment of the ORC system and its cost of electricity production are attractive to shipowner. Besides the thermodynamic performance of the combined ORC system, the economic performance is another essential indicator that should be considered. The total cost of the system (Ctot) is evaluated by Equations (5) and (6). The economic analysis model of each component is summarized in Table 7. The correlation coefficients are cited from [54], which are summarized in Table 8.
C 2001 = i = 0 3 C P i + i = 1 2 C C O N i + i = 1 3 C E V A i + i = 1 3 C E X P i
C t o t = C 2001 C E P C I 2018 / C E P C I 2001
where C2001 means the cost of the components in 2001, which are introduced by the CEPCI (Chemical Engineering Plant Cost Index); CEPCI2001 = 397, CEPCI2018 = 648.7 [54].

3.3. System Performance Criteria

The system energy efficiency (ηen) is defined as the ratio of a system network (Wnet) to the total heat exchange amount in the evaporators (QEVA,i). The Wnet is defined by the generated electricity Wi minus the consumed power WPi:
η e n = W n e t Q E V A , i = i = 1 3 W i i = 0 3 W P i Q E V A , i
The utilization of energy quality is more concerned than the exergy loss of each component. Therefore, the system exergy efficiency (ηex) is defined as the ratio of system network to the sum of exergy destruction from the heat source (ΔExhs) and cold source (ΔExcs):
η e x = W n e t Δ E x h s + Δ E x c s = W n e t ( E x h s , i n E x h s , o u t ) + ( E x c s , i n E x c s , o u t )
The payback period (PBP) is the time required to recover the cost of the investment, which is defined as:
P B P = C t o t W n e t τ c e l e C m
where τ is the annual operating time, which is assumed to be 7200 h; cele is the electricity price of 0.15 $/kWh; Cm is the maintenance cost, which is assumed to be 2% of the system cost.

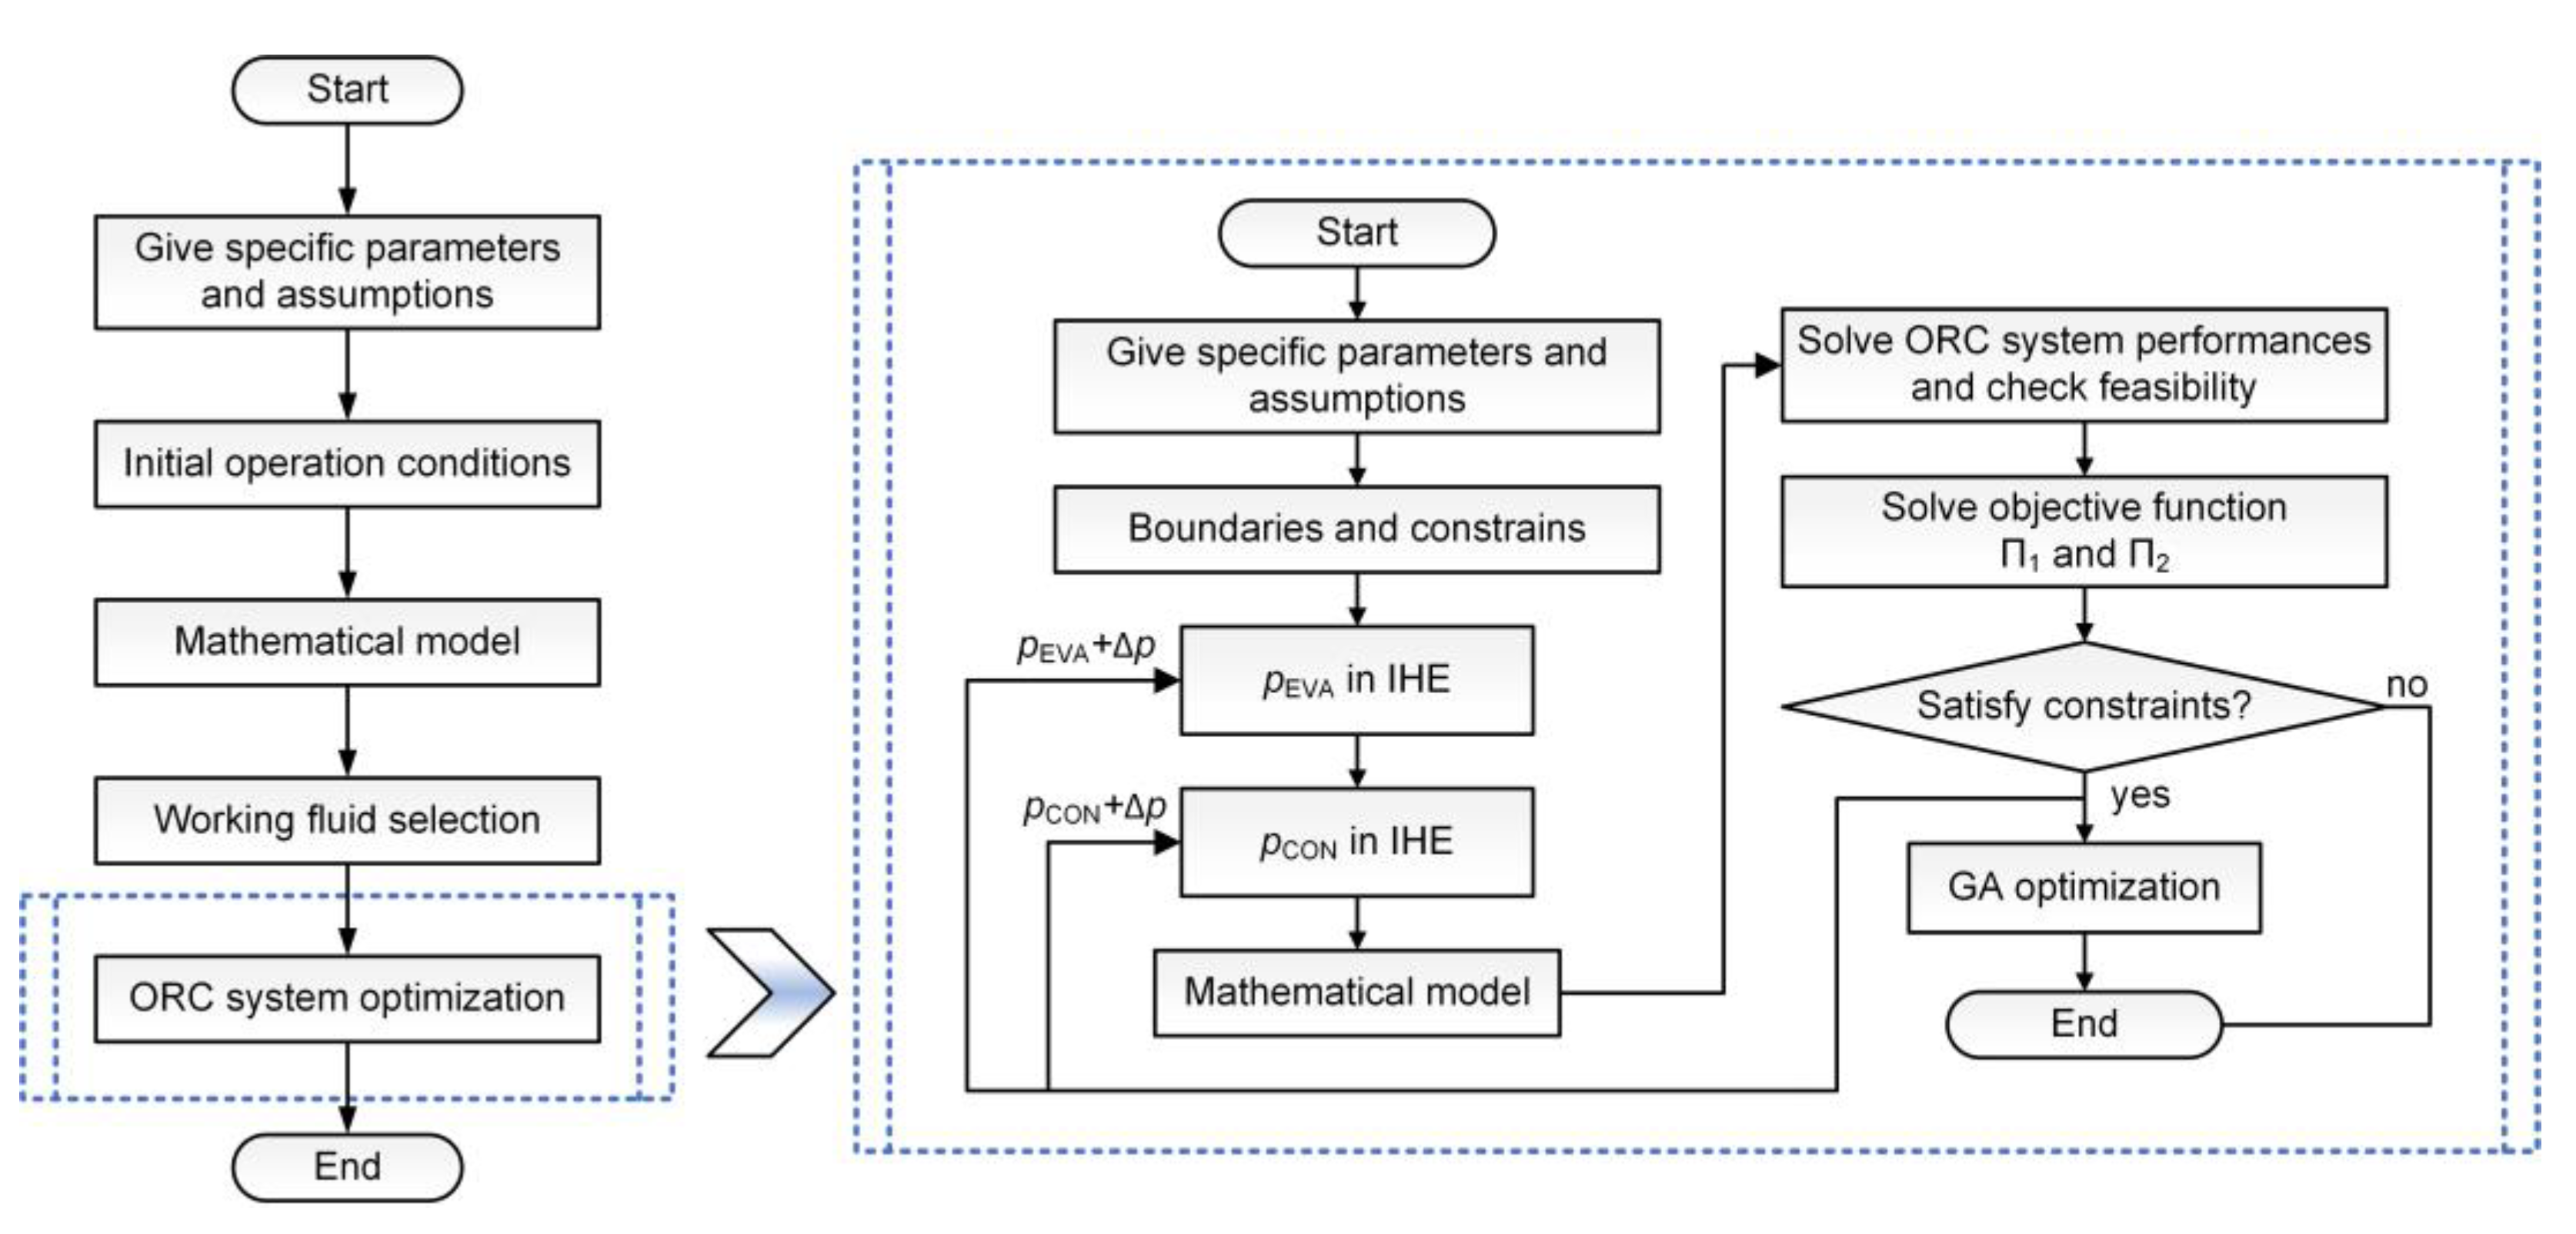
3.4. ORC System Optimization

3.4.1. Optimization Method

Multi-objective optimization has been widely used in various subjects to minimize or maximize two or more functions simultaneously with several constraints. In this paper, the Non-dominated Sorting Genetic Algorithm-II (NSGA-II), an improved version of NSGA, is utilized for ORC system performance optimization. NSGA-II is a heuristic search algorithm inspired by natural evolutionary techniques. In the NSGA-II optimization process, all populations are modified within the constraints. At each step, the selected population is used as parents to produce offspring generations via tournament selection, cross over and mutation operators. The population that has a higher fitness function value is chosen for the next iteration. After successive generations, the population evolved to the optimal solutions. The main steps of multi-objective genetic algorithm using NSGA-II are presented in Figure 4. More details can be found in the Reference [55].

3.4.2. Objective Functions and Decision Making

Two important objective functions are defined for multi-objective optimization purpose. The first objective function Π1 is defined as the product of system energy efficiency and exergy efficiency, which should be maximized. The second objective function Π2 is set as the system investment divided by the payback period, which should be minimized. The objective functions Π1 and Π2 are defined in Equations (10) and (11), respectively. The optimization variables considered in case of different WFs are the evaporation and condensation pressure in the intermediate heat exchanger:
Π 1 = η e n η e x
Π 2 = C t o t / P B P
In the multi-objective optimization, any improvement in one objective function requires at least one other objective function to be refined. Therefore, no single solution for solving the conflicts among the objective functions exists and a set of trade-off optimal solutions are generally presented, known as the Pareto front. The standard Technique for Order Preference by Similarity to Ideal Situation (TOPSIS) method attempts to choose alternatives that have the shortest distance from the ideal solution [56,57]. The TOPSIS decision making is used in the present study. In order to achieve the optimal operating parameters more reasonably, all candidate points of Π1 and Π2 are normalized between 0.05 and 0.95 with Equations (12) and (13), respectively.
Π 1 = 0.95 + ( 0.95 0.05 ) ( Π 1 Π 1 , max ) ( Π 1 , max Π 1 , min )
Π 2 = 0.95 + ( 0.95 0.05 ) ( Π 2 Π 2 , max ) ( Π 2 , max Π 2 , min )
where min and max represent the minimum and maximum values in the solution of objective functions.

3.5. Solution Algorithm and Model Validation

The calculations of thermophysical properties of WFs and energy balance are implemented in Aspen Hysys (V9.0, Aspen Tech, Bedford, MA, USA). The PR (Peng-Robinson) equation is used in the simulation process. However, the optimization capacity of Aspen Hysys V9 is very limited. Considering the convenience of optimization toolbox, the optimization of the ORC system was realized by MATLAB (2017b, MathWorks, Natick, MA, USA). By adjusting the interactions between thermophysical properties and operating parameters of the combined ORC system, the calculation procedure of the optimization parameters is shown in Figure 5. Firstly, specific parameters and basic assumptions were given. The corresponding component and the energy, exergy and economic model were established. Secondly, ORC performance simulation was carried out under the initial conditions to determine the optimal WFs combinations for further study. Thirdly, the boundaries and constraints for the specified WF combination were set. The evaporation pressure and condensation pressure increased gradually within the specified scope. For each loop, the performance criteria and the objective functions were calculated. Finally, the optimization was carried out and the Pareto solution was obtained. Values of important parameters in GA are presented in Table 9.
To ensure reliability and validity of the proposed model, comparisons between the previously published results and this paper were conducted. Sun et al. [58] proposed a cascade two-stage ORC system, which consists of two ORC subsystems sharing the same evaporative condenser. The structure is similar to part of the proposed combined ORC system. However, economic analysis was not carried out in their work. Yang [59] investigated the payback period of ORC system with waste heat recovery from exhaust gas of a large marine diesel engine, which could provide reference for the economic analysis of this paper. Therefore, comparisons with previous studies [58,59] were conducted. The initial conditions and all calculation results are listed in Table 10. The mean relative errors of thermal and economic indexes are within 28%. Comparing the exergy efficiency, this paper obtained lower results than for that in [58], especially for the waste heat at high temperature. The reason for this can be attributed to the evaporation pressure limited by heat source. Therefore, the developed model could be employed for further performance analysis of the combined ORC system.

4. Results and Discussions

4.1. WF Combination Selection

The thermal criteria (energy efficiency and exergy efficiency) and economic criteria (system cost and payback period) for 36 WF combinations are demonstrated in Figure 6a,b, respectively. In order to evaluate the comprehensive performance of WF, Π1 and Π2 of the ORC system with the predetermined 36 WF combinations are summarized in Table 11. From Table 11, it can be seen that case 15 demonstrates the best thermal performance with Π1 equals 6.68% and case 19 shows the best economic performance with Π2 equals 2.66 × 10⁵ $/year. Instead of optimizing the WF combination, this paper would focus on working pressure optimization. Therefore, case 15 and case 19 are selected as two optimal WF combinations and would be further studied.

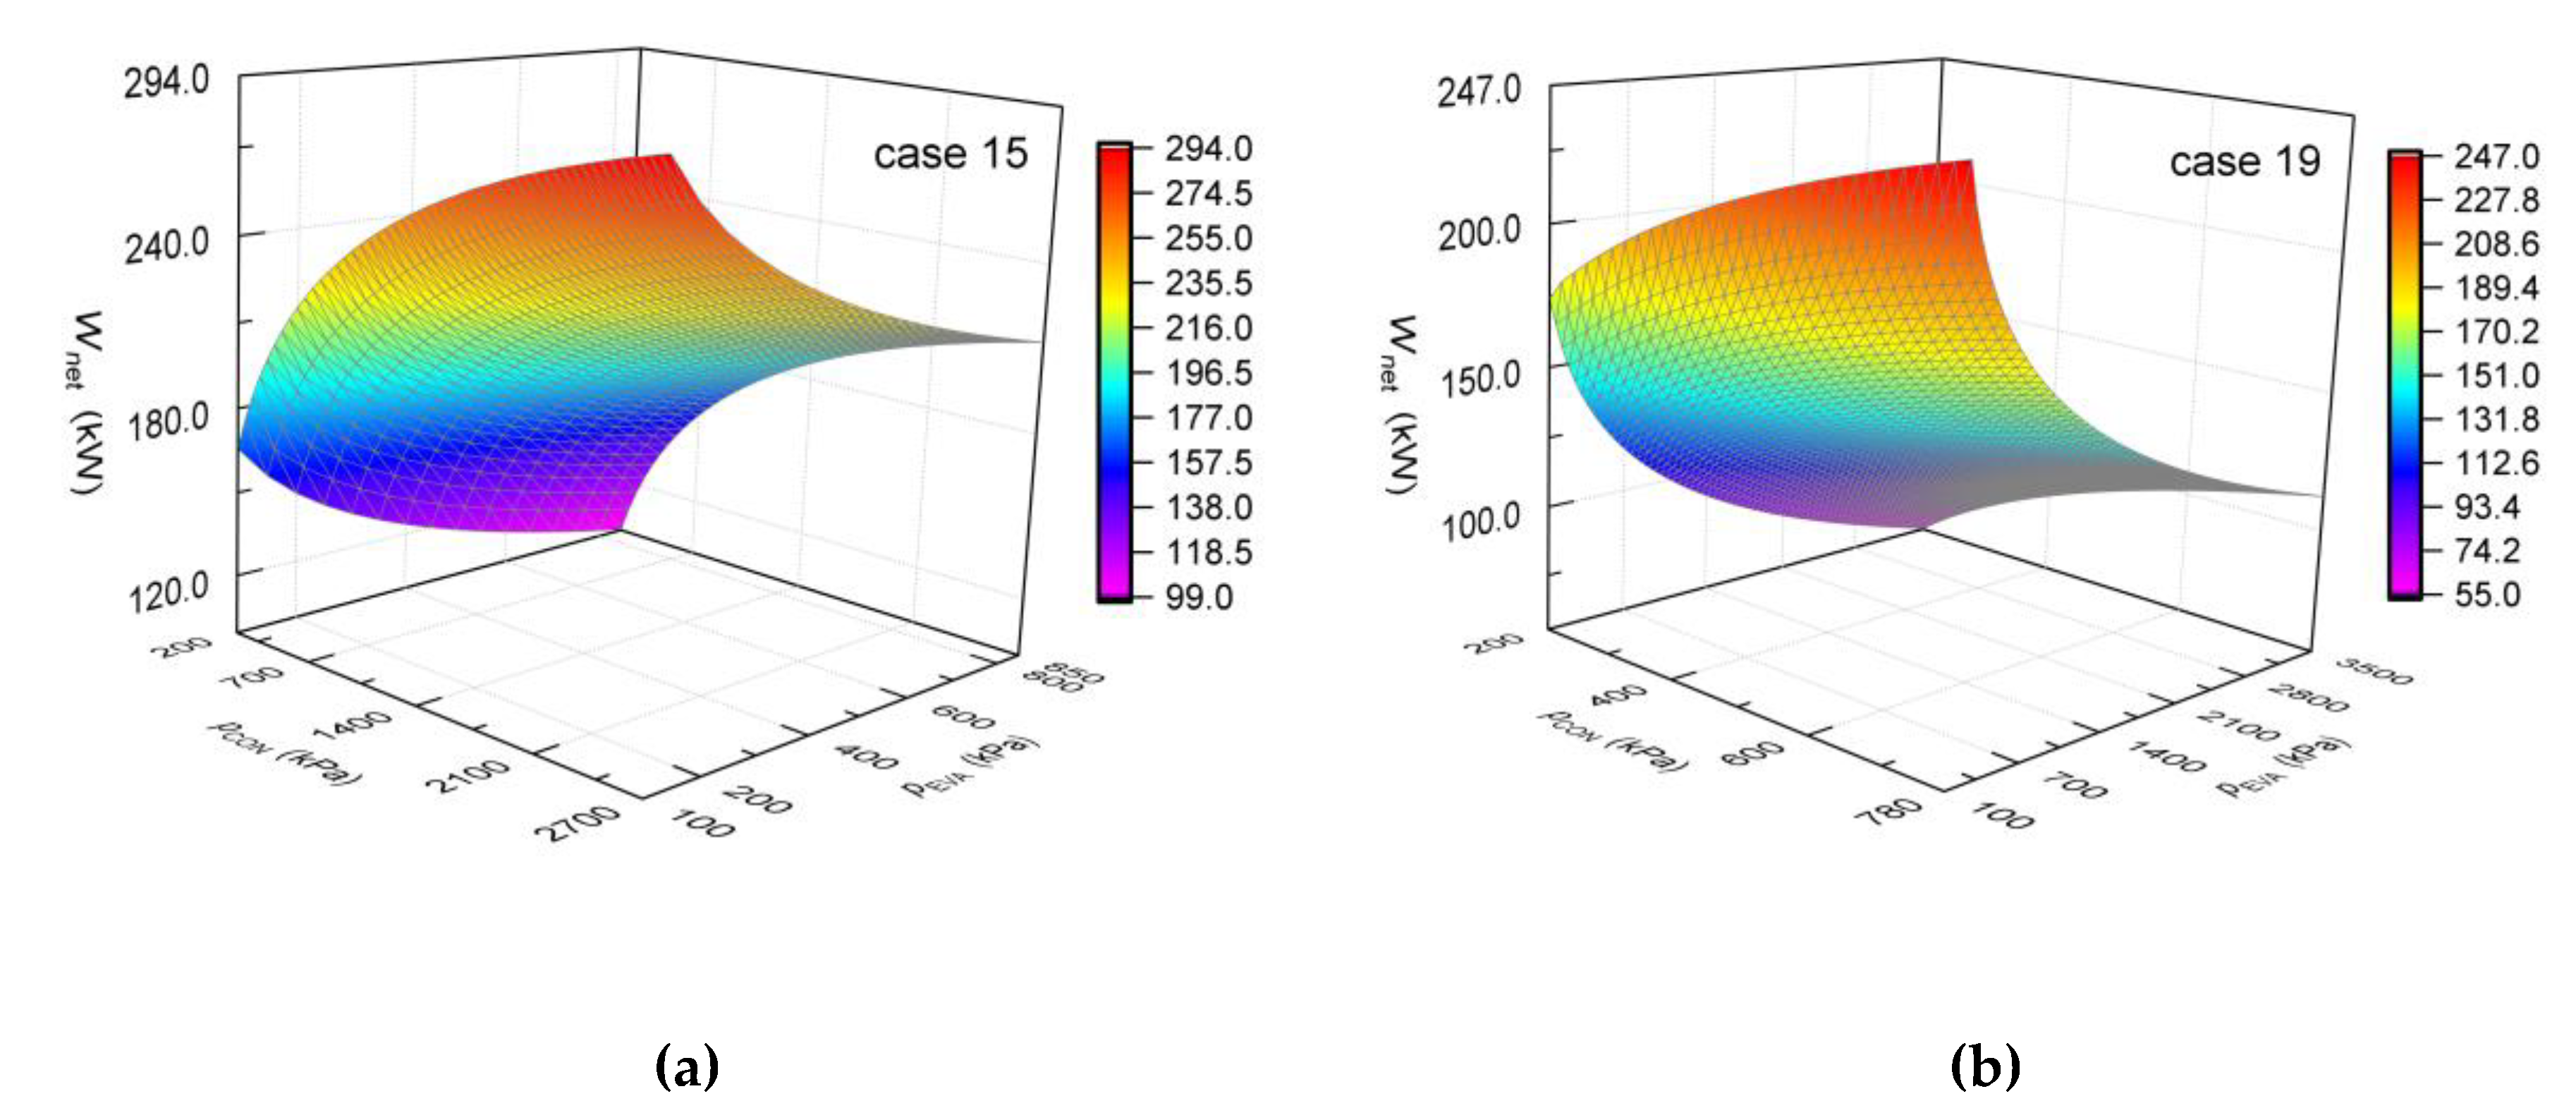
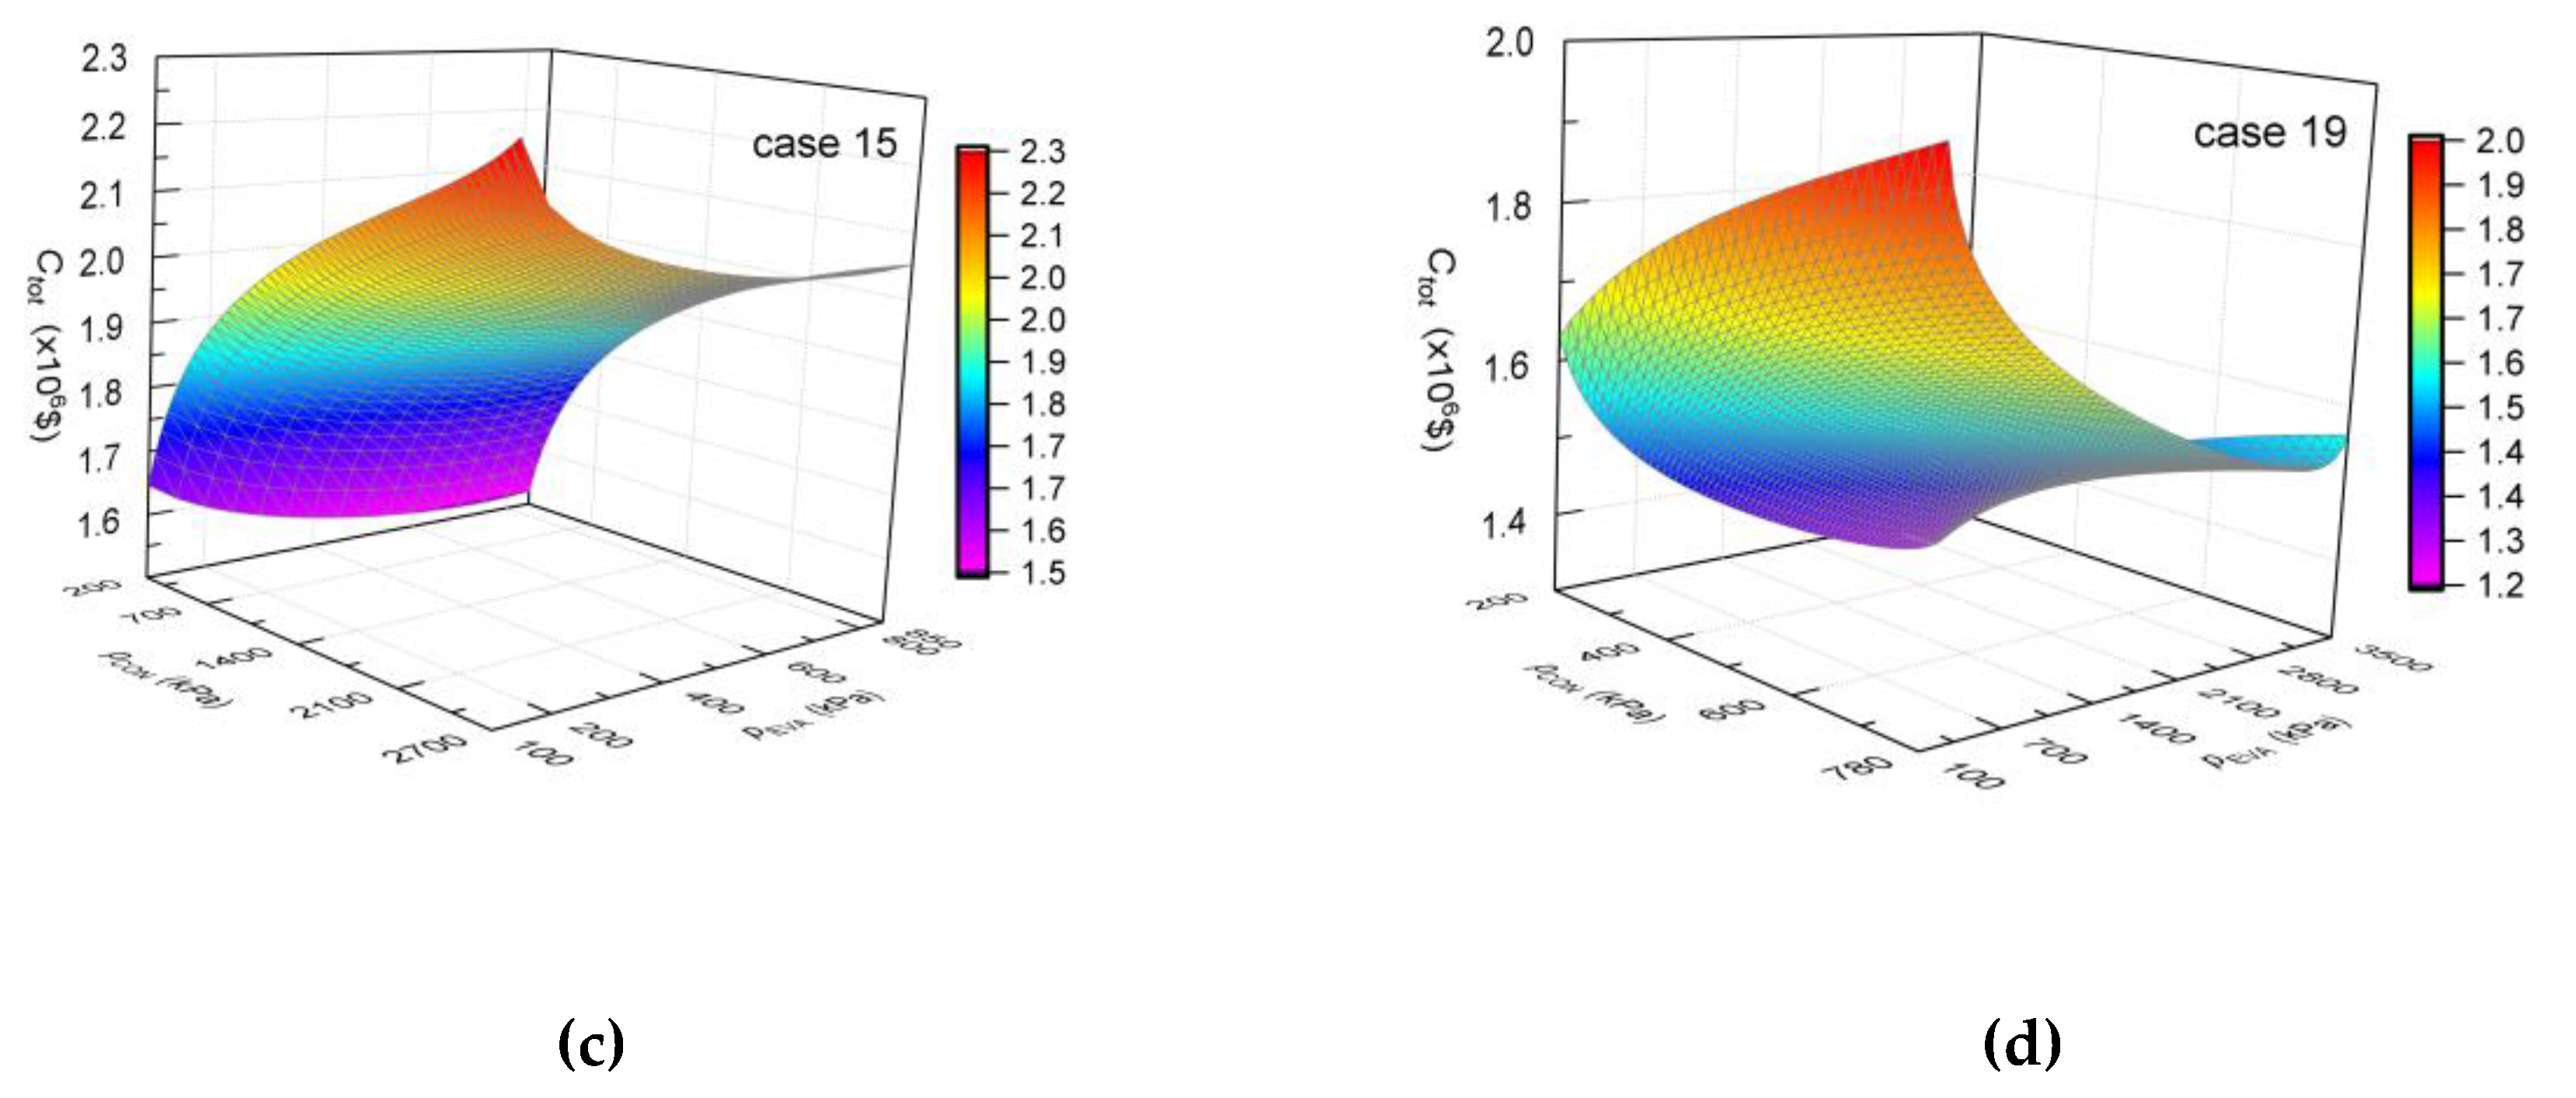
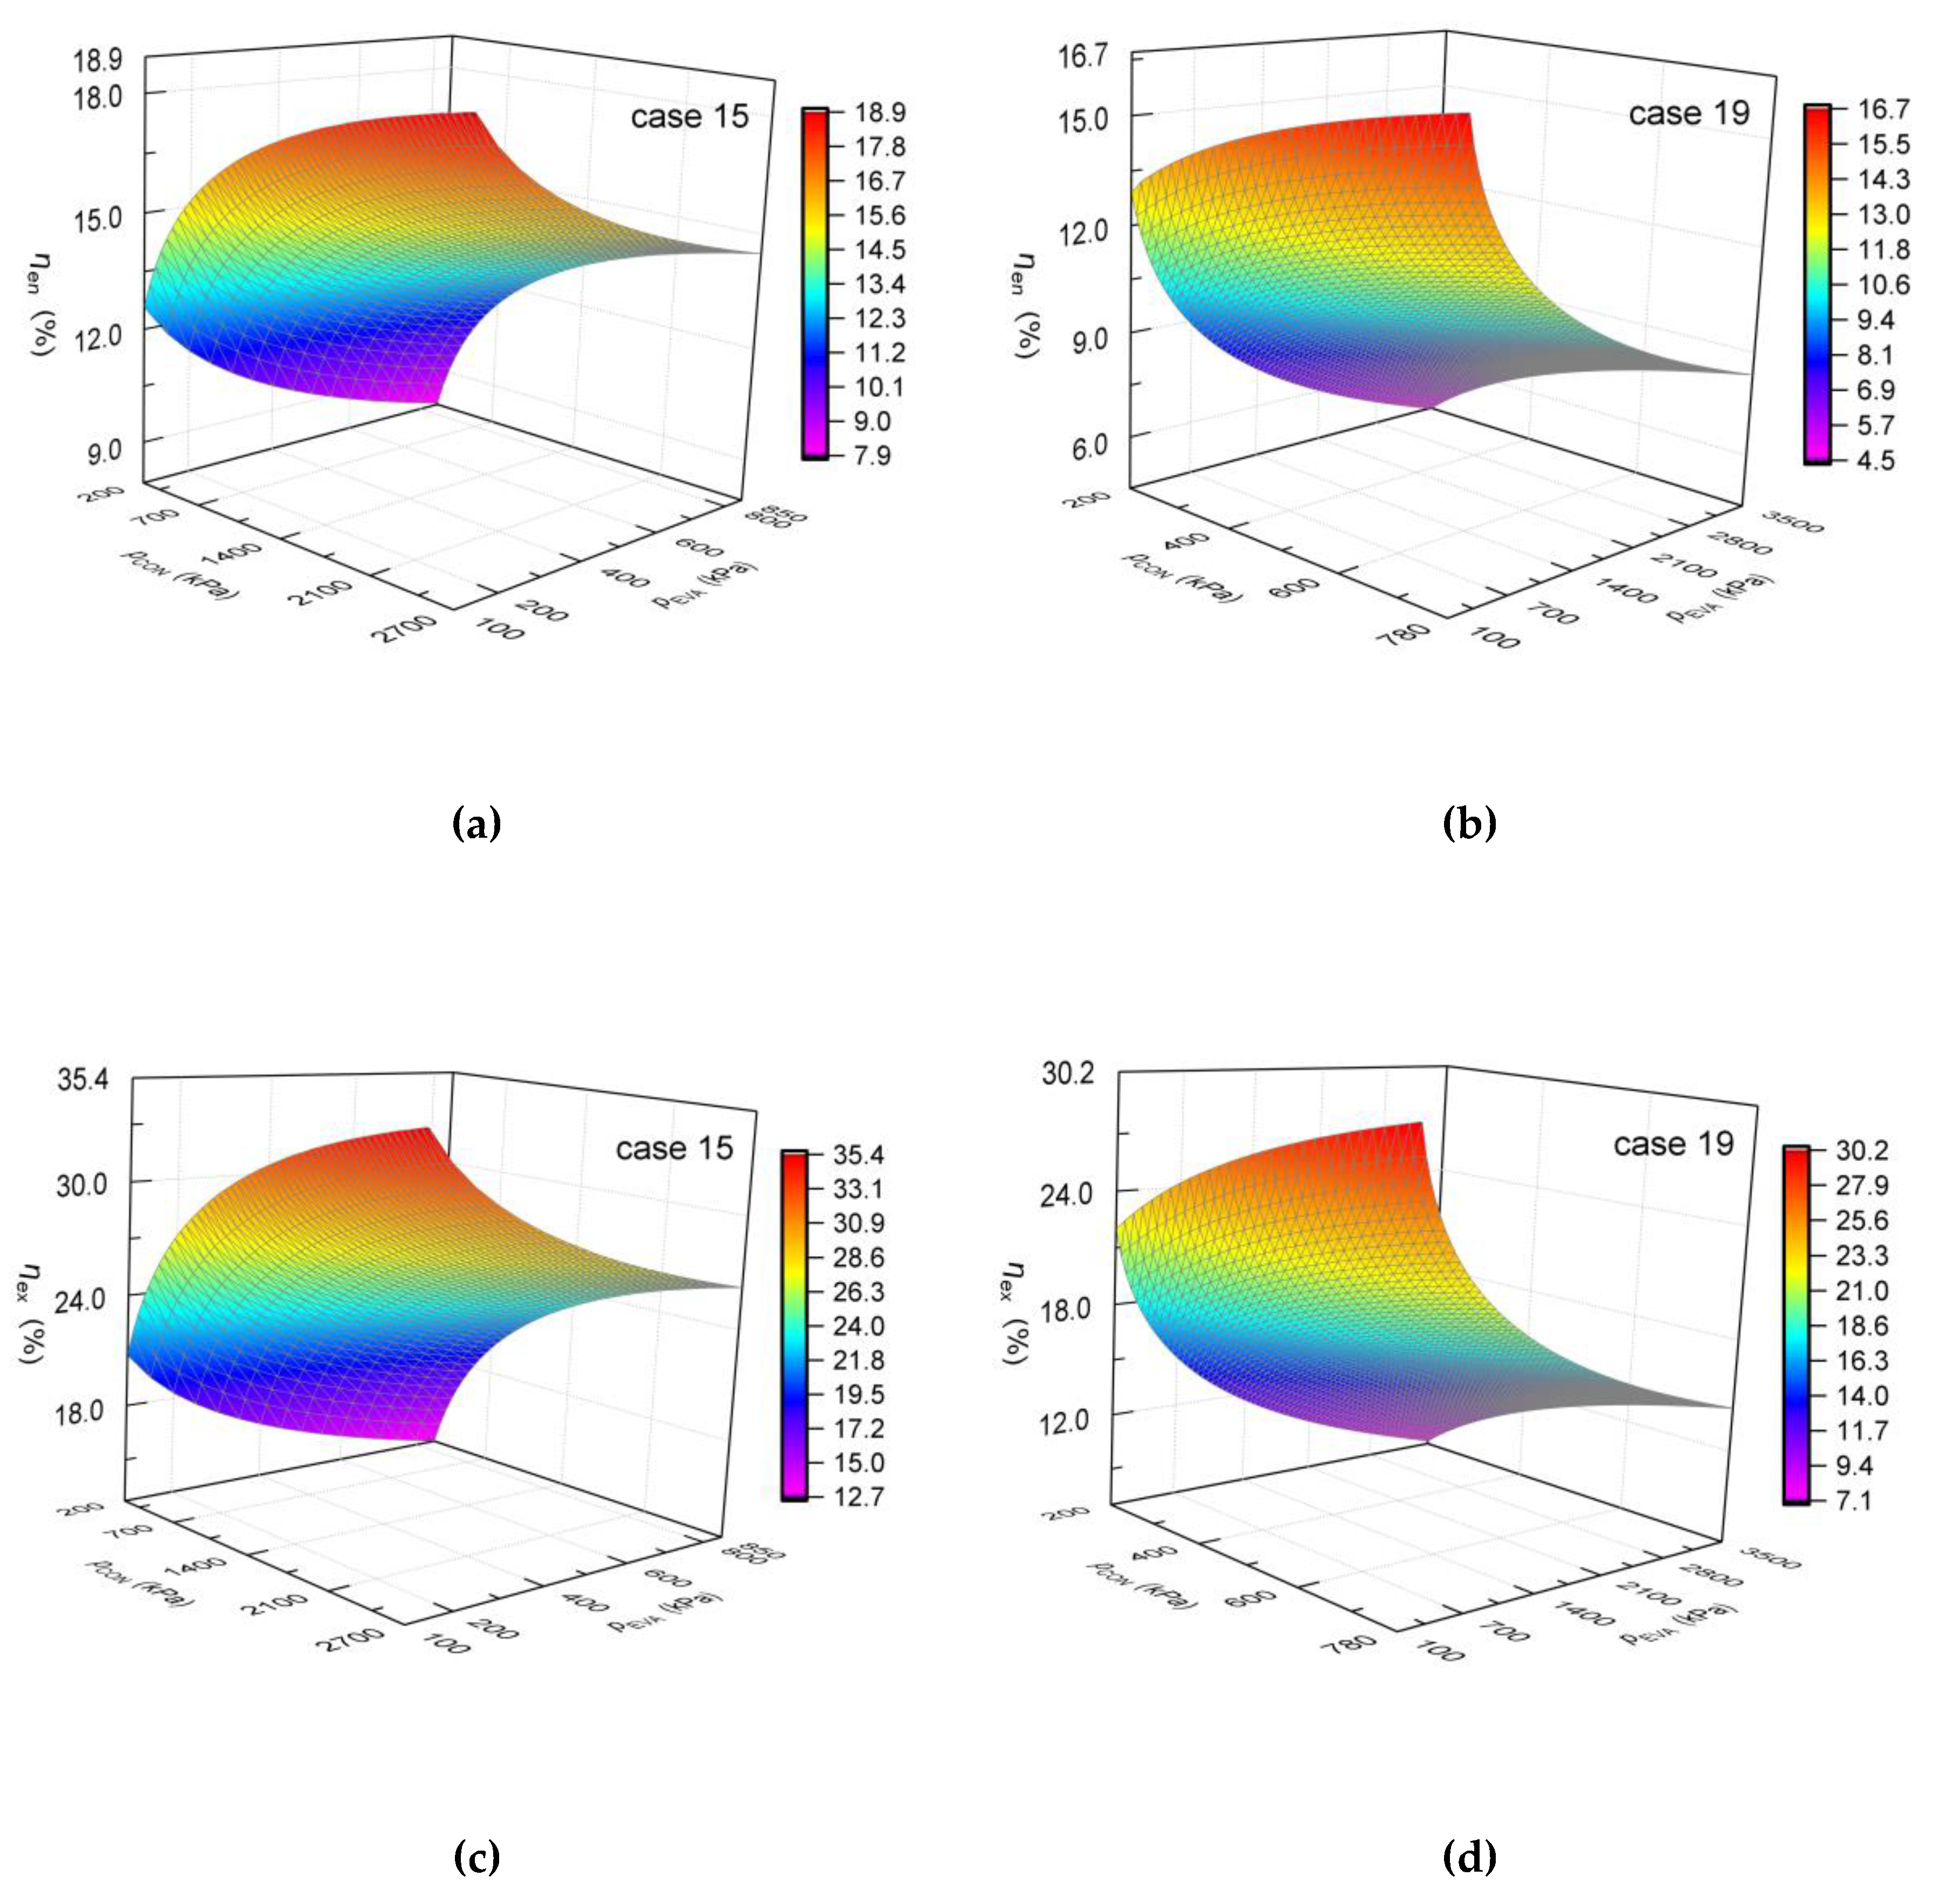
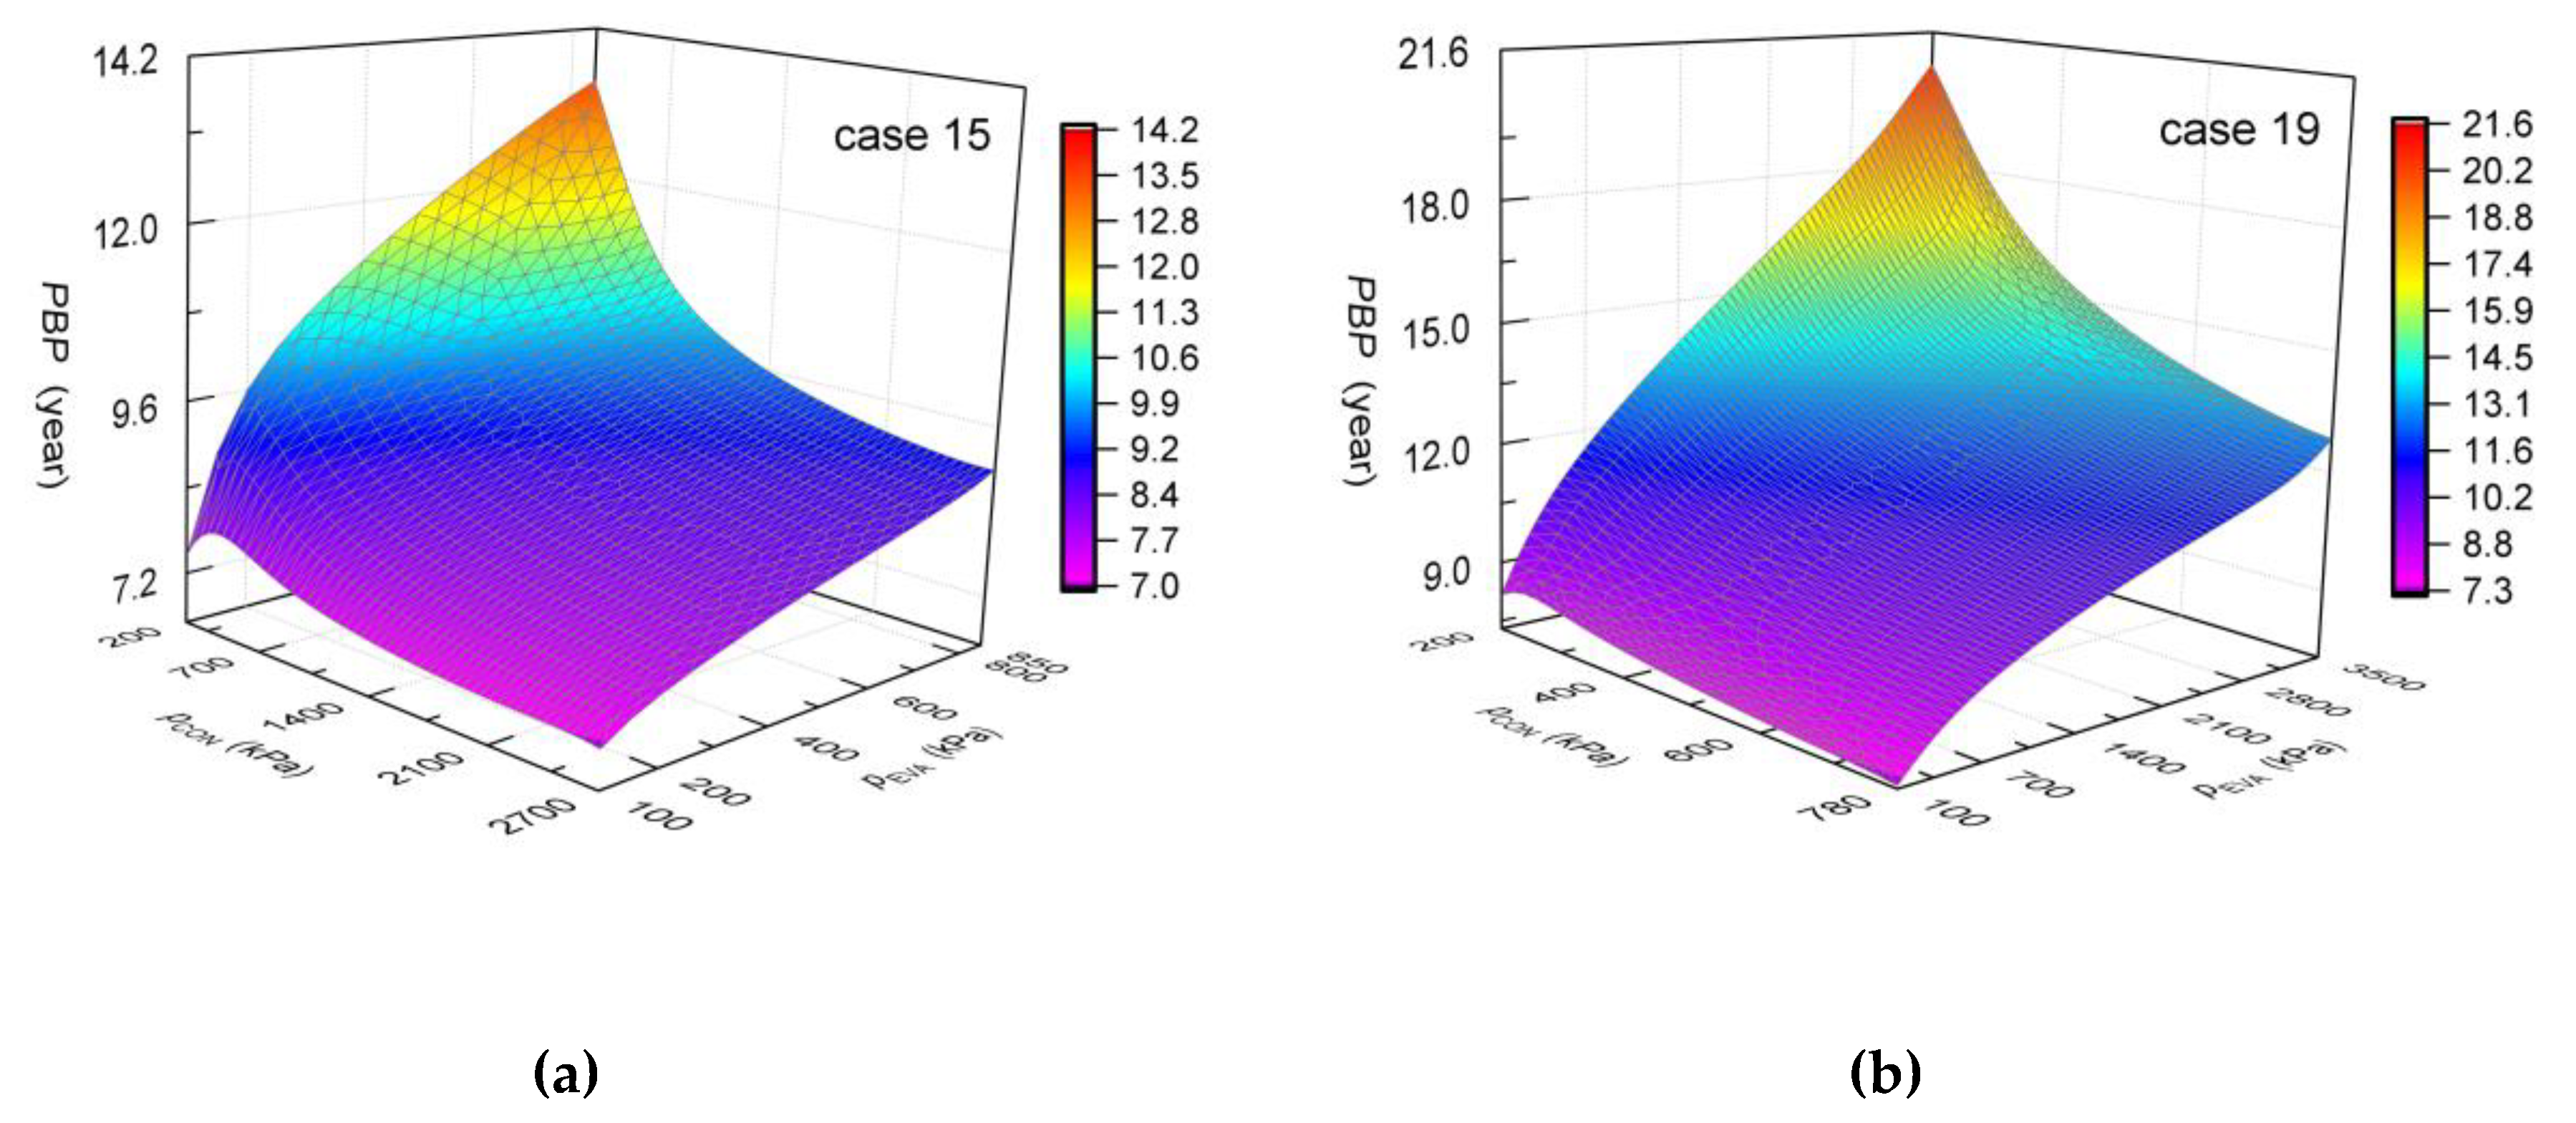
4.2. Effect of Condensation and Evaporation Pressures

Limited by the heat transfer temperature difference in EVA1 and EVA3, the ranges of intermediate condensation pressure (pCON) for case 15 and case 19 are 200–2700 kPa and 200–780 kPa, respectively. The ranges of intermediate evaporation pressure (pEVA) for case 15 and case 19 are 100–850 kPa and 100–3500 kPa, respectively. Figure 7 illustrates the system net output work (Wnet) and system total cost (Ctot) with the variation of pCON and pEVA for case 15 and case 19. As observed from Figure 7a,b, the Wnet of case 15 and case 19 varies in the range of 99–294 kW and 55–247 kW, respectively. As the pCON increases, the Wnet of case 15 and case 19 increases, even though the increase gradually slows down. At the same time, the Wnet for case 15 and case 19 decreases with the increase of pEVA. The results of the Ctot are shown in Figure 7c,d demonstrating that the Ctot case 15 is higher than that of case 19. The Ctot of case 15 and case 19 vary in the range of 1.5 × 10⁶–2.3 × 10⁶ $ and 1.3 × 10⁶–2.0 × 10⁶ $, respectively. Similar to the variation trend of Wnet, the Ctot case 15 and case 16 increases with the pCON increase, while it decreases with the pEVA increase. This is clearly indicating that larger output work requires larger system investment. From a practical point of view, a contradiction exists in the two parameters and it makes sense to carry out multi-objective optimization.
The variation of energy efficiency (ηen) and exergy efficiency (ηex) with pCON and pEVA are shown in Figure 8. As shown in Figure 8a,b, the ηen for case 15 is higher than that for case 19 on the whole. ηen increases with the increase of pCON while decreases with the increase of pEVA. ηen for case 15 and case 19 varies in the range of 7.9–18.9% and 4.5–16.7%, respectively. In the area with high pCON, ηen increases dramatically. This is because the power output increases faster than the heat absorbed from heat source. The effect of pEVA on ηen gradually decreases with pEVA increasing. As shown in Figure 8c,d, the ηex for case 15 and case 19 varies in 12.7–35.4% and 7.1–30.2%, respectively. ηen and ηex have the same variation trend with the pressures.
The trend of payback period (PBP) for case 15 and case 19 is displayed in Figure 9. The PBP of case 15 and case 19 varies between 7.0–14.2 years and 7.3–21.6 years, respectively. Even though the system total cost of case 19 is less than case 15, the PBP of case 19 is much longer than case 15. The reason can be attributed to the lower output power and lower energy utilization efficiency, which are illustrated in Figure 7 and Figure 8, respectively. The higher the pCON is, the shorter the PBP is. The higher the pEVA is, the longer the PBP is. These results can prove that the variation trends of output power and system cost are correct.
Figure 10 depicts the variations of the Logarithmic Mean Temperature Difference (LMTD) and the cost of EVA1 (CEVA1) for case 15 and case 19. As shown in Figure 10a,b, the LMTDs for the two cases have the same behavior of a decreasing trend with the increase of pCON when the pEVA remains at 100 kPa. In addition, the LMTD variation of case 15 is more dramatic than that of case 19. The LMTD of case 15 and case 19 varies in the range of 10.1–82.7 °C and 17.1–60.3 °C, respectively. The decrease of LMTD would lead to an increase of EVA1 heat transfer area, and thus result in CEVA1 increase. As shown in Figure 10c,d, the LMTD increases with the increase of pEVA when the pCON maintains at their highest pressure. The LMTD of case 15 increases from 10.1 °C to 90.6 °C when the pEVA increasing from 100 kPa to 850 kPa. The LMTD variation of case 19 is larger than that of case 15, which changes from 17.1 °C to 145.9 °C when the pEVA varies in the range of 100 kPa to 3500 kPa. The CEVA1 decreases with the increase of pEVA and the results are in accordance with the results shown in Figure 7c,d.

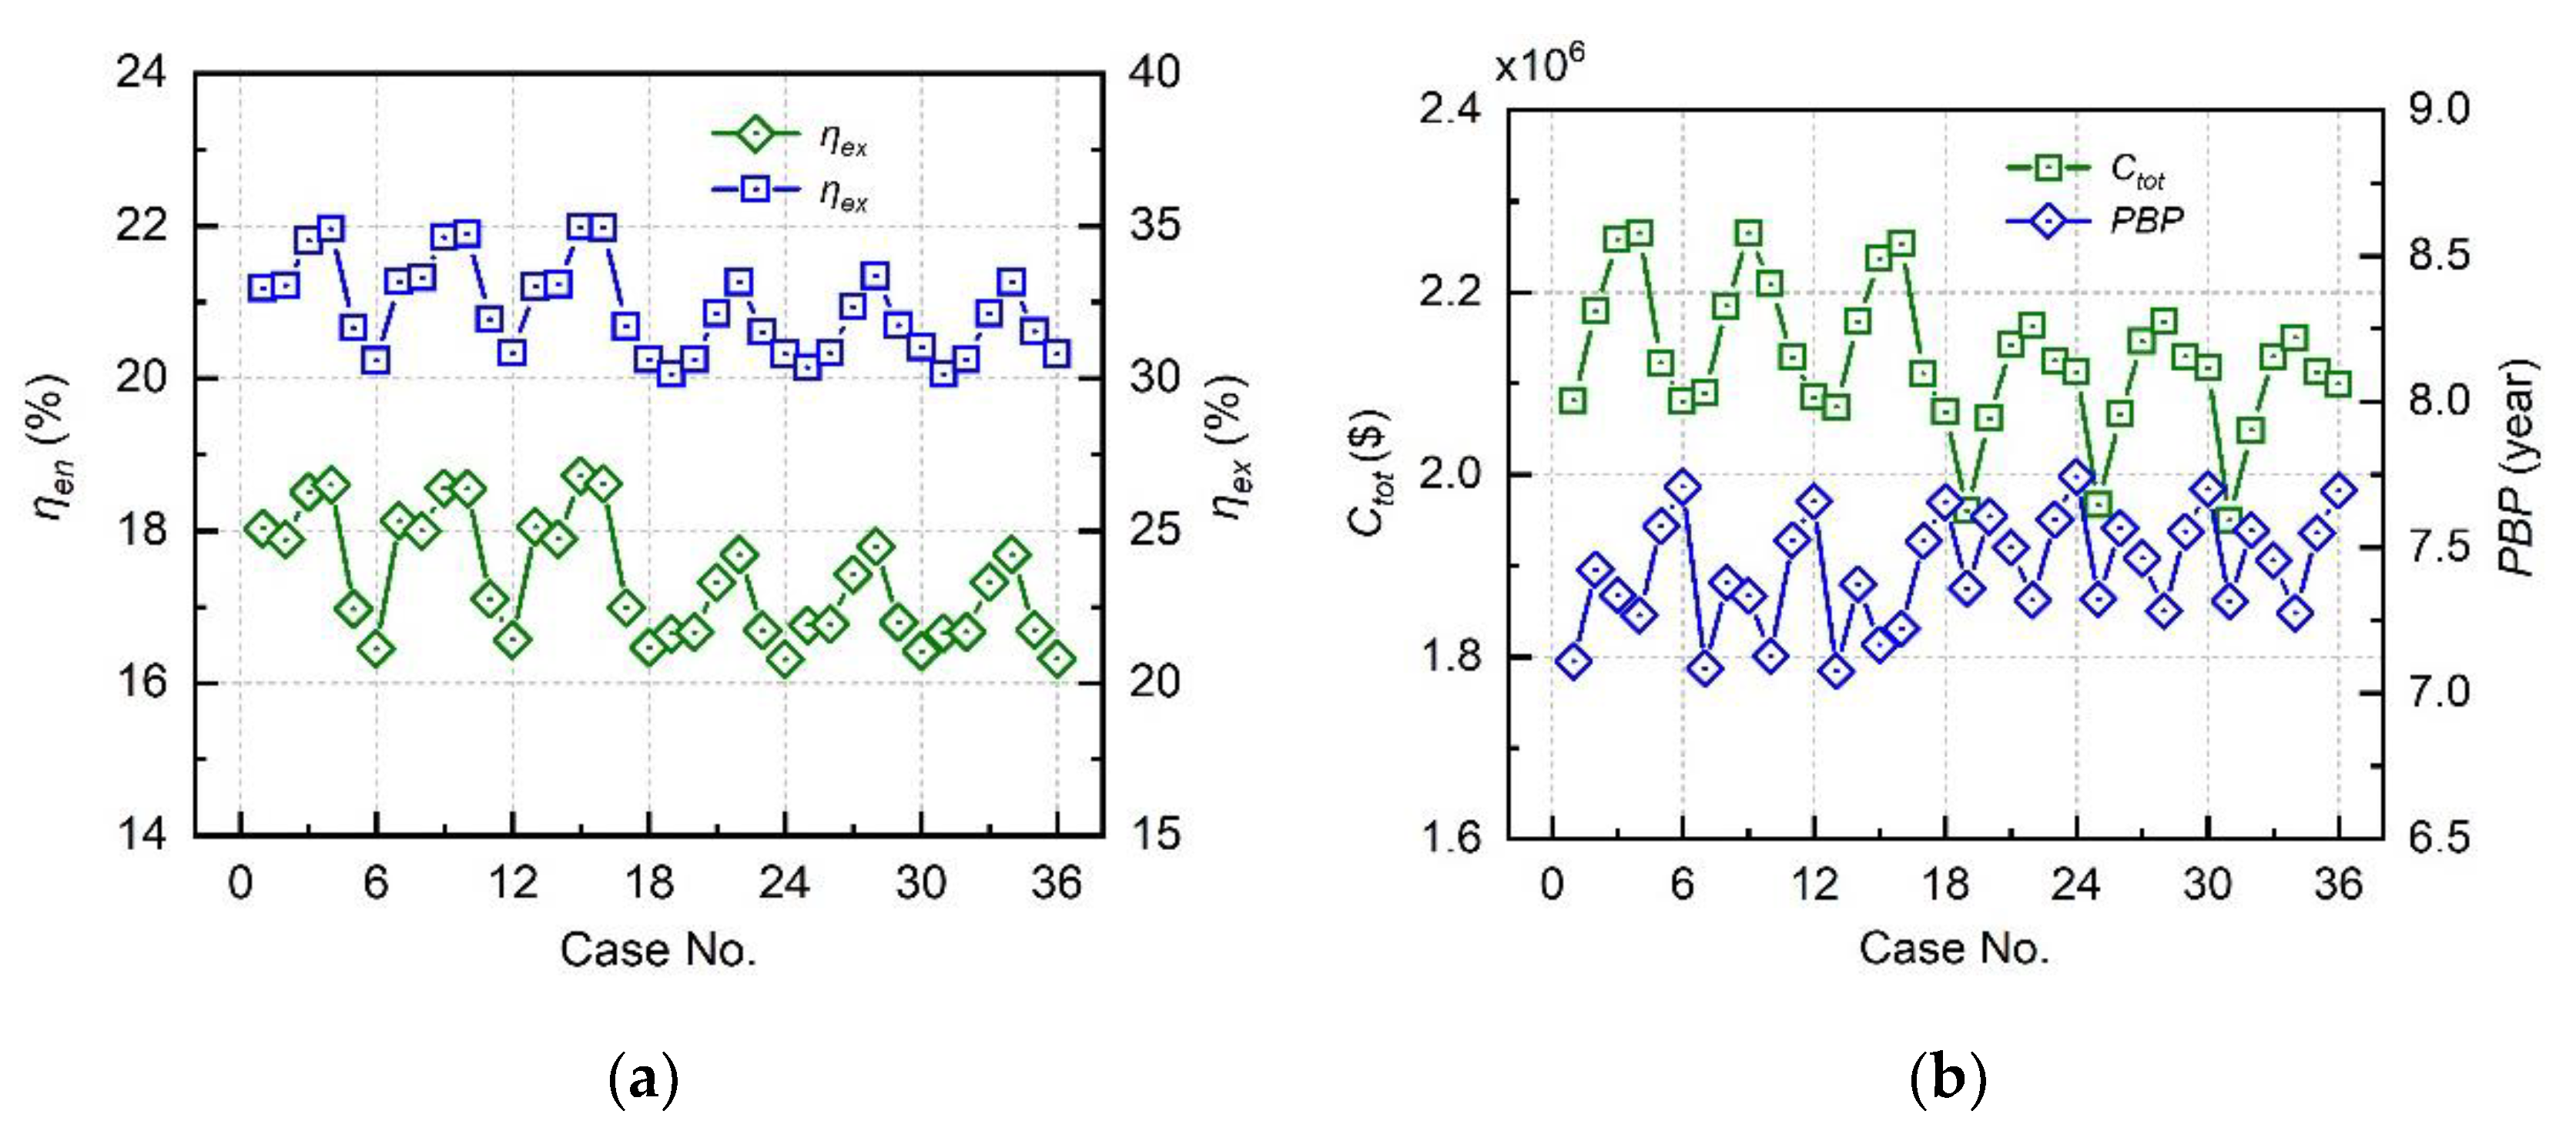
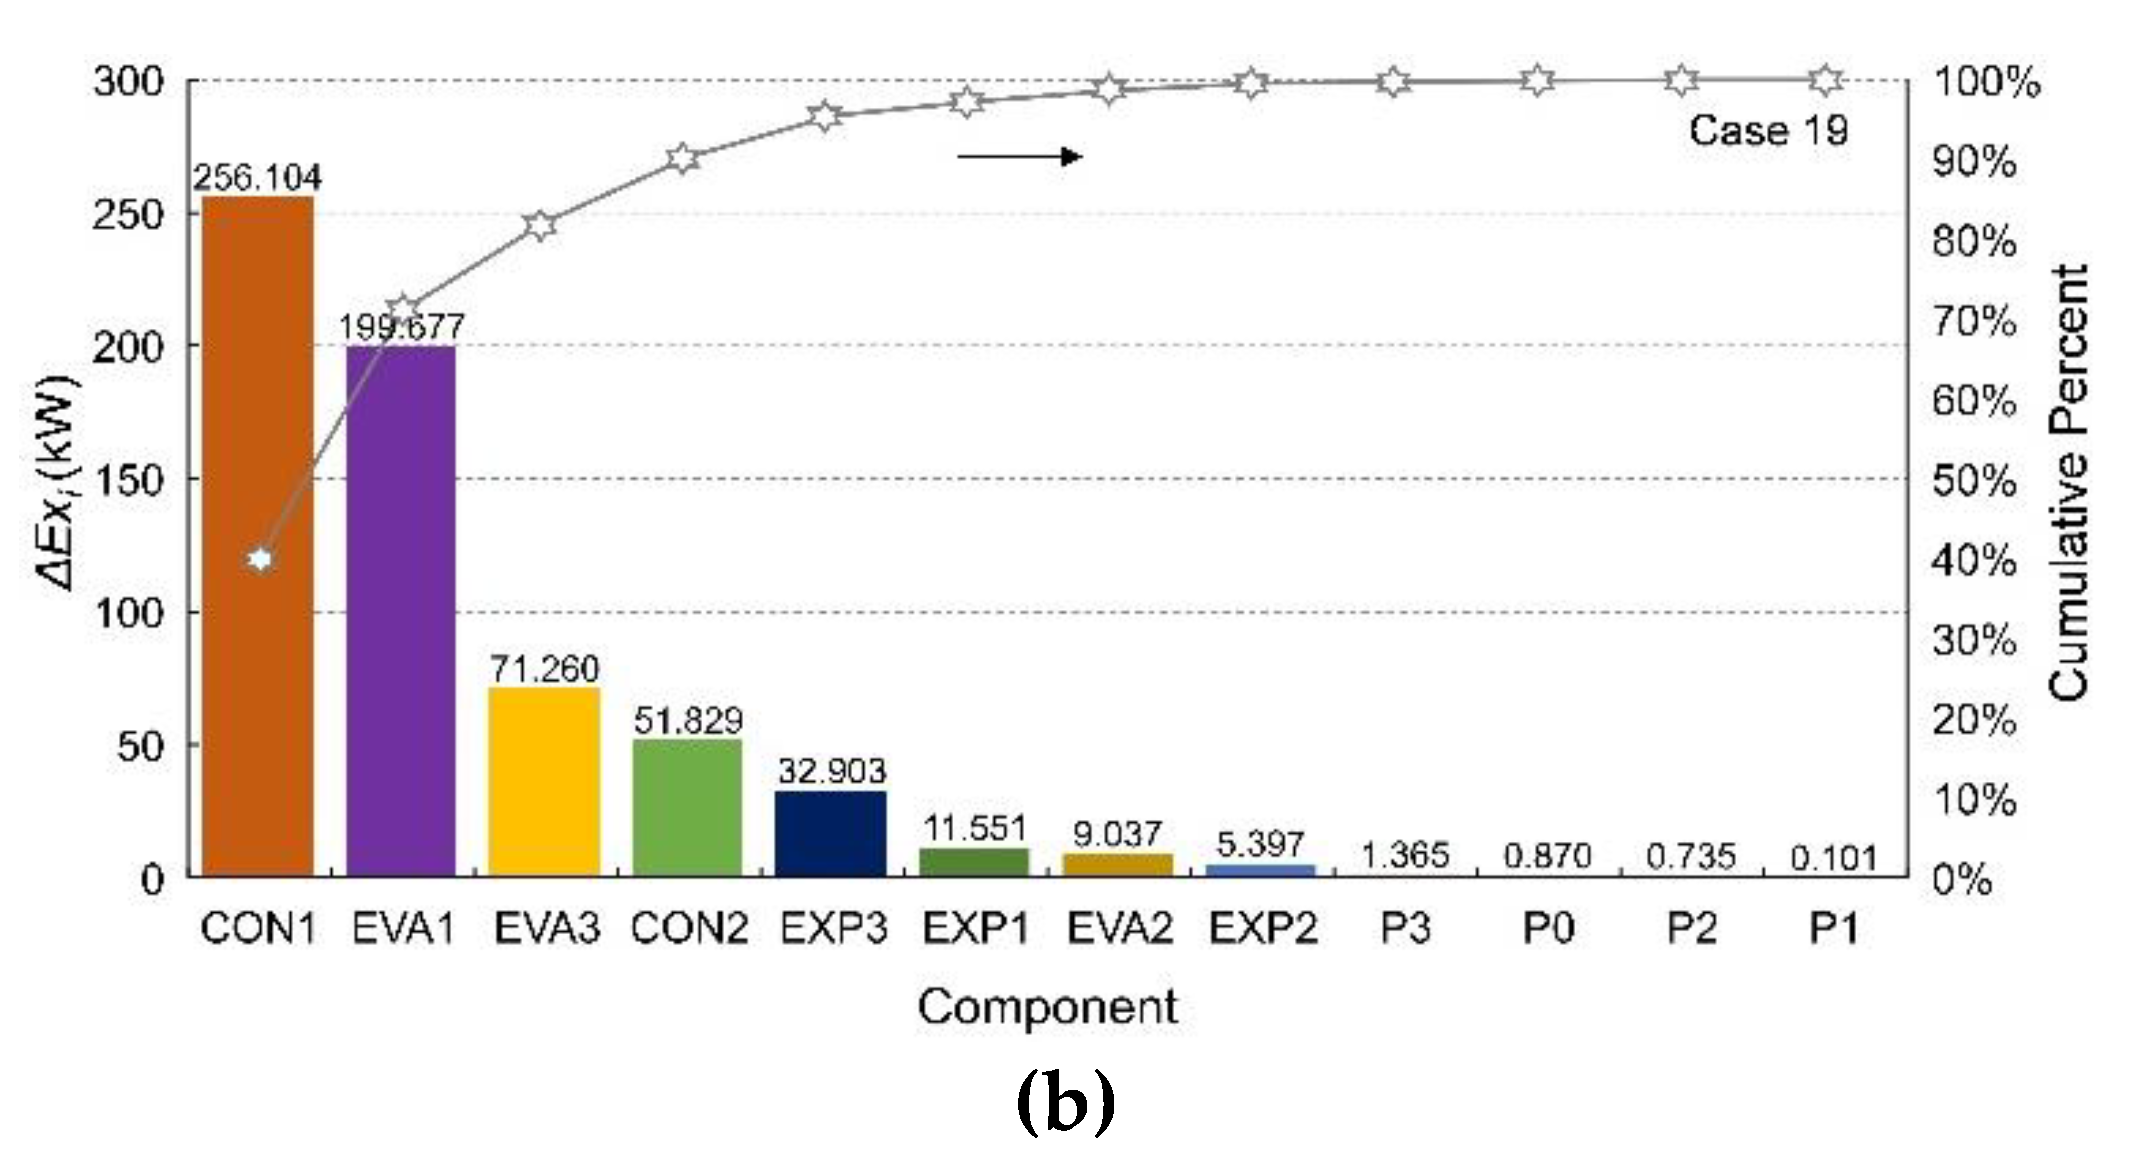
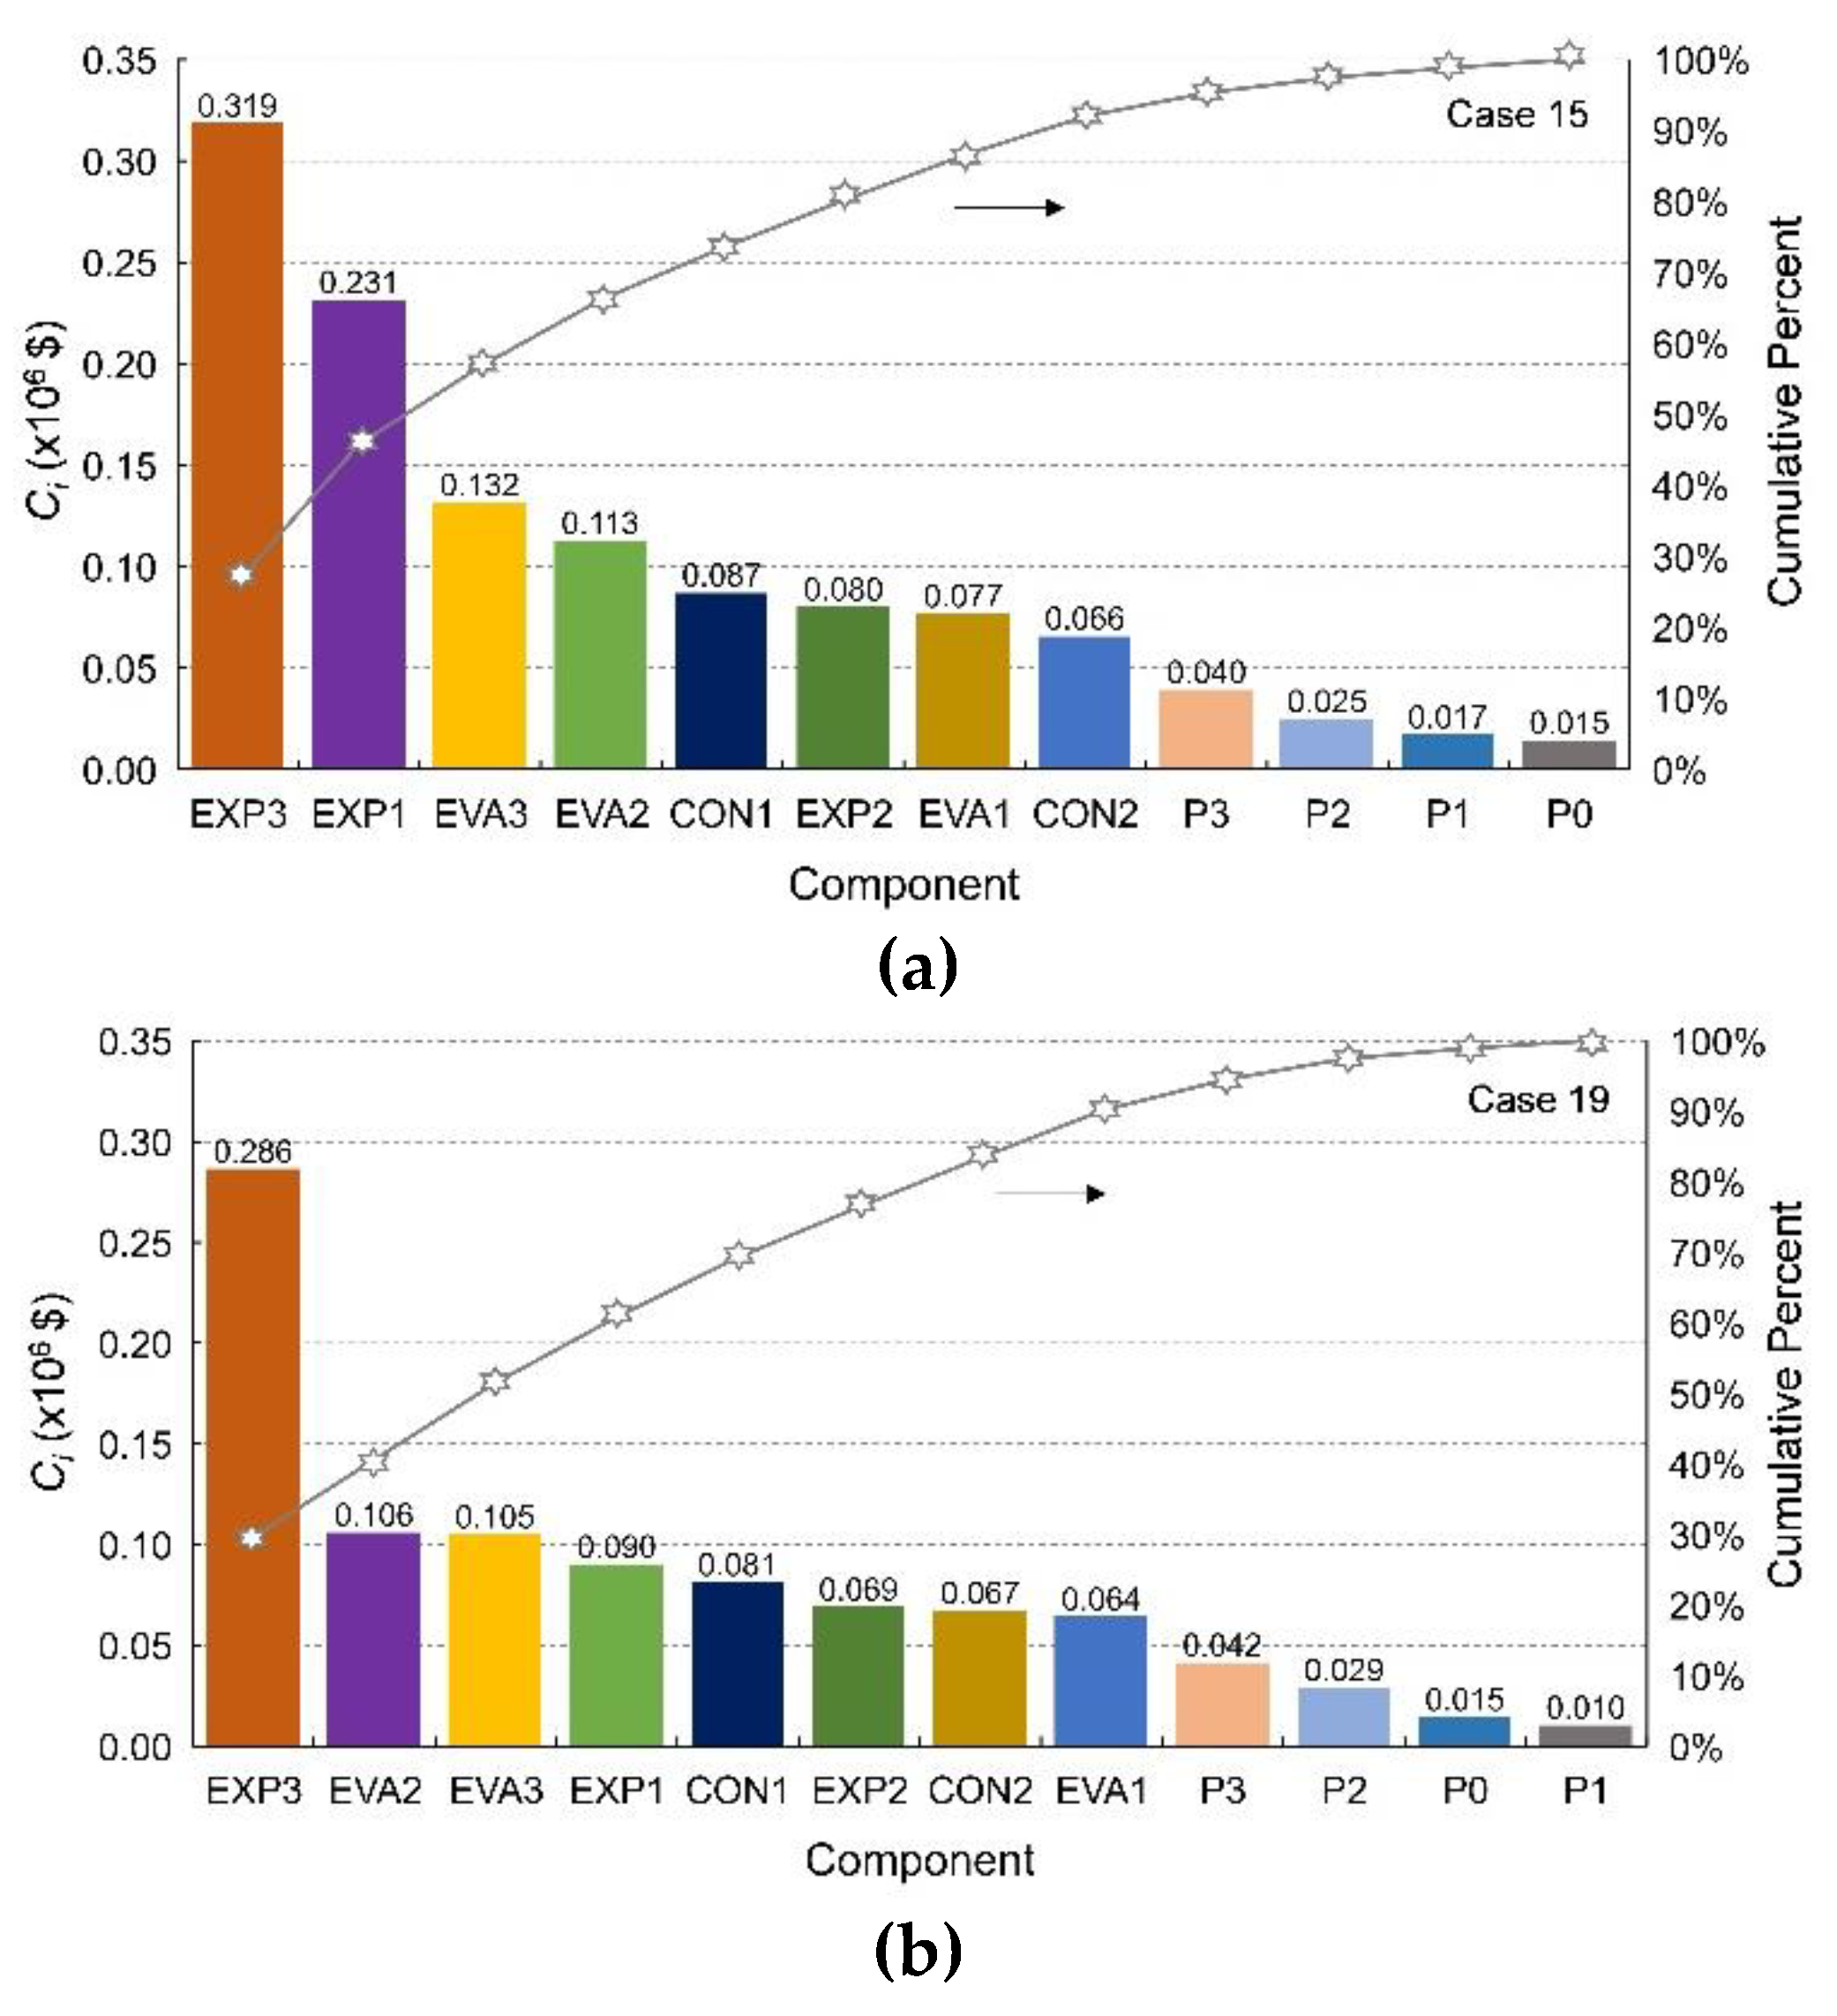
4.3. Overall Thermo-Economic Performances

The variation of Π1 and Π2 with the three optimal WF combinations with pCON and pEVA is displayed in Figure 11. Compare Figure 11a–d, it could draw a conclusion that case 15 has the highest thermal efficiency with Π1 equals 6.7% and the lowest system cost with Π2 equals to 0.6 × 10⁵ $/year that obtained from case 19. As observed from Figure 11a,b, Π1 decreases with the increase of pEVA even though the extent of the reduction gradually diminishes. With the increase of pEVA, the LMTD of the EVA3 decreases, which contributes to worse energy and exergy utilization from the exhaust gas. Π1 increases with the increase of pCON and the increase tends to be flat. This is primarily caused by the increase of output power in EXP1. As shown in Figure 11c,d, the economic index Π2 shows the same variation tendency with Π1, that is, Π2 decreases with pEVA increase, while it increases with pCON increase.

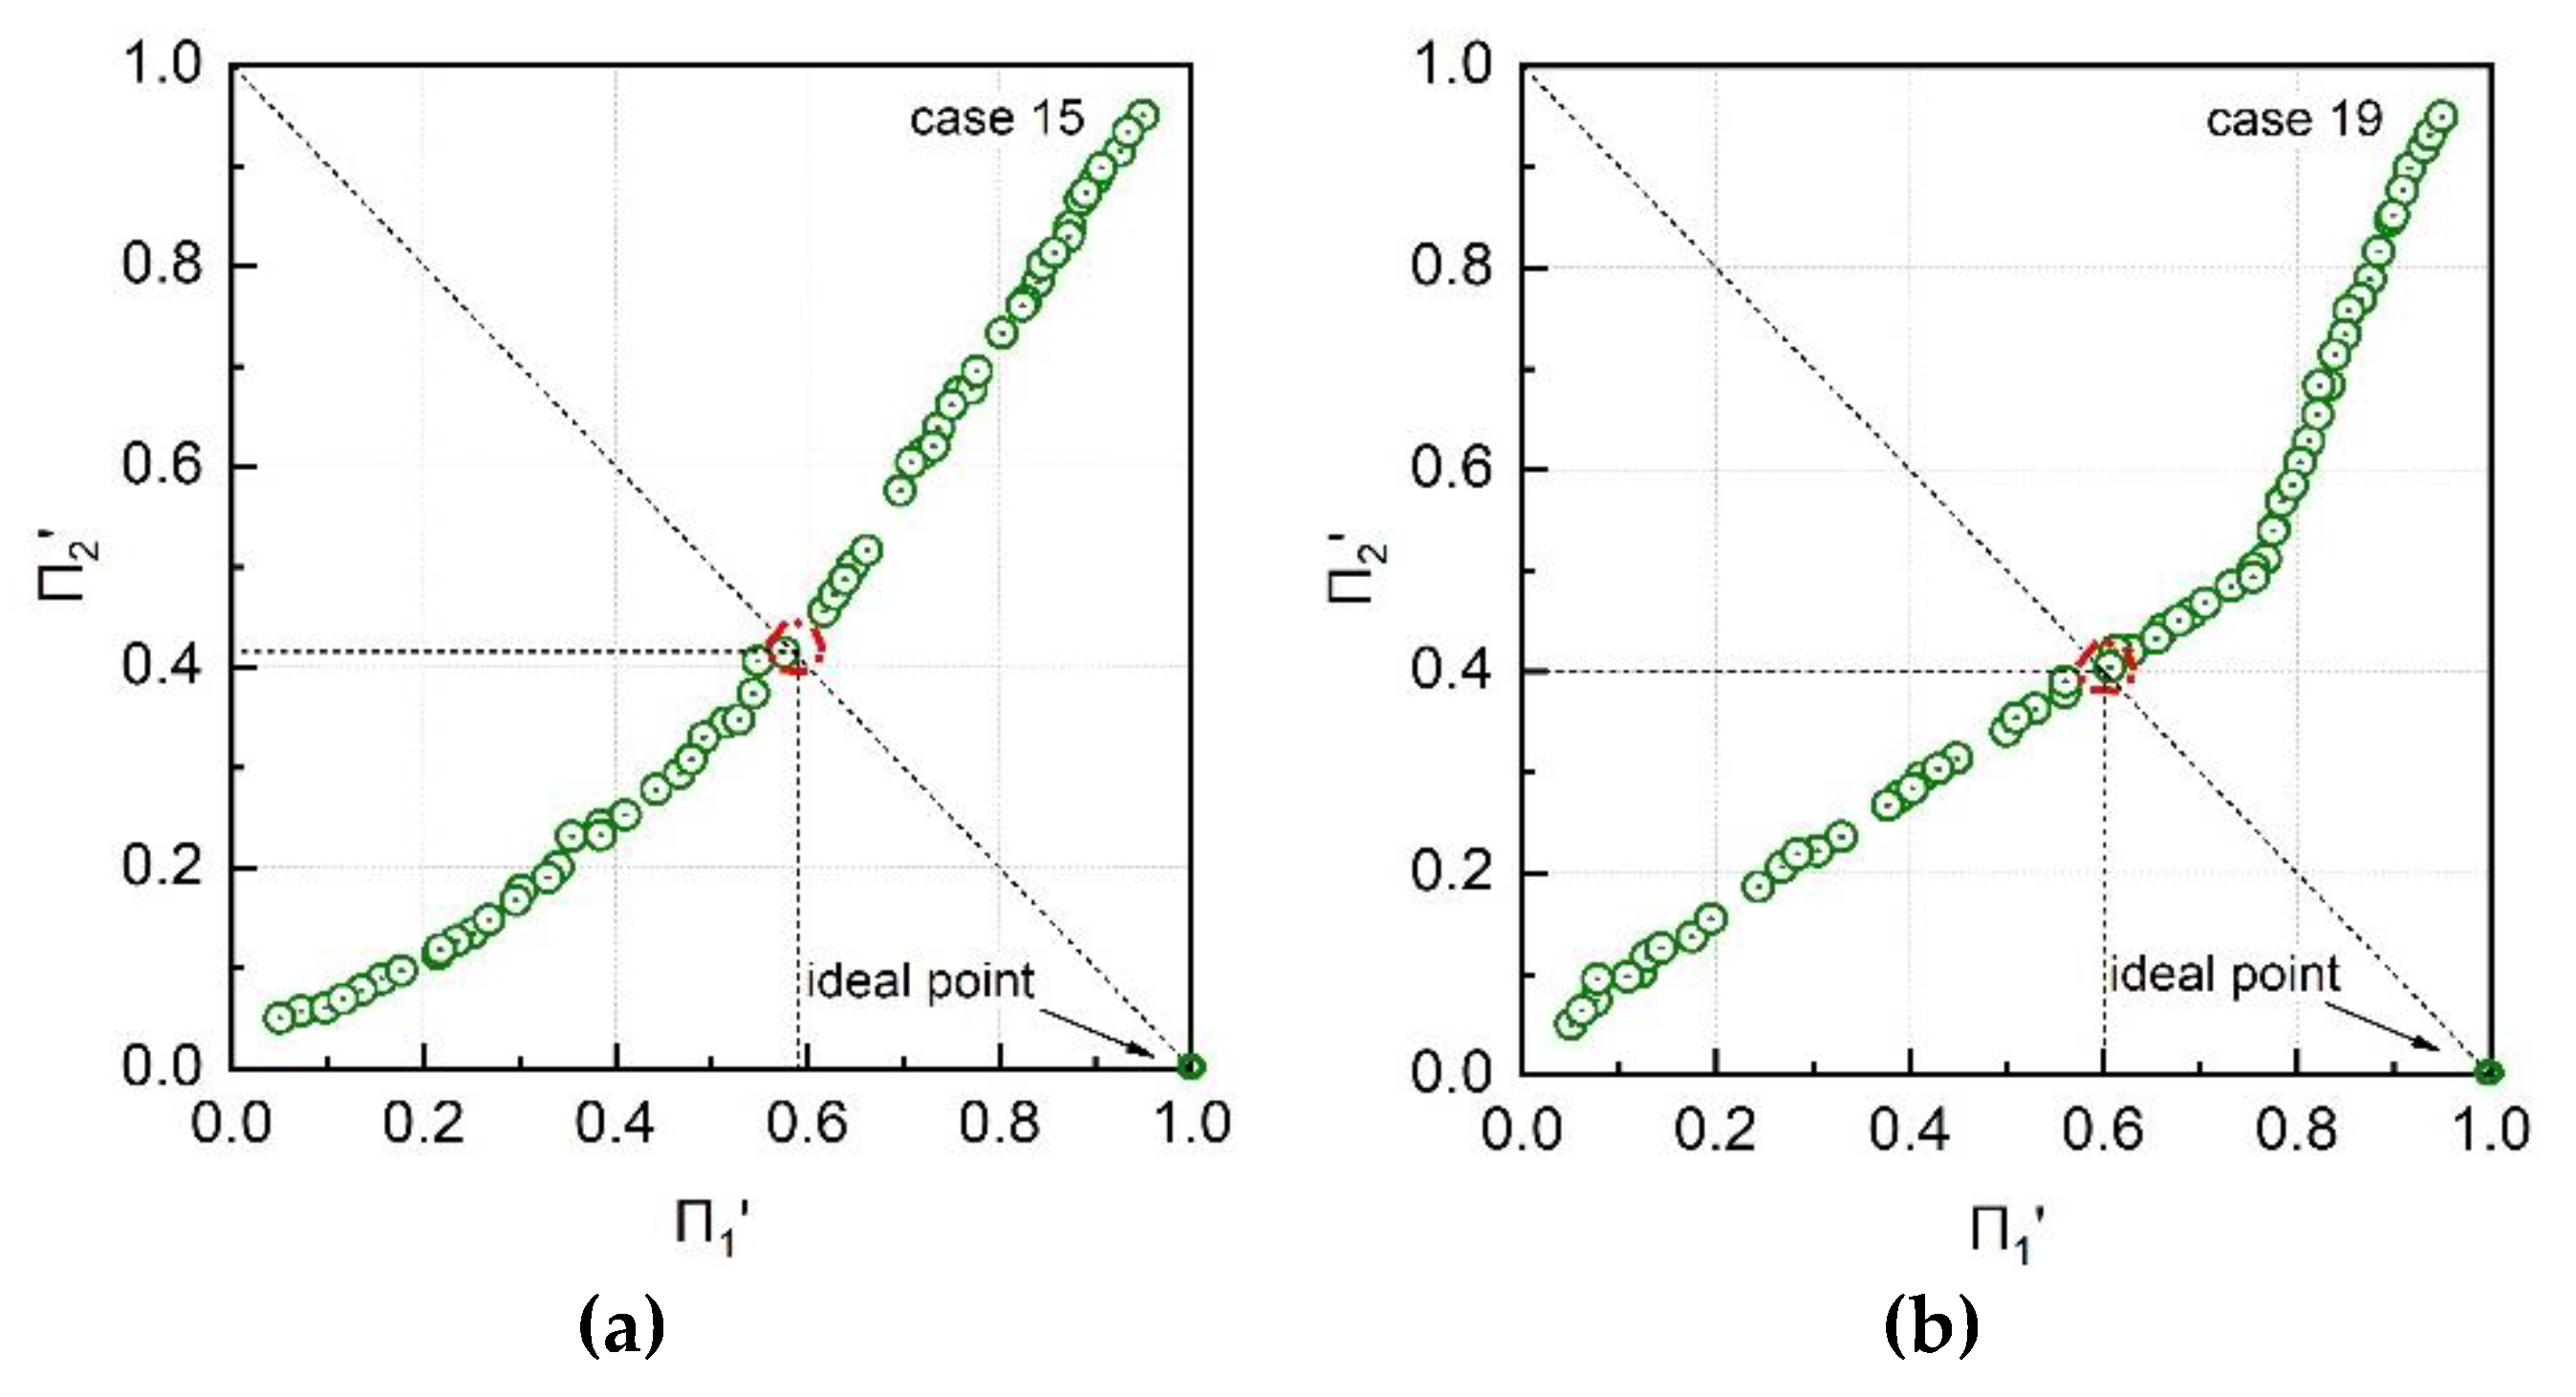
4.4. Multi-Objective Optimization Results

Based on the two selected WF combinations of different evaporation pressures and condensation pressures, the combined ORC system is optimized under the fixed heat source and cold source. The objective function Π1 regarding energy and exergy utilization should be maximized while the objective function Π2 regarding cost and payback period should be minimized. The Pareto front and the optimal results of the two normalized objective functions calculated by NSGA-II iteration are demonstrated in Figure 12. The Pareto optimization results illustrate the conflict between the two objective functions. After Π1 reaches a certain value, Π2 increases sharply. In this paper, the most favorable point in the Pareto front was defined as the minimum normalized distance to the ideal point, i.e., the end of the x-axis. Thus, optimized working conditions and results for three cases were respectively decided, which are listed in Table 12. Although case 19 has a lower investment, the payback period is longer than that in case 15. Moreover, case 19 does not have any advantages either in output power or in thermal indicators. With the optimized working conditions, Π1 is 4.74% and 2.26% for case 15 and case 19, respectively. Π2 for case 15 and case 19 is 2.55 × 10⁵ $/year and 1.67 × 10⁵ $/year, respectively.
In order to have a further understanding of the combined ORC system, the exergy destruction and cost of each component are analyzed under the optimized working conditions. The chart of the exergy destruction of each component in the combined ORC system is illustrated in Figure 13. In all cases, the exergy destruction mainly occurs in the heat exchangers. The exergy destruction in CON1 accounts for the largest part (up to 40%) of system exergy destruction. The reason is given to the large temperature difference between LNG evaporation temperature and WF1 condensation temperature. Limited by the required pressure of DF marine engine, the corresponding temperature of LNG is −134.6 °C. The optimized condensation temperature of the selected WF1 for case 15 and case 19 is −103.8 °C and −88.6 °C, respectively. Therefore, future work could be carried out in the optimization of CON1. The second place of exergy destruction goes to EVA1. Therefore, it proves true that the study of pressure variation in EVA1. The exergy destruction in EVA1 for case 19 is larger than that for case 15, which is mainly caused by the larger LMTD as shown in Table 10. Comparing Figure 13a,b, we can draw the conclusion that the matching degree in EVA1 for case 15 (R1150 and R600a) is more reasonable than that for case 19 (R170 and R152a). Compared to case 19, the exergy destruction in EVA1 for case 15 could be reduced up to 18.99%. In addition, the exergy destructions in pumps are relatively small.
The cost of each component cost and its ratio to the system total cost are demonstrated in Figure 14. Under different cases, the proportion of component cost is different. The costive components are generally expanders. For example, the cost of expanders in case 15 account for more than 50% of the system total cost. Meanwhile, the cost of expanders reflects the contribution of different ORC stages to the system net output work. The output work is sorted as ORC 3, ORC 1 and ORC 2 for both cases. The cost of heat exchangers basically depends on the area of heat exchanger. EVA3 and EVA2 is the most costive heat exchanger for case 15 and case 19, respectively. The reason could be attributed to its large heat transfer area caused by small LMTD between working fluid and heat source. Similarly, the proportion of CON2 cost could be explained as well. Based on the optimized working conditions, the proportion of EVA1 cost is small, which is 3.9% and 4.08% for case 15 and case 19, respectively. The cost of all pumps accounts for 4.90% and 6.06% for case 15 and case 19, respectively.

5. Conclusions

In this paper, a combined ORC system was proposed for cascade utilization of waste heat from dual fuel marine engine and cold energy from LNG. The waste heat from engine exhaust gas and jacket cooling water worked as dual heat sources. First, the applicability of 11 working fluids for the combined ORC system was studied. Afterwards, the performances of the ORC system with two selected working fluid combinations were analyzed from the perspective of thermo-economic. In particular, the effects of condensation pressure and evaporation pressure on the ORC system performance were investigated. Finally, a multi-objective optimization was conducted to decide the best working condition. Exergy destructions and costs of each component were presented with the optimized working conditions. The main conclusions drawn from this study can be summarized as following:
(1) A mathematical model for ORC system simulation was established. The results of the literature and the present paper were compared and analyzed, which verified the feasibility of the proposed model. The top 2 working fluid combinations for the ORC system were selected as R1150-R1234yf-R600a (with Π1 equals 6.68%) and R170-R1270-R152a (with Π2 equals 2.66 × 10⁵ $/year) based on the basic working conditions.
(2) The effects of the condensation pressure (pCON) and evaporation pressure (pEVA) in the intermediate heat exchanger on the ORC performances were investigated. The increase in pEVA resulted in a decrease of energy utilization objective function Π1, while the increase in pCON contributed to a higher Π1. Meanwhile, the variation trend of economic objective function Π2 with pEVA and pCON demonstrated the same trend as that of Π1.
(3) A multi-objective optimization model was taken into account to decide the most suitable pCON and pEVA for two selected working fluid combinations. The optimized operating pressures for the two cases were 796.87/112.21 kPa and 204.79/214 kPa, respectively. With the optimized working conditions, the energy efficiency was in the range of 11.59–16.32% and the exergy efficiency was in the range of 19.47–29.06%. The total cost of the ORC system with different working fluid combinations varied in the range of 1.58 × 10⁶~1.96 × 10⁶ $ and the payback period varies in the range of 7.68–9.43 years.
(4) Exergy destruction mainly occurred in heat exchangers. Searching for working fluid combination could reduce the exergy destruction in the intermediate heat exchanger (EVA1). The results indicated that the fluids matching degree in case 15 (R1150-R600a) were more reasonable, which generated 18.99% reduction in exergy destruction compared to case 19 (R170-R152a). In addition, the EVA1 investment cost in case 15 and case 19 accounted for 3.89% and 4.08% of the system cost, respectively. However, the cost of expanders could exceed 50% of the system cost. Therefore, the total investment cost could be reduced by optimizing expanders.

Author Contributions

Conceptualization, Z.T. and Y.Y.; methodology, Z.T., Y.Y. and Y.Z.; software, Y.Y.; validation, Z.T.; resources, W.G. and B.G.; writing—original draft preparation, Y.Y.; writing—review and editing, Z.T.; supervision, W.G. and B.G.; project administration, Z.T.; funding acquisition, Z.T., W.G. and B.G. All authors have read and agreed to the published version of the manuscript.

Funding

This research was funded by the National Natural Science Foundation of China, grant number 51706129; Postdoctoral Science Foundation of China, grant number 2019M650084; “Chenguang Program”, grant number 17CG50; and Shanghai Science and Technology Commission, grant number 18040501800.

Conflicts of Interest

The authors declare no conflict of interest.

References

  1. Ait Allal, A.; Mansouri, K.; Youssfi, M.; Qbadou, M. Toward an evaluation of marine fuels for a clean and efficient autonomous ship propulsion energy. Mater. Today Proc. 2019, 13, 486–495. [Google Scholar] [CrossRef]
  2. IMO Prevention of Air Pollution from Ships-Revised MARPOL Annex VI. Available online: http://www.imo.org/en/OurWork/Environment/PollutionPrevention/AirPollution/Pages/Air-Pollution.aspx (accessed on 5 February 2020).
  3. George, D.G.; Eleftherios, K.D.; Chariklia, G.A. LNG carrier two-stroke propulsion systems: A comparative study of state of the art reliquefaction technologies. Energy 2020, 195, 116997. [Google Scholar] [CrossRef]
  4. Lee, H.-J.; Yoo, S.-H.; Huh, S.-Y. Economic benefits of introducing LNG-fuelled ships for imported flour in South Korea. Transp. Res. D Transp. Environ. 2020, 78, 102220. [Google Scholar] [CrossRef]
  5. Chu Van, T.; Ramirez, J.; Rainey, T.; Ristovski, Z.; Brown, R.J. Global impacts of recent IMO regulations on marine fuel oil refining processes and ship emissions. Transp. Res. D Transp. Environ. 2019, 70, 123–134. [Google Scholar] [CrossRef]
  6. Fu, J.; Liu, J.; Yang, Y.; Ren, C.; Zhu, G. A new approach for exhaust energy recovery of internal combustion engine: Steam turbocharging. Appl. Therm. Eng. 2013, 52, 150–159. [Google Scholar] [CrossRef]
  7. Kyriakidis, F.; Sørensen, K.; Singh, S.; Condra, T. Modeling and optimization of integrated exhaust gas recirculation and multi-stage waste heat recovery in marine engines. Energy Convers. Manag. 2017, 151, 286–295. [Google Scholar] [CrossRef]
  8. Mito, M.T.; Teamah, M.A.; El-Maghlany, W.M.; Shehata, A.I. Utilizing the scavenge air cooling in improving the performance of marine diesel engine waste heat recovery systems. Energy 2018, 142, 264–276. [Google Scholar] [CrossRef]
  9. Yuan, H.; Zhang, J.; Huang, X.; Mei, N. Experimental investigation on binary ammonia–water and ternary ammonia–water–lithium bromide mixture-based absorption refrigeration systems for fishing ships. Energy Convers. Manag. 2018, 166, 13–22. [Google Scholar] [CrossRef]
  10. Feng, Y.; Du, Z.; Shreka, M.; Zhu, Y.; Zhou, S.; Zhang, W. Thermodynamic analysis and performance optimization of the supercritical carbon dioxide Brayton cycle combined with the Kalina cycle for waste heat recovery from a marine low-speed diesel engine. Energy Convers. Manag. 2020, 206, 112483. [Google Scholar] [CrossRef]
  11. Mondejar, M.; Andreasen, J.; Pierobon, L.; Larsen, U.; Thern, M.; Haglind, F. A review of the use of organic Rankine cycle power systems for maritime applications. Renew. Sustain. Energy Rev. 2018, 91, 126–151. [Google Scholar] [CrossRef]
  12. Ouyang, T.; Su, Z.; Gao, B.; Pan, M.; Chen, N.; Huang, H. Design and modeling of marine diesel engine multistage waste heat recovery system integrated with flue-gas desulfurization. Energy Convers. Manag. 2019, 196, 1353–1368. [Google Scholar] [CrossRef]
  13. Lion, S.; Vlaskos, I.; Taccani, R. A review of emissions reduction technologies for low and medium speed marine Diesel engines and their potential for waste heat recovery. Energy Convers. Manag. 2020, 207, 112553. [Google Scholar] [CrossRef]
  14. Saloux, E.; Sorin, M.; Nesreddine, H.; Teyssedou, A. Reconstruction procedure of the thermodynamic cycle of organic Rankine cycles (ORC) and selection of the most appropriate working fluid. Appl. Therm. Eng. 2018, 129, 628–635. [Google Scholar] [CrossRef]
  15. Oyewunmi, O.A.; Kirmse, C.J.W.; Pantaleo, A.M.; Markides, C.N. Performance of working-fluid mixtures in ORC-CHP systems for different heat-demand segments and heat-recovery temperature levels. Energy Convers. Manag. 2017, 148, 1508–1524. [Google Scholar] [CrossRef]
  16. Zhang, Y.; Deng, S.; Zhao, L.; Lin, S.; Ni, J.; Ma, M.; Xu, W. Optimization and multi-time scale modeling of pilot solar driven polygeneration system based on organic Rankine cycle. Appl. Energy 2018, 222, 396–409. [Google Scholar] [CrossRef]
  17. Walraven, D.; Laenen, B.; D’Haeseleer, W. Economic system optimization of air-cooled organic Rankine cycles powered by low-temperature geothermal heat sources. Energy 2015, 80, 104–113. [Google Scholar] [CrossRef] [Green Version]
  18. Roumpedakis, T.C.; Christou, T.; Monokrousou, E.; Braimakis, K.; Karellas, S. Integrated ORC-Adsorption cycle: A first and second law analysis of potential configurations. Energy 2019, 179, 46–58. [Google Scholar] [CrossRef]
  19. Liu, P.; Shu, G.; Tian, H. How to approach optimal practical Organic Rankine cycle (OP-ORC) by configuration modification for diesel engine waste heat recovery. Energy 2019, 174, 543–552. [Google Scholar] [CrossRef]
  20. Heberle, F.; Brüggemann, D. Thermo-Economic Analysis of Zeotropic Mixtures and Pure Working Fluids in Organic Rankine Cycles for Waste Heat Recovery. Energies 2016, 9, 226. [Google Scholar] [CrossRef]
  21. Han, Z.; Li, P.; Han, X.; Mei, Z.; Wang, Z. Thermo-Economic Performance Analysis of a Regenerative Superheating Organic Rankine Cycle for Waste Heat Recovery. Energies 2017, 10, 1593. [Google Scholar] [CrossRef] [Green Version]
  22. Uusitalo, A.; Honkatukia, J.; Turunen-Saaresti, T.; Grönman, A. Thermodynamic evaluation on the effect of working fluid type and fluids critical properties on design and performance of Organic Rankine Cycles. J. Clean. Prod. 2018, 188, 253–263. [Google Scholar] [CrossRef]
  23. Valencia, G.; Fontalvo, A.; Cárdenas, Y.; Duarte, J.; Isaza, C. Energy and Exergy Analysis of Different Exhaust Waste Heat Recovery Systems for Natural Gas Engine Based on ORC. Energies 2019, 12, 2378. [Google Scholar] [CrossRef] [Green Version]
  24. Zhang, X.; Zhang, Y.; Cao, M.; Wang, J.; Wu, Y.; Ma, C. Working Fluid Selection for Organic Rankine Cycle Using Single-Screw Expander. Energies 2019, 12, 3197. [Google Scholar] [CrossRef] [Green Version]
  25. Ge, Z.; Li, J.; Liu, Q.; Duan, Y.; Yang, Z. Thermodynamic analysis of dual-loop organic Rankine cycle using zeotropic mixtures for internal combustion engine waste heat recovery. Energy Convers. Manag. 2018, 166, 201–214. [Google Scholar] [CrossRef]
  26. Chys, M.; van den Broek, M.; Vanslambrouck, B.; De Paepe, M. Potential of zeotropic mixtures as working fluids in organic Rankine cycles. Energy 2012, 44, 623–632. [Google Scholar] [CrossRef]
  27. Lecompte, S.; Ameel, B.; Ziviani, D.; van den Broek, M.; De Paepe, M. Exergy analysis of zeotropic mixtures as working fluids in Organic Rankine Cycles. Energy Convers. Manag. 2014, 85, 727–739. [Google Scholar] [CrossRef]
  28. Oyewunmi, O.A.; Markides, C.N. Thermo-Economic and Heat Transfer Optimization of Working-Fluid Mixtures in a Low-Temperature Organic Rankine Cycle System. Energies 2016, 9, 448. [Google Scholar] [CrossRef] [Green Version]
  29. Su, W.; Hwang, Y.; Deng, S.; Zhao, L.; Zhao, D. Thermodynamic performance comparison of Organic Rankine Cycle between zeotropic mixtures and pure fluids under open heat source. Energy Convers. Manag. 2018, 165, 720–737. [Google Scholar] [CrossRef]
  30. Rao, W.-J.; Zhao, L.-J.; Liu, C.; Zhang, M.-G. A combined cycle utilizing LNG and low-temperature solar energy. Appl. Therm. Eng. 2013, 60, 51–60. [Google Scholar] [CrossRef]
  31. He, S.; Chang, H.; Zhang, X.; Shu, S.; Duan, C. Working fluid selection for an Organic Rankine Cycle utilizing high and low temperature energy of an LNG engine. Appl. Therm. Eng. 2015, 90, 579–589. [Google Scholar] [CrossRef]
  32. Yu, H.; Kim, D.; Gundersen, T. A study of working fluids for Organic Rankine Cycles (ORCs) operating across and below ambient temperature to utilize Liquefied Natural Gas (LNG) cold energy. Energy 2019, 167, 730–739. [Google Scholar] [CrossRef]
  33. Han, F.; Wang, Z.; Ji, Y.; Li, W.; Sundén, B. Energy analysis and multi-objective optimization of waste heat and cold energy recovery process in LNG-fueled vessels based on a triple organic Rankine cycle. Energy Convers. Manag. 2019, 195, 561–572. [Google Scholar] [CrossRef]
  34. Öhman, H.; Lundqvist, P. Comparison and analysis of performance using Low Temperature Power Cycles. Appl. Therm. Eng. 2013, 52, 160–169. [Google Scholar] [CrossRef]
  35. Choi, B.C.; Kim, Y.M. Thermodynamic analysis of a dual-loop heat recovery system with trilateral cycle applied to exhaust gases of internal combustion engine for propulsion of the 6800 TEU container ship. Energy 2013, 58, 404–416. [Google Scholar] [CrossRef]
  36. Yang, M.-H.; Yeh, R.-H. Analyzing the optimization of an organic Rankine cycle system for recovering waste heat from a large marine engine containing a cooling water system. Energy Convers. Manag. 2014, 88, 999–1010. [Google Scholar] [CrossRef]
  37. Baldi, F.; Larsen, U.; Gabrielii, C. Comparison of different procedures for the optimisation of a combined Diesel engine and organic Rankine cycle system based on ship operational profile. Ocean Eng. 2015, 110, 85–93. [Google Scholar] [CrossRef] [Green Version]
  38. Song, J.; Song, Y.; Gu, C.-W. Thermodynamic analysis and performance optimization of an Organic Rankine Cycle (ORC) waste heat recovery system for marine diesel engines. Energy 2015, 82, 976–985. [Google Scholar] [CrossRef]
  39. Yun, E.; Park, H.; Yoon, S.Y.; Kim, K.C. Dual parallel organic Rankine cycle (ORC) system for high efficiency waste heat recovery in marine application. J. Mech. Sci. Technol. 2015, 29, 2509–2515. [Google Scholar] [CrossRef]
  40. Valencia Ochoa, G.; Acevedo Peñaloza, C.; Duarte Forero, J. Thermoeconomic Optimization with PSO Algorithm of Waste Heat Recovery Systems Based on Organic Rankine Cycle System for a Natural Gas Engine. Energies 2019, 12, 4165. [Google Scholar] [CrossRef] [Green Version]
  41. Valencia Ochoa, G.; Piero Rojas, J.; Duarte Forero, J. Advance Exergo-Economic Analysis of a Waste Heat Recovery System Using ORC for a Bottoming Natural Gas Engine. Energies 2020, 13, 267. [Google Scholar] [CrossRef] [Green Version]
  42. Yang, M.-H. Optimizations of the waste heat recovery system for a large marine diesel engine based on transcritical Rankine cycle. Energy 2016, 113, 1109–1124. [Google Scholar] [CrossRef]
  43. Lecompte, S.; Lemmens, S.; Huisseune, H.; Van den Broek, M.; De Paepe, M. Multi-Objective Thermo-Economic Optimization Strategy for ORCs Applied to Subcritical and Transcritical Cycles for Waste Heat Recovery. Energies 2015, 8, 2714–2741. [Google Scholar] [CrossRef] [Green Version]
  44. Grljušić, M.; Medica, V.; Račić, N. Thermodynamic Analysis of a Ship Power Plant Operating with Waste Heat Recovery through Combined Heat and Power Production. Energies 2014, 7, 7368–7394. [Google Scholar] [CrossRef] [Green Version]
  45. Sung, T.; Kim, K.C. Thermodynamic analysis of a novel dual-loop organic Rankine cycle for engine waste heat and LNG cold. Appl. Therm. Eng. 2016, 100, 1031–1041. [Google Scholar] [CrossRef]
  46. Habibi, H.; Zoghi, M.; Chitsaz, A.; Javaherdeh, K.; Ayazpour, M. Thermo-economic analysis and optimization of combined PERC—ORC—LNG power system for diesel engine waste heat recovery. Energy Convers. Manag. 2018, 173, 613–625. [Google Scholar] [CrossRef]
  47. Le, S.; Lee, J.-Y.; Chen, C.-L. Waste cold energy recovery from liquefied natural gas (LNG) regasification including pressure and thermal energy. Energy 2018, 152, 770–787. [Google Scholar] [CrossRef]
  48. Koo, J.; Oh, S.-R.; Choi, Y.-U.; Jung, J.-H.; Park, K. Optimization of an Organic Rankine Cycle System for an LNG-Powered Ship. Energies 2019, 12, 1933. [Google Scholar] [CrossRef] [Green Version]
  49. Yang, K.; Zhang, H.; Song, S.; Yang, F.; Liu, H.; Zhao, G.; Zhang, J.; Yao, B. Effects of Degree of Superheat on the Running Performance of an Organic Rankine Cycle (ORC) Waste Heat Recovery System for Diesel Engines under Various Operating Conditions. Energies 2014, 7, 2123–2145. [Google Scholar] [CrossRef] [Green Version]
  50. Wärtsilä 50DF. Available online: https://www.wartsila.com/marine/build/engines-and-generating-sets (accessed on 1 February 2020).
  51. Lemmon, E.W.; Huber, M.L.; Mclinden, M.O. NIST Standard Reference Database 23: Reference Fluid Thermodynamic and Transport Properties-REFPROP, Version 9.1. Gaithersburg Natl. Inst. Stand. Technol. 2010, 20, 2010. [Google Scholar]
  52. Györke, G.; Deiters, U.K.; Groniewsky, A.; Lassu, I.; Imre, A.R. Novel classification of pure working fluids for Organic Rankine Cycle. Energy 2018, 145, 288–300. [Google Scholar] [CrossRef]
  53. Javanshir, A.; Sarunac, N.; Razzaghpanah, Z. Thermodynamic analysis of a regenerative organic Rankine cycle using dry fluids. Appl. Therm. Eng. 2017, 123, 852–864. [Google Scholar] [CrossRef]
  54. Li, T.; Meng, N.; Liu, J.; Zhu, J.; Kong, X. Thermodynamic and economic evaluation of the organic Rankine cycle (ORC) and two-stage series organic Rankine cycle (TSORC) for flue gas heat recovery. Energy Convers. Manag. 2019, 183, 816–829. [Google Scholar] [CrossRef]
  55. Zitzler, E.; Deb, K.; Thiele, L.J.E.C. Comparison of Multiobjective Evolutionary Algorithms: Empirical Results. Evol. Comput. 2000, 8, 173–195. [Google Scholar] [CrossRef] [Green Version]
  56. Sadatsakkak, S.A.; Ahmadi, M.H.; Ahmadi, M.A. Thermodynamic and thermo-economic analysis and optimization of an irreversible regenerative closed Brayton cycle. Energy Convers. Manag. 2015, 94, 124–129. [Google Scholar] [CrossRef]
  57. Li, Y.; Liao, S.; Liu, G. Thermo-economic multi-objective optimization for a solar-dish Brayton system using NSGA-II and decision making. Int. J. Electr. Power Energy Syst. 2015, 64, 167–175. [Google Scholar] [CrossRef]
  58. Sun, Z.; Lai, J.; Wang, S.; Wang, T. Thermodynamic optimization and comparative study of different ORC configurations utilizing the exergies of LNG and low grade heat of different temperatures. Energy 2018, 147, 688–700. [Google Scholar] [CrossRef]
  59. Yang, M.-H. Payback period investigation of the organic Rankine cycle with mixed working fluids to recover waste heat from the exhaust gas of a large marine diesel engine. Energy Convers. Manag. 2018, 162, 189–202. [Google Scholar] [CrossRef]
Figure 1. Schematic diagram of the combined ORC system based on LNG cold energy and DF marine engine waste heat recovery.
Energies 13 01397 g001
Figure 2. The combined ORC system in t-s diagram.
Energies 13 01397 g002
Figure 3. Working temperature range of different working fluids.
Energies 13 01397 g003
Figure 4. Working process of multi-objective optimization using NSGA-II.
Energies 13 01397 g004
Figure 5. Flow chart of the ORC system model solving algorithm.
Energies 13 01397 g005
Figure 6. ORC system performance with 36 WF combinations (a) thermal criteria; (b) economic criteria.
Energies 13 01397 g006
Figure 7. Wnet and Ctot with variation of pressures. (a) Wnet for case 15; (b) Wnet for case 19; (c) Ctot for case 15; (d) Ctot for case 19.
Energies 13 01397 g007aEnergies 13 01397 g007b
Figure 8. ηen and ηex with variation of pressures. (a) ηen for case 15; (b) ηen for case 19; (c) ηex for case 15; (d) ηex for case 19.
Energies 13 01397 g008
Figure 9. PBP with variation of pressures. (a) case 15; (b) case 19.
Energies 13 01397 g009
Figure 10. LMTD and CEVA1 with variation of pressures. (a) variation with pCON for case 15; (b) variation with pCON for case 19; (c) variation with pEVA for case 15; (d) variation with pEVA for case 19.
Energies 13 01397 g010
Figure 11. The variation of Π1 and Π2 under different pCON and pEVA. (a) Π1 for case 15; (b) Π1 for case 19; (c) Π2 for case 15; (d) Π2 for case 19.
Energies 13 01397 g011
Figure 12. The optimal results with different WF combinations. (a) case 15; (b) case 19.
Energies 13 01397 g012
Figure 13. Exergy destruction in each component under optimal conditions. (a) case 15; (b) case 19.
Energies 13 01397 g013aEnergies 13 01397 g013b
Figure 14. Cost of each component under optimal conditions. (a) case 15; (b) case 19.
Energies 13 01397 g014
Table 1. Summary of ORC system based on LNG cold energy and waste heat recovery.
ResearchHeat Source
(Inlet Temperature)
ORC
Configuration
Working Fluid Optimization Algorithm
He et al. [31]LNG-fired vehicle engine exhaust gas (336.9 °C)Combined ORC with dual heat source5 pure fluids-
Yu et al. [32]Seawater (20 °C)/Waste heat (-)Combined ORC with precooler and preheater22 pure fluidsParticle Swarm Optimization (PSO) algorithm
Han et al. [33]Seawater (20 °C)
/Main engine exhaust gas (270°C)/Jacket cooling water (90 °C)
Triple ORC15 pure fluidsSelf-adaptive firefly algorithm (SAFA)
Sung and Kim [45]Main engine exhaust gas (230 °C)/Jacket cooling water (91 °C)Dual-loop ORC13 pure fluids-
Habibi et al. [46]Main engine exhaust gas (300 °C)/Jacket cooling water (90 °C)Combined ORC6 pure fluidsNon-dominated Sorting Genetic Algorithm -
II (NSGA-II)
Koo et al. [48]Jacket cooling water (80 °C)Six different ORCs6 pure fluidsParticle Swarm Optimization (PSO) algorithm
Table 2. Primary parameters of the Wärtsilä 50DF marine engine Reproduced from product brochure [50], the name of the publisher: Wärtsilä.
ParameterValue
Power (kW)11700
Cylinder Bore × Stroke (mm)500 × 580
Cylinder Configuration12 in V-form
Normal Speed (rpm)514
Table 3. Boundary conditions for the combined ORC system.
SideParameterValue
EnvironmentAmbient temperature (°C)25
Ambient pressure (kPa)100
LNG storage temperature (°C)−163
Cold SourceLNG storage pressure (kPa)101
LNG pressure at DF marine engine inlet (kPa)600
LNG temperature at DF marine engine inlet (°C)20
LNG mass flow rate (kg/s)0.61 (100% load)
Heat SourceEngine exhaust gas inlet temperature (°C)150
Engine exhaust gas outlet temperature (°C)100
Jacket cooling water inlet temperature (°C)95
Jacket cooling water outlet temperature (°C)78
Table 4. Boundary conditions for the combined ORC system.
Working Fluid Chemical Formulattri (°C)pcri (kPa)TypeODPGWPSafety Group
R1150CH2CH2−169.165042Wet020A3
R170CH3CH3−182.784872Wet020A3
R1270CH2CHCH3−185.24555Wet01.8A3
R290CH3CH2CH3−187.634251Wet05A3
R1234yfCF3CFCH2−53.153382Isotropic0<1A2L
R152aCHF2CH3−118.594517Wet0138A2
R1234ze(E)CHFCHCF3−104.533636Isotropic0<1A1
R600aCH(CH3)3−159.423629Dry020A3
R600CH3(CH2)2CH3−138.253796Dry04A3
R601a(CH3)2CHCH2CH3−160.53378Dry020A3
R601CH3(CH2)3CH3−129.683370Dry020A3
Table 5. Specifications and constraints in the combined ORC model.
No. Specifications and Constraints
1Condensation pressures in CON1, CON2 and CON3 are set at the ambient pressure
2Evaporation pressures in EVA1, EVA2 and EVA3 are set at the highest point, which is constrained by the pinch point temperature difference or critical pressure
3The subcooling of WFs at the inlet of pump is stipulated at 5 °C to prevent cavitation
4The wet WFs are superheated with 10 °C while the isotropic and dry WFs are saturated vapor at the inlet of expander
5The pinch point in the heat exchangers is varied in the range of 5–40 °C
6The isentropic efficiencies of expander and pump are 80%
7All operating pressure should be 200 kPa lower than the critical pressure to ensure stability
Table 6. Component calculation model in the system.
ComponentEnergy Analysis ModelExergy Analysis Model
P0 W P 0 = m LNG ( h 2 h 1 ) Δ E x P 0 = ( E x 1 + W P 0 ) E x 2
CON1 Q CON 1 = m LNG ( h 3 h 2 ) = m WF 1 ( h 5 h 6 ) Δ E x CON 1 = ( E x 2 + E x 5 ) ( E x 3 + E x 6 )
EXP1 W EXP 1 = m WF 1 ( h 8 h 5 ) Δ E x EXP 1 = E x 8 E x 5 W 1
EVA1/CON3 Q EVA 1 = m WF 1 ( h 8 h 7 ) = m WF 3 ( h 15 h 16 ) Δ E x EVA 1 = ( E x 7 + E x 15 ) ( E x 8 + E x 16 )
P1 W P 1 = m WF 1 ( h 7 h 6 ) Δ E x P 1 = ( E x 6 + W P 1 ) E x 7
CON2 Q CON 2 = m WF 2 ( h 9 h 10 ) = m LNG ( h 4 h 3 ) Δ E x CON 2 = ( E x 9 + E x 3 ) ( E x 4 + E x 10 )
EXP2 W EXP 2 = m WF 2 ( h 12 h 9 ) Δ E x EXP 2 = E x 12 E x 9 W 2
EVA2 Q EVA 2 = m WF 2 ( h 12 h 11 ) = m JCW ( h 13 h 14 ) Δ E x EVA 2 = ( E x 11 + E x 13 ) ( E x 12 + E x 14 )
P2 W P 2 = m WF 2 ( h 11 h 10 ) Δ E x P 2 = ( E x 10 + W P 2 ) E x 11
EXP3 W EXP 3 = m WF 3 ( h 18 h 15 ) Δ E x EXP 3 = E x 18 E x 15 W 3
EVA3 Q EVA 3 = m WF 3 ( h 18 h 17 ) = m EEG ( h 19 h 20 ) Δ E x EVA 3 = ( E x 17 + E x 19 ) ( E x 18 + E x 20 )
P3 W P 3 = m WF 3 ( h 17 h 16 ) Δ E x P 3 = ( E x 16 + W P 3 ) E x 17
Table 7. Economic analysis model of components in ORC system.
ComponentsEconomic Analysis Model
Condenser lg C b C O N = K 1 + K 2 lg ( A C O N ) + K 3 [ lg ( A C O N ) ] 2
lg F p C O N = C 1 + C 2 lg ( p C O N ) + C 3 [ lg ( p C O N ) ] 2
C C O N = C b C O N ( B 1 + B 2 F m F p C O N )
Evaporator lg C b E V A = K 1 + K 2 lg ( A E V A ) + K 3 [ lg ( A E V A ) ] 2
lg F p E V A = C 1 + C 2 lg ( p E V A ) + C 3 [ lg ( p E V A ) ] 2
C E V A = C b E V A ( B 1 + B 2 F m F p E V A )
Pump lg C b P = K 1 + K 2 lg ( W P ) + K 3 [ lg ( W P ) ] 2
lg F p P = C 1 + C 2 lg ( W P ) + C 3 [ lg ( W P ) ] 2
C P = C b P ( B 1 + B 2 F m F p P )
Expander lg C b E X P = K 1 + K 2 lg ( W E X P ) + K 3 [ lg ( W E X P ) ] 2
C E X P = C b C O N F b m
Table 8. Coefficients for economic analysis model.
ComponentsK1K2K3C1C2C3B1B2FmFbm
Condenser4.325−0.3030.1630.039−0.1130.0821.631.661.4-
Evaporator4.325−0.3030.1630.039−0.1130.0821.631.661.44.325
Pump3.3890.0530.153−0.3940.396−0.0021.891.351.60
Expander2.7051.440−0.178000013.43.5
Table 9. Values of optimization parameters.
ParameterValue
Population Size200
Crossover Probability0.8
Mutation Functionconstraint dependent
Selection Processtournament
Generationsinf
Stall Generations100
Table 10. Comparison and verification of the simulation model.
ItemsRef. [58]This StudyRef. [58]This StudyRef. [59]This Study
Heat SourceWaste Heat
(100 to 60.8 °C)
JCW
(98 to 75 °C)
Waste Heat
(200 to 58.2 °C)
EEG
(150 to 100 °C)
EEG
(160 to -)
EEG
(160 to 107.9 °C)
Cold SourceLNGLNGLNGLNGWaterWater
Working FluidsR170/NH3R170/NH3R170/NH3R170/NH3R600R600
pLNG (kPa)3000300030003000101.3101.3
tEVA (°C)62.38/−38.3373.78/−38.33130.93/−38.33130.93/−38.339898.93
tCON (°C)−33.33/−88.58−33.33/−88.58−33.33/−88.58−33.33/−88.583034.29
mLNG (kg/s)1111--
Wnet (kW)244.24218.63320.83249.29925989.2
Exhs,in (kW)167.85165.57231.62322.75--
ExLNG,in (kW)1085.081085.081085.081085.08--
ηex (%)19.49%17.48%24.37%17.71%--
Ctot (×106$)----2.953.21
PBP (year)----6.26.03
Table 11. The results of possible WF combinations under initial conditions.
Case No.WF CombinationΠ1 (%)Π2 (105 $/Year)
1R1150-R1270-R152a5.942.93
2R1150-R1270-R1234ze(E)5.912.94
3R1150-R1270-R600a6.393.08
4R1150-R1270-R6006.493.12
5R1150-R1270-R601a5.382.80
6R1150-R1270-R6015.032.70
7R1150-R290-R152a6.022.95
8R1150-R290-R1234ze(E)6.002.96
9R1150-R290-R600a6.433.09
10R1150-R290-R6006.443.10
11R1150-R290-R601a5.462.83
12R1150-R290-R6015.112.72
13R1150-R1234yf-R152a5.962.93
14R1150-R1234yf-R1234ze(E)5.922.94
15R1150-R1234yf-R600a6.683.12
16R1150-R1234yf-R6006.513.12
17R1150-R1234yf-R601a5.392.81
18R1150-R1234yf-R6015.042.70
19R170-R1270-R152a5.022.66
20R170-R1270-R1234ze(E)5.102.71
21R170-R1270-R600a5.562.86
22R170-R1270-R6005.862.96
23R170-R1270-R601a5.262.80
24R170-R1270-R6015.022.73
25R170-R290-R152a5.092.69
26R170-R290-R1234ze(E)5.172.73
27R170-R290-R600a5.632.88
28R170-R290-R6005.932.98
29R170-R290-R601a5.332.82
30R170-R290-R6015.092.75
31R170-R1234yf-R152a5.02.67
32R170-R1234yf-R1234ze(E)5.102.71
33R170-R1234yf-R600a5.572.86
34R170-R1234yf-R6005.862.96
35R170-R1234yf-R601a5.262.80
36R170-R1234yf-R6015.032.73
Table 12. Optimal solutions for the combined ORC system.
ParametersCase 15Case 19
pCON (kPa)796.87204.79
pEVA (kPa)112.21214
LMTD in EVA1 (°C)44.369.1
Wnet (kW)236.4154.99
ηen (%)16.3211.59
ηex (%)29.0619.47
Ctot (×106$)1.961.58
PBP (year)7.689.43

