Article

Model-Based Adaptive Joint Estimation of the State of Charge and Capacity for Lithium–Ion Batteries in Their Entire Lifespan

1
Faculty of Transportation Engineering, Kunming University of Science and Technology, Kunming 650500, China
2
School of Engineering and Materials Science, Queen Mary University of London, London E1 4NS, UK
3
State Key Laboratory of Mechanical Transmissions & School of Automotive Engineering, Chongqing University, Chongqing 400044, China
*
Authors to whom correspondence should be addressed.
Energies 2020, 13(6), 1410; https://doi.org/10.3390/en13061410
Submission received: 31 January 2020 / Revised: 1 March 2020 / Accepted: 13 March 2020 / Published: 18 March 2020
(This article belongs to the Special Issue Energy Storage Systems for Electric Vehicles)

Abstract

:
In this paper, a co-estimation scheme of the state of charge (SOC) and available capacity is proposed for lithium–ion batteries based on the adaptive model-based algorithm. A three-dimensional response surface (TDRS) in terms of the open circuit voltage, the SOC and the available capacity in the scope of whole lifespan, is constructed to describe the capacity attenuation, and the battery available capacity is identified by a genetic algorithm (GA), together with the parameters related to SOC. The square root cubature Kalman filter (SRCKF) is employed to estimate the SOC with the consideration of capacity degradation. The experimental results demonstrate the effectiveness and feasibility of the co-estimation scheme.

Graphical Abstract

1. Introduction

Nowadays, energy crises and environmental damage have become the main concerns of society, and require being tackled with high attention [1]. Transportation electrification provides a possible manner to reduce emissions and dependence upon fossil fuels. Electric vehicles (EVs) and hybrid EVs (HEVs) are promising solutions, which however, require electrical energy storage systems to completely or partially replace propelling power supplied by traditional internal combustion engines [2]. In this context, applications of lithium–ion batteries have been intensively spurred due to their numerous advantages, such as their wide environmental temperature operation capability, high energy density, long lifespan and their large charge/discharge current [3]. For lithium–ion batteries, the state of charge (SOC) and available capacity, usually provided by battery management systems (BMSs), are crucial parameters for evaluation of the electrical performance of the battery, as well as for the control of the vehicle.
Typically, estimation methods of the SOC can be divided into four categories, including the coulomb counting method, and characterization parameter-based methods such as the open circuit voltage (OCV) method, model-based methods and data-driven methods. Amongst them, the coulomb counting method [4] and OCV method [5] have been widely applied in BMSs of EVs, because of their simplicity and ease of implementation, whereas the former is prone to the production of large accumulated errors, due to interferences or uncertainties of current sensors/transducers and inaccurate initial values, and the latter is not suitable for online estimation, as it usually costs long shelving time to acquire the OCV value. With the development of computation technologies and machine learning, a variety of artificial intelligence-based, data-driven methods, such as neural networks [6] and support vector machines [7], are proposed for SOC estimation by establishing black-box models. Data-driven methods feature a strong nonlinear mapping capability with high accuracy; however, these approaches show high complexity, and require a considerable amount of training data. Alternatively, model-based methods have been widely investigated and applied for SOC estimation, thanks to the capabilities of online application, high precision and the independence of initial values. Conventional modeling manners mainly include electrochemical models and the equivalent circuit models (ECMs). Compared with complicated electrochemical models, ECM is commonly used to describe the electrical behavior of batteries, and subsequently to estimate the SOC due to its simplification and preferable precision. Yanwen Li et al. proposed a multi-model probability fusion algorithm to describe the battery’s electrical characteristics, and subsequently estimate the SOC [8]. In model-based methods, the combination of the battery model and the intelligent filtering algorithm is a hotspot in SOC estimation research. The frequently used filtering algorithms include Kalman filtering (KF) [9], the H-infinity filter (HIF) [10], particle filter (PF) [11], and their various extensions. In particular, the extended KF (EKF) is widely employed to execute SOC estimation using a first-order Taylor expansion on the basis of the battery’s nonlinear model [12]. Nonetheless, the second and higher order expansion is usually neglected, thus leading to slow a convergence rate, and even divergence. The unscented KF (UKF) is exploited to estimate battery SOC, based on the recursive unscented transformation to approximate the nonlinear observation without Taylor polynomial expansions [13]. The UKF shows better estimation precision and robustness than the EKF in strong, nonlinear systems [14]. On the basis of the radial–spherical cubature criterion, the cubature Kalman filter (CKF) leverages a set of volume points to approximate the mean and covariance of states with additional Gaussian noise [15]. Although CKF outperforms EKF and UKF in terms of filtering divergence and estimation error, it is susceptible to inaccurate, initial difference and disturbances, and is difficult to guarantee a symmetric and nonnegative definition of the covariance matrix all the time. HIF is applied in state estimation and model parameters identification of batteries, due to its good, anti-interference performance in high nonlinear systems [16]. PF exhibits attractive advantages in solving nonlinear, non-Gaussian distribution problems, and highlights more application potential than EKF. Thus, it has been widely developed and applied in multifarious fields, such as batteries, robotics and navigation systems [17]; however, it is limited by strong dependence upon noise and time-varying parameters of the system.
In addition, battery aging is an irreversible process with operation, where the most intuitive appearance is a decline of capacity and the increase of internal impedance [18]. In general, the attenuation process is nonlinear, complex, and even difficult to predict. To attain it, a body of algorithms have been successfully proposed and applied to achieve capacity estimation, mainly including experimental analysis methods and model-based methods. The most direct and easiest manner of evaluating the capacity is to conduct the calibration test [19]. However, it is obviously time-consuming, and only supports offline estimation. Additionally, the battery’s impedance variation also highlights the capacity degradation trend [20]. However, the online electrochemical impedance measurement is not suitable for practical applications, due to its exceptional complexity of experiment. Motivated by these difficulties and constraints, incremental capacity analysis (ICA) is introduced to conduct capacity estimation by evaluating the increment of capacity in a certain charging interval [21]. Similar algorithms also include differential voltage analysis (DVA), with the help of analyzing the variation characteristics of voltage curves in predetermined charge/discharge operations [22]. Yes, they can reflect the aging mechanism of batteries, and highlight preferable accuracy; nonetheless, they are intractable to apply in practice, as chances of encountering the interval with predetermined current are seldom. Since it is time-consuming to measure and determine the battery capacity directly; model-based estimation approaches may supply an indirect manner to evaluate it. The model-based methods can leverage adaptive algorithms (such as joint estimation approaches [23] and fuzzy logic algorithms [24]) to identify the battery capacity.
These algorithms are easy to be implemented, and meanwhile demonstrate preferable accuracy; whereas, in the model-based approaches, the battery capacity is regarded as a key parameter or state variable, and is obtained by parameter identification, or estimated together with the SOC, with an established circuit model or electrochemical model. From this point of view, the model accuracy can directly affect the estimation accuracy of our battery capacity.
The above-mentioned state estimation methods are mostly developed for either SOC or capacity estimation individually, rather than for both simultaneously. SOC refers to the residual capacity rate over nominal values, while SOH represents the nominal capacity value with operations. To a certain extent, battery capacity shows the same significance as SOC, and essentially, they are tightly coupled with each other [25]. Apparently, SOC estimation based on the known and unchanged capacity exhibits certain limitations in practice. A common knowledge is that the internal parameters of batteries change with degradation. The internal resistance will increase, and the capacity decreases gradually, thus resulting in the challenges and difficulties of estimating the SOC reliably and robustly. Consequently, it is critical to update the model parameters, particularly the capacity, in a timely manner. Motivated by this, a joint estimation scheme is proposed in this study to improve the estimation accuracy of the SOC and capacity in the entire lifespan of the battery. Firstly, a second-order resistance–capacitance (RC)-based ECM is established, and the co-estimation scheme of SOC and the battery capacity is presented. In it, the square root cubature Kalman filter (SRCKF) algorithm is employed to estimate the SOC; meanwhile, the battery capacity, as one of the key model parameters, is identified by the genetic algorithm (GA), based on the constructed three-dimensional response surface (TDRS). Finally, the estimation results of the SOC and battery capacity are verified by different experimental validations over their entire lifespans. This study dedicates to the following two contributions: 1) A novel capacity estimation method based on a TDRS is proposed, and the model parameters are updated synchronously; and 2) based on the capacity and parameters revision, a co-estimation scheme is established for the SOC and capacity estimation simultaneously against different degradation statuses.
In the remainder of this study, Section 2 details the second-order RC model and the experiment test profiles. In Section 3, the co-estimation scheme of both capacity and SOC is elaborated. The validation results are exhibited and discussed in Section 4. Finally, Section 5 draws the main conclusions and looks to future works.

2. The Lithium–Ion Battery Model and the Experimental Details

2.1. Battery Modeling and Analysis

To better estimate battery states, various mathematical models have been established, including electrochemical models [26] and ECMs [27]. However, they differ greatly in accuracy, computation complexity and reliability. Considering the precision and complexity of models, a second-order RC-based ECM, as shown in Figure 1, is deployed in this work, thanks to its relatively satisfactory precision and acceptable computation intensity [28]. As can be seen, it contains two parallel RC networks connected in series topology to characterize the battery polarization. Based on Figure 1, the circuit equation can be built, as:
U ˙ s = U s R s C s + I C s
U ˙ l = U l R l C l + I C l
U t = U o c v U s U l R e I
where R l and C l indicate the internal resistance and capacitance of electrochemical polarization, while R s and C s denote the internal resistance and capacitance of the concentration polarization.
U s and U l denote the voltage drop across R s C s and R l C l , respectively; U t indicates the terminal voltage; I is the loading current; U o c v stands for the open circuit voltage; and R e represents the internal ohmic resistance. In addition, the SOC denotes the ratio of available remaining capacity over the rated capacity (the maximum available capacity), as:
S O C ( t ) = S O C ( t 0 ) t 0 t η c I ( t ) d t Q N
where S O C ( t ) indicates the SOC value at t, respectively; S O C ( t 0 ) stands for the SOC value at t 0 ; Q N is the rated capacity of battery; and η c represents the columbic efficiency.

2.2. Experiments

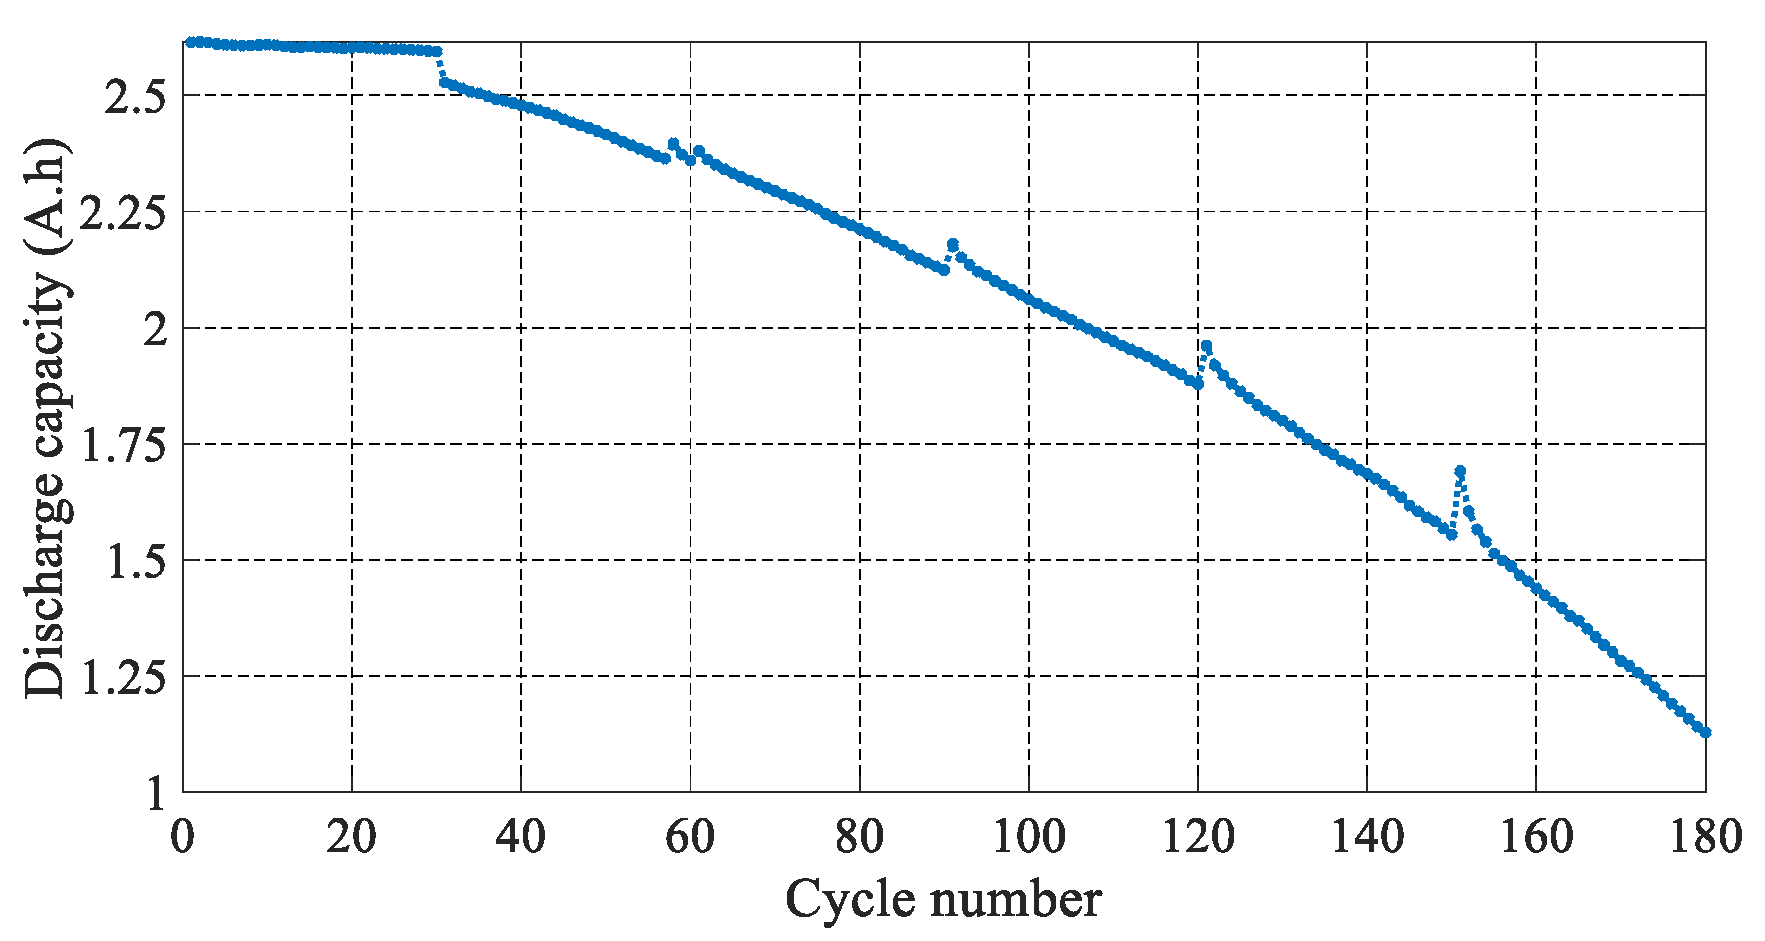
The basic specifications of the battery are illustrated in Table 1. The battery’s nominal voltage is 3.6 V, and the nominal capacity is 2.55 Ampere hour (Ah). To characterize the battery’s electrical performance, some prerequisite experiments are conducted, including an accelerated aging test, performance test, and dynamic test. The accelerated cycle life aging test is carried out at 25 °C, which is divided into seven stages. They are separated by the cycles 0, 30, 60, 90, 120, 150 and 180 (defined as cyc0, cyc30, cyc60, cyc90, cyc120, cyc150 and cyc180 hereinafter). The battery cell is charged by means of the constant current-constant voltage (CCCV) scheme with the current rate of 1 C, and discharged by means of constant current (CC), with the current rate of 2 C in each cycle. Here, C denotes the rated capacity value of the battery with the unit of Ah. The performance tests, including the capacity test and hybrid pulse power characterization (HPPC) test, are carried out periodically during the cycle life test. In addition, a typical dynamic test based on the urban dynamometer driving schedule (UDDS) is executed to verify the performance under dynamic operating conditions. Figure 2 shows the decay variation of the discharge capacity. It can be clearly observed that the discharge capacity basically remains unchanged from cyc0 to cyc30, and it tends to decline faster after 30 cycles, and the amount of electric energy decreases faster as the cycle number increases. After 180 cycles, the maximum discharge capacity decreases from the initial 2.614 Ah to 1.129 Ah, which remains only 44.3% of the nominal capacity. The discharge capacity decreases to 1.97 Ah at the fifth stage (cyc120), which is 77.25% of the nominal capacity. When the capacity drops to 80% of the rated value, the battery should be abandoned; and therefore, only the experimental results of the first five aging stages are applied to analyze and verify the performance of proposed algorithm in this work.
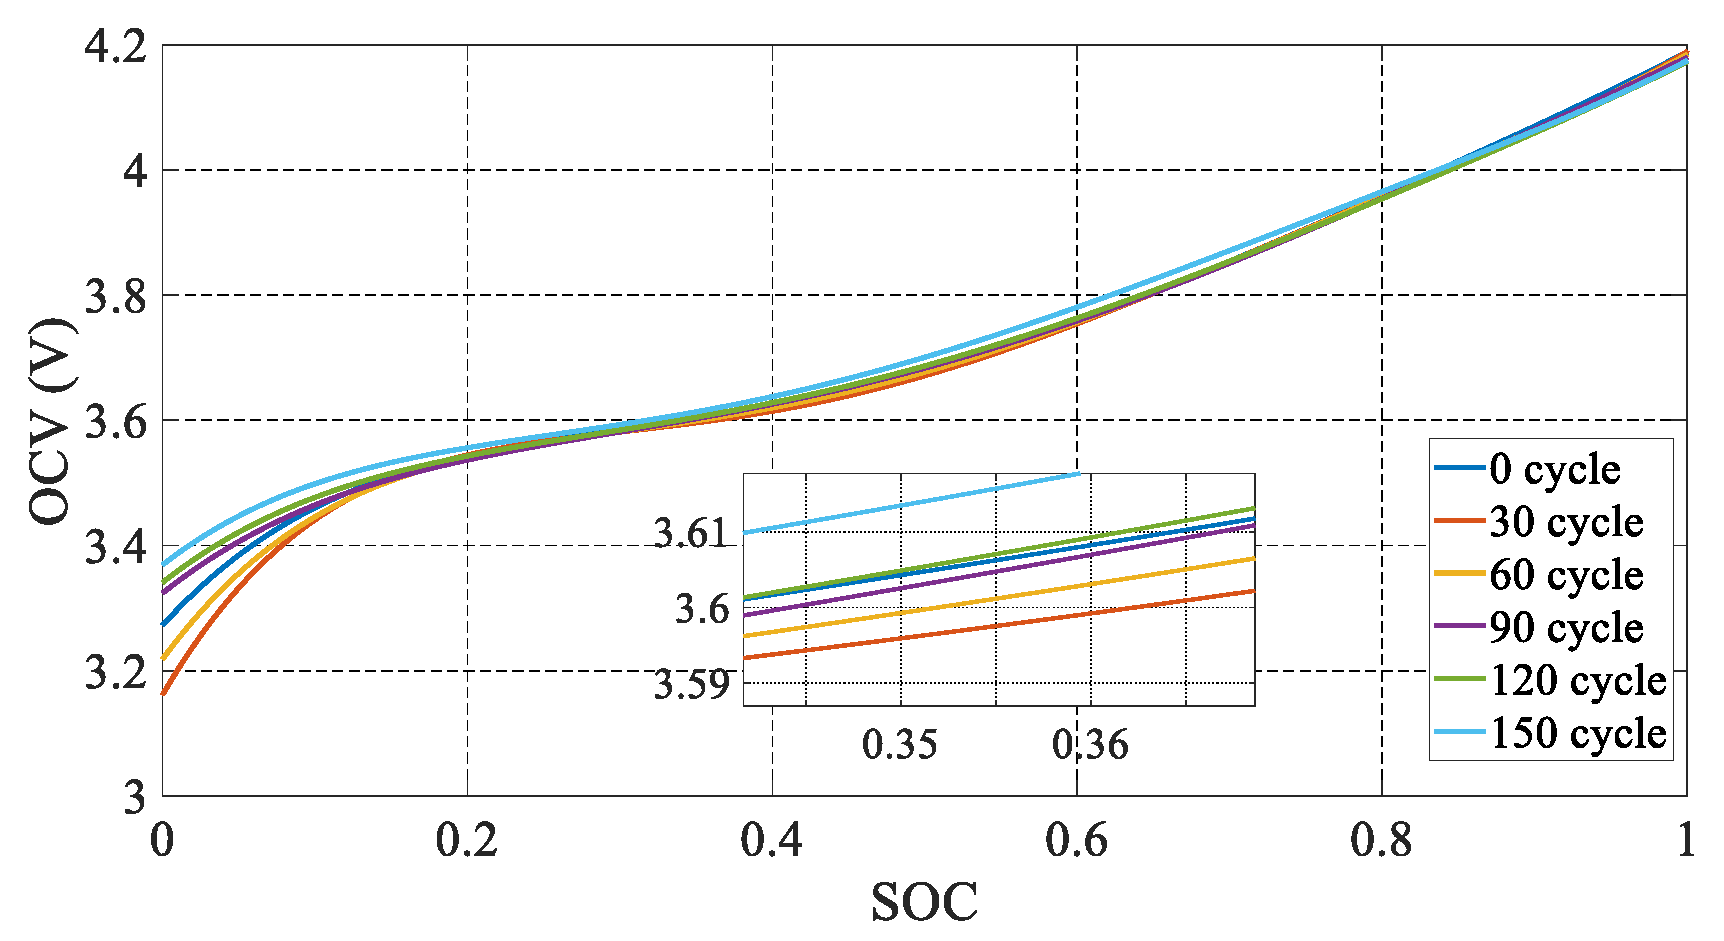
Furthermore, battery degradation not only features the capacity reduction, but also embodies the variation of the OCV-SOC relationship. The relationship curve between OCV and SOC at various aging status is presented in Figure 3. It is apparent that the OCV–SOC relationship curve changes gradually as the cycle number increases. When the SOC is more than 20%, the trend of the curves remains basically the same. However, when the SOC is less than 20%, especially under 10%, the OCV changes significantly. Generally, to protect and extend the battery life of EVs, the battery discharge cut-off SOC is usually set to 10% or 20%. When the SOC ranges from 20% to 60%, the OCV at different aging status differs obviously, and the maximum difference value is 20 mV. When the SOC is more than 60%, the OCV values at different aging statuses are relatively close, and the maximum difference is within 10 mV.

3. The Joint Estimation of SOC and Battery Capacity

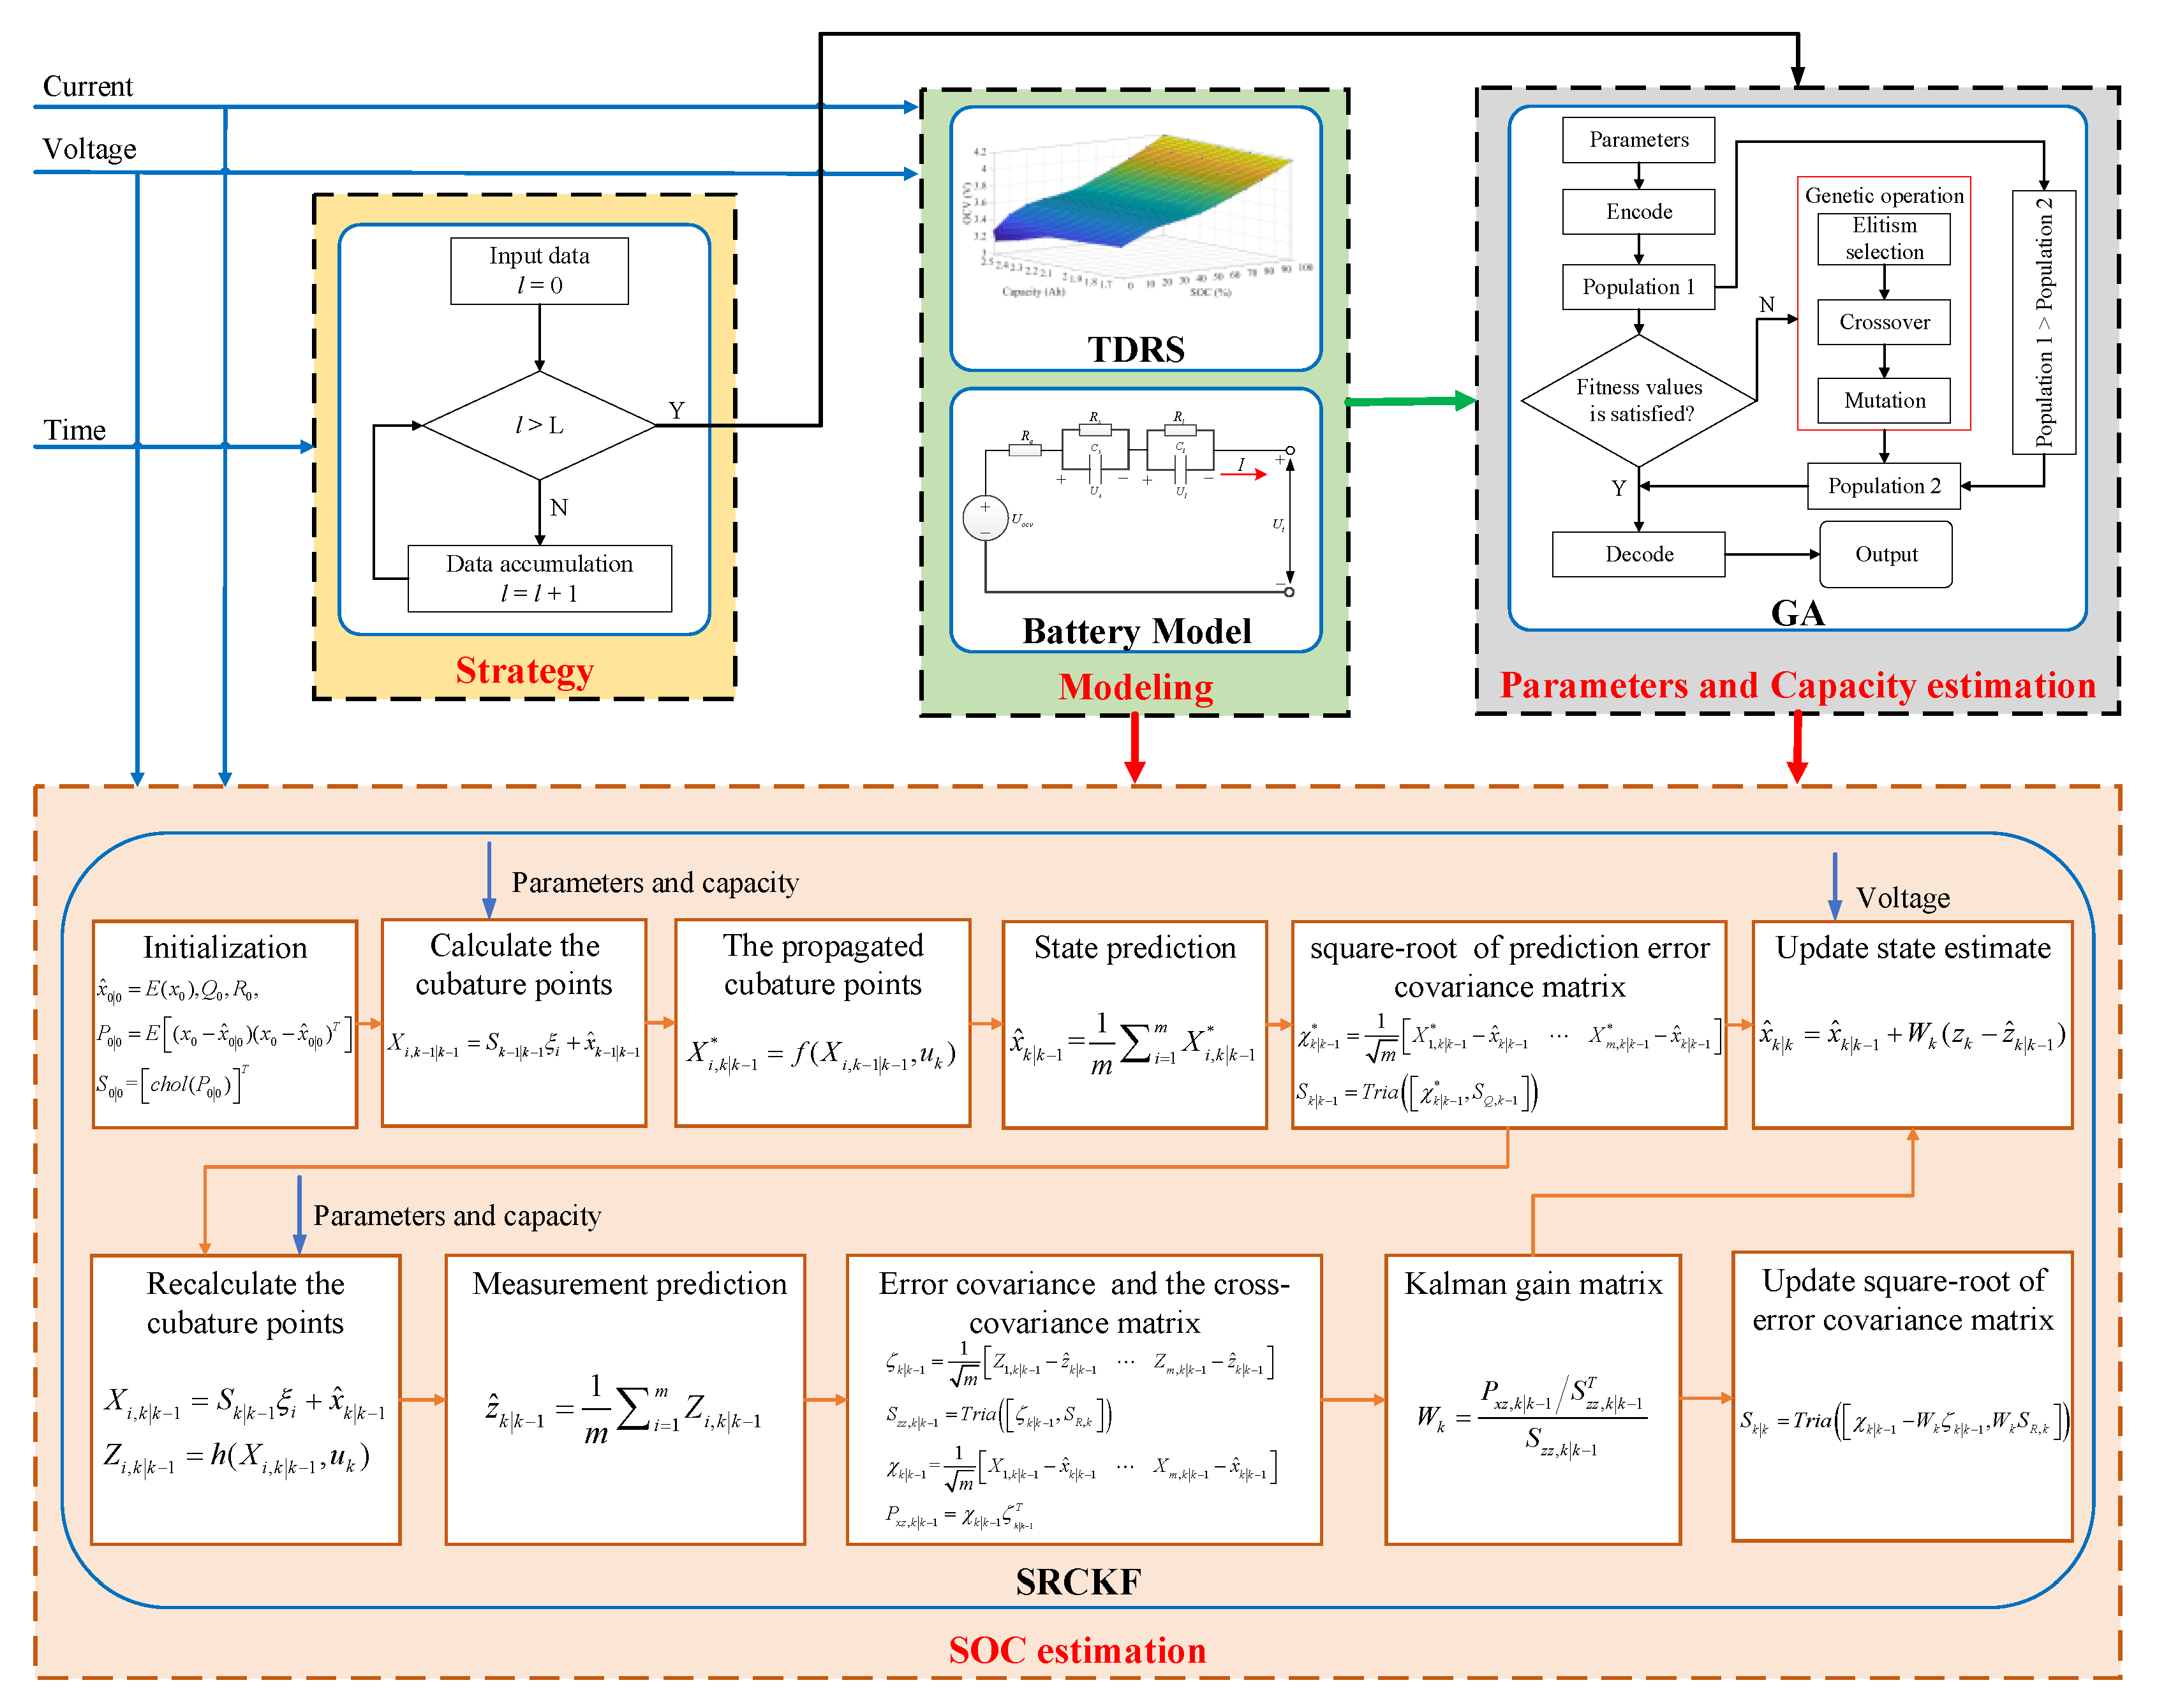
The framework of the joint capacity and SOC co-estimation is shown in Figure 4. It mainly includes four parts: the strategy module, the modeling module, the capacity and parameters estimation module, as well as the SOC estimation module. First, the strategy module starts to accumulate the experimental data until the length of data is more than the preset threshold. Then, the capacity estimation module employs the GA to conduct the parameter identification and capacity estimation, based on the acquired data and the established model. After finding the model parameters and capacity, the SOC estimation module is triggered to estimate the SOC based on the SRCKF. Note that the modeling and parameters estimation modules are not invoked every time. The detailed co-estimation procedure is elaborated in the following.

3.1. The Capacity Estimation Algorithm

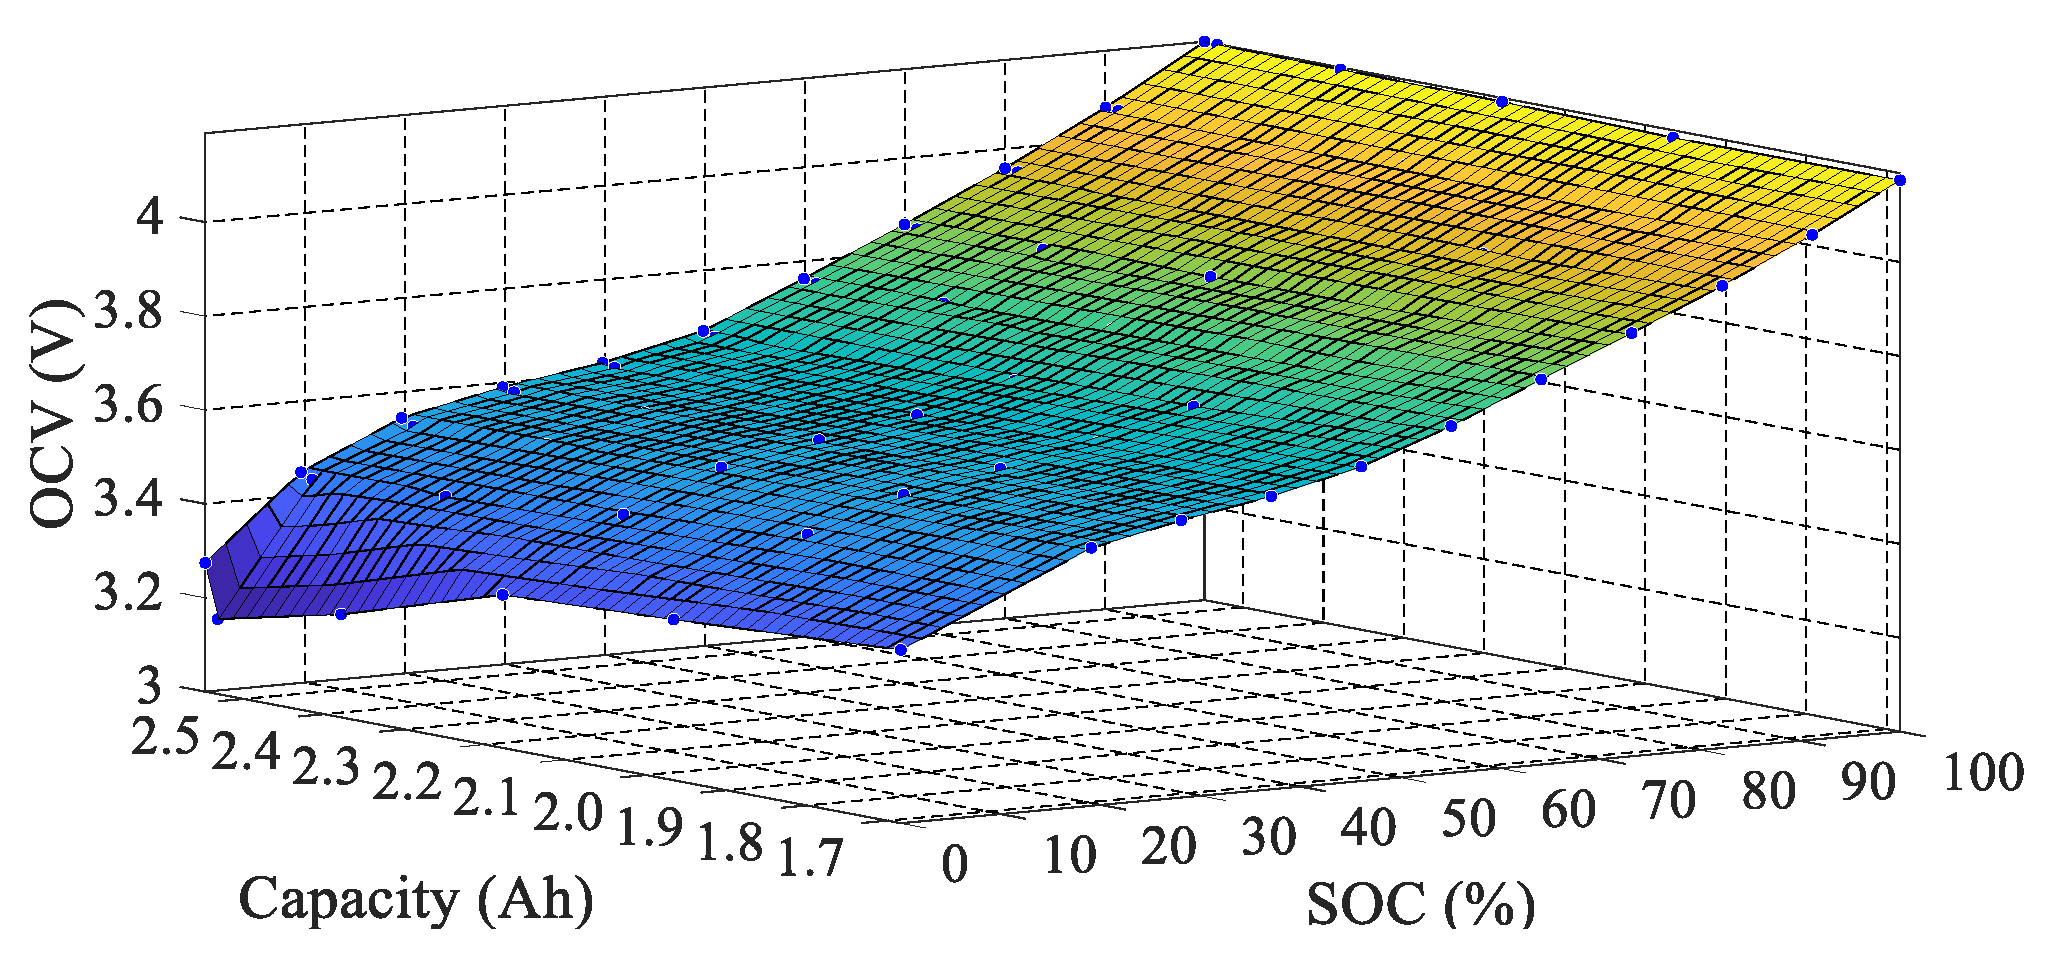
The battery capacity is deemed to be a significant parameter that needs to be identified. Firstly, based on the OCV–SOC curves illustrated in Figure 3, a TDRS with respect to the capacity, SOC and OCV, is constructed, as plotted in Figure 5. Next, the TDRS is imported into the established battery model. Finally, the usable battery capacity is incorporated into the battery model parameters, and is identified by the GA [29].
By this manner, the problem of usable battery capacity estimation can be transformed into the problem of searching the optimal OCV–SOC relationship match on the built TDRS by applying the optimization algorithm. It is worth noting that the ambient temperature plays an important influence on battery capacity. However, the temperature influence is not taken into account in this study, as the battery system onboard is generally equipped with a good thermal management system, thereby ensuring the temperature variation is within ±5 °C [30].
In consideration of accuracy and complexity, a fifth-order polynomial function is selected to describe the relationship among OCV, SOC and capacity, as:
U O C V ( S O C , C a , i ) = α 1 , i × S O C 5 + α 2 , i × S O C 4 + α 3 , i × S O C 3 + α 4 , i × S O C 2 + α 5 , i × S O C + α 6 , i
where C a , i represents the available battery capacity at the ith capacity point.
α j , i ( j = 1 , , 6 ) denotes the fitting coefficient of OCV and SOC at the ith capacity point, which is no longer a constant, and is herein defined as a quadratic function of C a , i , as:
α j , i = b 2 , i C a , i 2 + b 1 , i C a , i + b 0 , i
where b t , i ( t = 0 , 1 , 2 ) denotes the capacity coefficient. The above equation can be rewritten into a matrix form, as:
[ α 1 , i , α 2 , i , α 3 , i , α 4 , i , α 5 , i , α 6 , i ] T = Γ × [ C a , i 2 C a , i 1 ] T
where Γ refers to a 6 × 3 capacity coefficient matrix, which can be obtained by the polynomial fitting, and the results are described in Equation (8).
Γ = [ 14 . 2473 57.3965 61.0568 39.1366 155.6827 165.5359 38.9053 151.7664 161.0539 16.8787 63.8408 66.9571 3.0020 10.7412 11.42.84 0.1149 0.2951 3.2020 ]
Now, according to Equations (5)–(8), a nonlinear relationship can be built among OCV, capacity and SOC. Once the SOC is determined, it will be a deterministic mapping function between OCV and SOC. Together with Equations (1)–(3), the capacity identification can be conducted simultaneously with other parameters, including those of the RC networks. During the parameters identification, the variation of model parameters is eventually reflected by the difference between the estimation result and the terminal voltage. Based on the OCV model, the discrete mathematical expression of the second-order RC-based ECM can be reformulated as:
U t , k = U o c v , k ( S O C k , C a ) { exp ( Δ t / τ s ) U s , k + R s [ 1 exp ( Δ t / τ s ) ] I k } { exp ( Δ t / τ l ) U l , k + R l [ 1 exp ( Δ t / τ l ) ] I k } I k R e
where Δ t indicates the time interval, and both τ s = R s C s and τ l = R l C l belong to time constants. As can be seen from Equation (9), the TDRS based on the OCV model in Equation (5) is imported into the ECM. Hence, the difference of relationship between SOC and OCV at different capacity levels is eventually highlighted by the estimation results of the terminal voltage. In this manner, the battery capacity can be added into the model parameter series for identification. To attain it, the GA is employed to find the optimal combination of model parameters and capacity, in which the optimal parameter group to be identified can be expressed as:
θ o p t i m a l = [ R e , R s , R l , C s , C l , C a ]
During the identification process, the minimum root mean squared error (RMSE) of the terminal voltage is taken as the fitness function, as:
{ φ ( θ o p t i m a l ) = min | R M S E | R M S E = k N [ U t , k U ^ t , k ( θ o p t i m a l ) ] 2 N
where U t , k and U ^ t , k ( θ o p t i m a l ) represent the measured terminal voltage and the estimated terminal voltage at step k , respectively.
In addition, the constraints of optimization algorithm are subject to:
{ 20 % S O C 100 % 0.005   Ω R e , R s , R l 0.1   Ω 0.5   s τ s 1000   s 0.5   s τ l 1000   s
The setting of these constraints is explained as follows. In practical applications, to avoid the over-charge and over-discharge of the battery, the range of the SOC is generally set to 20% to 100% for guaranteeing proper operation and extending the service life of batteries [31]. The upper limits of internal ohmic resistance R e , internal resistance R l of electrochemical polarization and internal resistance R s of the concentration polarization are determined in terms of the specifications of batteries and the technical parameters supplied by the manufacturers. Their low limits are all determined to be 0.005 Ω, based on the parameter calculation of ECM introduced in [32], as well as the experimental analysis. Meanwhile, the range of C l and C s can be deduced to be 100 F to 104 F. In addition, τ l and τ s are time constants, where τ l = R l C l and τ s = R s C s . Hence, the range of τ l and τ s can be limited with 0.5 s to 1000 s. In summary, when the above-mentioned battery model parameters and capacity are identified, these parameters will be transmitted into the SOC estimation module. However, it is worth noting that the parameter identification based on the GA requires a certain amount of data to obtain an ideal identification result. Therefore, the capacity estimation method proposed in this paper only runs when the data length reaches a pre-set condition, and the determination of data length will be discussed in the next section.

3.2. The SOC Estimation Algorithm

After obtaining the model parameters and battery capacity, the SRCKF is proposed to attain the estimation of battery SOC with the cyclic recurrence based on the established second-order RC ECM. In comparison with the traditional cubature Kalman filter (CKF), the SRCKF can directly perform iterative update in the form of calculating the square-roots of the covariance matrices during the filtering process, which determines the non-negative definite value of the covariance matrix, and avoids the divergence of filter [33]. In general, a discrete nonlinear dynamic system with enhanced noise can be modeled, as:
{ x k + 1 = f ( x k , u k ) + w k z k = h ( x k , u k ) + v k
where x k R n and z k indicate the system state vector and the system output at time k , respectively. f ( ) and h ( ) denote the nonlinear system state function and nonlinear measurement function, respectively. w k stands for random process noise indicating uncertain input. v k denotes the observation noise, which is generally employed to simulate sensor noise affecting the output measurement. Additionally, the corresponding covariance of w k and v k are Q k and R k , respectively. Based on the established ECM, the time-discrete state equation and measurement equation can be respectively expressed, as:
[ U s , k + 1 U l , k + 1 S O C k + 1 ] = [ exp ( Δ t / τ s ) 0 0 0 exp ( Δ t / τ l ) 0 0 0 1 ] [ U s , k U l , k S O C k ] + [ R s ( 1 exp ( Δ t / τ s ) ) R l ( 1 exp ( Δ t / τ l ) ) η c Δ t / C a ] I k + [ w 1 , k w 2 , k w 3 , k ]
U t , k = U o c v , k ( S O C k , C a ) + [ 1 1 0 ] [ U s , k U l , k S O C k ] + [ R e ] I k + v k
where the system state variable x k = [ U s , k U l , k S O C k ] T , input variable u k = I k and system output z k = U t , k . In this study, The SRCKF algorithm is adopted to estimate the SOC, of which the general process is summarized in Table 2, where n is the state dimension, and m denotes the total number of volume points, which number is twice those of the state dimension. The sample [ 1 ] indicates a complete set of fully symmetric points, of which the set of points is obtained through the complete permutation of elements of the n-dimensional unit vector e = [ 1 , 0 0 ] T and the alteration of the element symbol. [ 1 ] g represents that the point is centered at the gth point of [ 1 ] . x ^ k and z ^ k are the predicted state and measurement, respectively. S Q , k 1 and S R , k denote the square-roots of the process noise covariance matrix Q k 1 and the measurement noise covariance matrix R k , respectively.

4. Verification and Discussion

4.1. Verification Study on Different Data Lengths

In this section, different data lengths are selected to investigate the effectiveness of the proposed co-estimation algorithm. Actually, the experimental data at different aging stages can be chosen to verify the SOC estimation of different data lengths. Nonetheless, based on the estimated capacity, the estimation error of battery capacity is maximum at cyc30. Hence, to better verify the performance of the proposed estimation algorithm, the battery after being cycled 30 times is chosen as the test target, and the current schedules acquired based on the UDDS experiment are repetitively operated until the terminal voltage reaches the cut-off voltage designated by the manufacturer. Note that when the data length is less than the pre-set threshold value, the SOC module still uses the previously identified capacity and parameters to conduct the estimation.
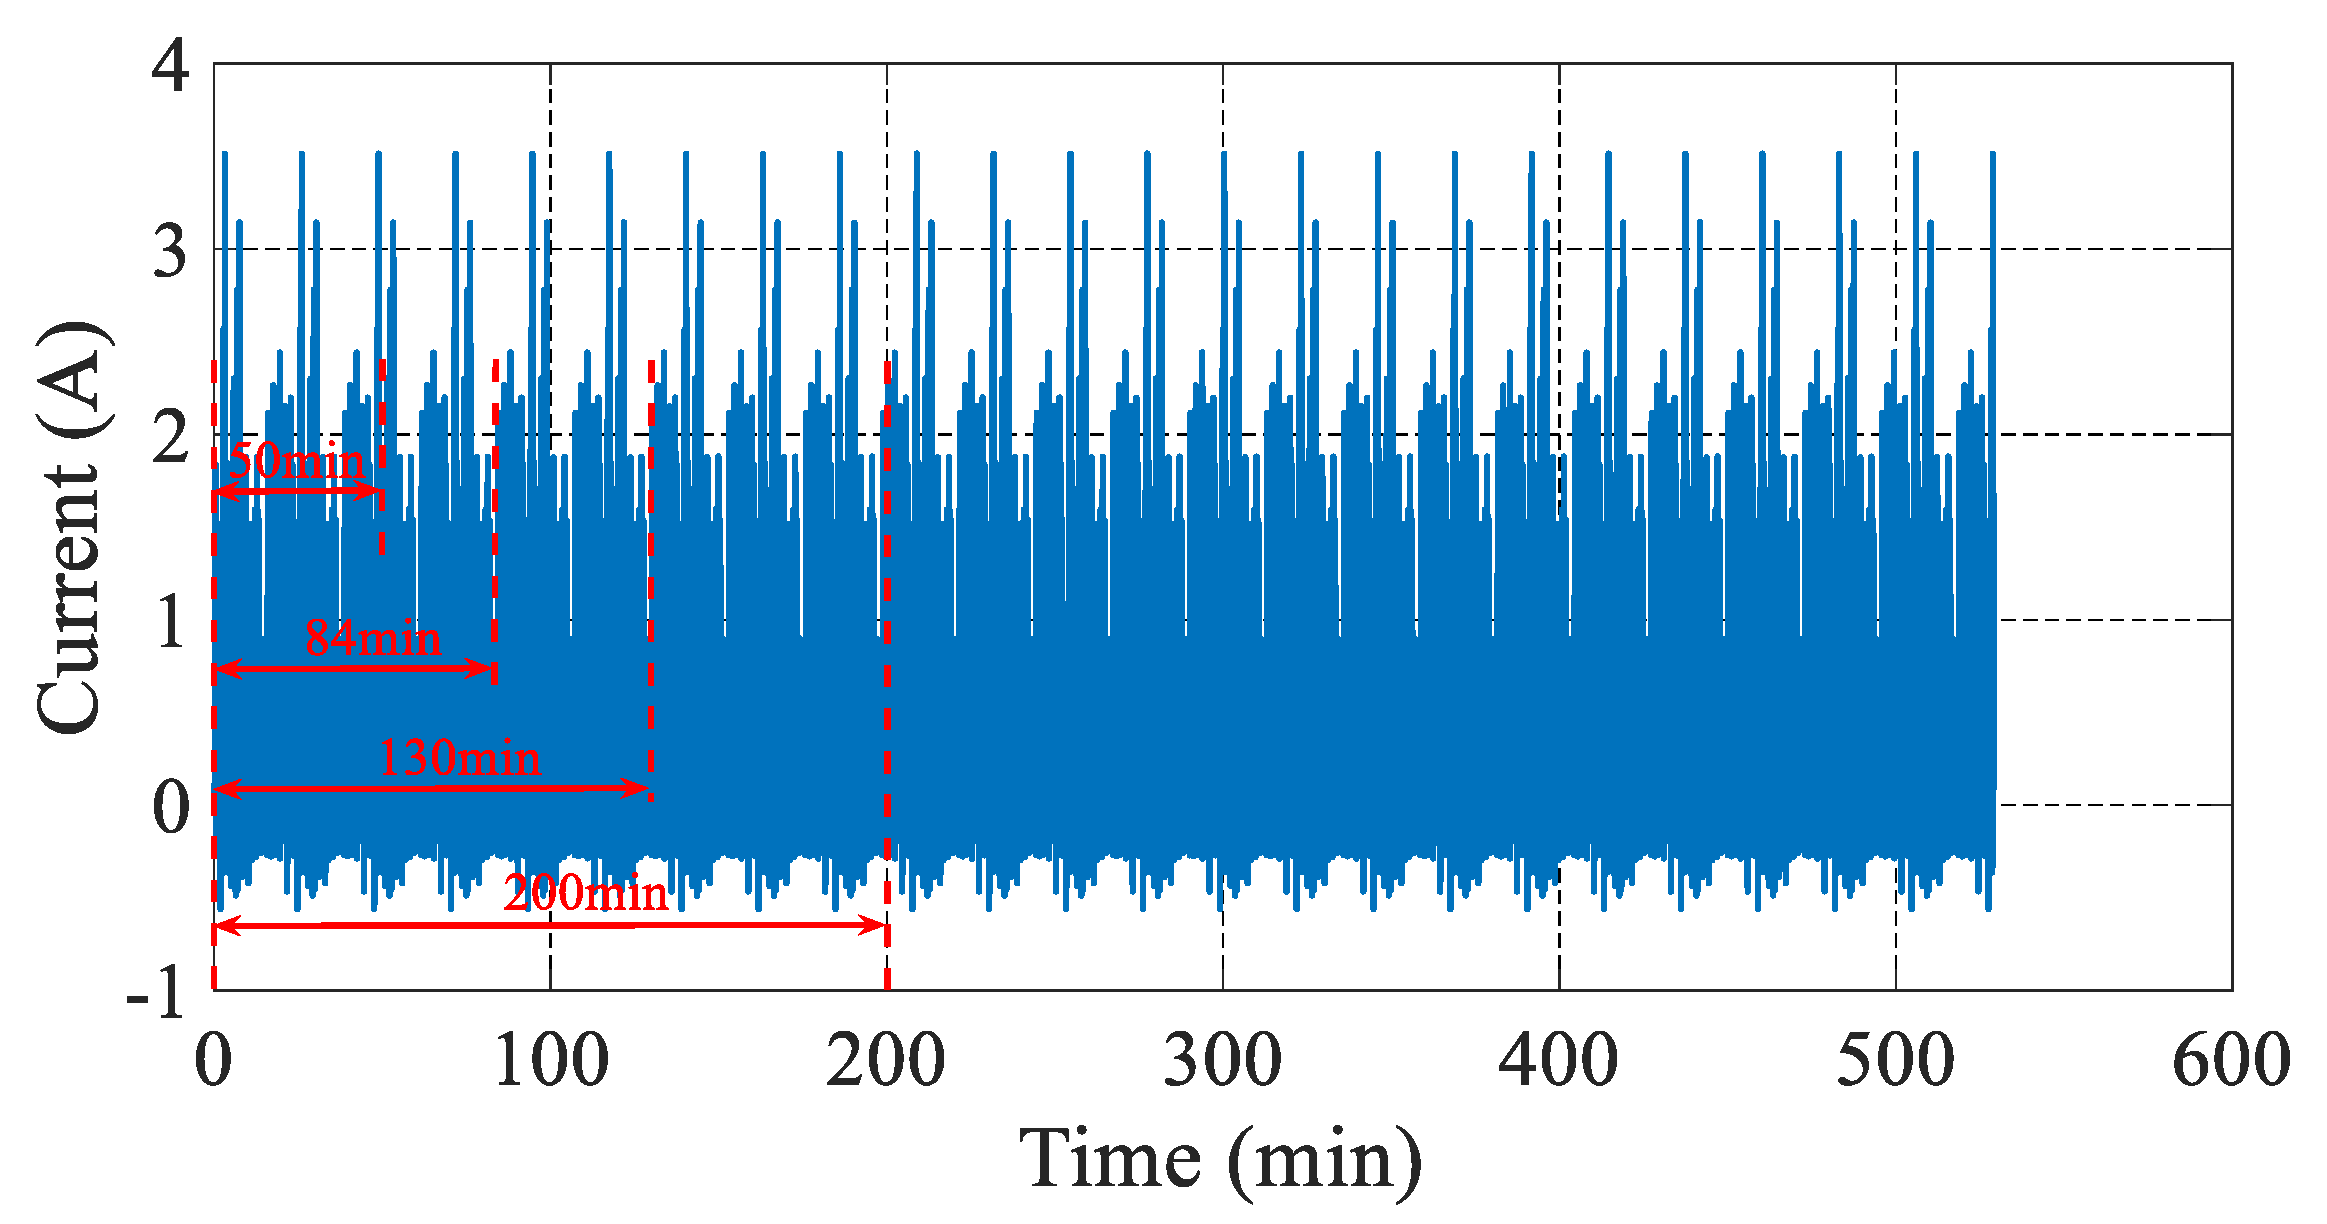
Figure 6 shows the current profiles under the UDDS experiment. It can be clearly found that the entire discharging process takes around 554 min. To evaluate the influence incurred by different data lengths when identifying the model parameters, the data with the duration of 65, 84, 130 and 200 min (defined as 65 min, 84 min, 130 min and 200 min, respectively) are randomly selected as the test target, and the remaining data are applied for SOC estimation. Note that when the data length is 554 min (total loading profile process), the SOC is estimated without the update of the capacity value and parameters. Table 3 compares the battery capacity estimation results with respect to different data lengths.
The actual capacity 2.5321 Ah is measured through the calibration test, and the estimated capacity ranges from 2.4366 Ah to 2.5065 Ah. It can be observed that data duration shows certain influence on the estimation results, and the estimated error of the battery capacity decreases by 2.7606%, from 3.7716% to 1.011%, after increasing the data length.
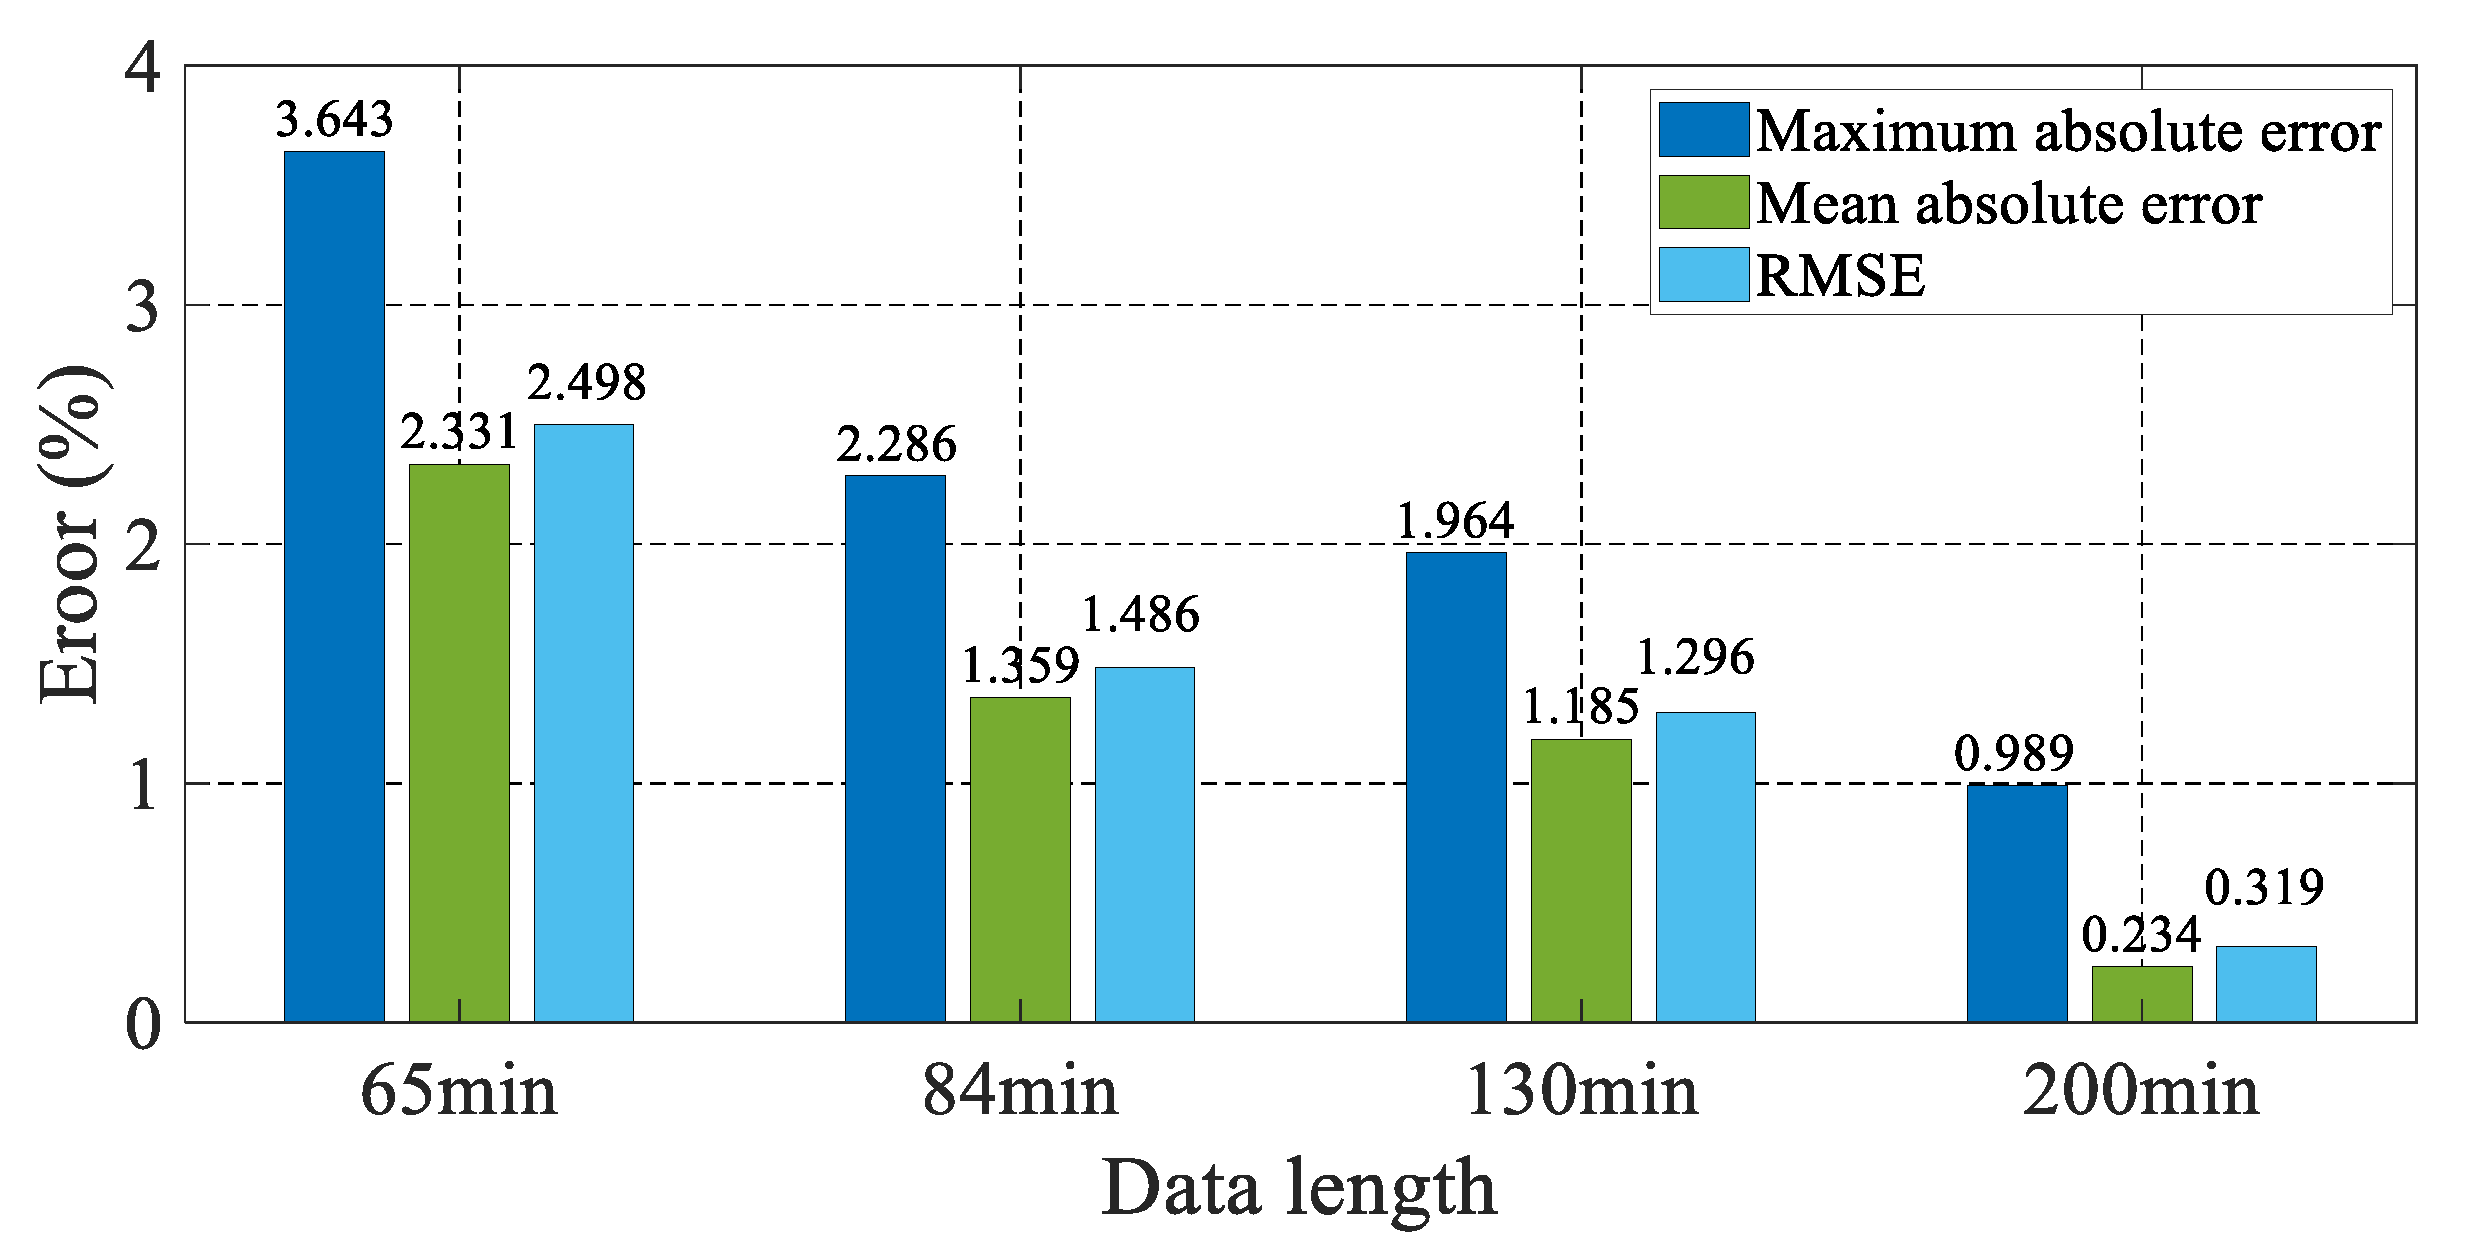
Based on the obtained capacity, the detailed results of the SOC and estimation error with different identification data lengths are presented in Figure 7, and the statistic results are provided in Figure 8. As demonstrated in Figure 7, when the date length increases from 54 min to 200 min, the estimated SOC can quickly converge to the reference value according to the updated parameters and capacity, and the maximum absolute error decreases from 3.643% to 0.989%. When the data length reaches 200 min, the estimation errors are restricted within a small range, less than 1%. Besides, Figure 7 also shows the SOC estimation results without considering the capacity’s update. The maximum absolute error, the mean absolute error and the RMSE are 2.538%, 1.661% and 1.737%, respectively. It is apparent that the estimated SOC looks more divergent without the capacity update, thereby manifesting the advance of the joint estimation algorithm. From Figure 8, we can find that when the data length increases from 65 min to 200 min, the maximum absolute error, mean absolute error and RMSE decrease from 3.643%, 2.331%, 2.498% to 0.989%, 0.234%, 0.319%, respectively. The results demonstrate that as the calculated data length increases, the estimated SOC becomes closer to the reference value, and this is mainly because the GA shows a global optimization ability, and when more input data samples are referred, the prediction results will be more accurate. Hence, appropriately increasing the duration of data is beneficial for improving the accuracy of capacity identification and SOC estimation. Nonetheless, it is appreciably time-consuming when increasing the amount of data to estimate the battery capacity. To balance the relationship between error and calculation time, the data duration of 200 min is considered as the preferred length. In the following, the estimated results with the data length of 200 min are all adopted for SOC estimation and comparison.

4.2. SOC Estimation under Various Degradation Stages

To verify the feasibility of the proposed co-estimation scheme, the battery cells are experimentally and circularly tested with the UDDS current at different aging levels. According to the estimation algorithm of capacity addressed previously, the pre-set data length is 200 min. Table 4 and Figure 9 compare the estimated results of battery capacity at different aging stages (fresh, nearly fresh, slightly cycled, severely cycled and lifespan exceeded), of which the number of cycles ranges from 0 to 120, with 30 as the interval. As illustrated in Table 4, the battery capacity declines with the cycling operation. The proposed algorithm enables that the maximum relative and absolute errors are less than 1.011% and 0.026 Ah when the battery is cycled for 30 times, thereby indicating its preferable capability of estimating the battery capacity at different aging statuses. Furthermore, the estimated results can also commendably reflect the decay trend of battery capacity.
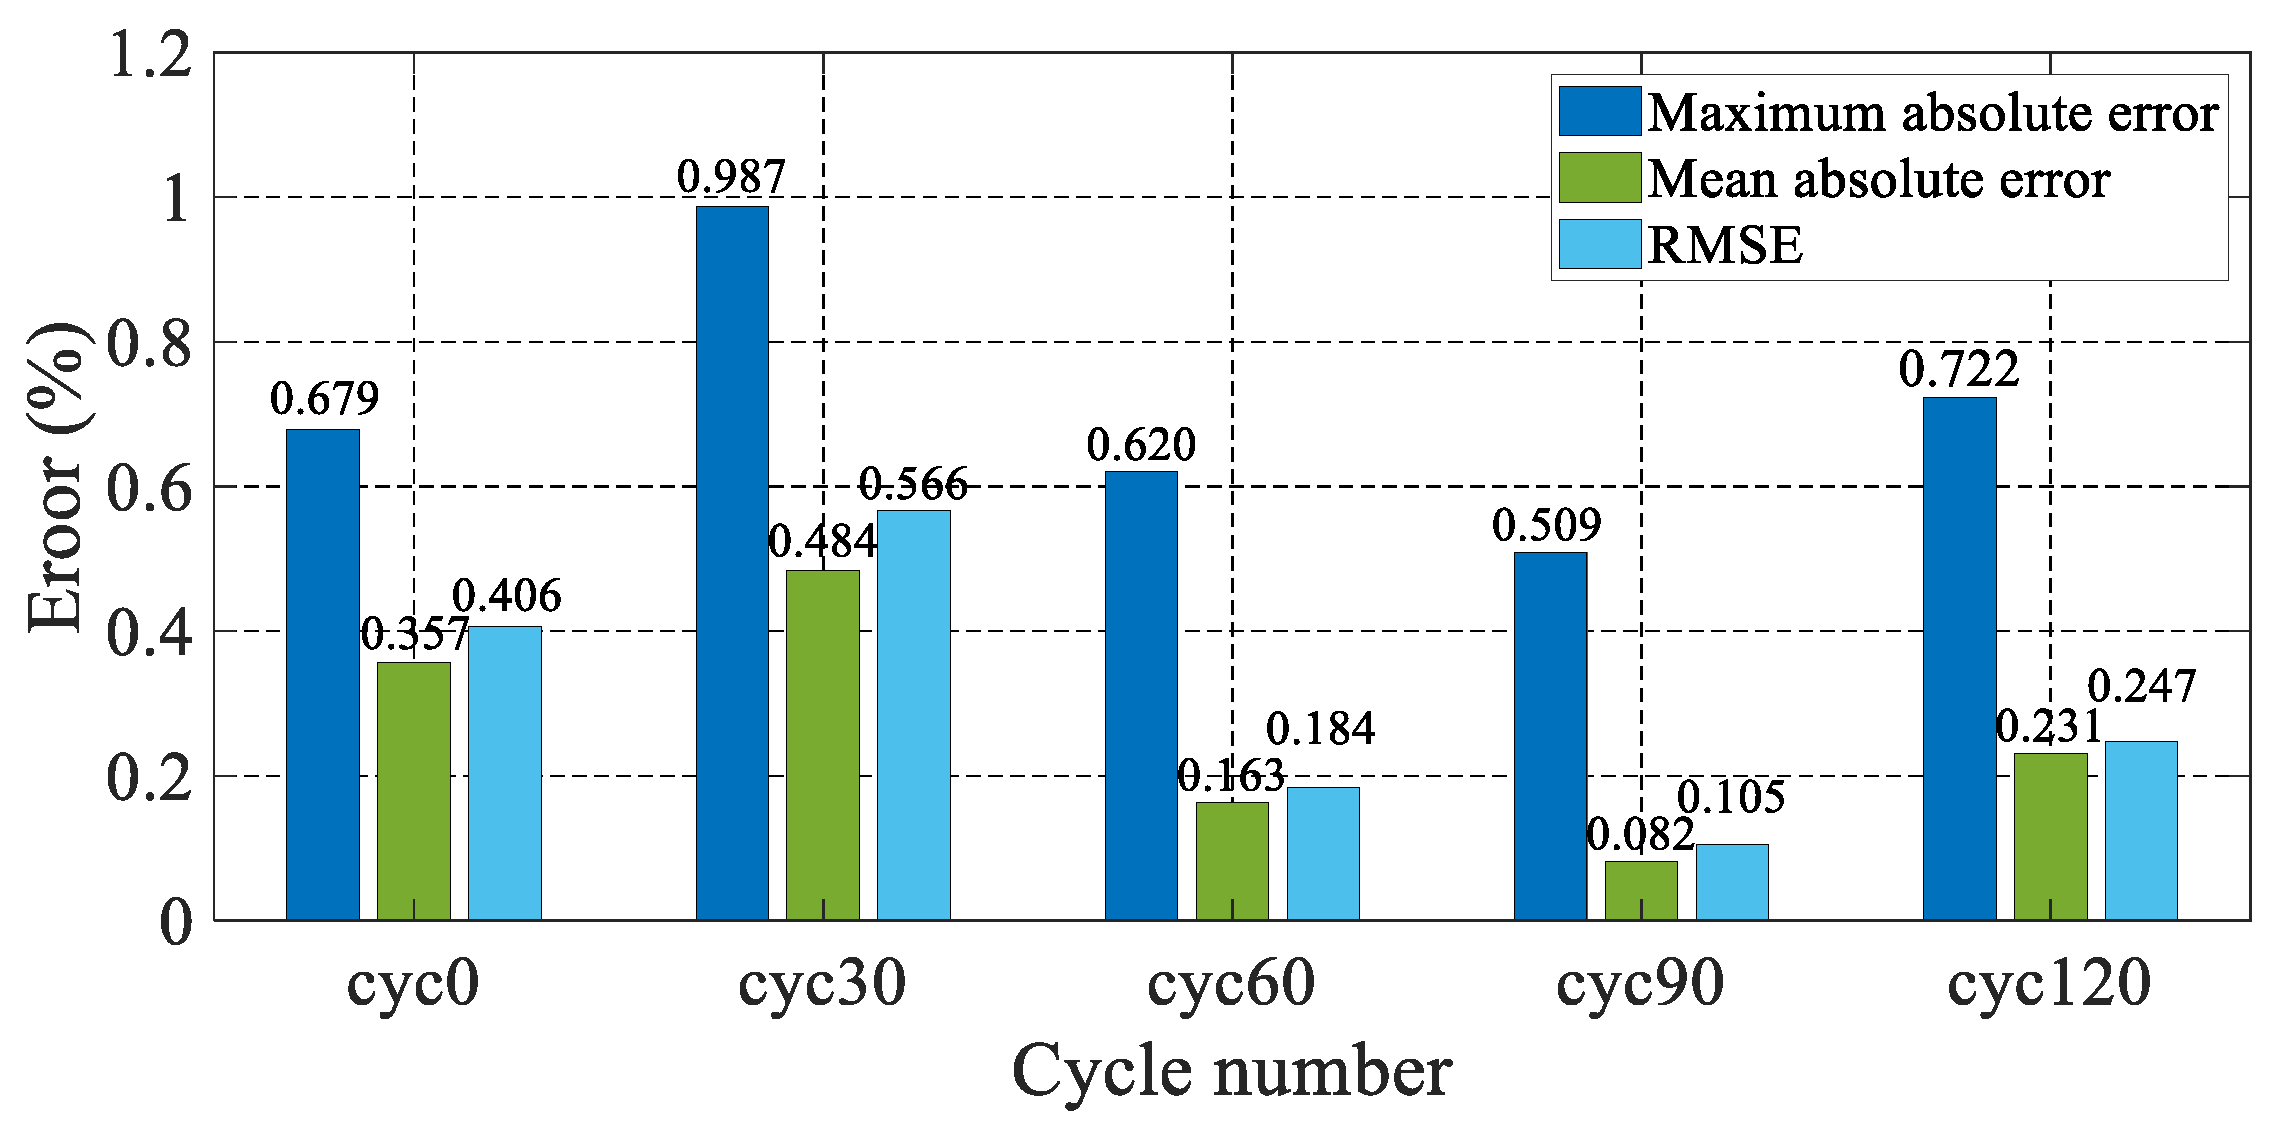
After finding the model parameters including the capacity value, the estimated SOC results at different aging status are demonstrated in Figure 10, and the statistic results are summarized in Figure 11. As Figure 10 suggests, it is obvious that when the battery ages, the total discharging time gradually decreases under the same operating conditions. The initial SOC is 20%, with the error of 80%, and the estimated SOC at various aged status can all converge to the reference values. Figure 10 also reveals that the maximum absolute error of SOC is restricted within 1% after the correction of the initial SOC error, even when the battery is aged, and the convergence time is less than 120 s. As discussed previously, the accuracy of SOC estimation is heavily influenced by the battery degradation. Without considering the update of battery capacity, the SOC estimation error increases towards higher numbers of cycles. In this study, the updated battery capacity is exploited to assist in improving the SOC estimation in the entire lifespan. As can be found in Figure 11, the maximum value of absolute error, mean absolute error and the RMSE are 0.987%, 0.484% and 0.566%, respectively, occurring in cyc30. The reason is that when the cycle number is 30, the estimation error of capacity reaches 1.011%, thus leading to the worst SOC estimation. Even so, the maximum absolute error of SOC is still restricted within 1.1% after the correction of initial SOC. As the number of battery cycles increases, the estimated SOC error does not increase obviously, manifesting that the updated capacity value contributes to the SOC estimation. From this point of view, regular updates of battery capacity in the aging process are imperative to improve the accuracy of SOC estimation.

5. Conclusions

In this study, a model-based adaptive joint estimation algorithm of SOC and capacity is proposed for lithium–ion batteries. The SOC estimation is implemented based on a second-order ECM, with the SRCKF algorithm considering the capacity degradation and parameters variation. The battery capacity is imported into the model parameter group, and it is jointly identified by the GA and the constructed TDRS. After obtaining the parameters and the capacity, the SOC is accurately estimated by the SRCKF. Through the experimental validations in terms of different degradation status, varying duration of recorded data and various dynamic operating conditions, the preferable performance of the proposed method is satisfactorily verified. The experimental results elucidate that the co-estimation approach can improve the SOC estimation accuracy in the entire battery lifespan cycle with the update of capacity, even in the cases of aged batteries and under complicated operating conditions.
In addition, this paper only investigates the SOC and capacity estimation for battery cells. However, the capacity and SOC of battery packs are also particularly critical in practical applications, and they will certainly be our research focus in the future.

Author Contributions

Conceptualization, Z.C. and J.X.; methodology, Z.C.; software, J.X.; validation, Z.C., J.X., X.S., S.S., and Y.L.; formal analysis, J.X.; investigation, Z.C.; resources, X.S.; data curation, J.X., X.S., and J.S.; writing—original draft preparation, Z.C., J.X., X.S. and J.S.; writing—review and editing, Z.C.; visualization, J.X.; supervision, Z.C.; project administration, Z.C.; funding acquisition, Z.C. All authors have read and agreed to the published version of the manuscript.

Funding

This work was supported in part by the National Science Foundation under Grant 61763021 and Grant 51775063, in part by the National Key R&D Program of China under Grant 2018YFB0104000, and in part by the EU-funded Marie Skłodowska-Curie Individual Fellowships Project under Grant 845102-HOEMEV-H2020-MSCA-IF-2018 in part.

Conflicts of Interest

The authors declare no conflict of interest.

References

  1. Hu, X.; Feng, F.; Liu, K.; Zhang, L.; Xie, J.; Liu, B. State estimation for advanced battery management: Key challenges and future trends. Renew. Sustain. Energy Rev. 2019, 114, 109334. [Google Scholar] [CrossRef]
  2. Chen, Z.; Shu, X.; Li, X.; Xiao, R.; Shen, J. LiFePO4 battery charging strategy design considering temperature rise minimization. J. Renew. Sustain. Energy 2017, 9, 64103. [Google Scholar] [CrossRef]
  3. Chen, Z.; Shu, X.; Xiao, R.; Yan, W.; Liu, Y.; Shen, J. Optimal charging strategy design for lithium-ion batteries considering minimization of temperature rise and energy loss. Int. J. Energy Res. 2019, 43, 4344–4358. [Google Scholar] [CrossRef]
  4. Zhao, L.; Lin, M.; Chen, Y. Least-squares based coulomb counting method and its application for state-of-charge (SOC) estimation in electric vehicles. Int. J. Energy Res. 2016, 40, 1389–1399. [Google Scholar] [CrossRef]
  5. Xiong, R.; Yu, Q.; Wang, L.Y.; Lin, C. A novel method to obtain the open circuit voltage for the state of charge of lithium ion batteries in electric vehicles by using H infinity filter. Appl. Energy 2017, 207, 346–353. [Google Scholar] [CrossRef]
  6. Houlian, W.; Gongbo, Z. State of charge prediction of supercapacitors via combination of Kalman filtering and backpropagation neural network. IET Electr. Power Appl. 2018, 12, 588–594. [Google Scholar] [CrossRef]
  7. Meng, J.; Luo, G.; Fei, G. Lithium Polymer Battery State-of-Charge Estimation Based on Adaptive Unscented Kalman Filter and Support Vector Machine. IEEE Trans. Power Electron. 2016, 31, 2226–2238. [Google Scholar] [CrossRef]
  8. Li, Y.; Wang, C.; Gong, J. A multi-model probability SOC fusion estimation approach using an improved adaptive unscented Kalman filter technique. Energy 2017, 141, 1402–1415. [Google Scholar] [CrossRef]
  9. Campestrini, C.; Heil, T.; Kosch, S.; Jossen, A. A comparative study and review of different Kalman filters by applying an enhanced validation method. J. Energy Storage 2016, 8, 142–159. [Google Scholar] [CrossRef]
  10. Charkhgard, M.; Zarif, M.H. Design of adaptive H-infinity filter for implementing on state-of-charge estimation based on battery state-of-charge-varying modelling. IET Power Electron. 2015, 8, 1825–1833. [Google Scholar] [CrossRef]
  11. Pola, D.A.; Navarrete, H.F.; Orchard, M.E.; Rabie, R.S.; Cerda, M.A.; Olivares, B.E.; Silva, J.F.; Espinoza, P.A.; Perez, A. Particle-Filtering-Based Discharge Time Prognosis for Lithium-Ion Batteries with a Statistical Characterization of Use Profiles. IEEE Trans. Reliab. 2015, 64, 710–720. [Google Scholar] [CrossRef]
  12. Chen, Z.; Fu, Y.; Mi, C.C. State of Charge Estimation of Lithium-Ion Batteries in Electric Drive Vehicles Using Extended Kalman Filtering. IEEE Trans. Veh. Technol. 2013, 62, 1020–1030. [Google Scholar] [CrossRef]
  13. Wang, Y.; Liu, C.; Pan, R.; Chen, Z. Modeling and state-of-charge prediction of lithium-ion battery and ultracapacitor hybrids with a co-estimator. Energy 2017, 121, 739–750. [Google Scholar] [CrossRef]
  14. Alkaya, A. Unscented Kalman filter performance for closed-loop nonlinear state estimation: A simulation case study. Electr. Eng. 2014, 96, 299–308. [Google Scholar] [CrossRef]
  15. Liu, Z.; Dang, X.; Jing, B.; Ji, J. A novel model-based state of charge estimation for lithium-ion battery using adaptive robust iterative cubature Kalman filter. Electron. Pow. Syst. Res. 2019, 177, 105951. [Google Scholar] [CrossRef]
  16. Yu, Q.; Xiong, R.; Lin, C. Online Estimation of State-of-charge Based on the H infinity and Unscented Kalman Filters for Lithium Ion Batteries. Energy Procedia 2017, 105, 2791–2796. [Google Scholar] [CrossRef]
  17. Zheng, L.; Zhu, J.; Wang, G.; Lu, D.D.-C.; He, T. Differential voltage analysis based state of charge estimation methods for lithium-ion batteries using extended Kalman filter and particle filter. Energy 2018, 158, 1028–1037. [Google Scholar] [CrossRef]
  18. Li, S.; Hu, M.; Li, Y.; Gong, C. Fractional-order modeling and SOC estimation of lithium-ion battery considering capacity loss. Int. J. Energy Res. 2019, 43, 417–429. [Google Scholar] [CrossRef] [Green Version]
  19. Zhang, J.; Lee, J. A review on prognostics and health monitoring of Li-ion battery. J. Power Sources 2011, 196, 6007–6014. [Google Scholar] [CrossRef]
  20. Waag, W.; Kaebitz, S.; Sauer, D.U. Experimental investigation of the lithium-ion battery impedance characteristic at various conditions and aging states and its influence on the application. Appl. Energy 2013, 102, 885–897. [Google Scholar] [CrossRef]
  21. Han, X.; Ouyang, M.; Lu, L.; Li, J. A comparative study of commercial lithium ion battery cycle life in electric vehicle: Capacity loss estimation. J. Power Sources 2014, 268, 658–669. [Google Scholar] [CrossRef]
  22. Feng, X.; Li, J.; Ouyang, M.; Lu, L.; Li, J.; He, X. Using probability density function to evaluate the state of health of lithium-ion batteries. J. Power Sources 2013, 232, 209–218. [Google Scholar] [CrossRef]
  23. Zou, Y.; Hu, X.; Ma, H.; Li, S.E. Combined State of Charge and State of Health estimation over lithium-ion battery cell cycle lifespan for electric vehicles. J. Power Sources 2015, 273, 793–803. [Google Scholar] [CrossRef]
  24. He, T.; Xu, W.; Lu, Z.; Yong, H.; Tian, G. Adaptive Fuzzy Logic Energy Management Strategy Based on Reasonable SOC Reference Curve for Online Control of Plug-in Hybrid Electric City Bus. IEEE Trans. Intell. Transp. 2018, 19, 1607–1617. [Google Scholar]
  25. Hussein, A.A. Capacity Fade Estimation in Electric Vehicle Li-Ion Batteries Using Artificial Neural Networks. IEEE Trans. Ind. Appl. 2015, 51, 2321–2330. [Google Scholar] [CrossRef]
  26. Jin, N.; Danilov, D.L.; van den Hof, P.M.J.; Donkers, M.C.F. Parameter estimation of an electrochemistry-based lithium-ion battery model using a two-step procedure and a parameter sensitivity analysis. Int. J. Energy Res. 2018, 42, 2417–2430. [Google Scholar] [CrossRef]
  27. Wang, C.; He, H.; Zhang, Y.; Mu, H. A comparative study on the applicability of ultracapacitor models for electric vehicles under different temperatures. Appl. Energy 2017, 196, 268–278. [Google Scholar] [CrossRef]
  28. Hu, X.; Li, S.; Peng, H. A comparative study of equivalent circuit models for Li-ion batteries. J. Power Sources 2012, 198, 359–367. [Google Scholar] [CrossRef]
  29. Liu, L.; Zhang, M.; Buyya, R.; Fan, Q. Deadline-constrained coevolutionary genetic algorithm for scientific workflow scheduling in cloud computing. Concurr. Comput. Pract. Exp. 2017, 29, e3942. [Google Scholar] [CrossRef]
  30. Jin, L.W.; Lee, P.S.; Kong, X.X.; Fan, Y.; Chou, S.K. Ultra-thin minichannel LCP for EV battery thermal management. Appl. Energy 2014, 113, 1786–1794. [Google Scholar] [CrossRef]
  31. Yang, R.; Xiong, R.; He, H.; Mu, H.; Wang, C. A novel method on estimating the degradation and state of charge of lithium-ion batteries used for electrical vehicles. Appl. Energy 2017, 207, 336–345. [Google Scholar] [CrossRef]
  32. Sun, X.; Ji, J.; Ren, B.; Xie, C.; Yan, D. Adaptive Forgetting Factor Recursive Least Square Algorithm for Online Identification of Equivalent Circuit Model Parameters of a Lithium-Ion Battery. Energies 2019, 12, 2242. [Google Scholar] [CrossRef] [Green Version]
  33. Cheng, S.; Li, L.; Chen, J. Fusion algorithm design based on adaptive SCKF and integral correction for side-slip angle observation. IEEE Trans. Ind. Electron. 2017, 65, 5754–5763. [Google Scholar] [CrossRef]
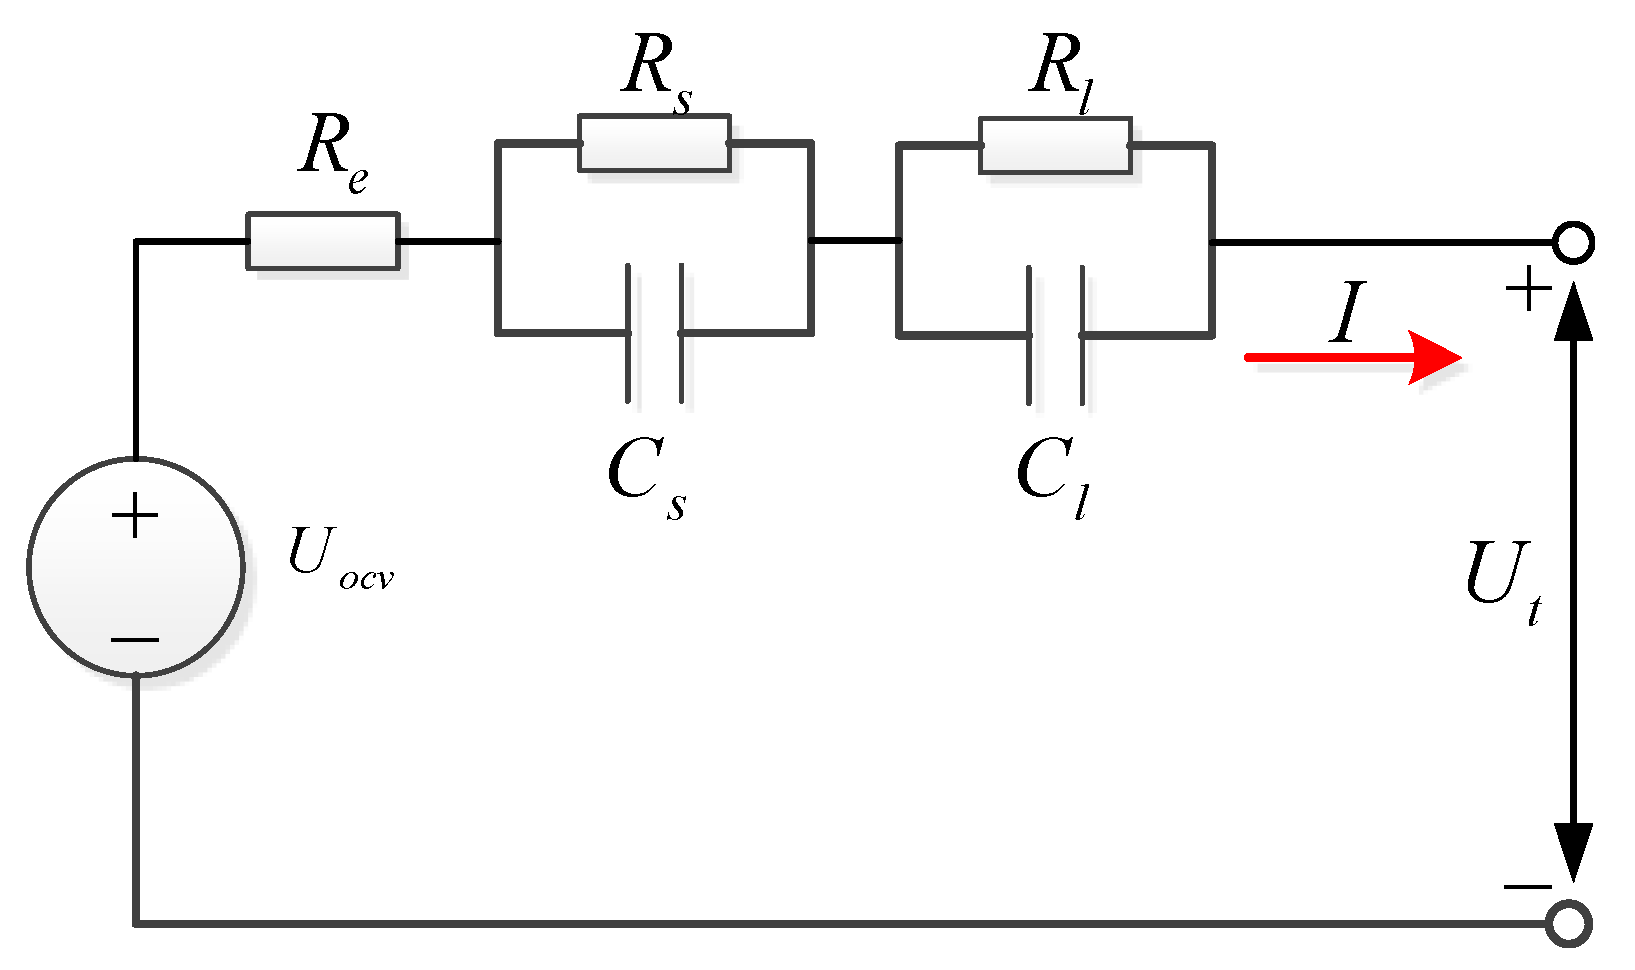
Figure 1. The second-order resistance–capacitance (RC) equivalent circuit model.
Energies 13 01410 g001
Figure 2. The decay of battery cell discharge capacity under 180 cycles.
Energies 13 01410 g002
Figure 3. The relationship curve of the open circuit voltage (OCV) and state of charge (SOC) at different aging stages.
Energies 13 01410 g003
Figure 4. The scheme of the SOC and battery capacity co-estimation algorithm for lithium–ion batteries.
Energies 13 01410 g004
Figure 5. The three-dimensional response surface via capacity–SOC–OCV.
Energies 13 01410 g005
Figure 6. The urban dynamometer driving schedule (UDDS) current.
Energies 13 01410 g006
Figure 7. The results of SOC estimation based on various data lengths: (a) SOC estimation results; (b) SOC error.
Energies 13 01410 g007
Figure 8. Comparison of the battery SOC estimation results of different data lengths.
Energies 13 01410 g008
Figure 9. Capacity value of measurement and estimation at various degradation extents. (a) Estimation results; (b) Relative error.
Energies 13 01410 g009
Figure 10. The results of SOC estimation with the aged battery cell: (a) SOC estimation results; (b) SOC error.
Energies 13 01410 g010
Figure 11. The estimated errors of the SOC corresponding to the aging battery cell.
Energies 13 01410 g011
Table 1. The specifications of the battery cell.
MaterialTernary Lithium–Ion Battery
Nominal capacity2.55 Ah
Nominal voltage3.6 V
End-of-charge voltage4.2 V
End-of-charge current51 mA
End-of-discharge voltage2.5 V
Table 2. The process of SOC estimation based on the square root cubature Kalman filter (SRCKF) algorithm.
(a) Initialization:
{ x ^ 0 | 0 = E [ x 0 ] P 0 | 0 = E [ ( x 0 x ^ 0 | 0 ) ( x 0 x ^ 0 | 0 ) T ]
Determine the initial value S 0 | 0 of the square roots of the error covariance matrix by the Cholesky decomposition:
S 0 | 0 = [ c h o l ( P 0 | 0 ) ] T
(b) Calculate the basic cubature points and weight:
ξ g = m 2 [ 1 ] g , ( g = 1 , 2 , , m )
(c) Iteration:
for k = 1 , 2 , , N
  Time update:
    Step 1: calculate the cubature points:
X g , k 1 | k 1 = S k 1 | k 1 ξ i + x ^ k 1 | k 1
    Step 2: calculate the propagated cubature points:
X g , k | k 1 * = f ( X g , k 1 | k 1 , u k )
    Step 3: calculate the predicted state:
x ^ k | k 1 = 1 m g = 1 m X g , k | k 1 *
    Step 4: calculate the state-weighted center matrix:
χ k | k 1 = 1 m [ X 1 , k | k 1 * x ^ k | k 1 X m , k | k 1 * x ^ k | k 1 ]
    Step 5: calculate the square-root of the prediction error covariance matrix:
S k | k 1 = T r i a ( [ χ k | k 1 , S Q , k 1 ] )
  Measurement update:
    Step 1: recalculate the cubature points:
X g , k | k 1 = S k | k 1 ξ g + x ^ k | k 1
    Step 2: update the propagated measurement cubature points:
Z g , k | k 1 = h ( X g , k | k 1 , u k )
    Step 3: estimate the predicted measurement:
z ^ k | k 1 = 1 m g = 1 m Z g , k | k 1
    Step 4: evaluate the measurement-weighted center matrix:
ζ k | k 1 = 1 m [ Z 1 , k | k 1 z ^ k | k 1 Z m , k | k 1 z ^ k | k 1 ]
    Step 5: estimate the square root of the innovation covariance matrix:
S z z , k | k 1 = T r i a ( [ ζ k | k 1 , S R , k ] )
    Step 6: update the state-weighted center matrix:
χ k | k 1 = 1 m [ X 1 , k | k 1 x ^ k | k 1 X m , k | k 1 x ^ k | k 1 ]
    Step 7: estimate the cross-covariance matrix:
P x z , k | k 1 = χ k | k 1 ζ k | k 1 T
  Moreover, update the Kalman gain, state and square root of the error covariance
    Step 1: estimate the Kalman gain matrix:
W k = P x z , k | k 1 / S z z , k | k 1 T S z z , k | k 1
    Step 2: estimate the final updated state:
x ^ k | k = x ^ k | k 1 + W k ( z k z ^ k | k 1 )
    Step 3: update the corresponding square-root of the error covariance matrix:
S k | k = T r i a ( [ χ k | k 1 W k ζ k | k 1 , W k S R , k ] )
End
Table 3. The estimation results and errors of the battery capacity corresponding to various data lengths.
Data LengthEstimated Capacity/AhAbsolute Error/AhRelative Error/%
65 min2.43660.09553.7716
84 min2.47100.06112.4130
130 min2.48540.04671.8443
200 min2.50650.02561.0110
Table 4. The estimated results and errors of the battery during the entire lifespan.
Cycle NumberActual Capacity/AhEstimated Capacity/AhAbsolute Error/AhRelative Error/%
cyc02.54782.53440.01340.5259
cyc302.53212.50650.02561.0110
cyc602.37882.36550.01330.5591
cyc902.17792.17580.00210.0964
cyc1201.96551.95510.01040.5291