Long-term Static and Operational Reserves Assessment Considering Operating and Market Agreements Representation to Multi-Area Systems

 and
and
Abstract
:1. Introduction
2. Theoretical Background
2.1. Simulation Mechanism and Models Applied to Power System Planning
2.2. Statistical Analysis of Simulation Studies
- Select a system state X, i.e., define equipment availability, load levels, operating and market procedures, etc., in accordance with system representation;
- Calculate H(X) from the selected state, i.e., verify whether that specific configuration of generators and circuits is able to supply the specific load, without violating system limits and operating and market rules; if necessary, use remedial actions such as generation rescheduling, bus voltage corrections, bus load curtailments, etc.;
- Update the estimate of E[H(X)] based on the result of step (2), i.e., calculate reliability indices such as LOLP, EENS, etc. If the accuracy of the estimate is acceptable, stop; otherwise, return to step i.
3. The Evolution of Power System Representation
3.1. Unit Commitment and Dispatch Representation
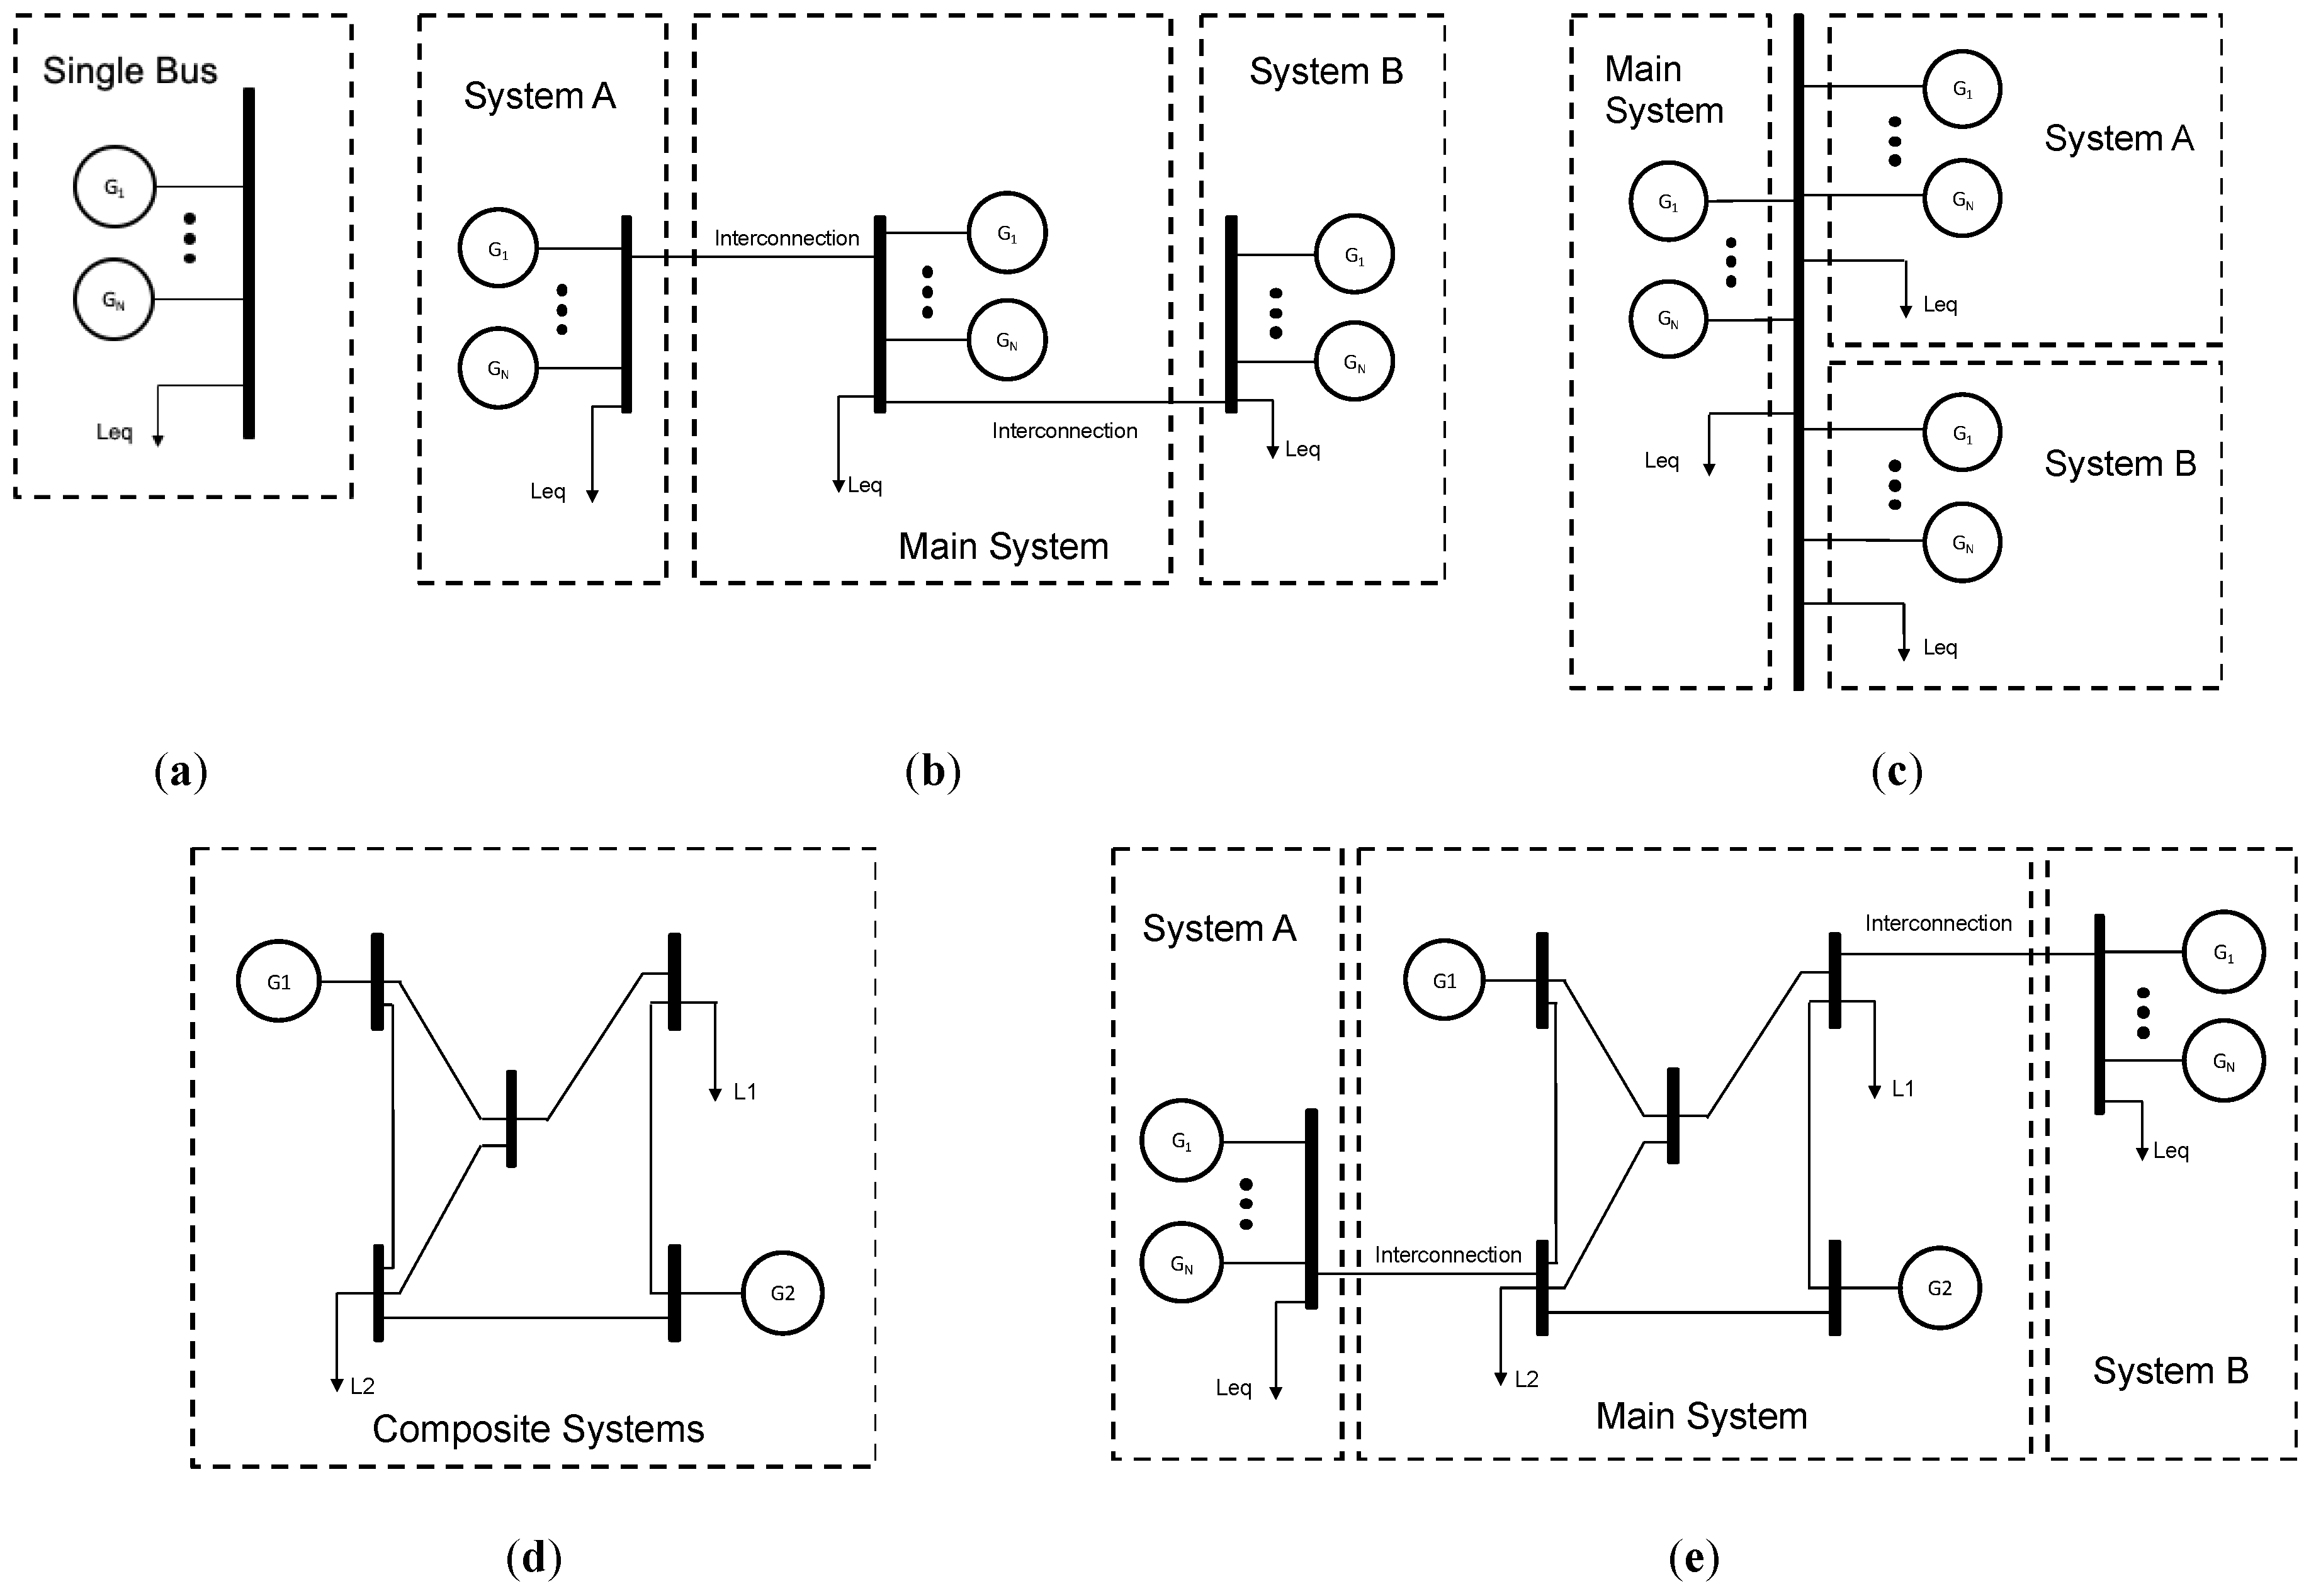
3.2. Policy Representation of Multi-Area Systems
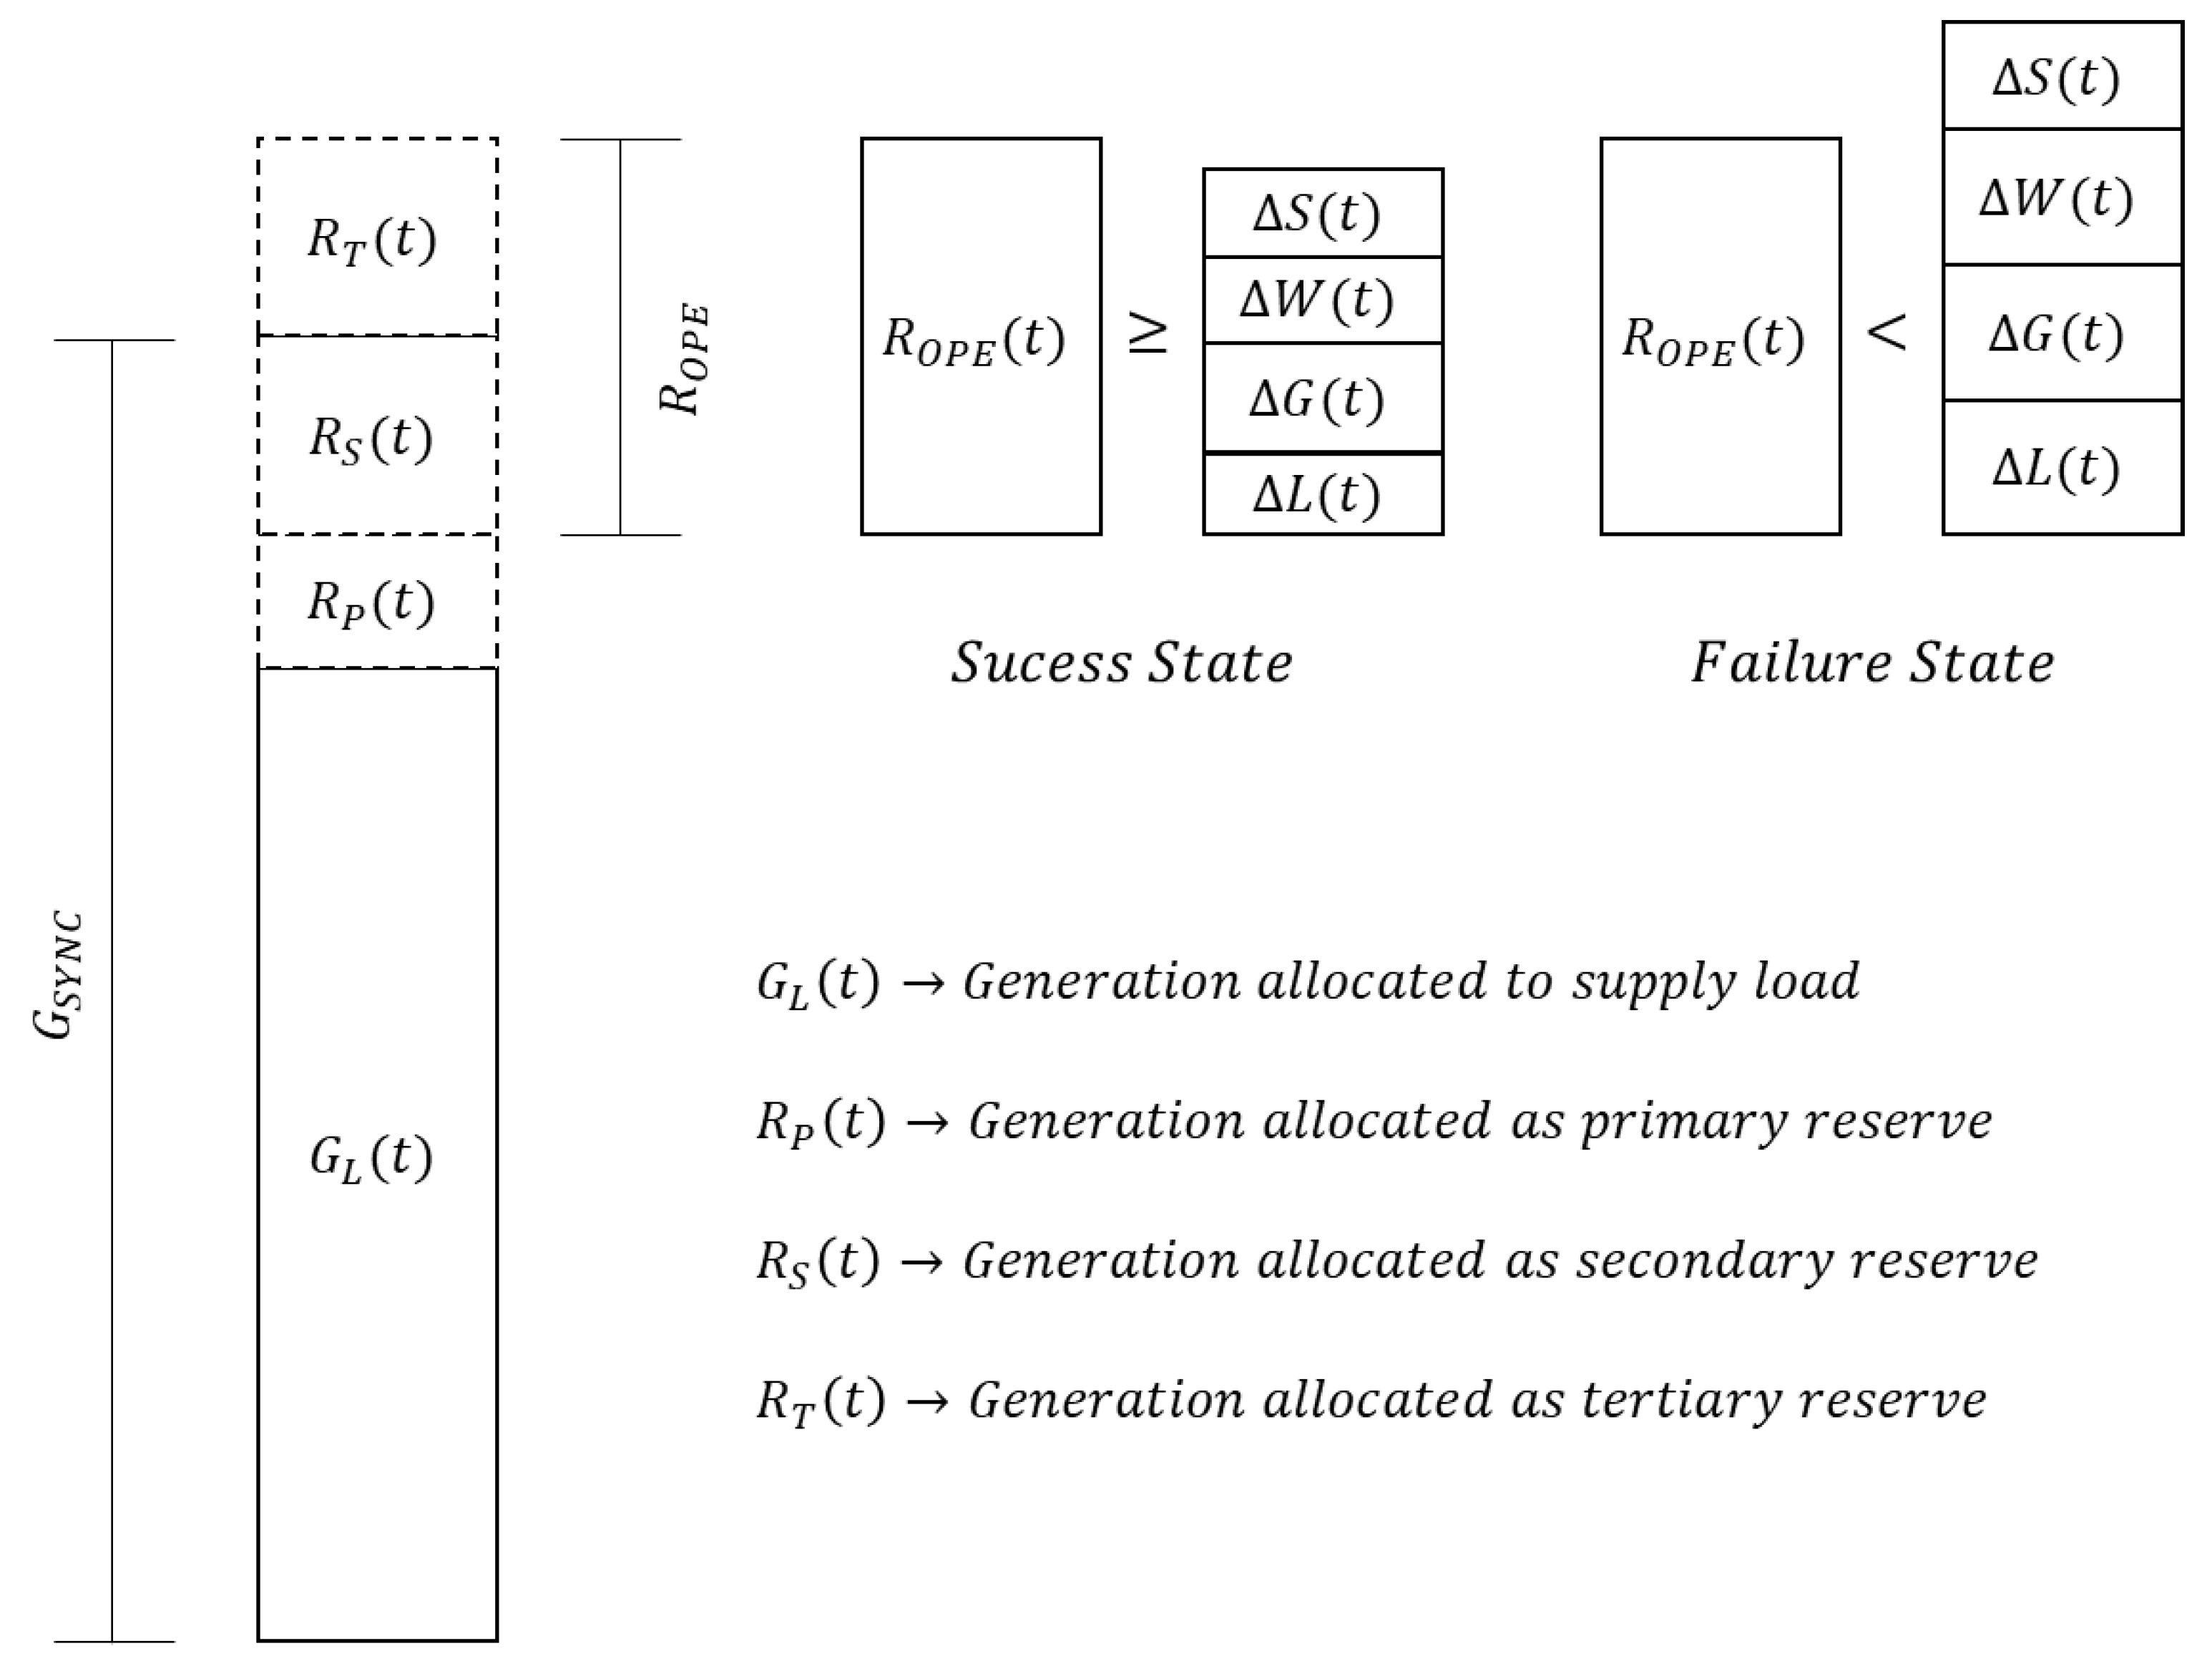
- Assistance policy: each system performs the unit commitment on an individual basis, aiming at fulfilling the generation amounts necessary to meet the expected load of its own system, and its primary and secondary reserve requirements defined previously by the operator. This policy follows the no-load-loss sharing, that is, each system tries to meet its load within its own generation units and, if necessary, tries to cover the deficit through import action, if there is available capacity to export in neighboring systems. The export capacity of a given area corresponds to the amount of committed generation that was not used to meet its own load. Eventually, if more than one system needs support, a priority list is used to decide which area will have support priority.
- Market policy: the second multi-area policy allows for commercial exchanges between areas, making it possible for lower-cost generating units to be committed in neighboring areas. It means that the unit commitment process is carried out in a unified basis, so that generating units from any area can be committed to meet the load and reserve requirements of other areas. The power exchanges take place according to the spatial placement of the generating units among areas, defined after the joint commitment of all generating units. If there is a need of load-shedding due to generation deficit, the priority list of supported areas is used.
- Hybrid policy: the hybrid policy has characteristics of the two previous policies. Then, to cover the expected load needs of the systems, the unit commitment can be carried out looking for generating units in any of the interconnected areas, prioritizing those units with lowest operating cost. On the other hand, the unit commitment to meet reserve requirements is carried out on an individual basis. In other words, for load supply, systems can commit units in any area, and to meet their reserve requirements, systems should only use generating units in their own area. During the operation, if any area shows generation deficit, support can be sought in neighboring areas, limited to those units committed as tertiary reserve in the support areas. The power exchange between areas is, therefore, the result of the planned power exchanges to meet the expected loads and the eventual support to meet the uncertainties.
4. Case Studies and Numerical Experiments
4.1. Analysis of the Transmission System Representation
- Average Degree or Valency of the network: this index is used in Graph Theory. The degree of a vertex V of a graph indicates the total number of edges that are incident to the vertex. In an electrical system, a vertex corresponds to a system bus and, therefore, the degree indicates the number of transmission lines and transformers that depart from each bus:where is the degree of the vertex and is the number of edges that are incident to . In the presented analysis, the average of the degree of all buses was considered to characterize the system:where is the degree of the system and is the vector containing the degree values of all vertices of the system S. The degree of the system indicates how “meshed” the system is and, therefore, how much the failure of a network element tends to affect the capacity of the system to load supply.
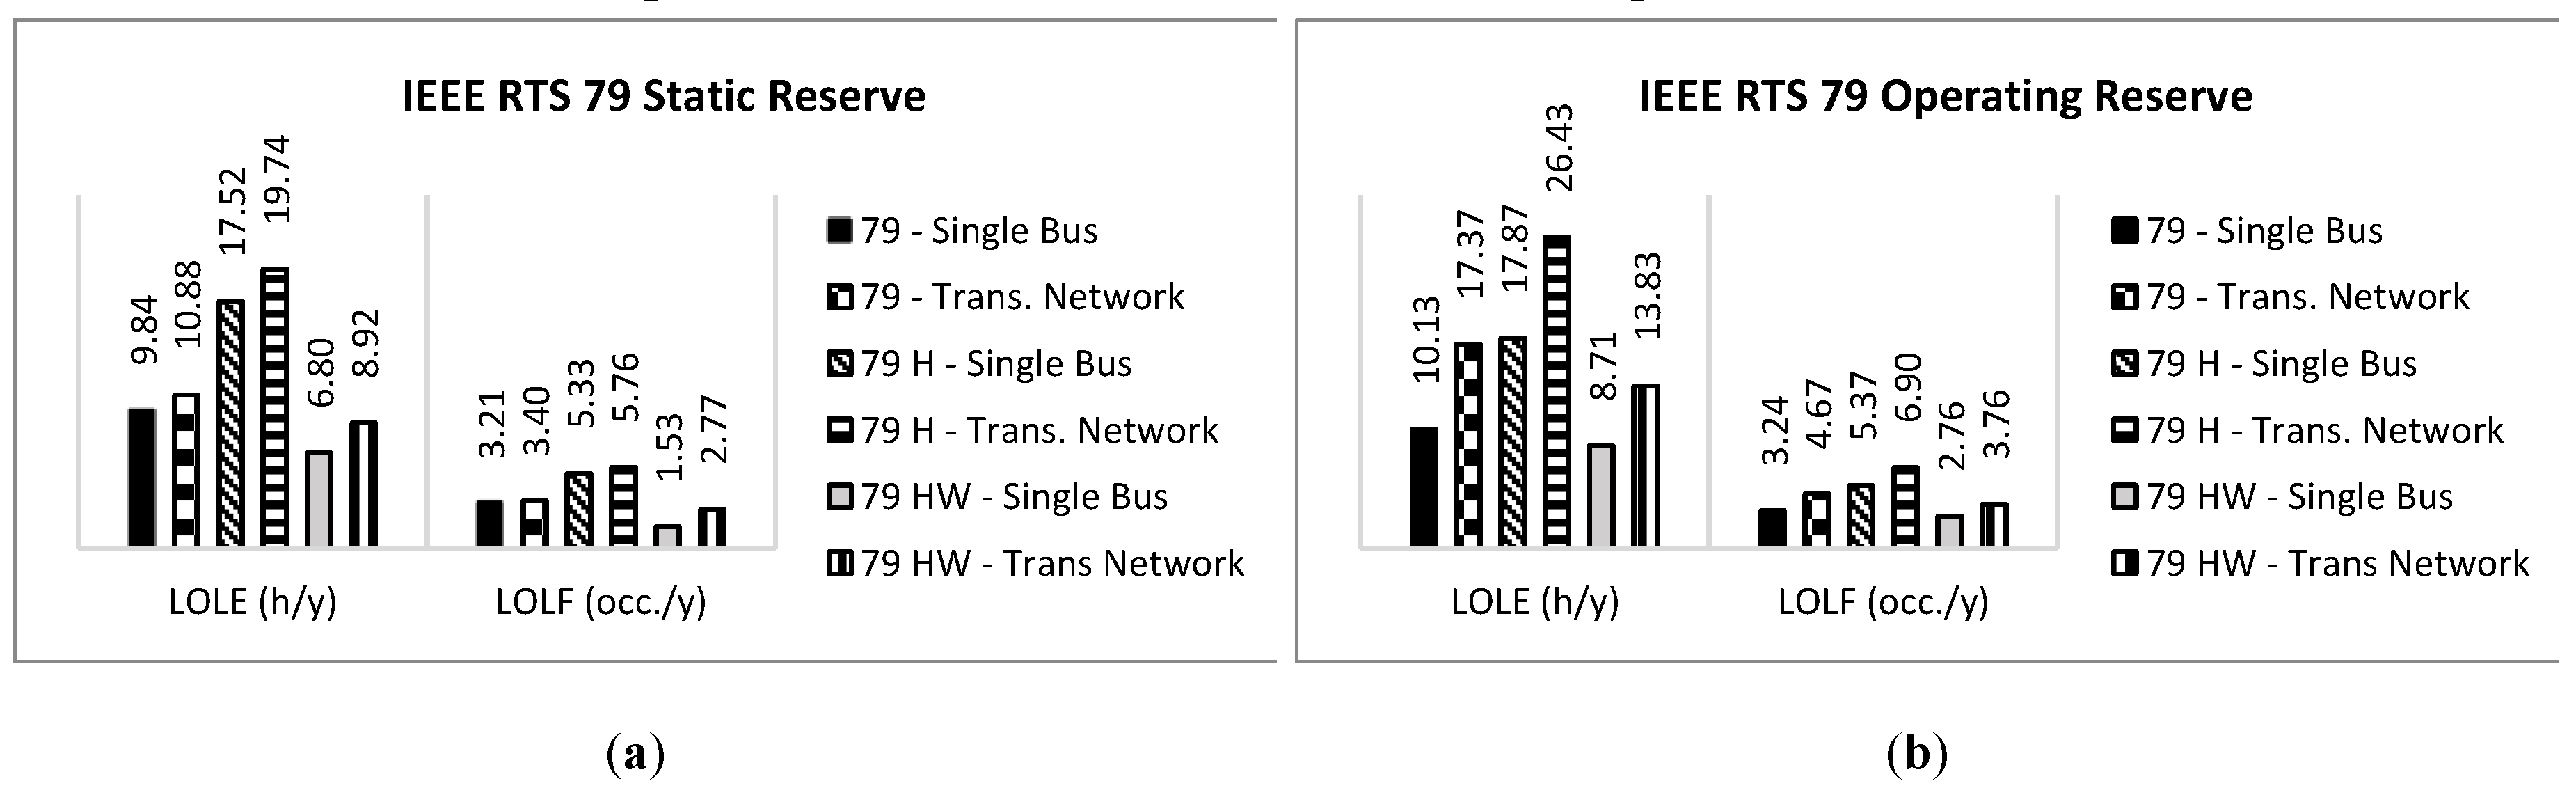
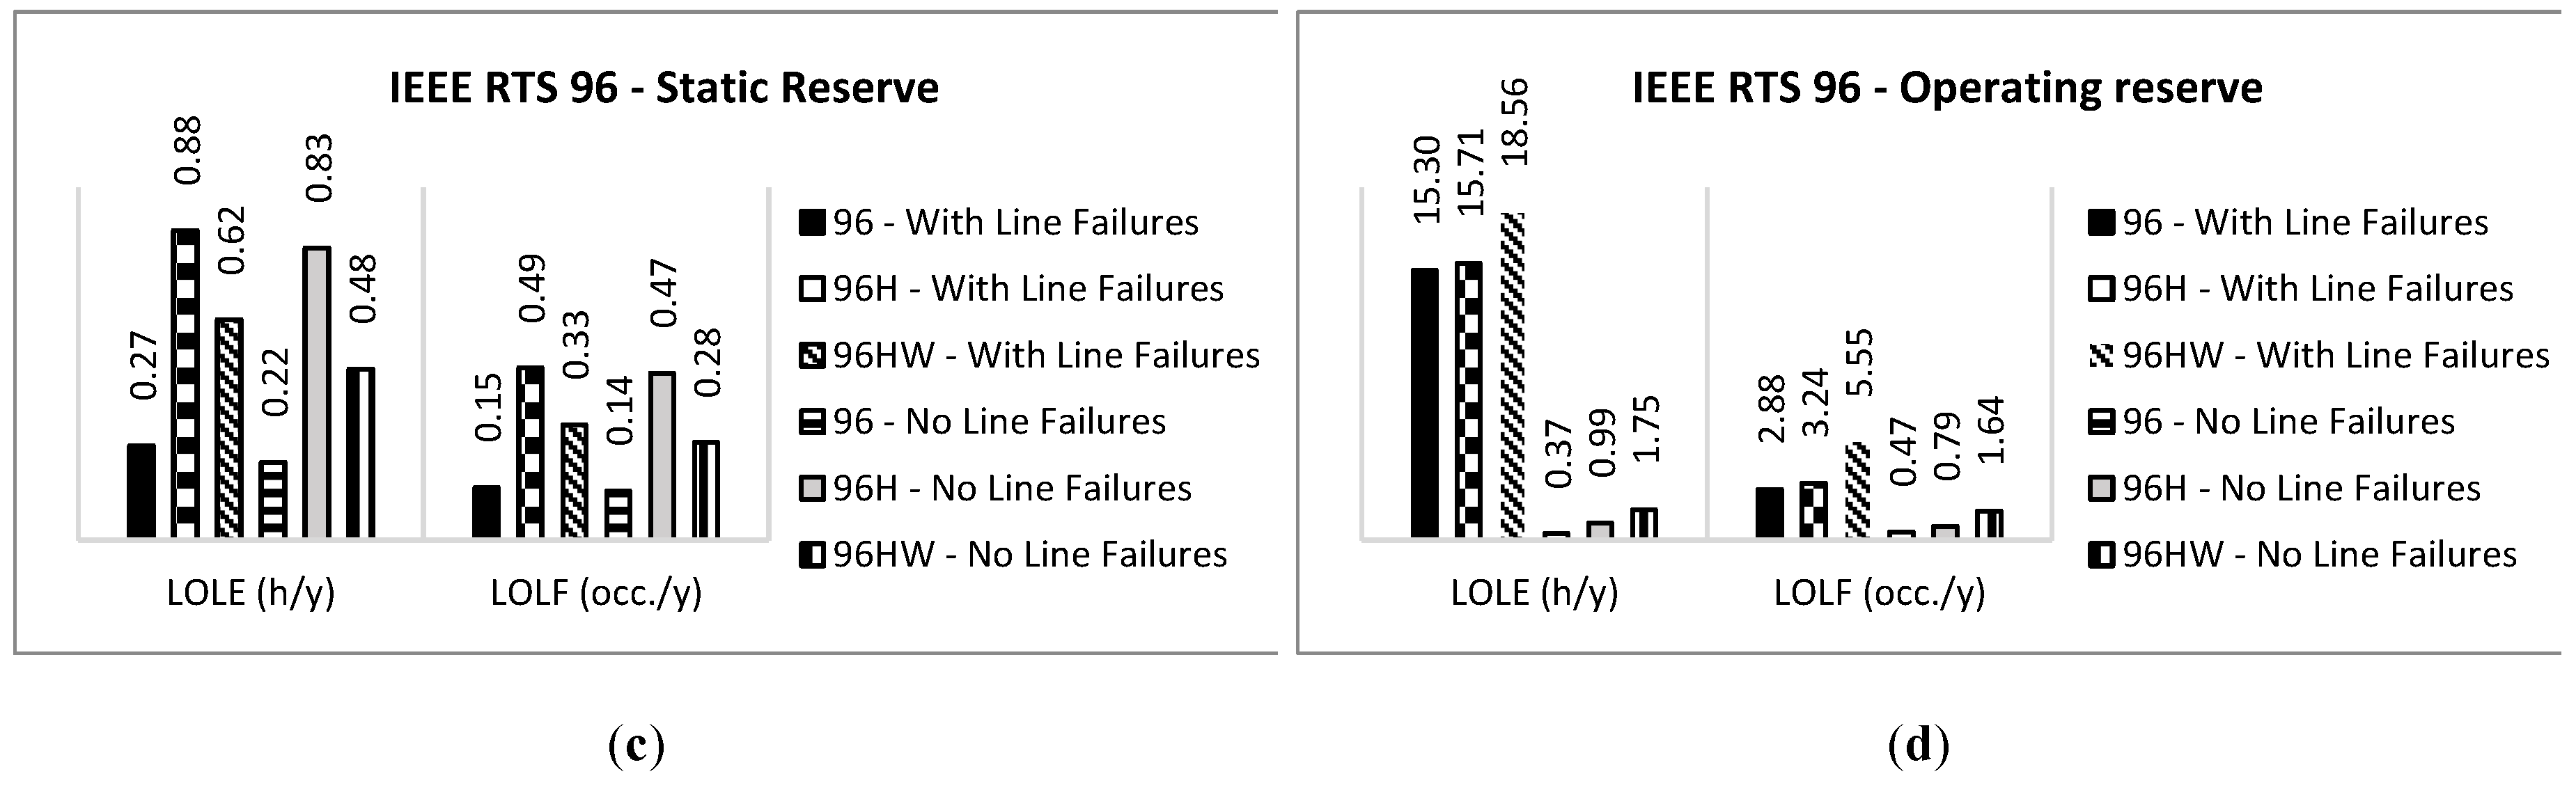
- Capacity of Power Transfer: in addition to the degree of the network, it is also important to measure the capacity of the transmission lines that connect a given bus to meet its load. This capacity is limited by the individual power transfer capacities of each line. For a given bus, the used index in this work represents the relationship between the sum of the capacities of the lines and the value of the peak load connected to that same bus:where is the capacity index of ; is the transmission capacity of the line departing from ; and is the value of the peak load connected to . To characterize the system, the average of the index values was considered for each bus:where is the transmission capacity index of the system and corresponds to the vector containing the individual values of each bus. The presented analysis was based on the IEEE RTS 79 test system previously introduced, considering the operating reserve assessment to promote spatial distribution of the available generation, by means of Sequential Monte Carlo Simulation with a coefficient of variation β = 5%. Thus, it is proceeded as follows: first, the LOLE, EPNS, and LOLF reliability indices were obtained for the system in a single-bus evaluation, whose results were adopted as a reference; second, the transmission network metrics previously described were calculated and the same reliability indices were determined considering the transmission network; third, variations in the transmission network were promoted and, for each variation, the metrics were calculated and the values of the same set of reliability indices were obtained. The variations applied to the transmission network consists of changes in the capacity limits of the transmission lines and the addition/removal of lines connecting buses; finally, the obtained results were compared with the reference case (single bus evaluation). The Table 1 presents the description and numeric results of each of the simulated cases.
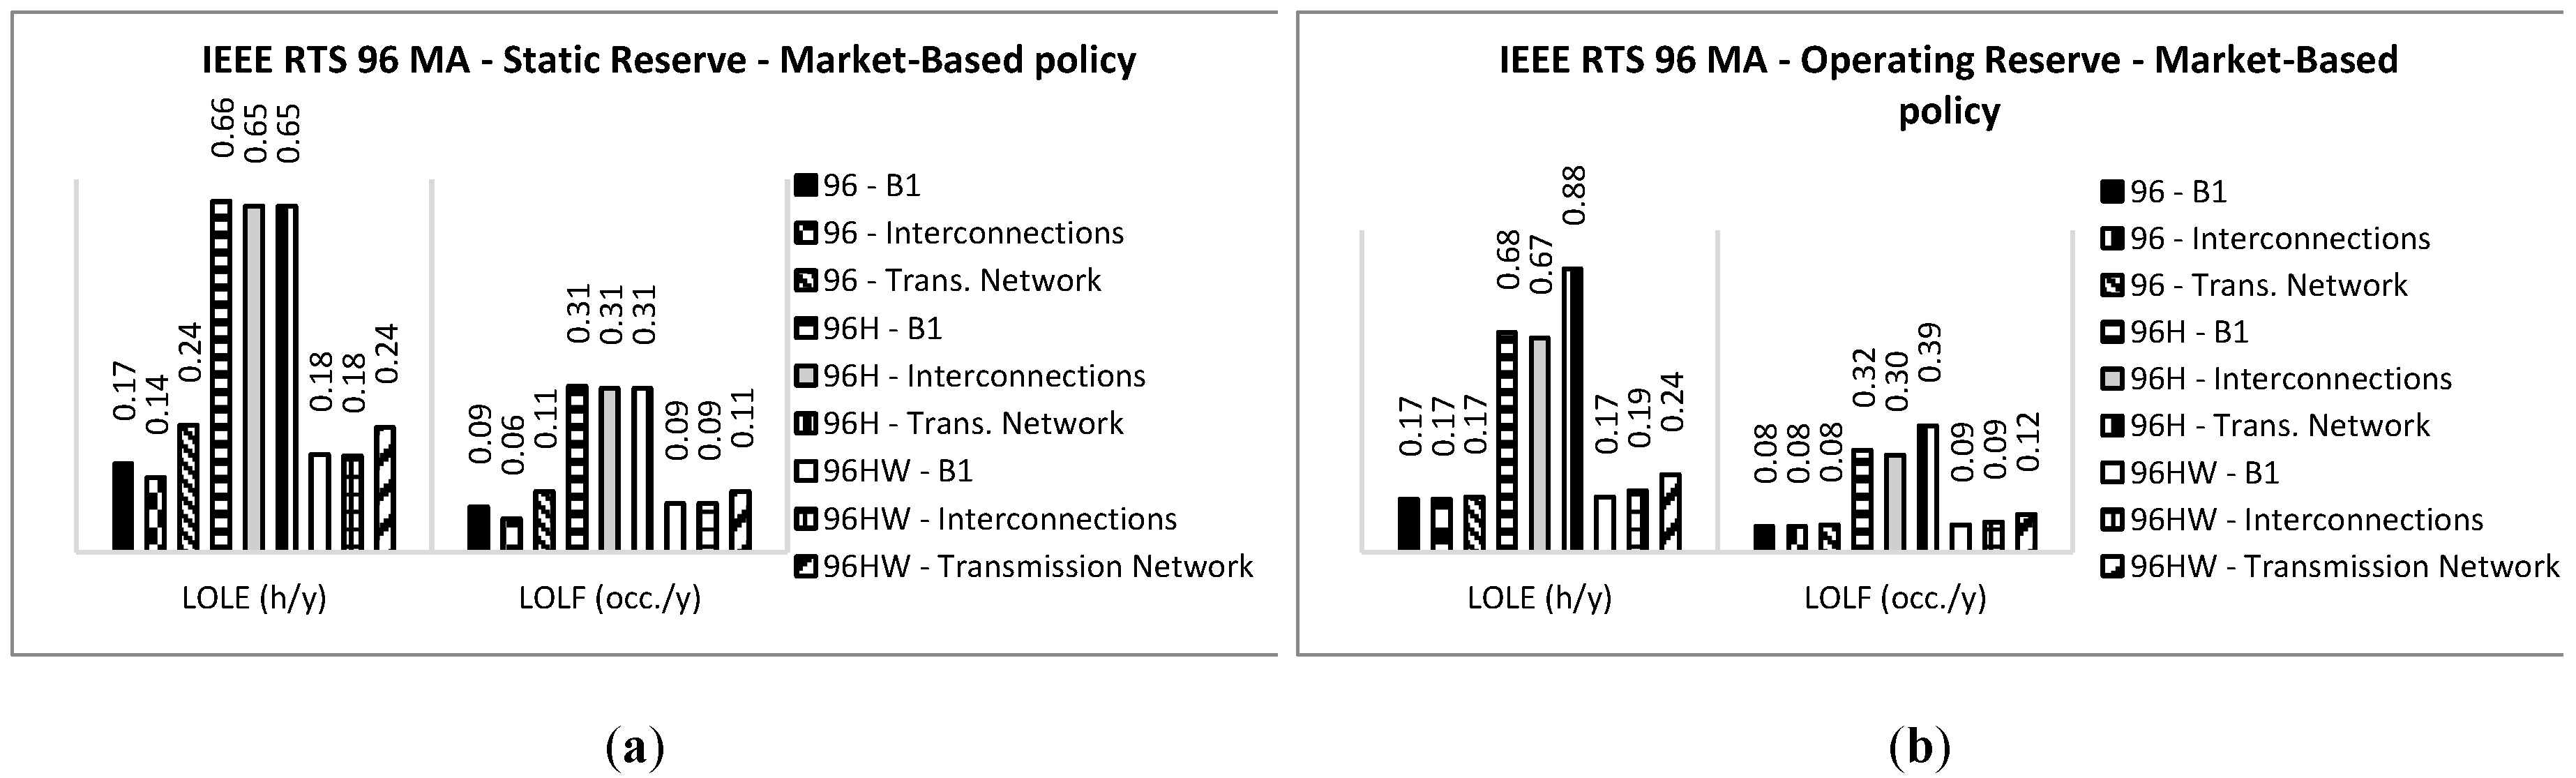
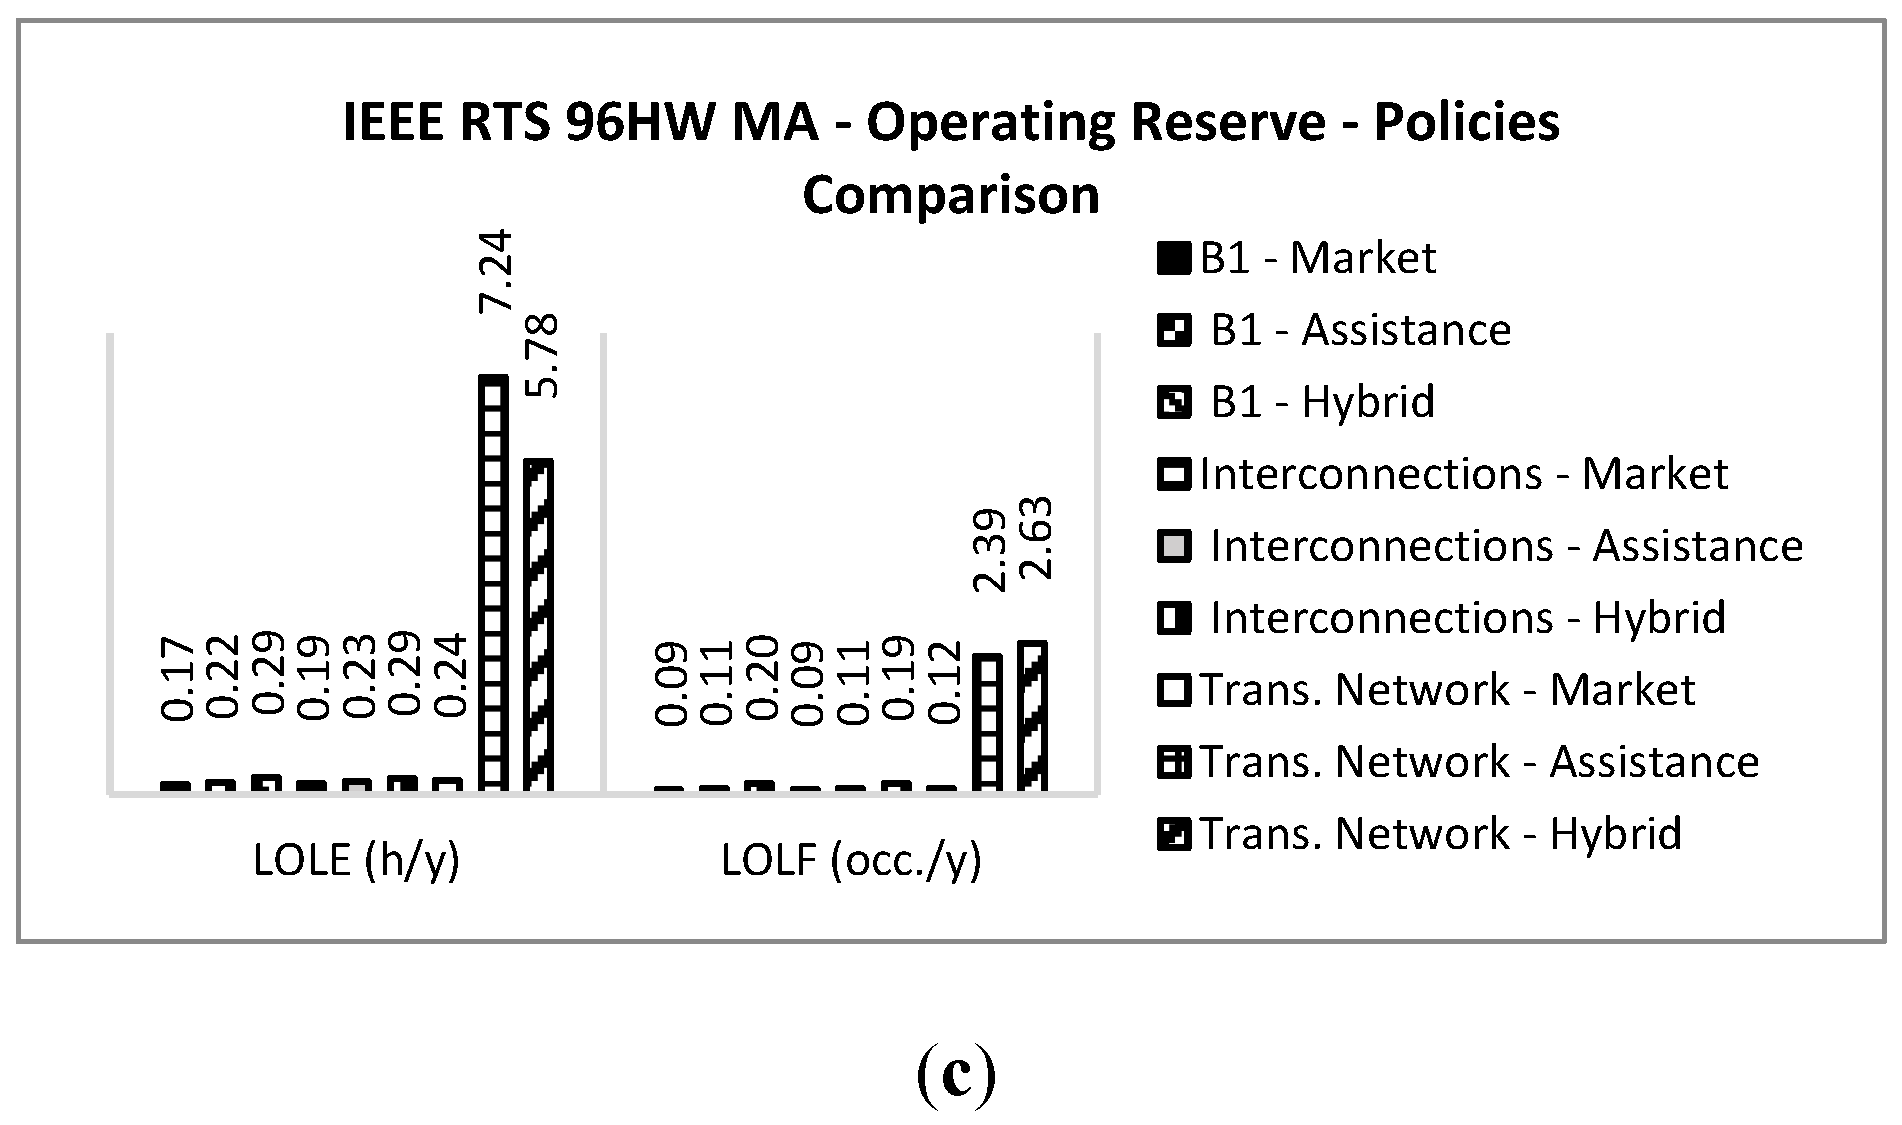
4.2. Risk Evaluation at Different System Representations
5. Concluding Remarks
Author Contributions
Acknowledgments
Conflicts of Interest
References
- Santos, F.S.; Bremermann, L.E.; Branco, T.M.; Issicaba, D.; Rosa, M. Impact Evaluation of Wind Power Geographic Dispersion on Future Operating Reserve Needs. Energies 2018, 11, 2863. [Google Scholar]
- AEMO. Inertia Requirements Methodology—Inertia Requirements & Shortfalls; Operational Analysis and Engineering, Australia, AEMO, 2018. Available online: https://www.aemo.com.au/-/media/Files/Electricity/NEM/Security_and_Reliability/System-Security-Market-Frameworks-Review/2018/Inertia_Requirements_Methodology_PUBLISHED.pdf (accessed on 9 December 2019).
- Riesz, J.; Gilmore, J.; MacGill, I. Frequency Control Ancillary Service Market Design—Insights from the Australian National Electricity Market. Electr. J. 2015, 28, 86–99. [Google Scholar] [CrossRef]
- Karnama, A.; Lopes, J.A.P.; Rosa, M. Impacts of Low-Carbon Fuel Standards in Transportation on the Electricity Market. Energies 2018, 11, 1943. [Google Scholar] [CrossRef] [Green Version]
- Milligan, M.; Donohoo, P.; Lew, D.; Ela, E.; Kirby, B.; Holttinen, H.; Lannoye, E.; Flynn, D.; O’Malley, M.; Miller, N.; et al. Operating reserves and wind power integration: An international comparison. Electric Power Systems Research. In Proceedings of the 9th Annual International Workshop on Large-Scale Integration of Wind Power into Power Systems as well as on Transmission Networks for Offshore Wind Power Plants Conference, Québec City, QC, Canada, 18–19 October 2010; Available online: https://digital.library.unt.edu/ark:/67531/metadc1012697/ (accessed on 16 January 2020).
- Ela, E.; Kirby, B.; Lannoye, E.; Milligan, M.; Flynn, D.; Zavadil, B.; O’Malley, M. Evolution of operating reserve determination in wind power integration studies. In Proceedings of the IEEE PES General Meeting, Providence, RI, USA, 25–29 July 2010; pp. 1–8. Available online: https://ieeexplore.ieee.org/document/5589272 (accessed on 25 January 2020).
- Botterud, A.; Wang, J.; Miranda, V.; Bessa, R.J. Wind Power Forecasting in U.S. Electricity Markets. Electr. J. 2010, 23, 71–82. [Google Scholar] [CrossRef]
- Matos, M.A.; Peças Lopes, J.A.; Rosa, M.A.; Ferreira, R.; Leite da Silva, A.M.; Sales, W.; Resende, L.; Manso, L.; Cabral, P.; Ferreira, M.; et al. Probabilistic evaluation of reserve requirements of generating systems with renewable power sources: The Portuguese and Spanish cases. Int. J. Electr. Power Energy Syst. 2009, 31, 562–569. [Google Scholar] [CrossRef] [Green Version]
- da Silva, A.M.L.L.; Sales, W.S.; da Fonseca Manso, L.A.; Billinton, R. Long-Term Probabilistic Evaluation of Operating Reserve Requirements With Renewable Sources. IEEE Trans. Power Syst. 2010, 25, 106–116. [Google Scholar] [CrossRef]
- Modarresi, M.S.; Xie, L. An operating reserve risk map for quantifiable reliability performances in renewable power systems. In Proceedings of the 2014 IEEE PES General Meeting|Conference & Exposition, National Harbor, MD, USA, 27–31 July 2014; pp. 1–5. [Google Scholar]
- Rosa, M.; Issicaba, D.; Lopes, J.P. Distribution systems performance evaluation considering islanded operation. In Proceedings of the 17th Power Systems Computation Conference, Stockholm, Sweden, 22–26 August 2011. [Google Scholar]
- Tόmasson, E.; Söder, L. Generation adequacy analysis of multi-area power systems with a high share of wind power. IEEE Trans. Power Syst. 2018, 33, 3854–3862. [Google Scholar] [CrossRef]
- Gonzalez-Fernandez, R.A.; da Silva, A.M.L. Reliability assessment of time-dependent systems via sequential cross-entropy Monte Carlo simulation. IEEE Trans. Power Syst. 2011, 26, 2381–2389. [Google Scholar] [CrossRef]
- Rubinstein, R.Y.; Kroese, D.P. Simulation and the Monte Carlo Method. Wiley’s Series in Probability and Statistics, 3th ed.; Wiley: Hoboken, NJ, USA, 2016; ISBN 978-1-118-63216-1. Available online: https://onlinelibrary.wiley.com/doi/book/10.1002/9781118631980 (accessed on 2 February 2020).
- Billinton, R.; Li, W. Reliability Assessment of Electric Power Systems Using Monte Carlo Methods; Plenum: New York, NY, USA, 1994. [Google Scholar]
- Yang, H.; Wang, L.; Zhang, Y.; Qi, X.; Wang, L.; Wu, H. Reliability Assessment of Wind Farm Electrical System Based on a Probability Transfer Technique. Energies 2018, 11, 744. [Google Scholar] [CrossRef] [Green Version]
- de Magalhaes Carvalho, L.; da Rosa, M.A.; da Silva, A.M.L.; Miranda, V. Probabilistic analysis for maximizing the grid integration of wind power generation. IEEE Trans. Power Syst. 2012, 27, 2323–2331. [Google Scholar] [CrossRef]
- Subcommittee, P.M. IEEE Reliability Test System. IEEE Trans. Power Appar. Syst. 1979, PAS-98, 2047–2054. [Google Scholar] [CrossRef]
- Carvalho, L.M.; Ferreira, R.J.; Rosa, M.; Miranda, V. A chronological composite system adequacy assessment considering non-dispathable renewable energy sources and their integration strategies. In Proceedings of the 17th Power Systems Computation Conference—PSCC, Stockholm, Sweden, 22–26 August 2011. [Google Scholar]
- Grigg, C.; Wong, P.; Albrecht, P.; Allan, R.; Bhavaraju, M.; Billinton, R.; Chen, Q.; Fong, C.; Haddad, S.; Kuruganty, S.; et al. The IEEE Reliability Test System-1996. A report prepared by the Reliability Test System Task Force of the Application of Probability Methods Subcommittee. IEEE Trans. Power Syst. 1999, 14, 1010–1020. [Google Scholar] [CrossRef]
- Pardalos, P.M.; Rebennack, S.; Pereira, M.V.; Iliadis, N.A.; Pappu, V. Handbook of Wind Power Systems; Springer: Berlin/Heidelberg, Germany, 2013; Available online: https://doi.org/10.1007/978-3-642-41080-2 (accessed on 3 February 2020).


| Case | Description | Degree Index | Capacity Index | LOLE (h/year) | EPNS (MW) | LOLF (occ./year) |
|---|---|---|---|---|---|---|
| Single-Bus | Reference case:Original system without the transmission network | - | - | 10.13 | 0.14 | 3.24 |
| A | Original system with the transmission network | 3.17 | 6.53 | 17.37 | 0.19 | 4.67 |
| B | 2 times the number of lines | 6.33 | 13.06 | 11.14 | 0.16 | 3.51 |
| C | 3 times the number of lines | 9.50 | 19.60 | 10.36 | 0.15 | 3.29 |
| D | 4 times the number of lines | 12.67 | 19.88 | 10.13 | 0.15 | 3.28 |
| E | 4 times the number of lines + Lines capacity divided by 2 | 12.67 | 9.94 | 10.37 | 0.15 | 3.32 |
| F | 4 times the number of lines + Lines capacity divided by 3 | 12.67 | 6.63 | 9.50 | 0.13 | 3.08 |
| G | 4 times the number of lines + Lines capacity divided by 4 | 12.67 | 4.97 | 11.31 | 0.16 | 3.50 |
| H | 3 times the number of lines + Lines capacity divided by 2 | 9.50 | 9.80 | 10.80 | 0.16 | 3.42 |
| I | 3 times the number of lines +Lines capacity divided by 2 | 9.50 | 6.53 | 11.49 | 0.16 | 3.61 |
| J | 3 times the number of lines +Lines capacity divided by 4 | 9.50 | 4.90 | 409.21 | 0.70 | 147.12 |
| K | 2 times the number of lines +Lines capacity divided by 2 | 6.33 | 6.53 | 13.85 | 0.18 | 4.21 |
| L | 2 times the number of lines +Lines capacity divided by 3 | 6.33 | 4.35 | 1,305.71 | 3.25 | 274.94 |
| M | 2 times the number of lines +Lines capacity divided by 4 | 6.33 | 3.27 | 4,910.60 | 21.57 | 526.25 |
| N | Lines capacity divided by 2 | 3.17 | 13.06 | 12.49 | 0.15 | 3.54 |
| O | Lines capacity divided by 3 | 3.17 | 19.60 | 13.33 | 0.18 | 3.68 |
| P | Removal of duplicated lines | 2.83 | 5.73 | 18.08 | 0.20 | 4.78 |
| Interconnection 4 | Interconnection 5 | |||
|---|---|---|---|---|
| Month | MW | q | MW | q |
| Jan | 113.296 | −0.601 | 121.417 | −0.572 |
| Feb | 106.974 | −0.591 | 116.080 | −0.591 |
| Mar | 101.170 | −0.389 | 108.055 | −0.409 |
| Apr | 85.801 | −0.253 | 89.956 | −0.241 |
| May | 108.021 | −0.537 | 122.712 | −0.541 |
| Jun | 115.482 | −0.567 | 126.745 | −0.575 |
| Jul | 95.677 | −0.464 | 110.944 | −0.483 |
| Aug | 88.176 | −0.313 | 95.749 | −0.310 |
| Sep | 88.438 | −0.306 | 98.088 | −0.329 |
| Oct | 94.433 | −0.372 | 106.849 | −0.408 |
| Nov | 103.248 | −0.522 | 122.693 | −0.532 |
| Dez | 106.239 | −0.391 | 111.765 | −0.373 |
© 2020 by the authors. Licensee MDPI, Basel, Switzerland. This article is an open access article distributed under the terms and conditions of the Creative Commons Attribution (CC BY) license (http://creativecommons.org/licenses/by/4.0/).
Share and Cite
Vieira, P.; Rosa, M.; Bremermann, L.; Pequeno, E.; Miranda, S. Long-term Static and Operational Reserves Assessment Considering Operating and Market Agreements Representation to Multi-Area Systems. Energies 2020, 13, 1455. https://doi.org/10.3390/en13061455
Vieira P, Rosa M, Bremermann L, Pequeno E, Miranda S. Long-term Static and Operational Reserves Assessment Considering Operating and Market Agreements Representation to Multi-Area Systems. Energies. 2020; 13(6):1455. https://doi.org/10.3390/en13061455
Chicago/Turabian StyleVieira, Pedro, Mauro Rosa, Leonardo Bremermann, Erika Pequeno, and Sandy Miranda. 2020. "Long-term Static and Operational Reserves Assessment Considering Operating and Market Agreements Representation to Multi-Area Systems" Energies 13, no. 6: 1455. https://doi.org/10.3390/en13061455